Article

Dual Transition of Net Zero Carbon and Digital Transformation: Case Study of UK Transportation Sector

by
Joel Manifold
1,2,
Suresh Renukappa
1,*,
Subashini Suresh
1,
Panagiotis Georgakis
1 and
Gamage Rashini Perera
1
1
Faculty of Science and Engineering, University of Wolverhampton, Wolverhampton WV1 1LY, UK
2
Tony Gee and Partners LLP, Birmingham B2 5BN, UK
*
Author to whom correspondence should be addressed.
Sustainability 2024, 16(17), 7852; https://doi.org/10.3390/su16177852
Submission received: 4 July 2024 / Revised: 5 September 2024 / Accepted: 6 September 2024 / Published: 9 September 2024
(This article belongs to the Section Sustainable Transportation)

Abstract

:
The UK Government’s Building Information Modelling (BIM) mandate has encouraged the utilisation of BIM within the Transportation Sector (TS), with research demonstrating positive effects of BIM. However, BIM processes are incipient to TS project implementation across the UK. This paper is carried out to understand the current BIM usage within the UK’s TS and how BIM practises and workflows contribute towards the government’s NZC approach. We used research questions derived from the population, intervention, comparison and outcome (PICO) system and inclusion and exclusion criteria to screen irrelevant information from a Systematic Literature review with 18 pieces of literature. We identified six key drivers: carbon reduction and BIM, BIM in transportation design, BIM uptake and usage in transportation, BIM in transportation construction and Digital Twins and BIM. It was identified that, with the integration of the Carbon Calculator Tool into Civil 3D, structural and material data can be obtained and areas of Embodied Carbon hotspots can be identified to contribute to reduce overall carbon across a project, which requires further collaboration between software providers and industry leaders for further streamlining the process. A limitation of this research is the requirement for wider study of differing disciplines within the TS, more qualitative research and a lack of information regarding other Carbon Calculator Tools and how compatible they are with Civil 3D.

1. Introduction

The Transportation Sector (TS) within the United Kingdom (UK) is a key economic, environmental and growth pillar of the nation. The predicted spend of Transport Infrastructure (TI) in the UK is said to have been over GBP 19 billion between 2020 and 2021 [1] and the National Infrastructure Commission [2] indicate that new infrastructure has a large positive impact on the economic growth of a nation when first delivered. In March 2016, the UK Government set out a National Infrastructure Delivery Plan (NIDP), a strategic plan for a future investment of over £100 billion to made on UK infrastructure by 2021, which will include key transport projects for rail, roads and airports according to the Infrastructure and Project Authority [3], an indication of the UK’s commitment to infrastructure currently and in future years. The National Infrastructure Committee [4] highlights a year-on-year increase in TI spending by the UK Government, with national roads in 2020/2021 seeing the highest investment since 2013 of GBP 3641 million, as highlighted in Figure 1. This could be interpreted to be a positive sign for the TS, with large-scale investments increasing.
The UK Climate Change Act 2008 (CCA) and the Publicly Available Specification (PAS) 2080 were introduced in the hope of improving carbon emissions across all sectors in the UK. However, there is doubt within the TI sector whether the policies will be able to meet ambitious future targets. With that being said, the TI sector needs to adopt new innovative technologies, methodologies and practise in order to meet the government and UN’s targets.
Despite the clear economic advantages of investing in TI projects, concerns regarding the carbon outputs from the whole life cycle of these projects need to be considered. HM Treasury [5] indicated the capital carbon produced from infrastructure projects was set to increase in 2025 to 2050, whereas operative carbon is set to decrease. This, combined with the predicted growth and expenditure on infrastructure projects, is a concerning sign. Further to this, in 2021, the UK government published a report outlining the TS as the largest contributor towards carbon emissions in the nation, producing 27% of the UK’s GHG emissions alone in 2019 based on operational usage [6]. The planning of TI projects and technological advances can help reduce such emissions and provide a more sustainable sector within the coming decades.
The modernisation of how TI is designed, constructed and utilised throughout the UK requires a different approach to traditional methods. Infrastructure empowers and enables people to connect across countries and encourages current and future economic growth in both developed and developing nations [7]. The utilisation of digital processes such as Building Information Modelling (BIM) could make the UK’ TS’s emissions output more efficient, particularly at the design stages. There are many ways in which BIM can be defined; the National Building Specification (NBS) say that ‘BIM is a process for creating and managing information on a construction project throughout its whole life cycle. As part of this process, a coordinated digital description of every aspect of the built asset is developed, using a set of appropriate technology’ [8].
Introducing the concept of BIM to the TS can allow the industry to contribute towards ‘The Net Zero Carbon’ (NZC) pledge. Developed Western countries, such as the UK, have further committed towards the NZC pledge by becoming the first major economy by law to commit to achieve NZC by 2050 through the Climate Change Act 2008, bettering their previous pledge of an 80% reduction in all Green House Gases (GHGs) from 1990 levels which is embedded within the Climate Change Act of 2008 [9]. NZC was an original commitment made by the UK Government through The Paris Climate Agreement (PCA), a legally binding international treaty aimed at preventing radical climate change. The purpose of the PCA is to reduce and limit global warming to below 1.5 degrees Celsius. As part of the PCA, individual nations such as the UK have undertaken a pledge to achieve NZC policy by the middle of the century (United Nations Climate Change 2021). Achieving NZC can be defined as a counterbalance of GHGs produced by humans by removing equal amounts GHGs from the atmosphere, also known as carbon removal.

2. Theoretical Background

The 2011–2015 UK Government Construction Strategy (GCS) proposed to mandate the use of BIM level 2 on all centrally procured government projects from 2016. This was further reiterated in the 2016–2020 GCS which emphasised the use of BIM by having a principal aim to ‘embed and increase the use of digital technology, including Building Information Modelling (BIM) Level 2’ [10], a process since described by Simon Rawlison, head of strategic research at Arcadis, as a seven out of ten for success to date. It was also found by the NBS that three quarters of the industry now use BIM on their projects [11]. The application of BIM on infrastructure projects has since increased, with the GCS [12] (as cited in Dodge Data & Analytics [13]) highlighting that within the UK, BIM usage on Transport Infrastructure projects increased from 21% in 2015 to 69% in 2017.
Globally, all nations have a moral responsibility to reduce their GHG emissions to achieve the PCA recommendation of reducing global warming to 1.5 °C. The main contributors towards GHGs are the European Union, the United States of America, and China, who between them produce 46% of total GHGs [14]. Following the GCS 2016–2021, the policy paper ‘Transforming Infrastructure Performance: Roadmap to 2030’ was produced by the UK Government, a document with focus on the requirement for the UK to meet the NZC pledge made at the Paris Climate Accord (PCA). The report identifies the requirement for BIM practises via UK BIM Framework and Digital Twin (DT) models and encourages the use of BIM through the UK BIM Framework (UKBIMF) and Digital Twins (DTs) through the Gemini Principles ‘to make better, outcome focussed decisions about how to optimise our infrastructure across the system’ which in turn encourages a more sustainable TS [3].
The growing concept of DT can be described as ‘a realistic digital representation of assets, processes or systems in the built or natural environment’ [15]. These are formed by generating a digital model of a physical asset, which with further information derived from the Internet of Things (IOT) and real-time information from sensory data can enable a powerful, real-time model to assess and monitor transport-related infrastructure. According to Marr [16], a DT can utilise a virtual model and apply smart components to collect live, real-time information, which is analysed and contributes towards efficient decision making, a further opportunity to contribute to NZC.
The climate change crisis is seen to be one of the major threats to mankind and its existence; extreme weather conditions, increased natural disasters and scarce water supplies are some of the detrimental outcomes of maintaining and increasing high levels of GHGs. Shahbaz et al. [17] identified how current research and development around environmentally friendly practises are the most important way to set new policies for the UK to enable NZC by 2050 and increasing innovation expenditure as part of new policies would increase environmental health.

3. Research Methodology

A Systematic Literature Review (SLR) was used for this literature review. SLRs are known as ‘a method of making sense of large studies of information’, helping to understand areas of uncertainty within a chosen subject and establishing gaps in research areas [18].
The application of SLRs in engineering-based education is growing and becoming more popular due to its structured approach to review select criteria-based information [19,20].

3.1. Systematic Review Steps

The following steps were taken when producing this SLR:
  • Produce a research question.
  • Create inclusion and exclusion criteria.
  • Identify key terms.
  • Produce a qualitative analysis of the literature with the specified criteria.
  • Outline the findings of the literature review and relate them back to the research question.

3.2. Research Question

A research question is in essence the driving force behind every literature review, with all studies, reviews and methodology information based around the research question. To help support this process, the population, intervention, control and outcomes (PICOs) approach was used to ensure that a well scoped research question was developed, which allows for an evidence-based answer to be framed to enable a directly relevant answer to be applied [21]. Table 1 outlines the typical PICO process [19]. Table 2 highlights the applied PICO approach to this research.

3.3. Reliability of Inclusion and Exclusion Data

The research question above was derived using the PICO framework as per Table 2.

3.4. General Analysis of Key Words

To ensure a timely and efficient review of appropriate literature, systematic inclusion and exclusion criteria were produced. The inclusion criteria are the identification of ‘key features’ of the target documentation appropriate to the research question, whereas exclusion criteria are documentation that meets the criteria for the research question but offers ‘additional characteristics’ that may interfere with the success of the study [22]. Table 3 identifies the inclusion and exclusion criteria that have been set out for this literature review.
To further refine the literature search criteria, the following key words were used when searching for literature regarding the research question: ‘How 3D Building Information Modelling in Transportation Engineering can contribute towards the United Kingdom’s pledge to Net Zero Carbon’.

3.5. The Search Timeframe

Table 4 provides a search timeframe used for this literature review.

3.6. Data Extraction

To establish a rounded understanding of the current literature, the following documents were reviewed and elaborated to conclude the research question (see Table 5).

4. Literature Review

4.1. Carbon Reduction and BIM

Giesekam Jannik [41] highlighted that between 2010 and 2018, capital carbon (CC) within the infrastructure sector has increased by approximately 60%, in contrast to operative carbon (OC) and User Carbon (UC) outputs, which have declined within the same timeframe. The Net Zero Infrastructure Industry Coalition (NZIDC) [42] also identified CC as being ‘largely ignored’ within infrastructure, a concerning statement given that approximately two-fifths of the total carbon emissions of a 60-year project life cycle are derived from CC. The NZIDC report also suggests reviewing the whole life cycle of carbon outputs and encourages the identification of accurate ‘carbon hotspots’ to enable a more proactive approach to CC reductions. The report also suggests that ‘This may mean that we collaborate earlier, and design is supported by other organisations through tendering work prior to planning applications’, which is a method to help reduce the carbon footprint of infrastructure projects.
Ramboll [43] suggests that there are two types of carbon outputs in relation to TI: Embodied Carbon (also known as CC) and OC. The report identifies how Life Cycle Assessments (LCAs) are the most effective way to reduce the Embodied Carbon and costs of a TI project, supporting the comments made within the NZIDC. Applying LCA enables designers to identify carbon hotspots such as material choice, construction site logistics and actual construction methodology. Specifically focussing on tunnels, rail and bridges, the report demonstrates that logistics technology for construction projects and materials contribute to 3%, 17% and 70% of the total Embodied Carbon, respectively.
The Transport for Quality Of Life [44] research also identifies current levels of Embodied Carbon within transport projects as being too high in relation to other types of carbon, highlighting the drawbacks of the UK Government’s second Road Investment Strategy (RIS2), reported to be the largest investment in SRN ever within the UK, suggesting that an increase in the capacity of vehicles on the SRN and increasing speeds will not only produce more operational carbon but also increase Embodied Carbon such as land removal (trees and natural resources), material extraction and energy consumption used for constructing new infrastructure. The report identifies that approximately 31–91% of GHGs from road construction schemes derive from Embodied Carbon. In sum, the report implies that the commitments made by the UK Governments to achieve NZC, in accordance with the PCA, will be very challenging to achieve given the expansive investments proposed when incorporating current construction and operational practises on the SRN.
The ICE State of the Nation 2020: Infrastructure and the 2050 net target zero report further suggests collaboration with supply chains and stakeholders throughout a project to improve carbon footprints, as well as how ‘smart infrastructure’ such as BIM is a key method to produce low-carbon products and solutions within infrastructure. Again, like NZIDC [42] and Ramboll [43], the report also highlights that the application of a whole life cycle approach to an asset will increase efficiency and longevity as well as reduce waste.

4.2. BIM in Transportation Design

Utilising BIM at the design stage of TS projects has been investigated to identify efficiencies within a project. Blanco and Chen [23] studied the implementation of BIM in the UK’s TS through a positivistic methodology via online questionnaires directed to a range of professionals working for British-based transportation consultancies. Responses from participants identified that the uptake in BIM on transport projects was still within its infancy stage and still faced major challenges within the industry due to the cultural shift from traditional working methods such as 2D Computer Aided Design (CAD). However, participants also stated that collaboration and coordination allowed the project design to be more efficient and therefore lead to less waste, and BIM can also help as ‘The reduction of the time of the project is directly related to the cost of the project and the diminishment of carbon emissions’. These findings correlate with the NZIDC report’s suggestion of early collaboration as a key metric to help reduce CC in infrastructure projects.
Despite the positive findings by Blanco and Chen [23], the validity of their results must be questioned. With only 15 participants involved, the results may not represent the wider AEC industry. Low participation rates within the study question the validity of the results and their applicability across the TS. In addition to this, 73% of participants within this study worked for large companies with over 500 employees. The UK BIM Alliance [45] study of over 1170 participants established a trend of the larger the company, the more aware employees are of BIM and more usage occurs. This suggests that Blanco and Chen [23] may not have enough coverage of Small to Medium Enterprises (SMEs) to gain a wider understanding of BIM usage and applications. In addition to this, the UK BIM Alliance [45] survey suggests that only 2% of participants believe sustainability improvements are the main benefits of BIM, offering an alternative suggestion to that of Blanco and Chen [23]. Finally, the date of Blanco and Chen’s study was 2013–2014 and the 2016 UK BIM Mandate was not implemented at this time, arguably preventing a more recent reflection of BIM usage.
Omoregie and Turnbull [24] conducted a similar study to Blanco and Chen [23] by comparing the use of BIM on highway infrastructure projects against traditional project design methods through a case study of the A1 Leeming-to-Barton (A1L2B) infrastructure improvement scheme. Respondents clearly identified that the use of 3D modelling as part of the BIM process would ‘result in more sustainable design by identifying issues before construction’ and that ‘there is an improvement in environmental and sustainability design using BIM’. Emphasis was also made on how BIM contributes towards a more collaborative way of working by bringing multiple disciplines together, allowing different industries to work together. Again, this can be related to the NZIDC reports regarding the necessity of collaborative working to produce a more carbon-efficient design, a process that BIM can encourage. Similarly to Blanco and Chen [23], the participation rate of this study was relatively low; only 80 respondents were part of this study and therefore the conclusions cannot be associated with the wider TS. Notably, in both UK-based studies, the respondents offered mostly qualitative information; no quantitative findings or comparisons were demonstrated throughout their findings.
Zhao et al. [27] conducted a study of a DuAn highway-based project in Guizhou, China, utilising BIM to identify the optimum design both sustainably and economically. The study proposed an algorithm-based approach to review key parameters for three separate options, including criteria such as total cost, earthwork production and impact of forestation. The study concluded that the use of BIM-related design processes enabled a more efficient design and helped identify an optimal sustainable design, providing a set of comparable results which allowed designers to assess and identify the best design. Sanchez et at. [25] also identify using the whole life cycle of a project to achieve sustainability targets, as well as improving overall project productivity through interoperability.
D’Amico et al. [28] further endorse the use of BIM during design stages to achieve a better carbon footprint on TI schemes, and their study reviews the use of both BIM and Geographical Information Systems (GISs) in airport infrastructure whilst adhering to Italian-based legislation. Whilst confirming the success of applying BIM in accordance with the most recent legislation, the report identifies how BIM data enabled designers to accurately calculate the cut and fill volumes of a proposed taxi rank within a project, which in turn allowed a better understanding of new material required to construct it and therefore reduce the need for any unnecessary material wastage, contributing towards a better whole life cycle and carbon footprint.
A case study conducted by Chong et al. [31] made comparisons of BIM applications on two highway infrastructure projects in China and Australia, in comparison to traditional methods such as 2D paper-based designs. The study identifies the great success that BIM had on both projects at the design and construction phases of the projects, with particular emphasis on coordination across design teams which enabled a more collaborative working environment, which contributed towards the speed of construction, creating greater efficiencies across both projects. However, the paper also suggests that the adoption of BIM in infrastructure is slow. This was the first project where BIM had been implemented by both project’s lead stakeholders (designers and contractors), demonstrating the low uptake of BIM. This is also supported by Shou et al. [32], whose qualitative study comparing the implementation of BIM in building and infrastructure projects identified that the infrastructure sector lags behind the building sector regarding BIM applications, but they do suggest that there is evidence for sufficient growth.

4.3. BIM Uptake and Usage in Transportation

Liu et al.’s [26] study into sustainability and BIM outlines the progress of European countries with their individual government policies towards BIM and sustainability, again highlighting a general movement towards whole life cycle Transport Infrastructure as a method to improve sustainability in transportation projects, particularly within the UK. The study also concludes that government intervention is a key method of encouraging and standardising sustainability using BIM.
In addition to this, the National Building Specification [46] further supports Liu et al. [26]. Their widespread survey identified that a key factor behind the lack of implementation of BIM was predominantly due to client demand, a by-product of legislation. The NBS study also highlights key statistics regarding the usage of BIM, indicating that BIM awareness and uptake in 2020 compared to 2011 has risen from 13% to 73%, respectively, in the UK. The survey demonstrated the uptake amongst smaller practises (15+ employees) lags behind larger practises (50+ employees), primarily due to suggested initial costs. This is also supported by Ayinla and Adamu [47], whose study indicated that SMEs and micro firms again fall behind large firms when utilising and implementing BIM practises. Further to this, Vidalakis et al.’s [48] research of SMEs and their use of BIM highlights that the main reason for low uptake is due to the high costs required to implement BIM and associated software, as well as a lack of in-house skills, with further guidance and understanding of how to adopt BIM being a crucial barrier for uptake.
Research by Matejka [40] suggests that the uptake of BIM in TI projects is low in relation to other sectors such as the building sector. Highlighting that BIM is more than just a 3D model, their study suggests that wider BIM use for products such as Information Project Delivery systems will enable better collaboration and therefore offer better project outcomes. Matejka also suggests that when BIM is applied to TI projects it has a positive effect of the efficiency of the project. Lee and Borrmann [49] suggest that policy and legislation in leading countries in terms of technology such as the UK, Singapore and Australia have undoubtably contributed towards the increasing uptake and usage of BIM. However, they suggest that further studies are required to identify the true effects of said legislation and highlight the need for the industry to take lead and further the usage of BIM alongside legislation to aid adoption.

4.4. BIM in Transportation Construction

The use of BIM in TI projects is apparent in many forms, and maximising use of BIM processes and software aspects can provide great benefits in both design and construction. Whitlock et al. [29] discuss the use of BIM in transport construction projects and establish unique ways of utilising BIM to understand construction material logistics. Their study identified the use of BIM to establish material quantities and storage locations of materials on site, and the findings highlighted how using BIM can provide an effective Logistic Management Strategy to reduce waste. However, the study also indicated several drawbacks of implementing such software by suggesting that more policy is required around the training requirements for BIM software users on site to ensure maximum efficiency. In relation to the Net Zero Infrastructure Industry Coalition [42], this study supports the supplier/contractor engagement theory to help deliver ‘incremental and transformational reductions’ to achieve lower emissions.
Large-scale contractors such as Skanska are also beginning to target the use of BIM. The Skanska Net Zero Carbon 2045 report in 2017 highlighted the emissions produced across different supply chains and through their construction methods, ultimately identifying BIM as a key metric to reduce said emissions by stating that they aimed to ‘optimise the environmental performance and life-cycle cost of their projects’. The report highlights a focus on reducing carbon using BIM processes, an example of which is the River Humber Tunnel project, where BIM processes were utilised alongside the use of emissions data to identify areas of high carbon, which in turn helped reduce the project’s carbon footprint by 11%.
Kivimäki and Heikkilä [39] conducted a study of the application of BIM in the construction phase of two projects based in Finland. The purpose of the study was to identify whether BIM could contribute towards the overall quality control during the construction phase of the project. By utilising BIM processes and BIM-based 3D models, the contractors were able to feedback information from the site to design teams during construction, including live cross sections, earthwork slopes and underground utility data, which would be compared to original designs and allowed designers to update BIM models accordingly with further analysis to identify potential issues and accurately understand material usage in situ. Despite no direct identification of BIM reducing the carbon footprint, it was noted how the live updates from contractors to designers enabled better collaboration. Allowing designers to have real-time information can allow for better decision making with regard to construction practises, such as cut and fill volumes, and design adaptations to suit a more carbon-friendly design.

4.5. Digital Twins and BIM

As well as capital carbon, operative and maintenance carbon phases can be improved using Digital Twins (DTs). Ivanov et al. [35] discuss how DTs in smart cities allow for real-time updates of urban environment details, which can lead to a better understanding of infrastructure requirements to improve the efficiency of transport systems. Specifically, they highlight a case study in Takamatsu city, Japan, where a DT analysis identified bespoke locations where cycling infrastructure would be most useful to tourists in certain areas of the city, therefore allowing transport planners to plan and design suitable routes in accordance with demand.
Shahat et al. [33] discuss the use of DTs within cities using BIM-related models to improve the whole life cycle sustainability of infrastructure. Identifying that DTs are still within their infancy stage, practical examples such as the Zurich DT demonstrate the integration of BIM-based DTs which, alongside sensory detectors and IOT processes, can enable transport planners to assess areas of congestion and predict potential optimum routes and therefore reflect this within future planning.
By implementing advanced processes such as DTs, Schooling et al. [30] discuss how infrastructure should be identified as a ‘system of systems’, suggesting that DTs and overall digitalisation of infrastructure can offer an opportunity to review ‘life cycle’ approaches to assets which will benefit society not only through improved connectivity but environmentally as well. The paper discusses how utilising BIM is a key foundation to digitalising infrastructure by managing information and further elaborates on how DTs can lead to better decision making and therefore enable ‘addressing systemic challenges and addressing resource use and efficiency’.
This is further supported by Jiang et al. [36] who establish that BIM and DTs, along with other processes such as Cyber Physical Systems, can be interlinked to form holistic DTs and enable ‘smart construction’, a process to help digitalise the construction sector which in turn can lead to better and more sustainable decision making. An Institute of Engineering and Technology [37] study also highlights how DTs can help achieve sustainability goals set by the United Nations and help identify where BIM involvement at specific maturity levels of a DT will provide further sustainable practises. In addition to this, a case study of the Taipei Metro, Taiwan, with BIM embedded within the DT suggests that BIM has a ‘strong case for use’ within a DT, where the project had a reduction in energy consumption and carbon footprint. Notably, the study concluded that BIM played a vital role to improve the ‘design, construction, operation, maintenance and decommissioning phases’, the whole life cycle of the asset, which enabled the DTs to better understand material deterioration.
Sakdirat and Xu Ningfang’s [38] sustainable evaluation of Kings Cross Railway found that the use of BIM to create a DT was effective and BIM as a standalone process can optimise construction processes as well as logistics to help reduce carbon footprints. However, the study suggests that applying the method used may prove difficult for other railway stations due to a lack of existing data, and therefore more information should be collated prior to conducting a DT, citing sensory data as a route to obtain such data. Broo and Schooling [50] set out to review the sustainability of infrastructure through design, construction, operation and maintenance phases using DTs. The study included a series of interviews with eight infrastructure professionals where it was established that the use of DTs can ‘build better’ and more ‘sustainably’. However, the integration of DTs is currently slow due to a lack of cultural shift within the industry. Despite this, further research of DTs by Wang et al. [34] used for highway transportation design suggest that the use of BIM can be bypassed and supports the use of GISs combined with a DT to allow for more optimal designs and therefore offer sustainable design solutions without using BIM.
The above Systematic Literature Review helped in analysing the existing knowledge gaps and supports the arguments of the empirical data findings.

5. Results

5.1. Design Criteria

A total of four highway design scenarios were produced using Civil 3D 2023. The hypothetical designs used for this research were produced using the DMRB. Table 6 outlines the scenarios used for this research:

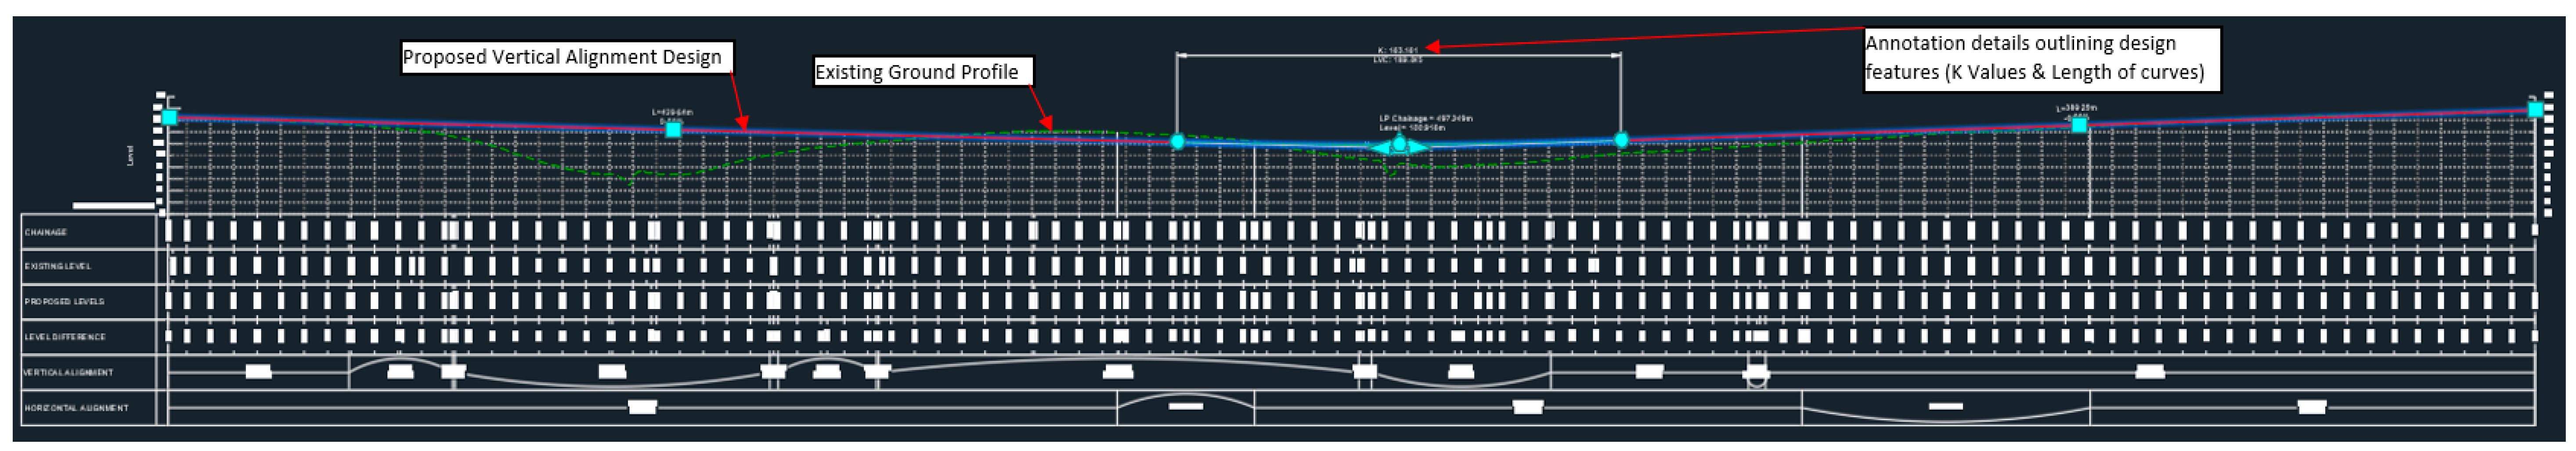
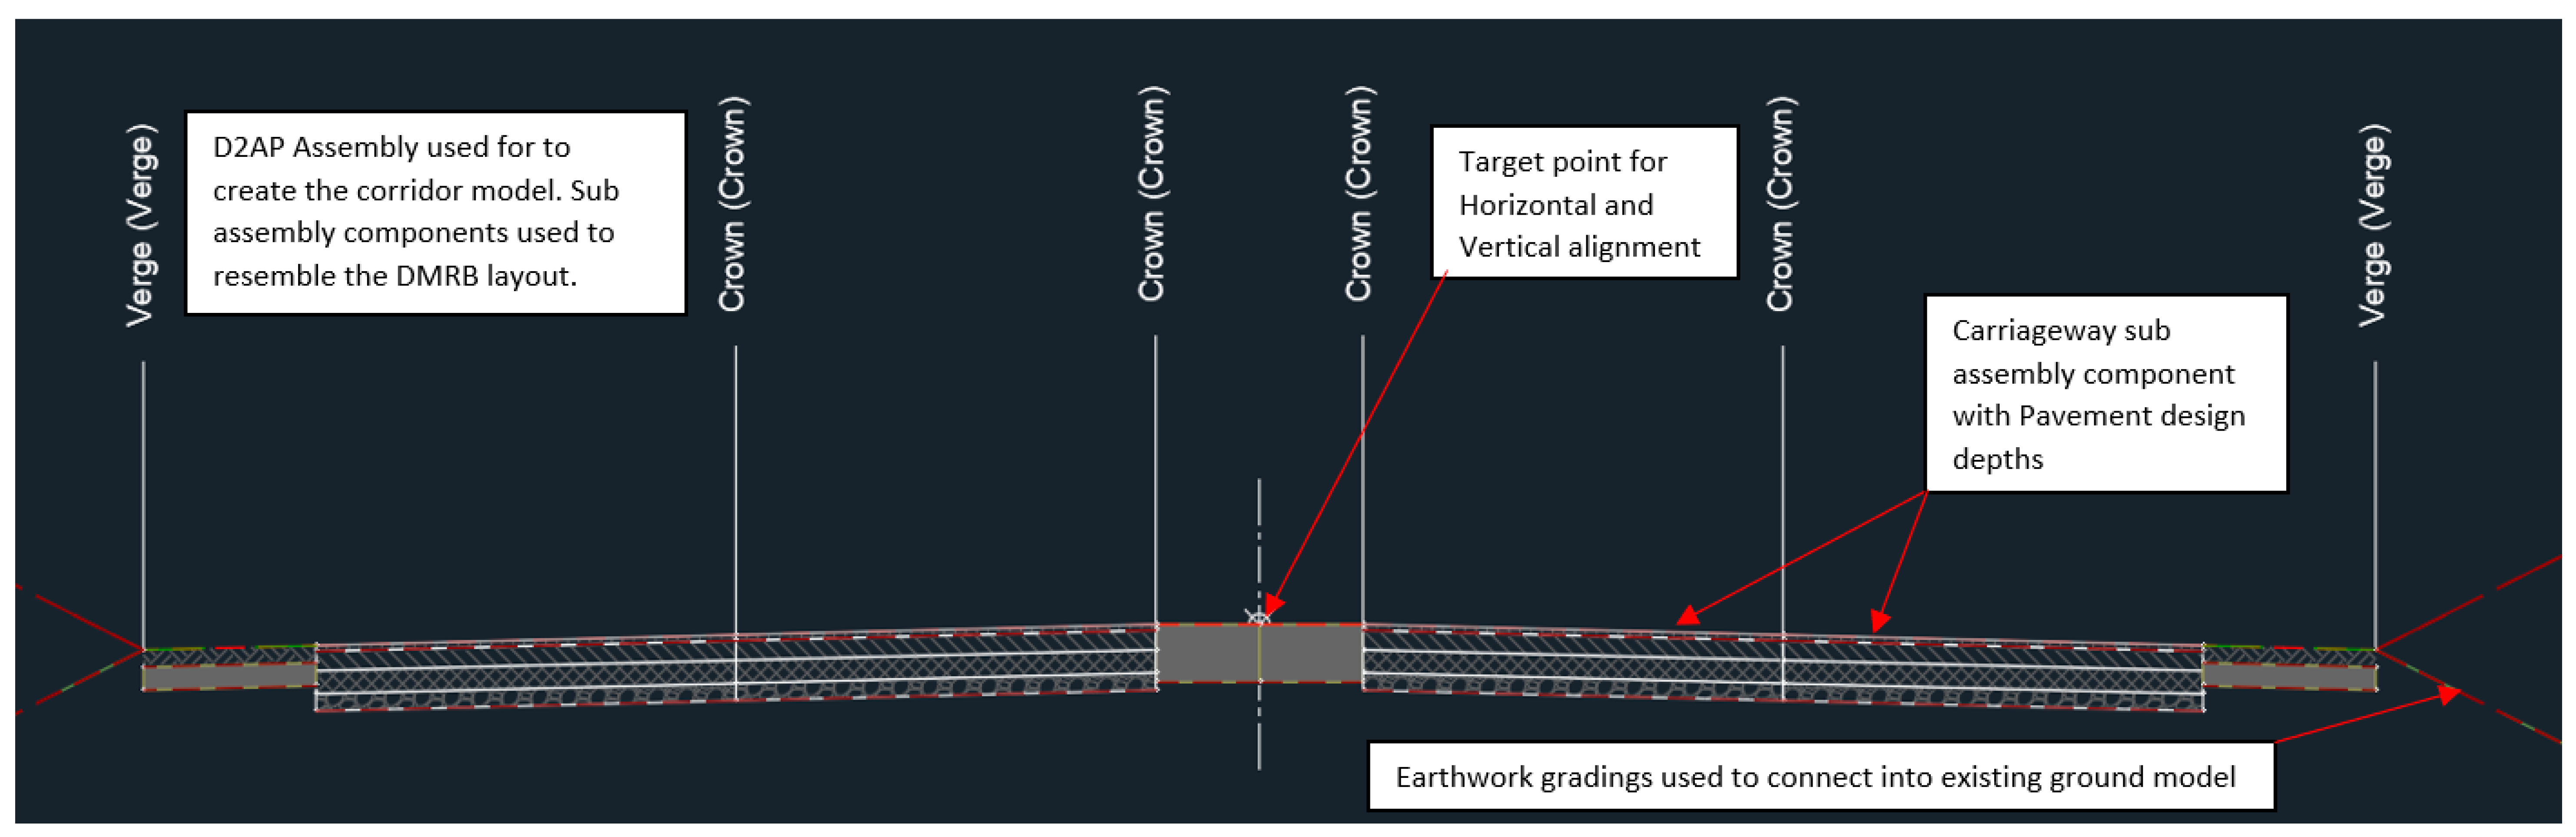
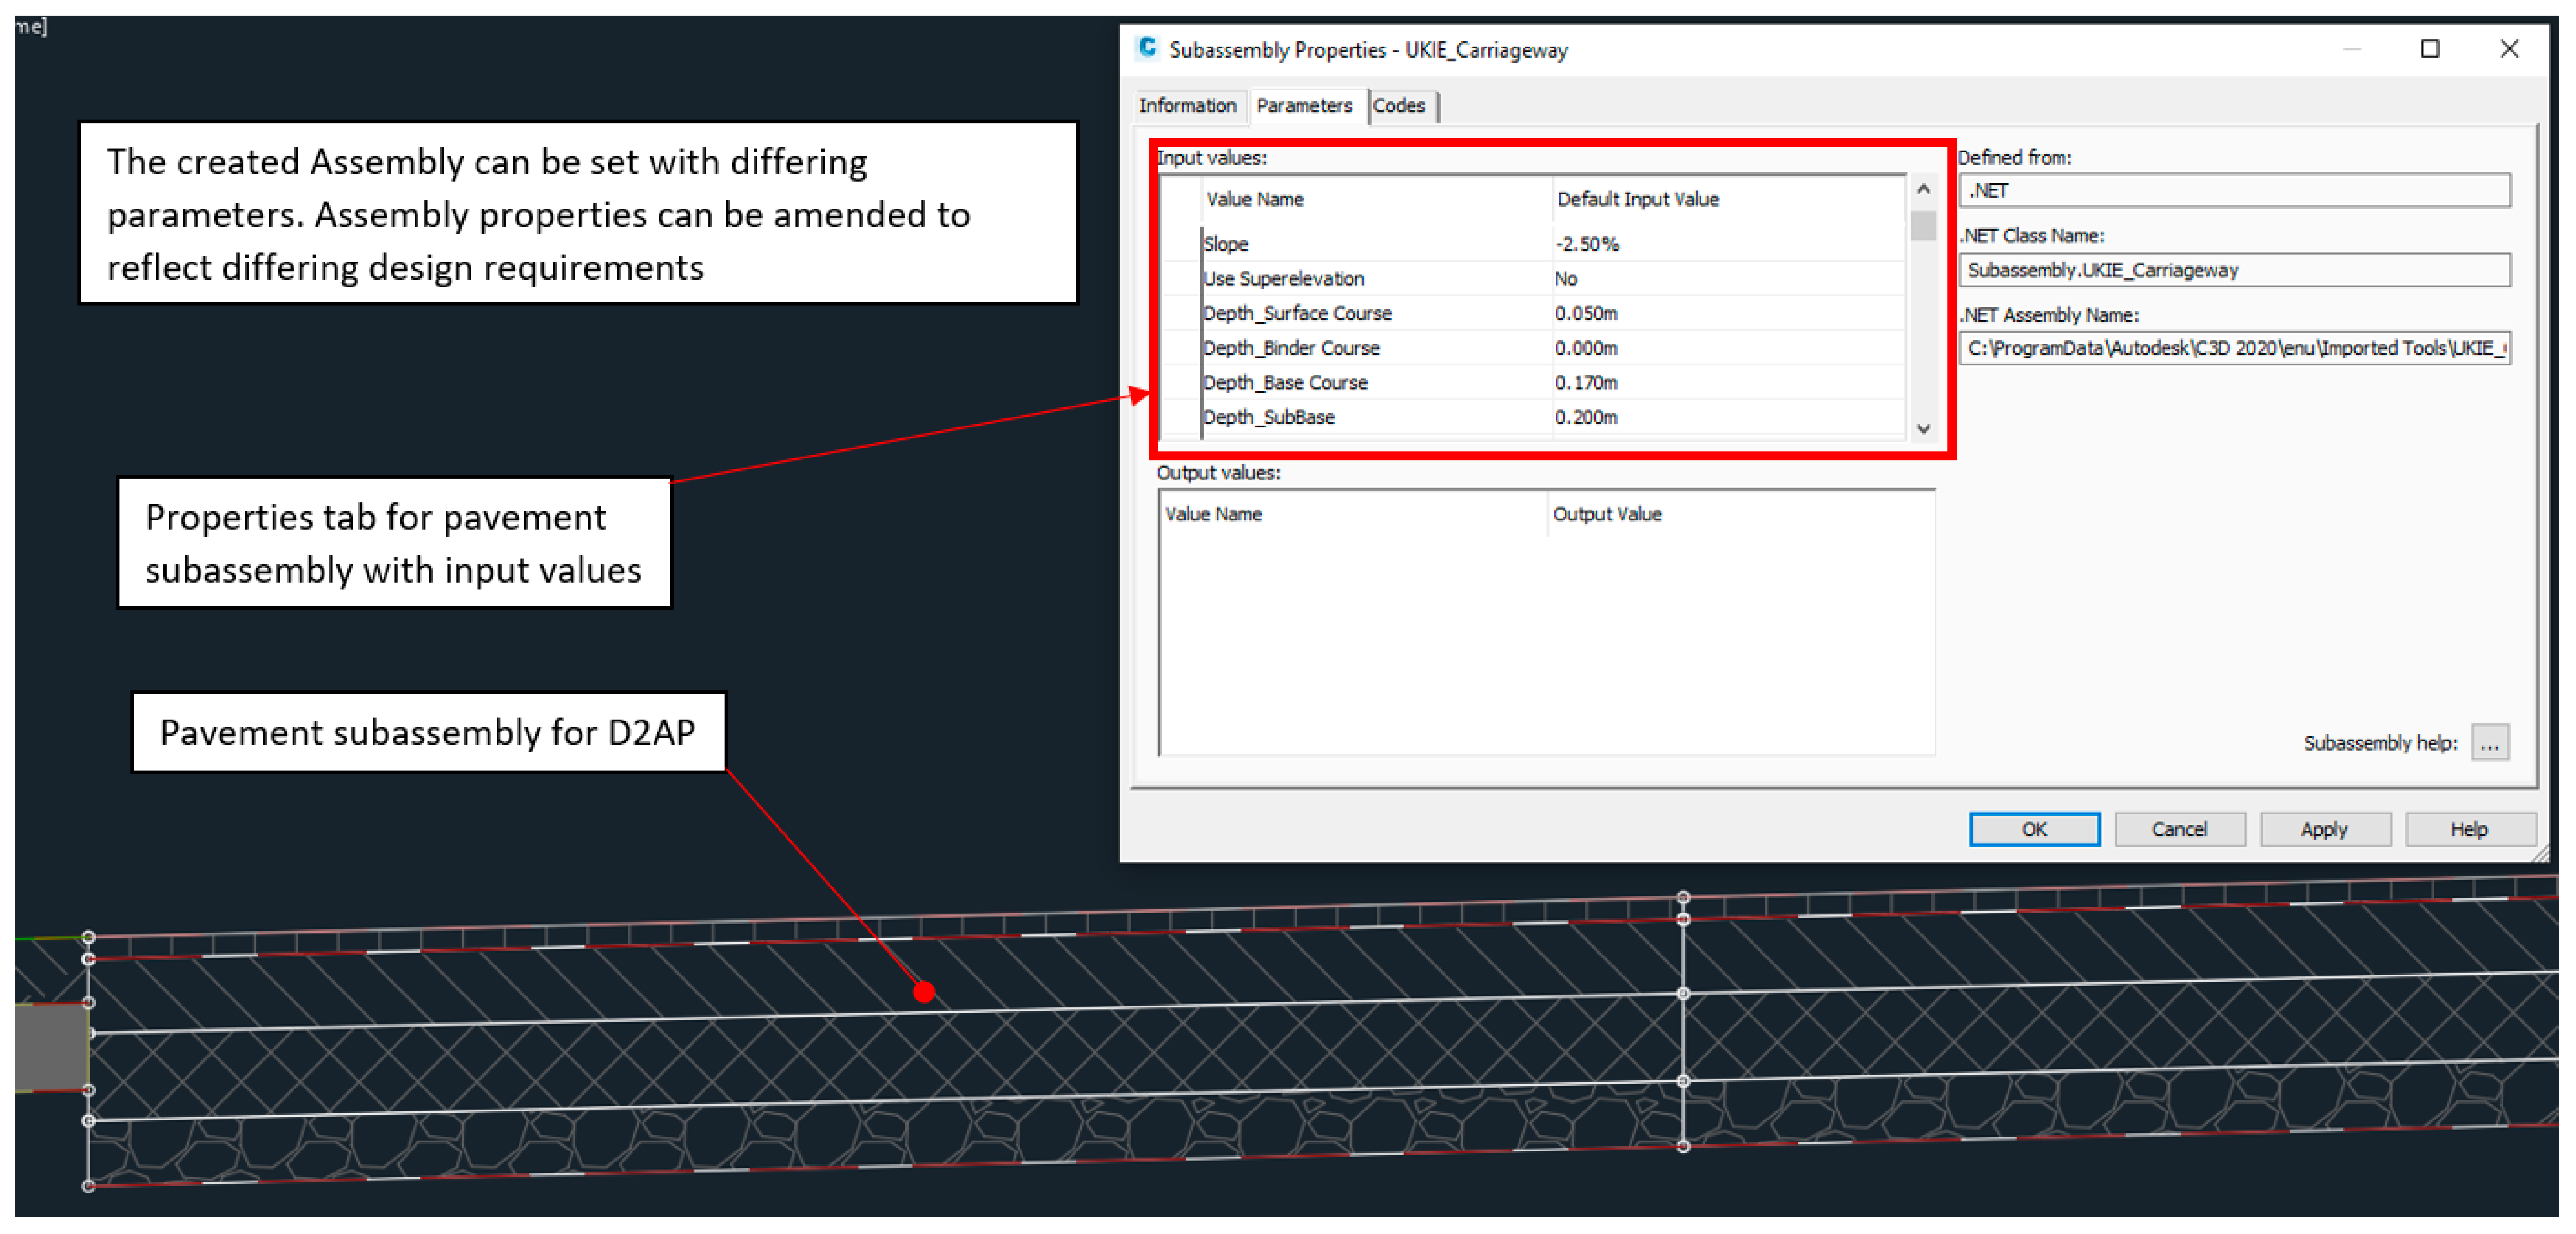
5.2. Software Modelling

Autodesk software Civil 3D is a BIM-compatible software commonly used to design highways in the UK and internationally. Traditionally, highway design is conducted using 2D-based sketching and mathematical techniques to establish appropriate vertical and horizontal curvature, Stopping Site Distances, and other highway-related design requirements. In 2006, Civil 3D was introduced through Autodesk, and it is a 3D modelling software capable of calculating the abovementioned design features through coding and algorithm approaches, drastically saving time on projects and improving design accuracy.
An advantage of modelling a design within Civil 3D is its capability to provide visual aids for designers in a 3D format and behave dynamically when designs are updated and amended, allowing engineers to review multiple designs more quickly and efficiently. To create and design each scenario outlined in this report, several processes were identified and followed in accordance with the flow diagram in Figure 2. Initially, two horizontal alignments were created, with the fundamental difference between the two designs being the radii curvature. Higher-speed roads require larger horizontal curvature to ensure that the centrifugal and centripetal forces prevent vehicles from abruptly exiting the carriageway when manoeuvring along a highway. The Department for Transport [6] indicated a speed limit of 70 mph for motorways and, in accordance with DMRB CD127, All-Purpose Roads have a speed limit of 60 mph or less. Based on these speed limits, the horizontal geometry for each design is different. Table 2.1 from the DMRB provides guidance on the minimum horizontal curvature for differing speeds. Figure 3 and Figure 4 are visual demonstrations of the two designs for a 4-Lane motorway and a 2-Lane all-purpose road.
A key design function within Civil 3D is its ability to easily amend and produce horizontal alignments with a user-friendly approach. As mentioned, Civil 3D is an Autodesk software and is compatible with AutoCAD 2023. This allows designers to utilise basic CAD commands which can convert an AutoCAD polyline into a dynamic horizontal alignment, a streamlined approach which broadens the capability to produce multiple alignments in a short period. Designers also have the capability to amend alignments once created. This can be achieved by inputting data to specify geometrical values such as lengths of curves, curve radii and superelevation, as demonstrated in Figure 4.
Following the completion of the horizontal alignments, vertical profiles associated with each horizontal alignment can be created. Similarly to creating a horizontal alignment, Civil 3D also offers a dynamic approach to producing multiple vertical profiles. A design metric that the software possess is the ability to set design parameters, such as radii curvature, which fixes geometry parameters. In Figure 5, approximately 300 m of a vertical profile is shown, also at a more detailed scale in Figure 6, which outlines the full length of the vertical profile. Notably, the existing ground profile, derived from the existing ground Lidar survey, can be seen and provides accurate existing ground levels, offering the opportunity to balance cut and fill differences.
Linked to these horizonal and vertical alignments are Civil 3D Assemblies. A Civil 3D Assembly can be defined as a ‘drawing object (AECCAssembly) that manages a collection of subassembly objects. Together, assemblies and subassemblies function as the basic building blocks of a roadway or other alignment-based design’. Once created, the assembly object is applied along the horizontal and vertical profile, providing point data links for surface triangulation, forming a 3D digital structure within a model. Assemblies can be created to suit a design, where specified pavement depths, carriageway widths and earthwork grades amongst other functions can be specifically designed. Figure 7 and Figure 8 show the proposed assembly for the D2AP option.
Having produced horizontal alignments, vertical profiles and corridor assemblies, a proposed design corridor was created. The corridor provides a visual aid for designers to assess the extents of the design’s earthwork impacts, produce proposed finished highway surfaces, extract design information, provide 3D orbits and review design information in detailed cross sections.

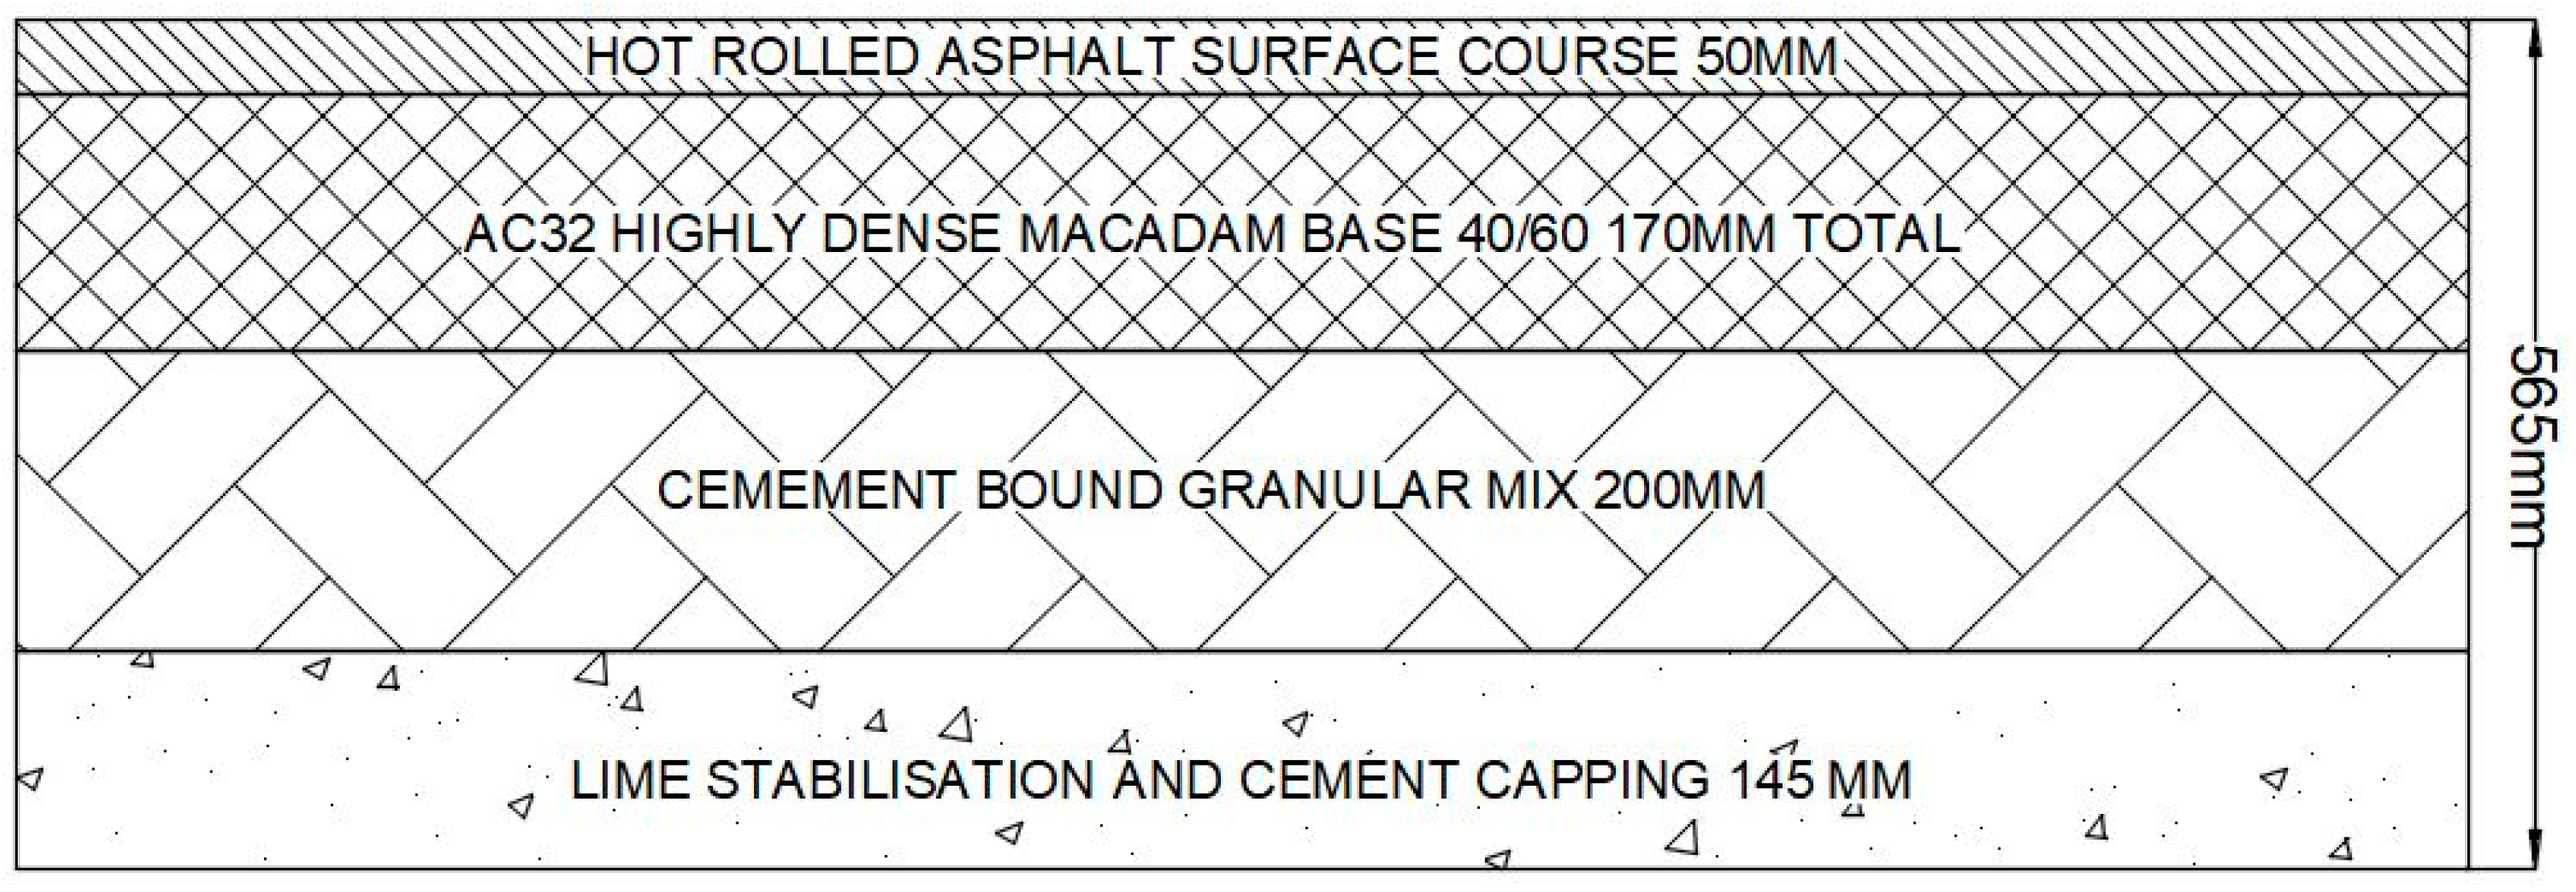
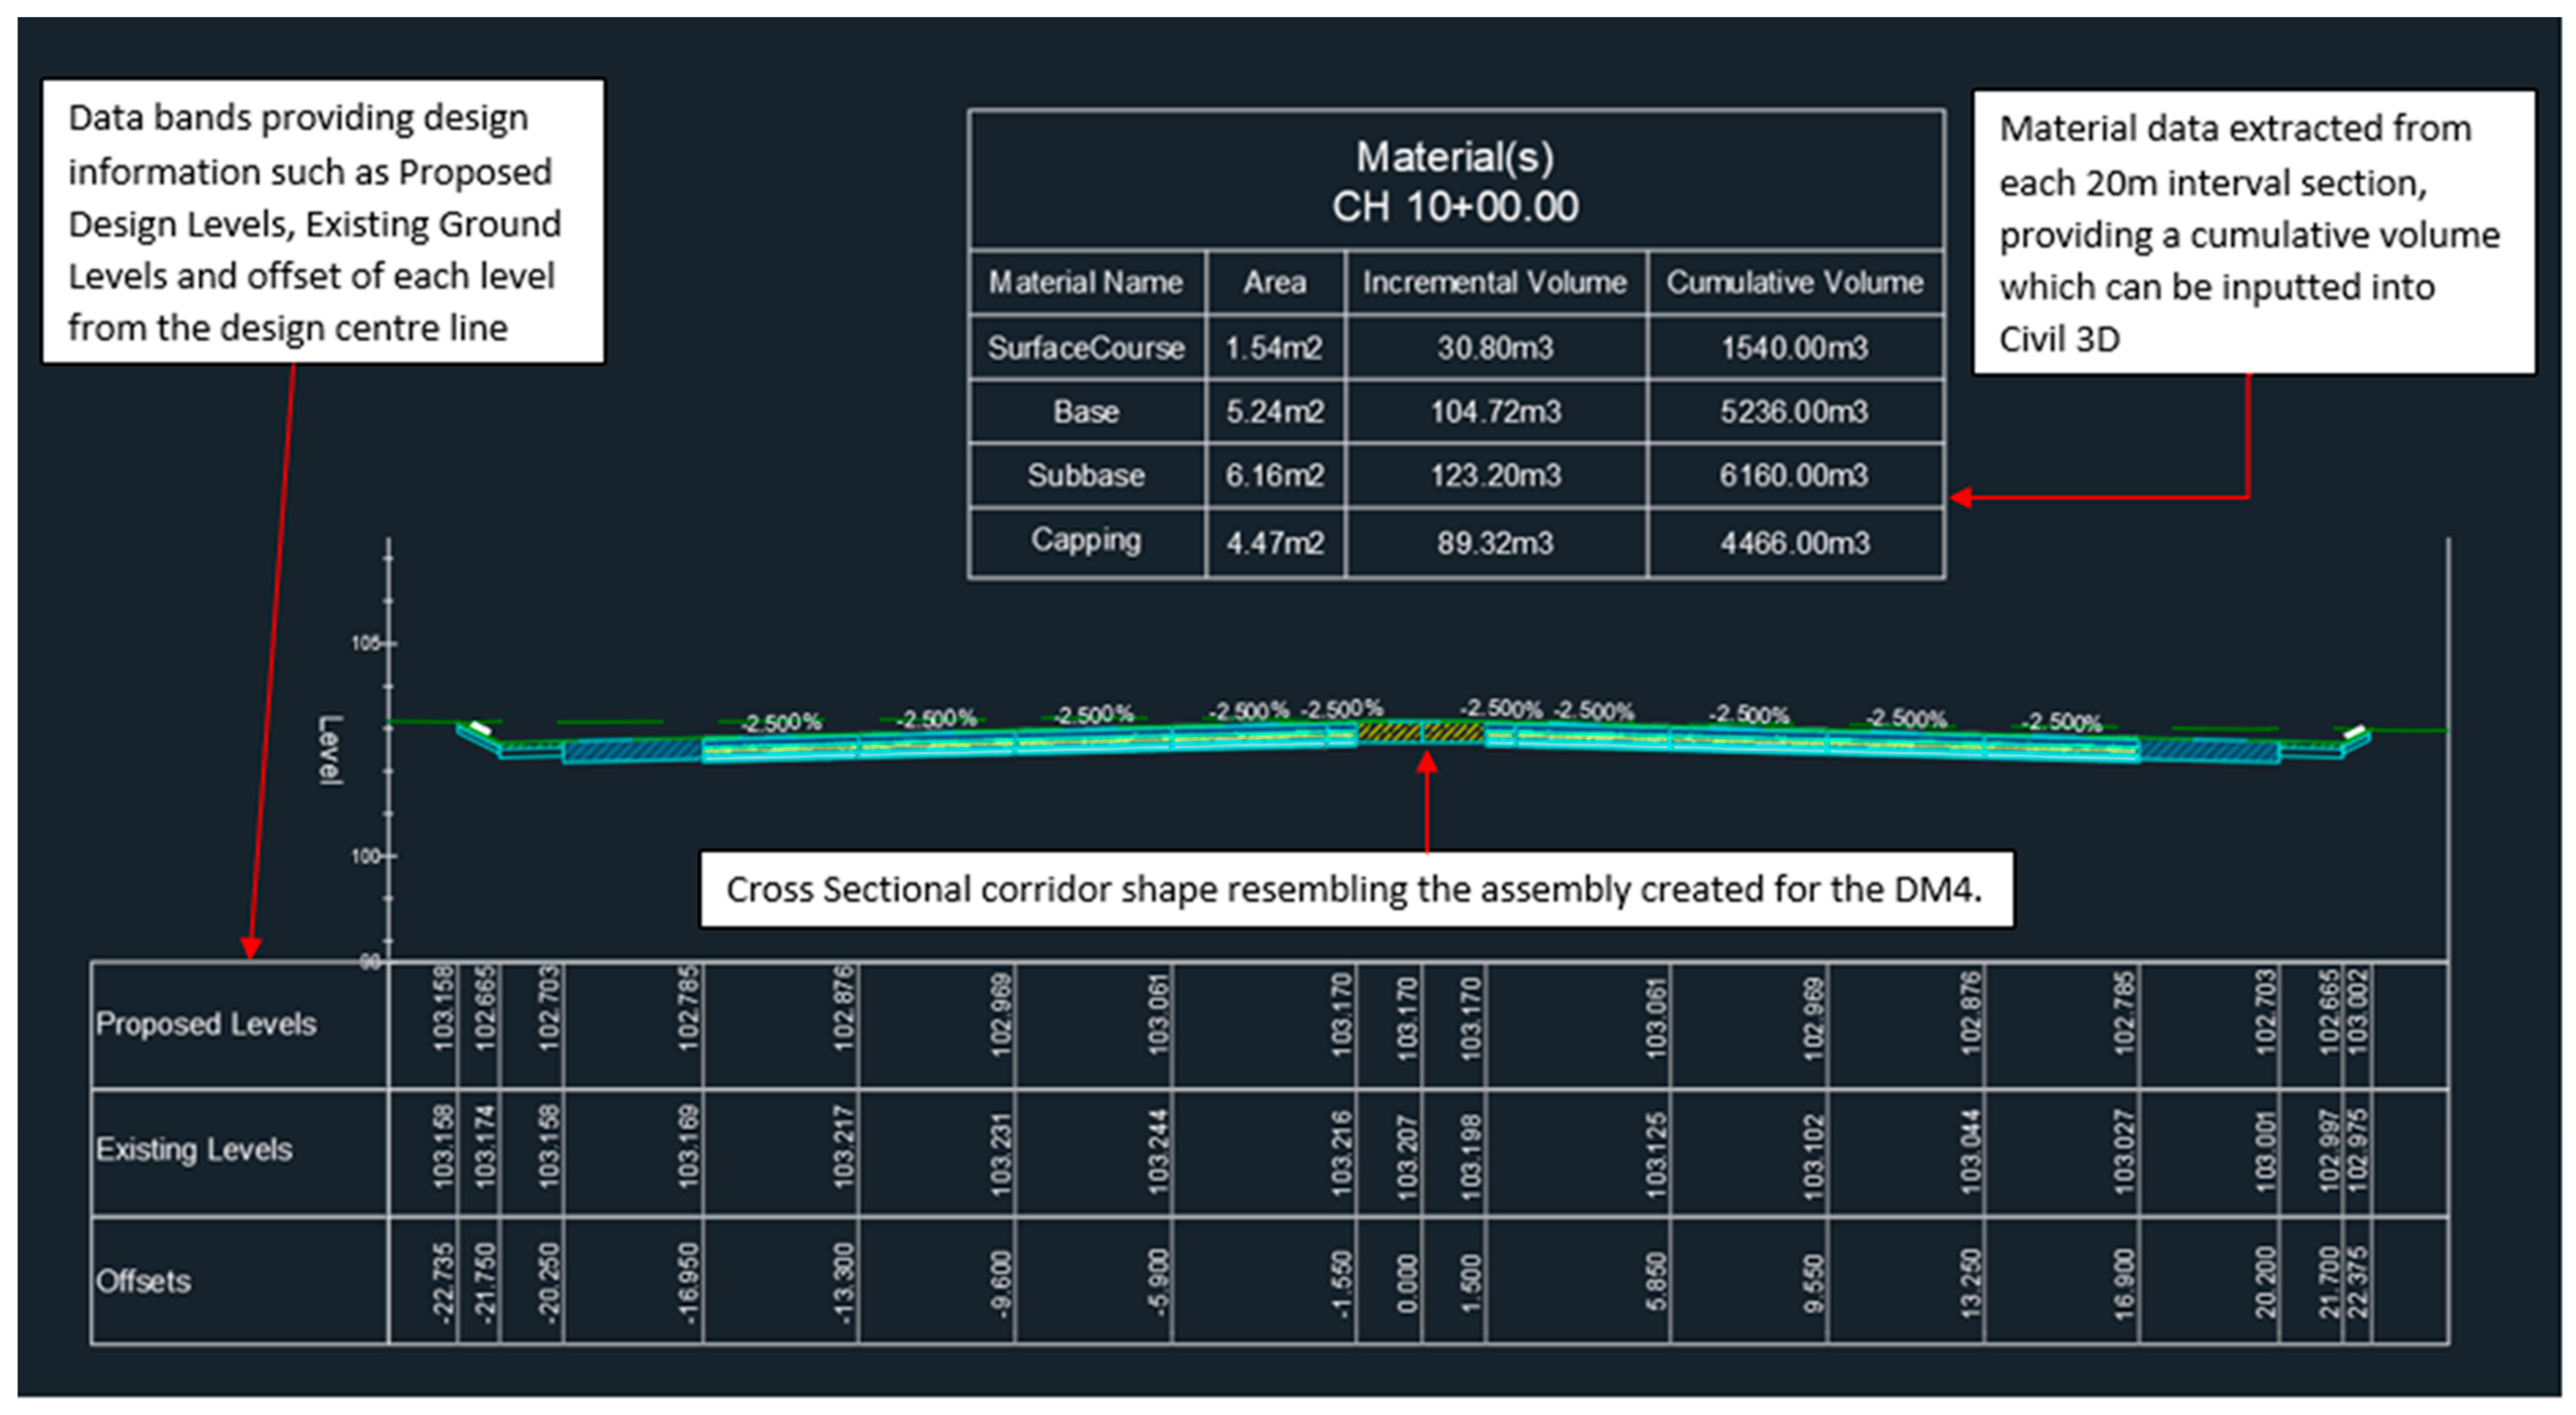
5.3. Pavement Design

Understanding the structural properties associated with a highway is paramount to assessing Embodied Carbon quantities. Pavements are typically constructed with multiple structural layers which aim to distribute loads to the subgrade, as well as provide a safe and smooth ride for users [51]. With the primary objective of this paper focussed on BIM workflows, the pavement design used has been standardised across both design options. For any specific project, a specific pavement design is required due to the substrata strengths differing. Highway designs have bespoke pavement designs based on traffic flow data, such as the Californian Baring Ration of substrata and design life of the project, to name a few parameters. Figure 9 outlines a schematic view of the proposed pavement thicknesses used as part of this research.

5.4. Carbon Calculation Tool (CCT)

To assess Embodied Carbon emissions associated with the design scenarios produced, a CCT produced by an independent consultant was used. The CCT is a multi-tab spreadsheet containing various sheets with parameters to input data associated with material types and waste data. The data are measured on tonnage of materials used within the design which is then multiplied by the Embodied CO2e per tonne. There are a variety of Embodied Carbon values for numerous types of materials within the spreadsheet. The spreadsheet also offers the option to input additional data for bespoke materials used. Figure 10 demonstrates the summary sheet from the CCT.
The main functions of this tool enable users to input quantitative data, extracted from the Civil 3D model, of materials used within a project as well as materials to be reused and materials to be recycled. The Embodied Carbon per tonne is then automatically calculated for each material and summarised. A key part of the research within this project was to identify whether the CCT could be dynamically linked to the Civil 3D model, providing a dynamic workflow when extracting material data from the model and inputting it into the CCT. This process was conducted using the data link tool within Civil 3D. Figure 11 demonstrates the data link between Civil 3D and CCT. The CCT spreadsheet was saved on a local sever and when updated within the Civil 3D model, the CCT source file was also updated. Utilising Civil 3D, all material volumes were calculated at cross sectional intervals of 20 m, with final cumulative values inputted into the CCT to provide a total Embodied Carbon value associated with each design.

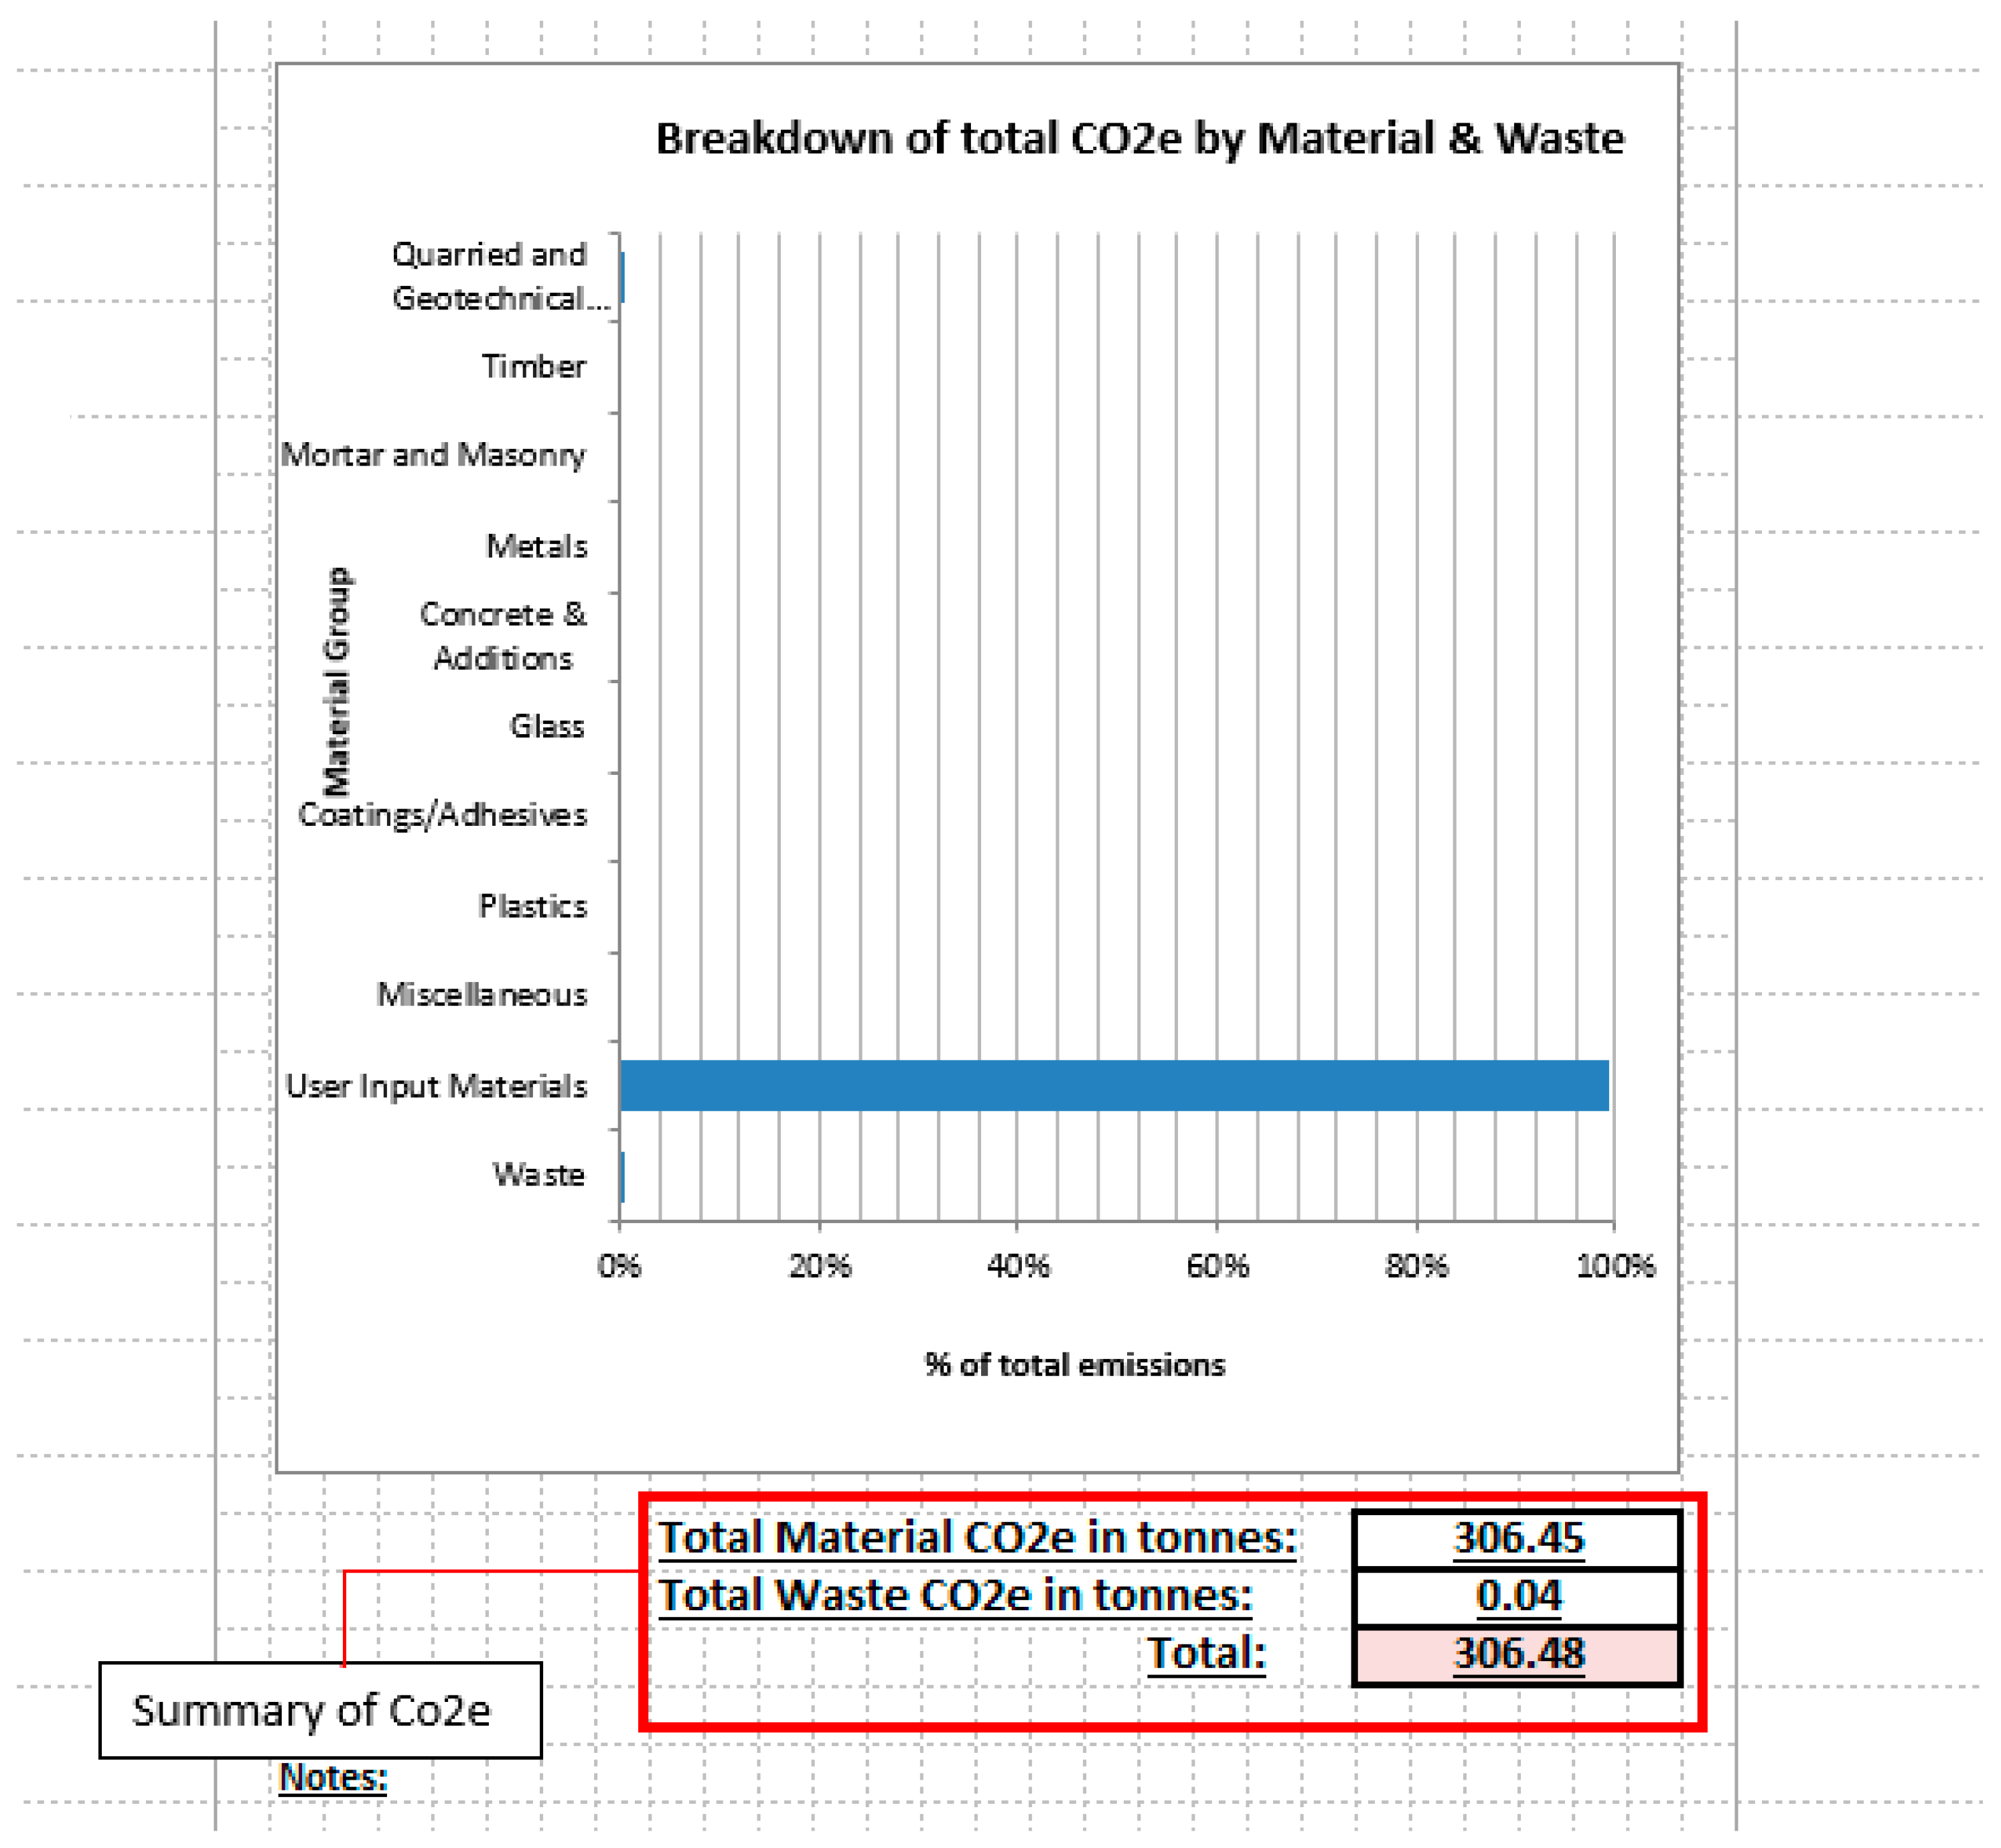
5.5. Carbon Emissions Data

Table 7 outlines the Embodied Carbon associated with the design model constructed as part of this research. Although these figures are not part of the primary research basis, the results reflect the wider contribution of the research.
The Embodied Carbon calculated for each design option was as expected. It was anticipated that the D4M designs would produce more Embodied Carbon in relation to the D2AP due to the additional carriageway lanes, creating more pavement material requirements and therefore producing more Embodied Carbon. Typically, it was expected that the ‘at grade’ design approach would produce less Embodied Carbon in relation to designs containing minimal curvature, mainly due to reduced cut and fill imbalances.

5.6. BIM Workflow

Software Deliverables
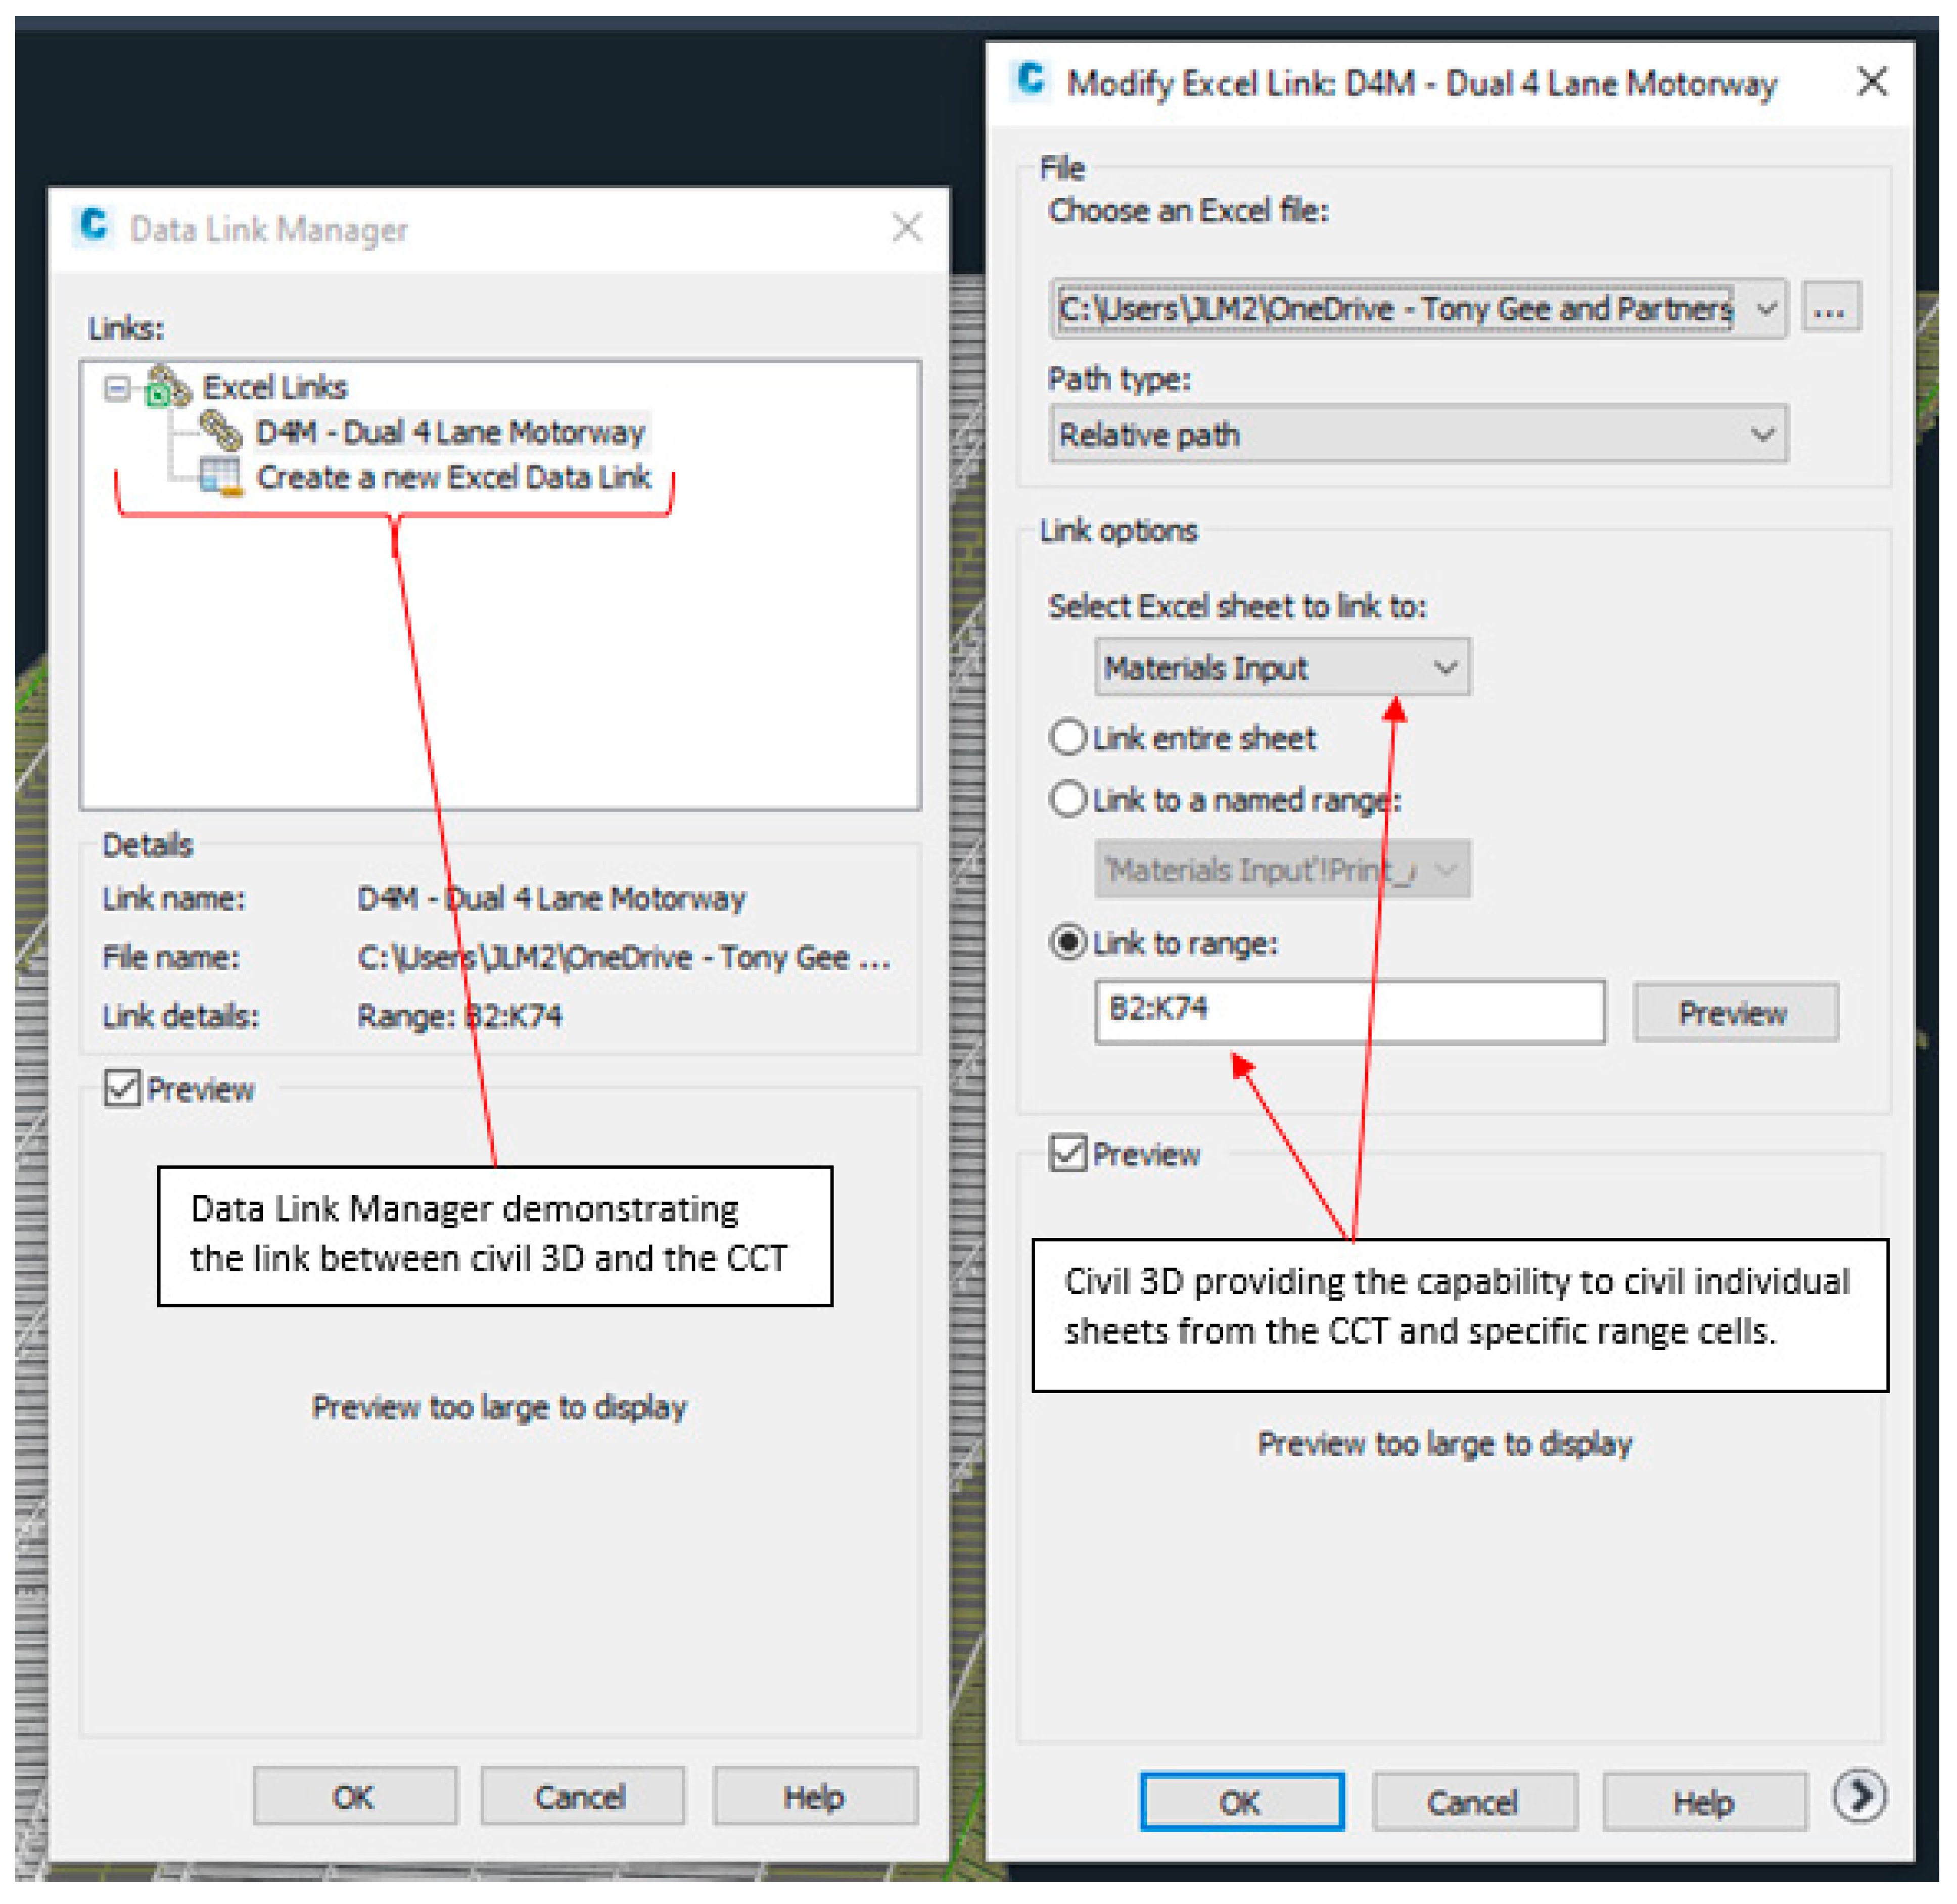
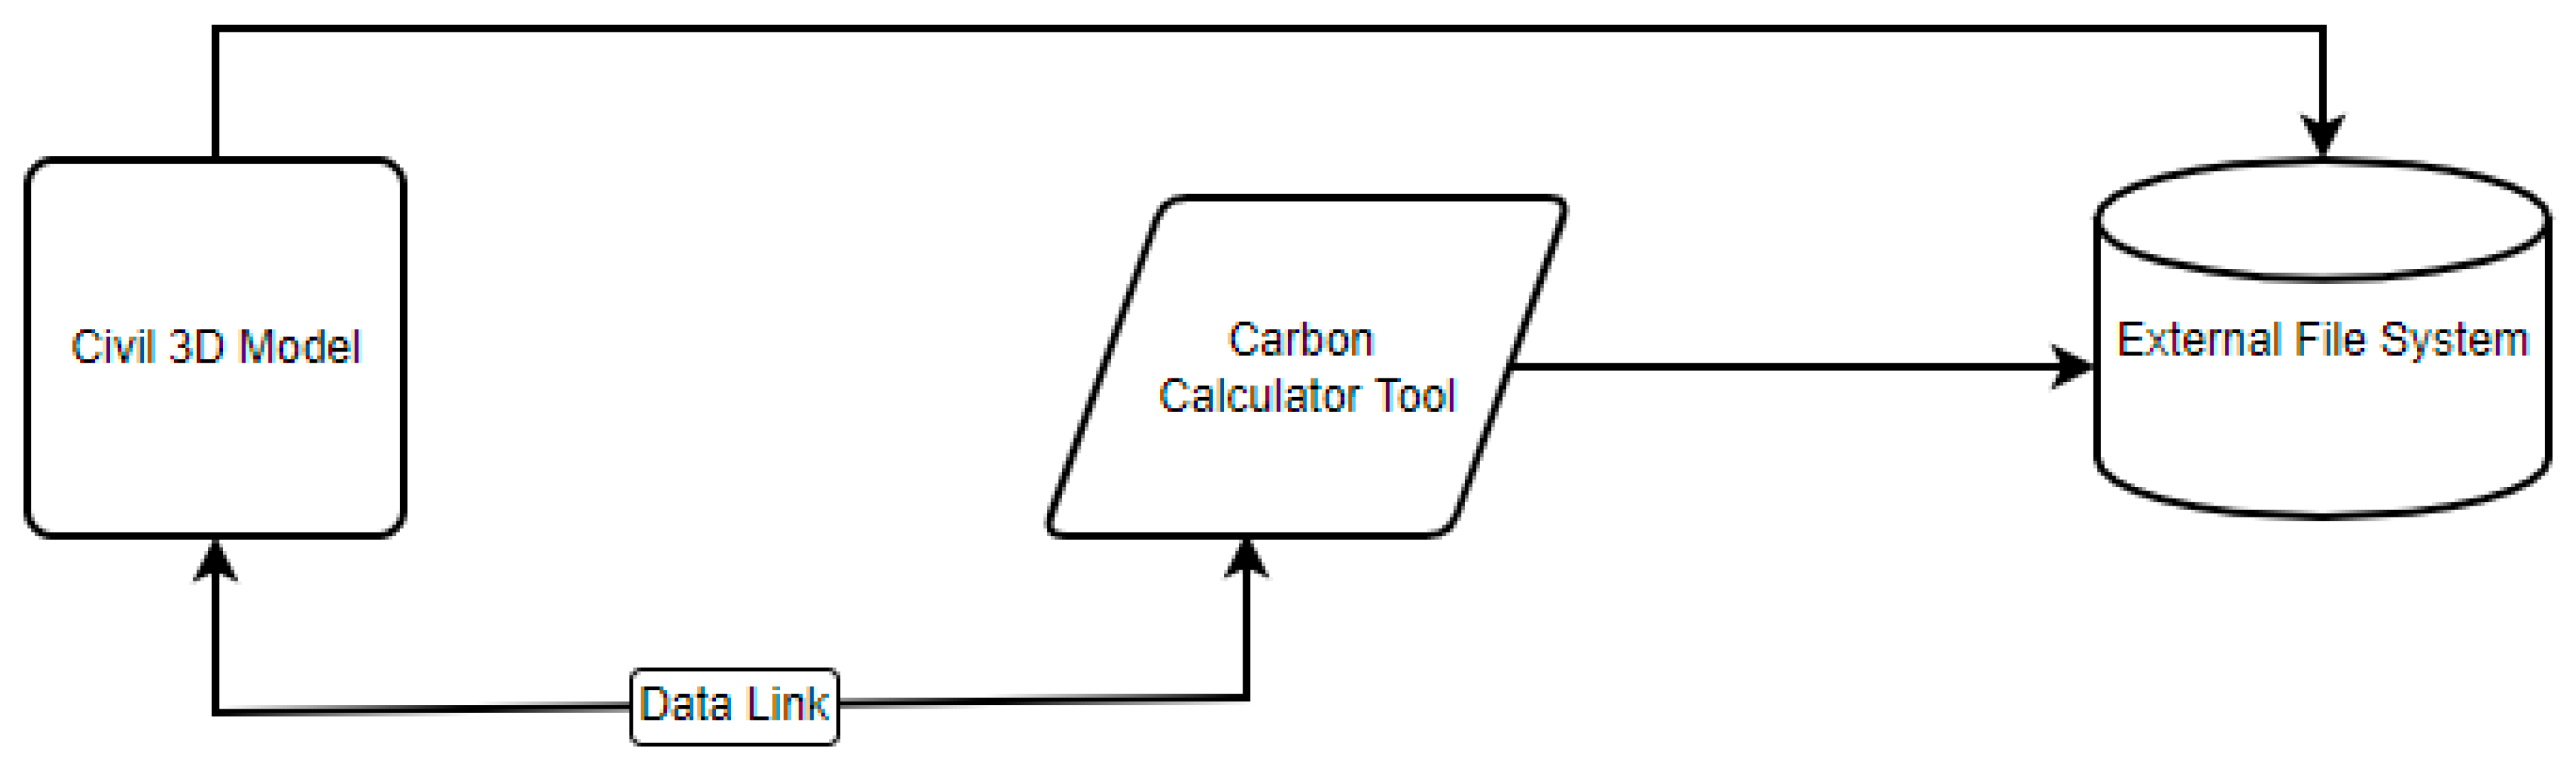
The process of establishing Embodied Carbon within each design for this research can be defined as a success. Civil 3D software provides users the benefits of dynamically operating 3D models with design changes, which instantly generates accurate earthwork and structural material quantities. Civil 3D has also proven the capability to visualise areas of a design where either more material or additional structural requirements are required, providing multiple methods to assess potential areas of high Embodied Carbon. A typical cross section containing structural pavement figures and the completed model corridor for D4M can be seen in Figure 12 and Figure 13.

5.7. Data Links

Integrating a BIM-related workflow for this research required the CCT to be dynamically linked to the Civil 3D model. A key finding of this research is Civil 3D’s capability to streamline specified cell ranges and sheets from the CCT into the Civil 3D model, providing a link between the original file’s source and the model. This provided an efficient way of inputting generated material quantities into the CCT via the 3D model, which in turn updated the CCT at its original file source. A demonstration of the Civil 3D model and CCT linked together can be seen in Figure 14.

6. Discussion

6.1. Software Usage

A primary benefit of Civil 3D is the ability to link external documents directly to the software, such as CCTs. As part of a wider BIM process on a project, the CCT has potential to be located on a Common Data Environment (CDE). A CDE can be described as ‘… a central repository where construction project information is housed. It is the single source of information for the project. It is used to collect, manage, collaborate, and share project information with the project team’ [52]. By locating the CCT within a CDE, all stakeholders can potentially gain access to Embodied Carbon information via the CCT and therefore increase the wider awareness of Embodied Carbon. This is a positive outcome of this research as typically stakeholders’ ability to operate Civil 3D is low, particularly for stakeholders with little technical engineering knowledge. This demonstrates the effectiveness of integrating BIM-related practises in a project and how this can identify Embodied Carbon as it increases the collaboration across multiple stakeholders. Also, as identified within the research in this report, geometry amendments or general design amendments such as changing pavement depths will instantly update quantities within Civil 3D as designers can update the CCT within the model, which will be reflected in the CCT located in the CDE. Omoregie and Turnbulls’s [24] research support this suggestion; their research also identified benefits of data links, highlighting that early collaboration between stakeholders can help reduce carbon. Figure 15 provides a visual outline of the workflow.
Uptake of Civil 3D within transportation infrastructure projects is relatively low, compared to other BIM-enables software within the Civil Engineering industry, as highlighted by Matejka [40]. There are clear abilities to utilise Civil 3D and produce structural materials and earthwork quantities, but research identifies that smaller companies are more reluctant to integrate a wider BIM approach, including 3D modelling. Software costs and training requirements are primary blockers found to limit their uptake. Omoregie and Turnbull [24] suggest more substantial government legislation to further mandate the use of BIM-related software to help digitalise the Transportation Sector. This issue is further highlighted by the UK Government’s public procurement policy, which mandated all bidders of public contracts for infrastructure projects over £5 million t to demonstrate their methodology to reduce and limit carbon. This in theory would bypass the requirement for small practises typically not associated with large tenders to demonstrate their approach to carbon reduction, therefore potentially limiting the emphasis and requirement for smaller companies to update and modernise their approach to Embodied Carbon identification and reduction.

6.2. Approach to Net Zero Carbon

As indicated by the NZIDC [42], a key process of contributing towards NZC in transportation infrastructure is to capture the ‘carbon hotspots’ across a project’s life cycle to reduce the total carbon outputs of infrastructure projects. The research conducted within this report identifies a method to perform assessments enabling the early identification of Embodied Carbon, which in turn supports the NZIDC’s recommendation. The NZIDC [42] further discusses the importance of BIM to help contribute towards NZC, highlighting the importance of focussing on the pre-construction phase of a project to maximise efficiency on material savings.
Within this research, it is highlighted how Embodied Carbon is largely not considered within the wider asset’s life cycle but is within material production [41]. A report produced by Marsden, Lokesh and Densley-Tingley [53] identifies Embodied Carbon on road projects to be approximately 70% of total carbon emissions associated with an asset, further demonstrating the advantages behind the principles highlighted in this research. Krantz [54] also discusses the benefits of utilising BIM processes in Transportation Engineering to identify carbon emissions within a project. Kranz summaries that to reduce the total carbon emissions in Transport Infrastructure projects, the gap between assessing carbon and the ability to influence carbon production has to be closed. In the case of this research, it has been established that using software such as Civil 3D alongside a CCT can assess Embodied Carbon and share the information amongst other stakeholders, therefore increasing the ability to reduce overall carbon footprints.

6.3. Carbon Calculator Tool

The CCT utilised within this research was provided by an independent consultant and covered a wide range of materials to be assessed. The tool was macro-enabled and provided a total amount of Embodied Carbon within each design by summarising the individual materials, material transport distances and material waste quantities. However, materials within the tool appeared to be limited regarding specific highway designs, meaning parts of the material details used to assess Embodied Carbon were derived from external sources, leading to a more time-consuming process. However, the CCT used in this research allows for an in-depth review of Embodied Carbon by assessing transport journey distances for materials to be imported and removed from the site, enabling the ability to make informed decisions regarding design approaches. For example, a wider carbon assessment of a project may demonstrate the need for large quantities of material imports, and designers and stakeholders can decide to either identify a different material import location and therefore reduce the Embodied Carbon or amend a design to reduce the amount of fill required. This demonstrates how early decision making within a project’s life cycle can lead to a lower Embodied Carbon footprint.
Focussing on specific disciplines of the Civil Engineering sector is required within a CCT as the amount of detail regarding a material that is required for individual disciplines within the industry makes it difficult to capture all relevant material information within one CCT document. The highway-related materials within the CCT were found to be quite basic and can lead to users undertaking their own research to establish the correct Embodied Carbon of a material. In addition to this, the CCT spreadsheet is built up of multiple sheets, meaning separate sheets need to be linked to input the required data, therefore increasing the time taken for the workflow process. Although, multiple CCTs exist within the Civil Engineering industry, notably, National Highways have a CCT which coincides with their NZC plan for 2040, which states that ‘We will also use digital technologies to increase the capacity of our existing network minimising new construction’.

6.4. Civil 3D System

Despite the ability to link Civil 3D to a specific document, this appears to be the only working method to highlight associated carbon within assets and materials. Other analysis- and design-related software within the Civil Engineering industry have developed better integrated ways of associating carbon to materials, providing users with a more streamlined approach of assessing carbon. Antón and Díaz [55] investigated the implementation of carbon LCA within a BIM environment for Structural Engineering and discussed the difficulty with linking a BIM-related software with an LCA. This was further established by Soust-Verdaguer, Llatas and García-Martínez [56], who highlighted the difficulty of linking BIM workflows and LCAs in the building sector but acknowledge the progress being made within the sector and emphasised the improvements made in structural projects using related BIM software such as Revit by applying integrated software packages within the original software itself and therefore improving the interoperability of the software. In relation to Civil 3D, additional software packages will help improve workflows and an LCA will minimise the need for data links to basic software such as the CCT.
The outcome of this research also established the advanced capability of Civil 3D to accurately provide material quantities, and a similar outcome was found by D’Amico et al. [28], whose research demonstrated Civil 3D’s effectiveness for contractors and suppliers to order precise quantities of materials for a construction project. Differing design scenario constraints can lead to excess material requirements or excess material removal, and as a by-product of utilising BIM-related software, exact material quantities can be procured which in turn leads to less material waste. D’Amico et al. [28] also identified over 202.8 million tonnes of waste generated through infrastructure projects in 2014, of which approximately 120 million tonnes of waste were generated through construction, demolition and excavation works. To reduce these figures, the report suggests that projects should review sustainable material life cycles, implementing a sound material strategy, and improve communication and collaboration across a project, all of which can be achieved through a wider BIM strategy and by using Civil 3D, as found in this report.

6.5. Digital Twin

The wider concept of a BIM-enabled workflow to improve carbon outputs can coincide with a Digital Twin strategy. Within this research it is highlighted how Embodied Carbon can be identified and reduced within transportation projects, contributing to the overall reduction in carbon across an asset’s life cycle, coinciding with Shahat, Hyun and Yeom’s [33] study which identifies the requirements for an asset’s life cycle carbon performance to feed into a collective model, providing end users with a broader understanding of the overall carbon footprint of an asset. Also, they identify BIM workflows as a method to directly contribute to a wider DT, providing design-related data on carbon and cost which can be integrated with live data to provide an understanding of an asset’s wider carbon performance, operation performance and future maintenance requirements.
Despite not being widely recognised within the Civil Engineering industry, Dyson [57] discusses the capability for DTs to be a leading form of technology within the industry to help improve performance and asset management efficiencies across the UK’s infrastructure, citing the Centre for Digital Built Britain prediction that combining BIM and the IoT with DTs can allow for efficiently planned infrastructure, lower costs and improve the life span of an asset. Examples of how missing data can impact a DT are found in Kaewunruen Sakdirat and Xu Ningfang’s [38] study of Kings Cross Station, where a lack of construction and carbon information regarding the railway’s construction proved to be problematic when trying to produce a whole life cycle review of a project. Again, using Civil 3D to establish Embodied Carbon in the early stages of an asset’s life cycle can provide a way of assessing the wider carbon associated with the construction of an asset, and this information can be integrated into a wider Digital Twin model. Further to this, when combined with modern approaches such as sensory data and the IoT, a Digital Twin model can provide a fully integrated asset which considers the whole life cycle carbon approach.

7. Conclusions and Recommendations

The wider conclusion of this report is that the implementation of BIM workflows, including BIM-enabled software to create 3D BIM models, can contribute towards the UK Government’s NZC aim by integrating additional features to assess Embodied Carbon, such as a CCT.

7.1. Industry

Currently, the Transportation Sector’s approach to assessing Embodied Carbon is not prioritised sufficiently to help achieve NZC and contribute towards the UK’s NZC aim. The Transportation Sector currently lags behind other sectors in relation to applying BIM and the general approach to carbon assessments. However, major transport-related infrastructure, such as HS2, is demonstrating progress towards BIM adoption and the adherence to the UK Government’s BIM Mandate.
It is recommended the industry works closely with leading software providers and emphasises the requirement for carbon assessment tools to be directly integrated within BIM-enabled software packages. This would enhance the capability of data linking highlighted in this report and provide a more streamlined approach to assessing carbon associated with an asset or project. Also, a standardised CCT for each discipline would provide a more holistic approach to assessing carbon. If the wider industry has a select few CCTs widely available for companies to use, any inconsistencies towards assessing carbon can be mitigated. As identified within this research, each project requires specific Embodied Carbon material values. By providing a well-rounded and more sector-focused CCT, a more consistent approach to assessing carbon across various stages of an assets life cycle can be achieved. Leading industry figures and bodies can also help raise the general awareness of BIM, offer training and advise on how to implement BIM and general approaches to carbon assessments.

7.2. Company

Further progress by companies within the Transportation Sector is required to implement BIM workflows and utilise BIM software to reduce and identify Embodied Carbon. A solution to encourage this uptake would be to invest more into training members of staff and adopting new internal policies, demonstrating the purpose and advantages of applying BIM practises and how carbon assessments can provide more sustainable outcomes on projects. Standard approaches to capturing carbon information have been outlined within this report, but it has also been acknowledged that there is a general lack of awareness regarding the importance of obtaining Embodied Carbon data within the early stages of a project. However, there are emerging signs of companies beginning to improve and address their approach to Embodied Carbon, with individual enterprises demonstrating their commitment to reducing Embodied Carbon and outlining specific goals to achieve NZC. Although, research suggests there are gaps in the day-to-day approaches to projects which in turn will be detrimental to wider NZC goals.
It is recommended that smaller consultancies aim to bridge the gap currently seen between themselves and larger companies with their approach to BIM. It has been concluded that there are barriers preventing smaller companies from adopting BIM practises due to the higher costs associated with the software, training and typical deliverables. It is recommended that clients work closely with small practises and clearly outline both their BIM requirements and expectations towards carbon assessments, with particular emphasis on Embodied Carbon information at earlier stages of a design. In addition to this, both smaller and larger companies should begin to integrate BIM practises as part of standard project deliverables to change the cultural approach to BIM to help contribute to achieving NZC within the industry.

7.3. Policy

Clients are the essential driving force behind BIM-related deliverables and the delivery of Embodied Carbon data, as well as the wider carbon footprint data of a project. To help establish this carbon-related data, clients must request and demand it as part of the proposal requirements of a project. Clearly specifying their requirements will place further emphasis on designers to adapt their approach to a project and help standardise the approach to a project’s carbon footprint. In addition to this, public clients should standardise their approaches and requirements to BIM workflows and carbon assessments to ensure stakeholders within a project have a clear understanding of those deliverables, mainly aligning their proposal requirements to the BIM mandate produced in 2016. The UK Government can also review and update the BIM mandate to offer guidance to designers and contractors of all sizes, ensuring the mandate is applicable irrespective of the company size. Also, consistent collaboration between clients and designers across the design stage of a project is recommended to ensure early decision making, which in turn can provide better outcomes for a project.
There is no framework specifically targeted towards the TI sector, incorporating financial incentives to encourage net zero carbon. Therefore, a new framework needs to be developed to help deliver net zero carbon within the TI sector. There is also a paucity of processes and systems to control the quality and legitimacy of carbon-neutral products within the industry. Lastly, LCA databases and BIM tools need to be analysed in depth to enable more accurate carbon assessments.

7.4. Limitations and Future Research

The outcome and conclusion of this research is based on a limited timeframe and information. Identifying the limitations associated with this research provides scope for future research to be conducted and further solidifies the understanding of how NZC can be achieved within the Transportation Sector in the UK.
Solely focussing on highway infrastructure, this research does not assess any other form of transportation disciplines such as tunnels and railways. Neglecting other forms of transportation infrastructure prevents a broader understanding of how compatible individual software such as Civil 3D is across different disciplines and therefore provides scope for further research utilising the software. In addition to this, assessing only one form of CCT limits the wider knowledge of CCTs available within the industry and how effective they may be with data links within Civil 3D.
Interviews and questionnaires amongst industry professionals would have also contributed towards the aim of this project. Despite being considered at the early stages of this research, limited time to complete the research prevented any interviews or questionnaires being conducted. Obtaining information through interviewing or questionnaires would have provided an external form of information from industry professionals, providing more accurate insights into the current issues surrounding the approach to carbon assessments and NZC within the sector. This would have provided more comparable data against the results generated from this research, which in turn would give more validity to the overall findings. It is recommended that any future research into the Transportation Sector’s approach to NZC is inclusive of either interviews and/or questionnaires. Also, the research outlined is sourced from developed countries. Future research establishing the use of BIM and carbon assessments in lesser developed nations will help identify potential areas of improvements and therefore contribute towards a wider NZC movement across the globe.

Author Contributions

Conceptualization, S.R. and J.M.; methodology, J.M., S.R., P.G. and S.S.; validation, J.M. and S.R.; formal analysis, J.M. and S.R.; investigation, J.M.; resources, J.M. and S.R.; data curation, S.R.; writing—original draft preparation, J.M., S.R., S.S., P.G. and G.R.P.; writing—review and editing, J.M., S.R., S.S., P.G. and G.R.P.; visualisation, J.M. and S.R.; supervision, S.R. and S.S.; project administration, J.M. and S.R. All authors have read and agreed to the published version of the manuscript.

Funding

This research did not receive any specific grant from funding agencies in the public, commercial or not-for-profit sectors.

Institutional Review Board Statement

Not applicable.

Informed Consent Statement

Not applicable.

Data Availability Statement

Data sharing is not applicable to this article.

Acknowledgments

We would like to thank the review team for their encouragement and guidance throughout the review process. The paper has significantly benefited from their comments.

Conflicts of Interest

The authors declare no conflicts of interest.

References

  1. Hawkes, D. Spending Review 2020—What It Means for Infrastructure; Institute of Civil Engineers: London, UK, 2020; Available online: https://www.ice.org.uk/news-and-insight/the-infrastructure-blog/november-2020/spending-review-2020-what-it-means-for-infrastrure (accessed on 3 November 2021).
  2. National Infrastructure Commission. Economic Growth and Demand for Infrastructure Services. 2017. Available online: https://nic.org.uk/app/uploads/2906219-NIC-Technical-Paper-Economic-Driver-v1_0A-WEBACCESSIBLE-4.pdf (accessed on 4 November 2021).
  3. Infrastructure and Projects Authority. Transforming Infrastructure Performance: Roadmap to 2030. 2013. Available online: https://www.gov.uk/government/publications/transforming-infrastructure-performance-roadmap-to-2030/transforming-infrastructure-performance-roadmap-to-2030#focus-area-4-retrofitting-existing-buildings-to-achieve-net-zero-greenhouse-gas-emissions-emissions-by-2050 (accessed on 31 October 2021).
  4. National Infrastructure Committee. Public Expenditure on Infrastructure. 2021. Available online: https://nic.org.uk/app/uploads/NIC-July-2021-Engineered-Greenhouse-Gas-Removals-UPDATED.pdf (accessed on 31 October 2021).
  5. HM Treasury. Infrastructure Carbon Review. 2013. Available online: https://assets.publishing.service.gov.uk/government/uploads/system/uploads/attachment_data/file/260710/infrastructure_carbon_review_251113.pdf (accessed on 26 November 2021).
  6. Department for Transport. Decarbonizing Transport: A Better Greener Britain; Department for Transport: London, UK, 2021.
  7. Pradhan, R.P. Investigating the causal relationship between transportation infrastructure, financial penetration and economic growth in G-20 countries. Res. Transp. Econ. 2019, 78, 100766. [Google Scholar] [CrossRef]
  8. Stephan, H. What is Building Information Modelling (BIM)? 2021. Available online: https://www.thenbs.com/knowledge/what-is-building-information-modelling-bim (accessed on 21 November 2021).
  9. Department for Business, Energy and Industrial Strategy. 2019 UK Greenhouse Gas Emissions, Final Figures, s.l.; Department for Business, Energy and Industrial Strategy: London, UK, 2019.
  10. UK Government. Government Construction Strategy 2016–20. 2016. Available online: https://assets.publishing.service.gov.uk/government/uploads/system/uploads/attachment_data/file/510354/Government_Construction_Strategy_2016-20.pdf (accessed on 29 October 2021).
  11. Harris, J. Has the 2016–2020 Construction Strategy Worked? 2020. Available online: https://www.building.co.uk/focus/has-the-2016-2020-construction-strategy-worked/5104169.article (accessed on 2 March 2022).
  12. Oktem, S.; Akcamete, A.; Ergen, E. BIM Implementation in Infrastructure Projects: Benefits andChallenges. In Proceedings of the 5th International Project and Construction Management Conference (IPCMC2018), Nicosia, North Cyprus, 16–18 November 2018. [Google Scholar]
  13. Dodge Data & Analytics. The Business Value of BIM for Infrastructure; Dodge Data & Analytics: Bedford, MA, USA, 2017. [Google Scholar]
  14. United Nations. Emissions Gap Report, s.l; United Nations Environment Programme: Nairobi, Kenya, 2021. [Google Scholar]
  15. Bolton, A.; Enzer, M.; Schooling, J. The Gemini Principles. 2018. Available online: https://www.cdbb.cam.ac.uk/system/files/documents/TheGeminiPrinciples.pdf (accessed on 6 November 2021).
  16. Marr, B. What Is Digital Twin Technology—And Why Is It So Important? 2017. Available online: https://www.forbes.com/sites/bernardmarr/2017/03/06/what-is-digital-twin-technology-and-why-is-it-so-important/?sh=1c4558fd2e2a (accessed on 6 November 2021).
  17. Shahbaz, M.; Nasir, M.A.; Hille, E.; Mahaliik, M.K. UK’s net-zero carbon emissions target: Investigating the potential role of economic growth, financial development, and R&D expenditures based on historical data (1870–2017). 2020. Available online: https://www.ncbi.nlm.nih.gov/pmc/articles/PMC7459337/ (accessed on 2 March 2022).
  18. Petticrew, M.; Roberts, H. Systematic Reviews in the Social Sciences: A Practical Guide; Blackwell Publishing: Malden, MA, USA, 2006. [Google Scholar]
  19. Borrego, M.; Foster, M.J.; Froyd, J.E. Systematic Literature Reviews in Engineering Education and Other Developing Interdisciplinary Fields. J. Eng. Educ. 2014, 103, 45–76. [Google Scholar] [CrossRef]
  20. Xiao, Y.; Watson, M. Guidance on Conducting a Systematic Literature Review. J. Plan. Educ. Res. 2019, 39, 93–112. [Google Scholar] [CrossRef]
  21. Jayant, N.P. Framing the research question using PICO strategy. J. Dent. Allied Sci. 2017, 6, 55. [Google Scholar]
  22. Fernández-Olit, B.; Martín Martín, J.M.; Porras, G.E. Systematized literature review on financial inclusion and exclusion in developed countries. Int. J. Bank Mark. 2020, 38, 600–626. [Google Scholar] [CrossRef]
  23. Blanco, F.G.B.; Chen, H. The Implementation of Building Information Modelling in the United Kingdom by the Transport Industry. Procedia—Soc. Behav. Sci. 2014, 138, 510–520. [Google Scholar] [CrossRef]
  24. Omoregie, A.; Turnbull, D.E. Highway infrastructure and Building Information Modelling in UK. Proc. Inst. Civ. Eng.—Munic. Eng. 2016, 169, 220–232. [Google Scholar] [CrossRef]
  25. Sanchez, A.; Kraatz, J.; Hampson, K.; Loganathan, S. BIM for Sustainable Whole-of-life Transport Infrastructure Asset Management. In Proceedings of the 2014 IPWEA Sustainability in Public Works Conference, Tweed Heads, Australia, 27–29 July 2014. [Google Scholar]
  26. Liu, Y.; Van Nederveen, S.; Hertogh, M. Government’s perspective on BIM and Sustainability in transport infrastructure in Europe and China. In Life-Cycle of Engineering Systems: Emphasis on Sustainable Civil Infrastructure; CRC Press: London, UK, 2016. [Google Scholar]
  27. Zhao, L.; Liu, Z.; Mbachu, J. Highway Alignment Optimization: An Integrated BIM and GIS Approach. ISPRS Int. J. Geo-Inf. 2019, 8, 172. [Google Scholar] [CrossRef]
  28. D’Amico, F.; Calvi, A.; Schiattarella, E.; Prete, M.D.; Veraldi, V. BIM And GIS Data Integration: A Novel Approach Of Technical/Environmental Decision-Making Process In Transport Infrastructure Design. Transp. Res. Procedia 2020, 45, 803–810. [Google Scholar] [CrossRef]
  29. Whitlock, K.; Abanda, H.; Manjia, M.; Pettang, C.; Nkeng, G. BIM for Construction Site Logistics Management. J. Eng. Proj. Prod. Manag. 2018, 8, 47–55. [Google Scholar] [CrossRef]
  30. Schooling, J.; Enzer, M.; Broo, D.G. Flourishing systems: Re-envisioning infrastructure as a platform for human flourishing. Proc. Inst. Civ. Eng.—Smart Infrastruct. Constr. 2020, 173, 166–174. [Google Scholar] [CrossRef]
  31. Chong, H.; Lopez, R.; Wang, J.; Wang, X.; Zhao, Z. Comparative Analysis on the Adoption and Use of BIM in Road Infrastructure Projects. J. Manag. Eng. 2016, 32, 05016021. [Google Scholar] [CrossRef]
  32. Shou, W.; Wang, J.; Wang, X.; Chong, H.Y. A Comparative Review of Building Information Modelling Implementation in Building and Infrastructure Industries. Arch. Comput. Methods Eng. 2014, 22, 291–308. [Google Scholar] [CrossRef]
  33. Shahat, E.; Hyun, C.T.; Yeom, C. City Digital Twin Potentials: A Review and Research Agenda. Sustainability 2021, 13, 3386. [Google Scholar] [CrossRef]
  34. Wang, S.; Zhang, F.; Qin, T. Research on the Construction of Highway Traffic Digital Twin System Based on 3D GIS Technology. J. Phys. Conf. Ser. 2021, 1802, 042045. [Google Scholar] [CrossRef]
  35. Ivanov, S.; Nikolskaya, K.; Radchenko, G.; Sokolinsky, L.; Zymbler, M. Digital Twin of City: Concept Overview. In Proceedings of the 2020 Global Smart Industry Conference (GloSIC), Chelyabinsk, Russia, 17–19 November 2020; p. 178. [Google Scholar]
  36. Jiang, F.; Ma, L.; Broyd, T.; Chen, K. Digital twin and its implementations in the civil engineering sector. Autom. Constr. 2021, 130, 103838. [Google Scholar] [CrossRef]
  37. The Institute of Engineering and Technology. Digital Twins for the Built Environment. 2019. Available online: https://www.theiet.org/media/8762/digital-twins-for-the-built-environment.pdf (accessed on 6 November 2021).
  38. Kaewunruen, S.; Xu, N. Digital Twin for Sustainability Evaluation of Railway Station Buildings. Front. Built Environ. 2018, 4, 77. [Google Scholar] [CrossRef]
  39. Kivimäki, T.; Heikkilä, R. Infra BIM Based Real-Time Quality Control of Infrastructure Construction Projects. In Proceedings of the 32nd ISARC, Oulu, Finland, 15–18 June 2015. [Google Scholar]
  40. Matejka, P. The Importance of a Transport Infrastructure Construction for The Implementation of BIM. 2014. Available online: https://www.fce.vutbr.cz/EKR/PBE/Proceedings/2014/027_14174.pdf (accessed on 2 April 2022).
  41. Giesekam, J. Capital Carbon of Transportation Infrastructure. 2020. Available online: http://www.jannikgiesekam.co.uk/research/presentations/Jannik_Giesekam_presentation_251120.pdf (accessed on 30 October 2021).
  42. Net Zero Infrastructure Industry Coalition. Is Our Carbon Wallet Empty? 2021. Available online: https://www.skanska.co.uk/498048/siteassets/about-skanska/media/features/embedded-carbon-infrastructure/nziic-embedded-carbon-in-infrastructure.pdf (accessed on 30 October 2021).
  43. Ramboll. Towards embodied carbon benchmarks for buildings in Europe. 2022. Available online: https://fs.hubspotusercontent00.net/hubfs/7520151/RMC/Content/EU-ECB-Summary-Report.pdf (accessed on 25 November 2022).
  44. Sloman, L.; Hopkinson, J. The Carbon Impact of the National Roads Programme. Transport for Quality of life. 2020. Available online: https://infrastructure.planninginspectorate.gov.uk/wp-content/ipc/uploads/projects/TR010044/TR010044-001655-TAN%20-%20The-carbon-impact-of-the-national-roads-programme-FINAL.pdf (accessed on 23 March 2022).
  45. UK BIM Alliance. State of the Nation Survey. 2021. Available online: https://www.ukbimalliance.org/wp-content/uploads/2021/06/UKBIMA-State-of-the-Nation-Survey-Report-2021.pdf (accessed on 2 November 2021).
  46. National Building Specification. 10th Annual BIM Report 2020. Available online: https://www.thenbs.com/bim-report-2020/23gxwk/Thank-you (accessed on 12 April 2022).
  47. Ayinla, K.O.; Adamu, Z. Bridging the digital divide gap in BIM technology adoption. Eng. Constr. Archit. Manag. 2018, 25, 1398–1416. [Google Scholar] [CrossRef]
  48. Vidalakis, C.; Abanda, F.H.; Oti, A.H. BIM adoption and implementation: Focusing on SMEs. Constr. Innov. 2020, 20, 128–147. [Google Scholar] [CrossRef]
  49. Lee, G.; Borrmann, A. BIM policy and management. Null 2020, 38, 413–419. [Google Scholar] [CrossRef]
  50. Broo, D.G.; Schooling, J. Digital twins in infrastructure: Definitions, current practices, challenges and strategies. Null 2021, 4, 1254–1263. [Google Scholar] [CrossRef]
  51. Animesh, D. Analysis of Pavement Structures, 1st ed.; CRC Press: Boca Raton, FL, USA, 2014. [Google Scholar]
  52. Mordue, S. Implementation of a Common Data Environment; The BIM Delivery Group for Scotland: Edinburgh, UK, 2018. [Google Scholar]
  53. Marsden, G.; Densley-Tngley, D.; Lokesh, K. Measuring Road Infrastructure Carbon: A ‘Critical’ in Transport’s Journey to Net-Zero; DecarboN8 Research Network: Leeds, UK, 2022. [Google Scholar]
  54. Krantz, J.; Lu, W.; Johansson, T.; Olofsson, T. Analysis of alternative road construction staging approaches to reduce carbon dioxide emissions. J. Clean. Prod. 2016, 143, 980–988. [Google Scholar] [CrossRef]
  55. Antön, L.A.; Diaz, J. Sustainable Construction Approach through Integration of LCA and BIM Tools. In Proceedings of the 2014 International Conference on Computing in Civil and Building Engineering, Orlando, FL, USA, 23–25 June 2014. [Google Scholar] [CrossRef]
  56. Soust-Verdaguer, B.; Llatas, C.; García-Martínez, A. Critical review of bim-based LCA method to buildings. Energy Build. 2017, 136, 110–120. [Google Scholar] [CrossRef]
  57. Dyson, J. Invention: A Life of Learning through Failure; Simon & Schuster: New York, NY, USA, 2021. [Google Scholar]
Figure 1. Transport Infrastructure expenditures [4].
Sustainability 16 07852 g001
Figure 2. Civil 3D workflow diagram.
Sustainability 16 07852 g002
Figure 3. D4M horizontal alignment.
Sustainability 16 07852 g003
Figure 4. D2AP horizontal alignment.
Sustainability 16 07852 g004
Figure 5. Proposed DM4 option 1 vertical profile, showing approximately 300 m of design.
Sustainability 16 07852 g005
Figure 6. Proposed DM4 option 1 vertical profile, showing the full length of design.
Sustainability 16 07852 g006
Figure 7. Civil 3D Assembly generated for D2AP design.
Sustainability 16 07852 g007
Figure 8. Demonstration of how Civil 3D Assembly design criteria can be amended to suit design requirements such as pavement depth.
Sustainability 16 07852 g008
Figure 9. Pavement design used for all design scenarios, total depth 565 mm.
Sustainability 16 07852 g009
Figure 10. CCT front sheet summary.
Sustainability 16 07852 g010
Figure 11. Demonstration of the confirmed link between the Civil 3D model and the CCT embedded within the software.
Sustainability 16 07852 g011
Figure 12. Cross section details produced from Civil 3D model, including cumulative volume of pavement materials.
Sustainability 16 07852 g012
Figure 13. Finalised D4M corridor in 3D Orbit, providing visual aid of the earthwork extents across the design.
Sustainability 16 07852 g013
Figure 14. Demonstration of the confirmed link between Civil 3D and the CCT.
Sustainability 16 07852 g014
Figure 15. Process of how Civil 3D and the CCT are linked.
Sustainability 16 07852 g015
Table 1. Typical PICO approach.
ComponentDescription/Considerations
PPopulation of interest and
how is this described
Country, race, gender, disability status
IInterventionWhat is and what is not required as part of the intervention
CComparisonWhat alternative is the intervention being compared to?
OOutcomeWhat is the expected outcome of the study?
Table 2. PICO method applied to this research.
ComponentDescription/Considerations
PPopulation United Kingdom’s Transportation Sector
IInterventionReviewing Building Information Modelling practises for
sustainability improvements in infrastructure projects
CComparisonUnited Kingdom Transportation Sector’s current
Carbon Emissions
OOutcomeNet Zero Carbon in the United Kingdom’s Transport Sector
Table 3. Inclusion and exclusion criteria.
Inclusion Criteria Exclusion Criteria
Date2009 to datePrior to 2009
Geographical LocationUnited Kingdom, America, Europe, ChinaNot located within geographical locations highlighted in ‘inclusion data’
LanguageEnglishPaper not in English
TypeOriginal Research papers and textbooksInformal/non-scientific data
PublicationsConference proceedings, government reports,
peer-reviewed articles, websites, published books, government government reports, professional interviews
Documents focussing on technical elements of transportation, BIM & Net Zero Carbon
ParticipantsProfessionals, organisations using BIMNon-professionals and those with no knowledge of BIM
DesignQuantitive, qualitative, case studies and surveysInformation documentation
FocusStudy must include information regarding BIM and its use to reduce carbon and GHGs or how to contribute towards Net Zero CarbonStudies with limited or no information regarding Net Zero Carbon
Table 4. Search timeframe.
Duration (Weeks)Phase
1Preparation and development of review protocol
1Identifying relevant studies
1Inclusion and exclusion assessment
2Analysis of findings
2Producing literature review
1Conclusion and recommendations
Table 5. Identified literature reviewed.
Author(s)Document TypeData InformationProduced in
Blanco and Chen [23] Journal articleSummary of the benefits and drawbacks of BIM when applied to the design, building and management of infrastructure projects in the UKUK
Omoregie and Turnbull [24]Journal articleA comparative study of traditional design methods against the use of BIM on a UK highway-related project. A qualitative study which included a questionnaire for Civil Engineering professionals.UK
Sanchez et al. [25]BookA study into the benefits of utilising BIM on infrastructure projects. The study highlights various literature documents to support the use of BIM and introduces its benefits and contributions towards sustainability. Australia
Liu, van Nederveen and Hertogh [26]Conference paperAn exploratory study into the links between BIM and sustainability with comparisons between Europe and China. The study identifies that BIM is more applied to maintenance and renovations in Europe compared to China, which is seen to be a more emerging economy, who has more of a BIM-related focus on new infrastructure. Holland
Zhao, Liu and Mbachu [27]Case studyThis study suggests that using BIM can enable designers to identify the most optimal design for large highway design schemes, which can therefore enable a more environmentally friendly design. The approach was applied to a design project and allowed designers to identify optimal designs quicker than traditional methods. Holland
D’Amico et al. [28]Journal articleA study of the application of BIM and GIS for airport designs. A case study of airport design was conducted with strong reference to Italian/European law. Italy
Whitlock et al. [29]Journal articleA study aimed at identifying how BIM can be used for logistic management of construction projects.UK
Schooling, Enzer and Broo [30]Journal articleAn ICE publication that identifies the need to see infrastructure as a benefit to people as opposed to cost-based metrics. As such, the paper suggests the environmental outcomes of infrastructure using BIM and how this can therefore contribute towards ‘human flourishing’.UK
Chong et al. [31]Journal articleA case study of a highway-related project in Australia and China. A BIM process was applied to the projects and found significant findings to suggest that using BIM was beneficial to the projects and found elements of sustainable practises to improve the project efficiency.USA
Shou et al. [32]Journal articleA study mainly based around the use of BIM in the building sector but demonstrates the progress required for BIM in infrastructure which can contribute towards more efficient design and construction.Holland
Shahat, Hyun and Yeom [33]GenericA study conducted on how to identify the benefits of Digital Twins and how BIM can contribute to the production of a Digital Twin.Korea
Wang, Zhang and Qin [34]Journal articleA study of Digital Twins that suggests only using BIM may have limitations and reports how the use of GS alone could provide just as relevant information.China
S. Ivanov et al. [35]Conference proceedingA study providing the concept of a Digital Twin City and its impact on the environment using advanced technologies.Russia
Jiang et al. [36]Journal articleThis article describes the differences between BIM and Digital Twins, concluding that BIM and DT can be combined and used simultaneously and confirming that DTs can promote and develop smart construction, which therefore can lead to a more efficient/environmentally friendly design through the effective use of BIM.UK
The institute of Engineering and Technology [37]ReportAn in-depth overview of Digital Twins and their primary functions whilst also reviewing how they can be implemented and what benefits they can bring, of which sustainable construction is identified. UK
Kaewunruen and Ningfang [38]Case studyCase study into the application of 6D BIM (DT) to Kings Cross Railway station. The study suggests there are benefits to using DTs to capture existing carbon footprints of railway infrastructure.UK
Kivimäki and Heikkilä [39]BookA paper reviewing the application of BIM-related project quality control, demonstrating the use of BIM during live construction to improve construction efficiency.Finland
Matejka [40]Journal articleA study conducted to identify how BIM can improve highway construction and who the main beneficiaries are. Czech Republic
Table 6. Highway design scenarios.
Highway ScenarioDesign ApproachCross Section Layout Derived FromHorizontal Curvature Derived FromVertical Curvature Derived From
Dual 4-lane motorway (D4M)Design at gradeDesign Manual for Roads and Bridges
CD 127 Version 1.0.1
Figure 2.1.1N1a
Design Manual for Roads and Bridges
CD 109 Revision 1
Table 2.1
Design Manual for Roads and Bridges
CD 109 Revision 1
Table 2.1
minimal vertical curvature with one low point
Dual 2-lane all-purpose (D2AP)Design at gradeDesign Manual for Roads and Bridges
CD 127 Version 1.0.1
Figure 2.1.1N1e
minimal vertical curvature with one low point
Table 7. Results generated by the CCT for each design scenario.
Design OptionOption DescriptionEmbodied CO2 (Tonnes)
D2AP—Dual 2-Lane all purpose—Option 1At grade two-lane dual carriageway design193.22
D2AP—Dual 2-Lane all purpose—Option 2Two-lane Dual Carriageway design with minimal curvature212.91
D4M—Dual 4-Lane motorway—Option 1At grade-four lane motorway design335
D4M—Dual 4-Lane motorway—Option 2Four-lane motorway design with minimal curvature306.85
Disclaimer/Publisher’s Note: The statements, opinions and data contained in all publications are solely those of the individual author(s) and contributor(s) and not of MDPI and/or the editor(s). MDPI and/or the editor(s) disclaim responsibility for any injury to people or property resulting from any ideas, methods, instructions or products referred to in the content.

