Article

Simulation of a Hazardous Chemical Cascading Accident Using the Graph Neural Network

by
Wenqi Cui
1,
Xinwu Chen
1,
Weisong Li
1,
Kunjing Li
1,
Kaiwen Liu
1,
Zhanyun Feng
2,
Jiale Chen
2,
Yueling Tian
2,
Boyu Chen
3,
Xianfeng Chen
4 and
Wei Cui
2,*
1
Experimental Teaching Center, Hubei University of Economics, Wuhan 430205, China
2
School of Resource and Environmental Engineering, Wuhan University of Technology, Wuhan 430070, China
3
Wuhan Ulink College of China Optics Valley, Wuhan 430205, China
4
School of Safety Science and Emergency Managent, Wuhan University of Technology, Wuhan 430070, China
*
Author to whom correspondence should be addressed.
Sustainability 2024, 16(18), 7880; https://doi.org/10.3390/su16187880
Submission received: 9 August 2024 / Revised: 29 August 2024 / Accepted: 5 September 2024 / Published: 10 September 2024
(This article belongs to the Section Hazards and Sustainability)

Abstract

:
In the storage of hazardous chemicals, due to space limitations, various hazardous chemicals are usually mixed stored when their chemical properties do not conflict. In a fire or other accidents during storage, the emergency response includes two key steps: first, using fire extinguishers like dry powder and carbon dioxide to extinguish the burning hazardous chemicals. In addition, hazardous chemicals around the accident site are often watered to cool down to prevent the spread of the fire. But both the water and extinguishers may react chemically with hazardous chemicals at the accident site, potentially triggering secondary accidents. However, the existing research about hazardous chemical domino accidents only focuses on the pre-rescue stage and ignores the simulation of rescue-induced accidents that occur after rescue. Aiming at the problem, a quantitative representation algorithm for the spatial correlation of hazardous chemicals is first proposed to enhance the understanding of their spatial relationships. Subsequently, a graph neural network is introduced to simulate the evolution process of hazardous chemical cascade accidents. By aggregating the physical and chemical characteristics, the initial accident information of nodes, and bi-temporal node status information, deep learning models have gained the ability to accurately predict node states, thereby improving the intelligent simulation of hazardous chemical accidents. The experimental results validated the effectiveness of the method.

1. Introduction

In the storage of hazardous chemicals, due to limited space, various types of hazardous chemicals are often stored together when they do not have conflicting chemical properties. In such cases, to ensure the safety of hazardous chemical storage, the “General Rules for the Storage of Hazardous Chemicals in Warehouses” (GB15603-2022) [1] has been officially implemented since 1 July 2023. The standard explicitly outlines the contraindications for storing various types of hazardous chemicals while also stating that hazardous chemicals may be stored together if their physical and chemical properties do not conflict, thereby optimizing storage space. However, in the event of accidents such as fires during storage, the emergency response includes two key steps: first, using fire-extinguishing agents such as dry powder and carbon dioxide to extinguish the burning hazardous chemicals; second, cooling and protecting surrounding containers of other hazardous chemicals with water to prevent the spread of the fire. But both the water and extinguishing agents may react chemically with other hazardous chemicals at the accident site, potentially triggering secondary accidents. This paper refers to them as cascade accidents: additional hazardous chemical incidents that are directly triggered by the emergency response to a hazardous chemical reaction following an initial hazardous chemical accident.
The “General Rules for the Storage of Hazardous Chemicals Warehouses” (GB 15603-2022) [1] outlines three storage methods: “cut-off storage”, “detached storage”, and “segregated storage”. However, in the event of firefighting using agents like dry powder and carbon dioxide to manage burning chemical incidents, the flammable gases produced from the interaction of stored hazardous chemicals with water may diffuse beyond division plates, creating flammable and explosive vapor clouds. This disrupts the original chemical storage equilibrium and sets off chain reactions, as exemplified by the significant fire and explosion incident at Tianjin Port on “8.12”. Consequently, research on the dynamic storage matching rules of hazardous chemicals in dynamic and open settings involves intricate chemical reactions, uncontrollable hazardous by-products, and their spatial interconnections, necessitating interdisciplinary cooperation to develop novel mechanisms and establish the groundwork for subsequent simulations.
Current accident chain studies [2,3,4,5,6,7,8,9,10,11,12] concentrate on the natural progression of hazardous chemical accidents without human intervention, commonly referred to as domino accidents. These studies primarily examine the evolution of accidents from the initial event to the execution of emergency measures within a defined timeframe [2,3,4]. Accident chain simulations frequently regard the implementation of emergency measures as the endpoint, leading to an incomplete accident chain and neglecting the risks associated with inadequate emergency responses, which can trigger additional secondary accidents, thereby extending the chain of incidents.
In response to the above issue, a study on cascading accidents involving hazardous chemicals is proposed. Cascading accidents refer to the situation where after a hazardous chemical accident occurs, the conventional fire-extinguishing agents and neutralizers used react with the stored hazardous chemicals, producing flammable gases and forming flammable and explosive vapor clouds. These vapor clouds spread and reach their ignition points or explosion limits, resulting in combustion and explosion, thus triggering a chain reaction of secondary accidents. Such accidents are characterized by a focus on the chemical reactions between the emergency fire extinguishers and neutralizers used in response to the accident and other hazardous chemicals in proximity, exacerbating the consequences of the accident.
Currently, there are two urgent issues that need to be addressed in the research on cascading accidents involving hazardous chemical storage.

1.1. Challenges in Quantitatively Characterizing the Spatial Relationships among Hazardous Chemicals

The intricate spatial relationship among hazardous chemicals influences the occurrence and progression of cascading accidents; however, the existing location strategy based on Euclidean distance [13] presents several issues.
As illustrated in Figure 1, two spatially non-adjacent objects maintain the same distance from the center of mass, as indicated in the table. However, the correlation between the two objects in Figure 1II is stronger than that between the objects in Figure 1I due to the difference in area between them. Consequently, the likelihood of cascade accidents is higher in Figure 1II than in Figure 1I, and neither the traditional Euclidean distance formulations nor the defining contingent spatial relations can adequately capture the distinction between them. The Table 1 shows their centroid Euclidean distance and the spatial relationships.

1.2. Challenges in Information Fusion Mechanisms for Various Relationships

The mechanisms that trigger cascading accidents involving hazardous chemicals, along with the critical conditions and evolutionary processes, are intricate and highly unpredictable. This complexity necessitates new theoretical and technical support for simulation studies. Traditional firefighting methods encompass multiple elements, such as the hazardous substance, the affected entity, firefighting agents, neutralizers, and newly formed flammable and explosive compounds resulting from chemical reactions, leading to a multitude of interconnected factors (n ≥ 5). To address the complexity and randomness inherent in these mechanisms, conditions, and processes, theoretical and technical assistance from deep neural networks in artificial intelligence is crucial for conducting simulations in a more scientific and efficient manner.
This study conducts research on the emergency simulation of cascading accidents involving hazardous chemicals using the pyramid spatial distance and graph neural network. It explores the key conditions of triggering cascading accidents in the specific scenario of hazardous chemical storage, considering factors such as pyramid spatial distance and the conditions of cascading chemical reactions. Subsequently, it utilizes graph neural networks to predict the occurrence and development process of cascading accidents involving hazardous chemicals, clarifying the evolution direction and path of such accidents. This enables emergency simulation considering the superimposed effects of cascading accidents involving hazardous chemicals under different emergency measures, thereby providing more scientific decision support for emergency rescue operations.
In the simulation of hazardous chemical accidents, research is conducted based on hazardous chemical objects as the fundamental units. Therefore, both GCN and GAT are effective. However, GAT emphasizes the attention mechanism while relying on the graph’s topological structure, allowing it to focus more on the states of neighboring nodes that have a greater impact on the state changes of the central node after training while somewhat disregarding the interference from less significant nodes. This makes it particularly suitable for the application scenario of hazardous chemical simulation in this paper. In contrast, GCN’s working mechanism relies more on the graph’s topological structure and is not able to specifically predict the state changes of the central node based on the states and features of key neighbors to the same extent as GAT, which is why this paper chooses GAT as the foundational model.
This article introduces the following innovations:
(1)
Introducing the definition of cascading accidents and studying the evolution of accidents after the intervention of emergency rescue measures, filling the gap in traditional accident chains (domino effect), which focus on the period from accident occurrence to the beginning of emergency intervention. This provides a new approach to explore complete accident chain simulation.
(2)
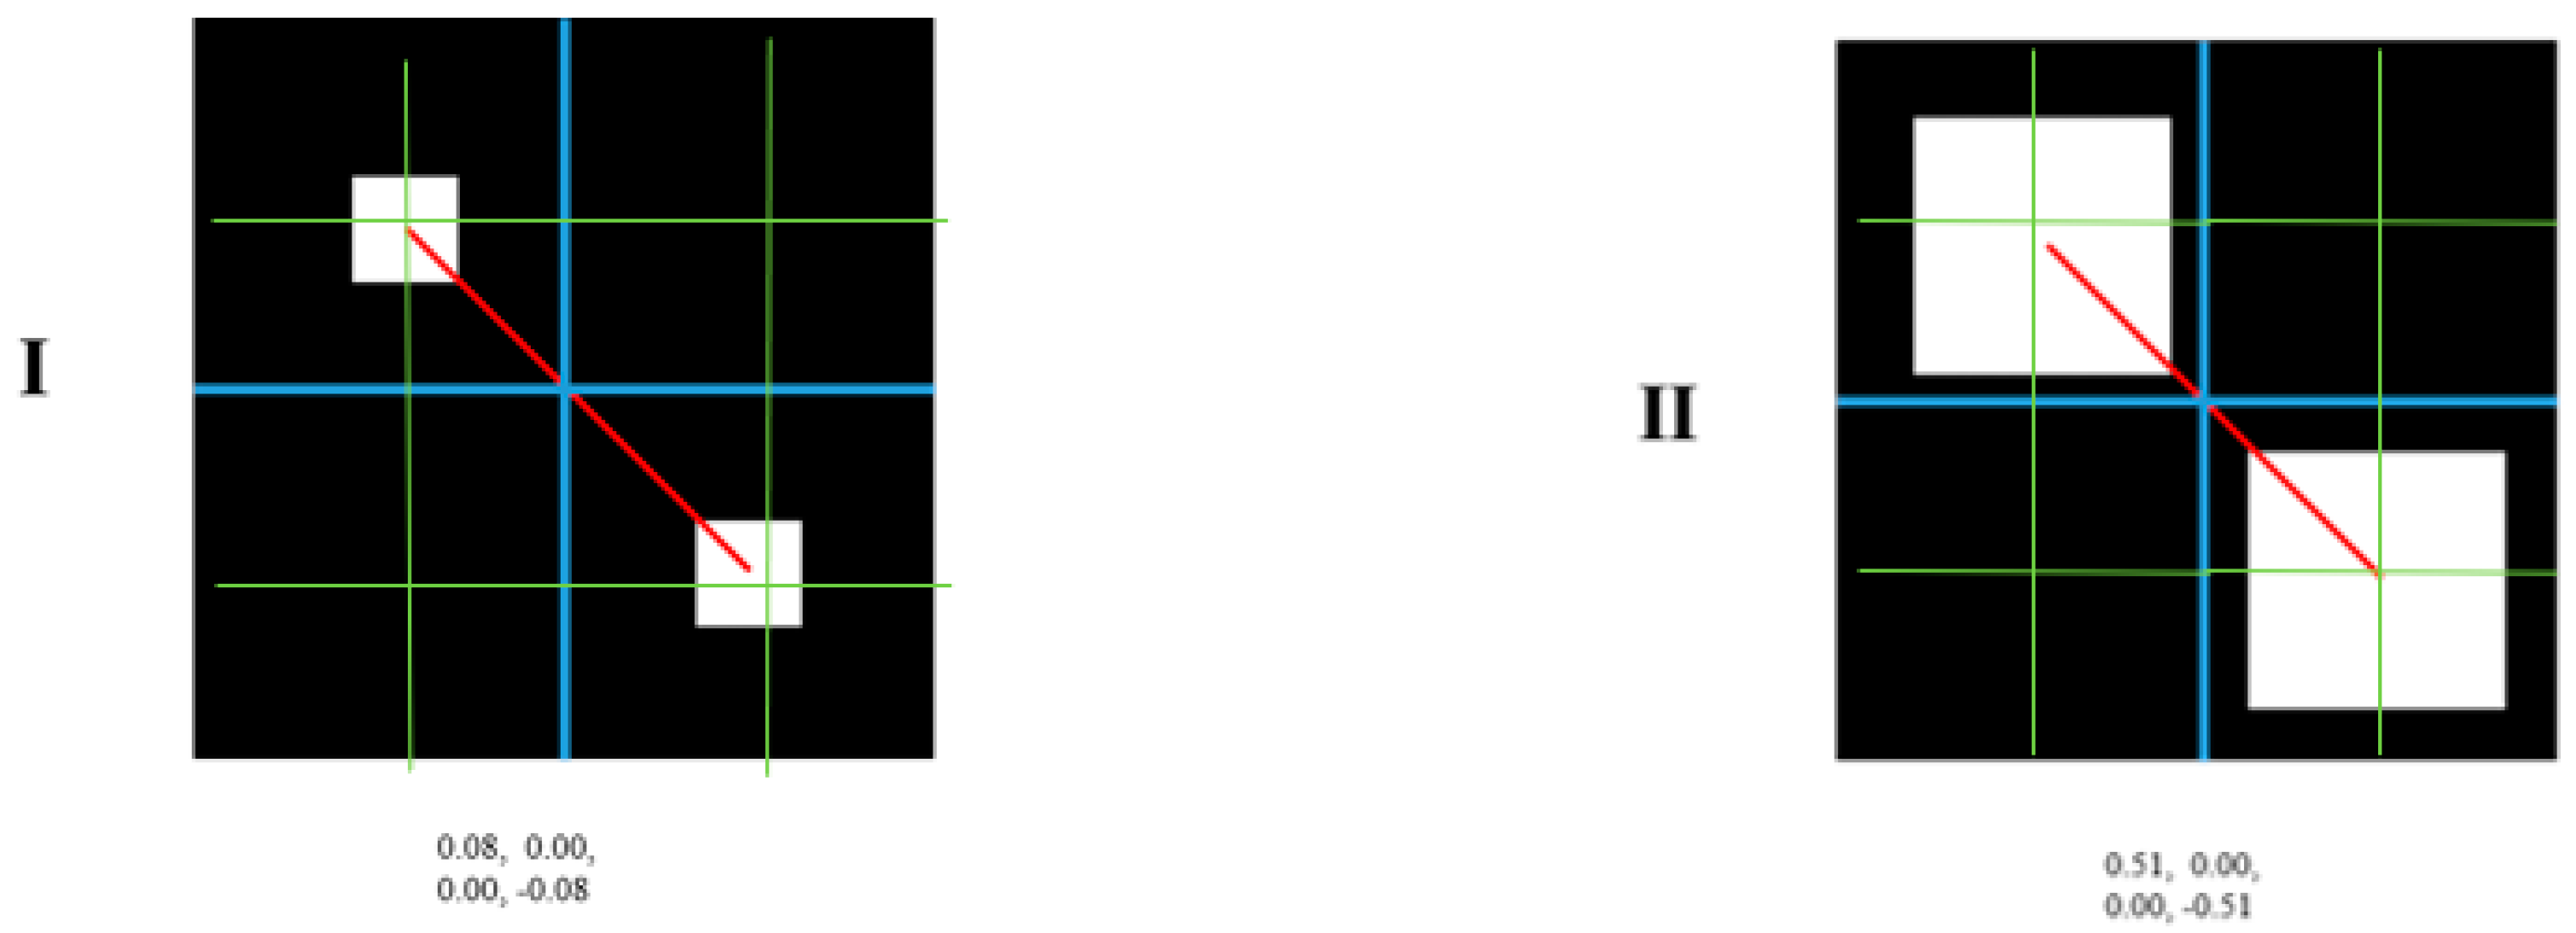
Proposing a quantitative representation algorithm for the spatial correlation of dangerous chemicals based on the pyramid spatial positioning mechanism, which enriches the understanding of dangerous chemicals’ spatial correlation, better reflecting the mutual influence between dangerous chemicals.
(3)
A simulation mechanism based on a graph neural network for hazardous chemical cascade accidents is proposed. By leveraging deep learning models in graph space, it comprehensively considers the cumulative impacts of cascading accidents resulting from standard emergency measures, thereby improving the real-time and scientific aspects of the simulation process. The integration of artificial intelligence technologies like graph neural networks can advance emergency responses to hazardous chemical incidents to a more intelligent and scientific level.
The research presented in this paper is an extension of the existing simulation studies on hazardous chemical domino accidents, focusing on the new round of accidents (referred to as “cascading accidents” in this paper) triggered by commonly used measures initially intended to mitigate the situation after the intervention in the emergency response to hazardous chemical accidents. This enhances the completeness of simulation studies on hazardous chemical accidents.
The remainder of the paper is organized as follows: Section 2 presents a literature review of previous research on hazardous chemicals accident simulations and their essential technologies. Section 3 describes the details of spatial location using the pyramid approach. Section 4 presents a cascading accident simulation of hazardous chemicals based on graph attention networks. The experiment and analysis are illustrated in Section 5, and the conclusions are presented in the final section.

2. Related Works

2.1. Accident Chain

Currently, most of the hazardous chemical storage in our country is concentrated, with high density and numerous hazardous factors. When accidents occur, they often affect other hazardous chemicals in the surrounding area, forming an “accident chain”. The accident chain refers to a chain reaction of secondary accidents triggered by the initial accident due to the unreasonable matching of disaster-causing elements, emergency supplies, and disaster-bearing elements within the accident system in a specific time and space, thus forming a cascade and amplification effect [5], also known as the domino effect. This process belongs to the category of safety correlation, which studies the specific safety linkage relationship established between the various elements of the safety system through a certain medium component [6]. The cascading accidents of hazardous chemicals in this paper are a type of safety linkage.
The core of the hazardous chemical accident chain is the extension and impact amplification of the accident. It includes three basic elements: the initial accident scene and physical impacts, such as fire heat radiation, explosion shock waves, etc.; potential secondary expansion accident scenes, which stem from the extension and spread of the initial accident, such as hazardous chemical leakage, etc.; and the equipment or unit for the amplification of the impact [7].
Currently, there are various theories or methods used for accident chain research, among which Bayesian networks are widely applied, with experts attempting to find the causal relationships in the natural evolution process of hazardous chemical storage accidents from past cases and establish the corresponding Bayesian network model diagrams, thus proposing measures for disaster reduction. Similar research has been effectively applied in the construction of models for the consequences of ammonia accidents [8] and the chain model of drought-forest fire disasters [9]. K-means clustering analysis has also been used to select the strongest nodes associated with accident chains [10], and scholars have used hypergraph theory to construct a sudden disaster network model to describe accident chains [11].
The accident chain has been widely applied in different fields. In the field of hazardous chemicals, scholars have focused on the coupling of risks derived from hazardous chemical accidents and secondary disasters and have analyzed the mechanisms of accident evolution [12].
There is still considerable room for improvement in studying the superimposed effects of cascading accidents triggered by inappropriate human factors in emergencies (i.e., emergency measures effective for a certain hazardous chemical could trigger accidents in the surrounding area). We have found a total of 20 papers about the simulation of hazardous chemical accidents, and 18 of them focus on simulating the evolution process of the accidents without considering intervention, treating these interventions of emergency measures as the endpoint of the simulation [2]. Therefore, the simulation of cascading accidents of hazardous chemicals triggered by commonly used emergency measures has a high research value.

2.2. Simulation of Hazardous Chemical Accidents

The scientific emergency response to hazardous chemical accidents relies on the accurate sense of the situation of the accidents and the prediction of their development. In this case, the simulation is an effective method. Hazardous chemical accident simulation is the reproduction of the occurrence and evolution of accidents, with the aim of fully understanding the elements of the accident and its state.
The simulation of hazardous chemical accidents is mainly used to explore the laws of accident evolution, predictions of accidents, emergency response to accidents, determination of accident sources, and risk assessment.
In terms of exploring the laws of accident evolution and the occurrence and prediction of hazardous chemical accidents, relevant research has used Bayesian networks [14,15,16,17], analytic hierarchy processes [18,19], CFD technology [20,21,22,23,24,25], fault tree analysis [26], and other methods to simulate and reconstruct the process of the occurrence and evolution of some hazardous chemical accidents and explore the laws of accident evolution.
In terms of emergency response, common methods currently include Bayesian networks [27], GIS technology [28], etc. Relevant scholars have used these methods to simulate the evolution process of accidents such as hazardous chemical fires, explosions, and gas leaks; have analyzed the influencing factors, such as toxic gas concentration, personnel injury probability, and accident impact range; and, based on this, have predicted the expected number of deaths and accident consequence level and determined the evacuation path of affected personnel.
In terms of accident source confirmation and risk assessment, some scholars have used grey relational analysis to determine the source of hazardous chemical leakage [29].

2.3. Graph Neural Networks

This paper utilized graph neural network technology [30] in the simulation process of hazardous chemical cascading accidents. Traditional deep neural networks [31,32,33] commonly used in Euclidean space can only handle homogeneous neighborhood spaces, whereas graph neural networks abstract real problems into graph structures in graph space, enabling information propagation between nodes [34].
Research on using graph neural networks for emergency simulation of hazardous chemical accidents has not been found yet. This paper takes a unique approach by integrating this cutting-edge technology from the field of artificial intelligence into the emergency simulation of hazardous chemical accidents. By enhancing the simulation process’s perception of the environment and information aggregation capabilities regarding hazardous chemical cascading accidents, we aim to ensure the real-time and scientific nature of simulation results, providing more scientific decision support for emergency responses to hazardous chemical accidents.

3. The Spatial Location of Pyramid Approach

3.1. A Dynamic Renewal of the Spread Distance

In this paper, sodium cyanide serves as the origin for the spatial pyramid coordinate system, aiding in the calculation of hydrogen cyanide vapor cloud diffusion. Consequently, the diffusion of the hydrogen cyanide vapor cloud exhibits a concentric circular diffusion pattern centered on the coordinate origin. The pyramid coordinates are encoded in a multiscale quadrature raster pattern, which represents the multiscale location and contour information of hazardous chemicals.
In the “8.12” explosion accident, the firefighting operation started at 22:46. When water contacted with sodium cyanide on-site, a chemical reaction occurred to produce hydrogen cyanide, which then began to diffuse. A total of 1000 s later, hydrogen cyanide reached the burning nitrocellulose. At this time, hydrogen cyanide had already diffused 30 m. Afterward, at 23:34:06, when the first explosion occurred, nitrocellulose exploded along with ammonium nitrate. According to the remote sensing image of the explosion scene, when hydrogen cyanide diffused to ammonium nitrate, it had already diffused 56 m.
According to reference [35], the relationship between the diffuse distance of hydrogen cyanide and its volume flow rate can be calculated through the following equation:
R t = 4 3 0.75 × C E 0.5 × ρ 2 π × V 0.25 × t 0.75
where Rt is the radius of the area in which the cloud might be ignited at time t; cE is an empirical constant approximately equal to 1. In this paper, this parameter is taken as 1; V is the volume flow rate of the flammable gas; and ρ is the vapor density relative to air.
Taking the 56 m where hydrogen cyanide diffused to ammonium nitrate as a condition, the volume flow rate of hydrogen cyanide (V) was determined as 0.00225 based on the above-mentioned equation and some essential experiences. The Figure 2 has shown the process of the vapor diffusion.

3.2. Construction of a Model of Hazardous Chemical Accident Scenes Based on Pyramid Coding

To accurately quantify the spatial correlation between hazardous chemicals, a spatial pyramid position coding algorithm is proposed, which suggests using pyramid space distance to construct the accident scene. The algorithm employs a multiscale pyramid average pooling method to obtain the positioning information of hazardous chemicals, emphasizing the representation of their shape, outline, and area. This spatial pyramid location information serves as input to the graph neural network in the subsequent step, enabling the network to assess the likelihood of cascading accidents and the evolutionary progression based on the spatial correlation of hazardous chemicals.
The algorithm is outlined as follows Algorithm 1:
Algorithm 1 Spatial Pyramid Localization
Input: ln (n ∊ [1,N]), the shape and area of nodes (hazardous chemical); L, location of the accident scene.
Output: pyramid coordinates of nodes.
1 Begin:
2     L n w i , L n e i , L s w i , L s e i = Spatial Division(L) //Divide the two-dimensional space into
        //four quadrants; i represents the level of a multi-level pyramid. The starting value is 1.
3     while  ln in { L n w i , L n e i , L s w i , L s e i } do        //
4        s n i = s n i || a r e a l n L k i a r e a L k i //Spatial encoding at i levels by the ratio of hazardous chemical coverage
5         // area within the L k i ; L k i  ∊ { L n w i , L n e i , L s w i , L s e i  }; the ‘||’ operator signifies a vector join.
6     end while
7     if       0 < s n i 0.5  then      // Recursive processing:
8           L = L k i
9           i = i + 1     //If the ratio is less than 0.5 increas i by 1,
10          goto setp2;    // and return to step 2; otherwise, proceed to next step.
11      k e y n i = Z-order( s n i )   // Ultimately, Z-order algorithm is used to reduce the dimension of the
12                        //two-dimensional raster space to one-dimensional coding.
13     k e y n i = paddint( k e y n i ,0) //aligned by padding with zeros in the grid
14    output( k e y n i )
15 End
The algorithm is divided into five sections, which are detailed below:
Spatial division: Divide the two-dimensional space into four quadrants by splitting it into four equally sized regions: L n w i , L n e i , L s w i , and L s e i . These represent the northwest quadrant, northeast quadrant, southwest quadrant, and southeast quadrant, respectively.
Multiscale quadrant encoding: spatial encoding at n levels is defined by the ratio of the hazardous chemical coverage area within grid L k i to the total area of the grid.
Recursive processing: if the ratio of the hazardous material area to the grid area is less than 0.5 for each grid, the grid requires further division, increasing i by 1, and returning to spatial division; otherwise, proceed to the next step.
Encoding representation (traversal rule): the Z-order algorithm is employed to reduce the dimensionality of the two-dimensional raster space to one-dimensional coding.
Alignment: According to the deepest coding, all hazardous chemicals’ pyramid coordinates share the same length, aligned by padding with zeros in the grid areas not occupied by dangerous chemicals. This leads to the final output of pyramid positioning coordinates for hazardous materials.

3.3. The Advantage of Pyramid Coding

The multiscale pyramid coordinates generally provide precise information about the location of hazardous chemicals by offering values across different quadrants or grids. Additionally, the ratio of hazardous chemical coverage to multiscale grids accurately represents the extent of the hazardous chemical area. This approach combines spatial positioning and contour descriptions as semantic information.
Compared to the traditional Euclidean spatial distance for hazardous chemicals, this paper presents pyramid spatial distance, which provides distinct comparative advantages. Figure 1 illustrates the pyramid spatial coding of hazardous chemicals in two different scenarios.
As depicted in Table 2, the Euclidean distances between the hazardous substance centroids in Figure 1I,II (highlighted by the red line) are identical, showing spatial disjointedness. It is challenging to differentiate between the two scenarios.
Nevertheless, the pyramid spatial coding mechanism integrates data on the shape and area of hazardous substances during the average pooling process. Consequently, there is a notable distinction in the distance vector derived from subtracting the pyramid positioning coding for Figure 1I,II. The pyramid spatial coding mechanism integrates data on the shape and area of hazardous chemicals. After pooling and training, the distance vectors derived from Figure 1I,II (the different bits of the two distance vectors are highlighted in bold), which integrated the pyramid positional encoding, show significant changes. This distinction will serve as a basis for subsequent spatial correlation modeling of hazardous substances based on pyramid spatial distances.

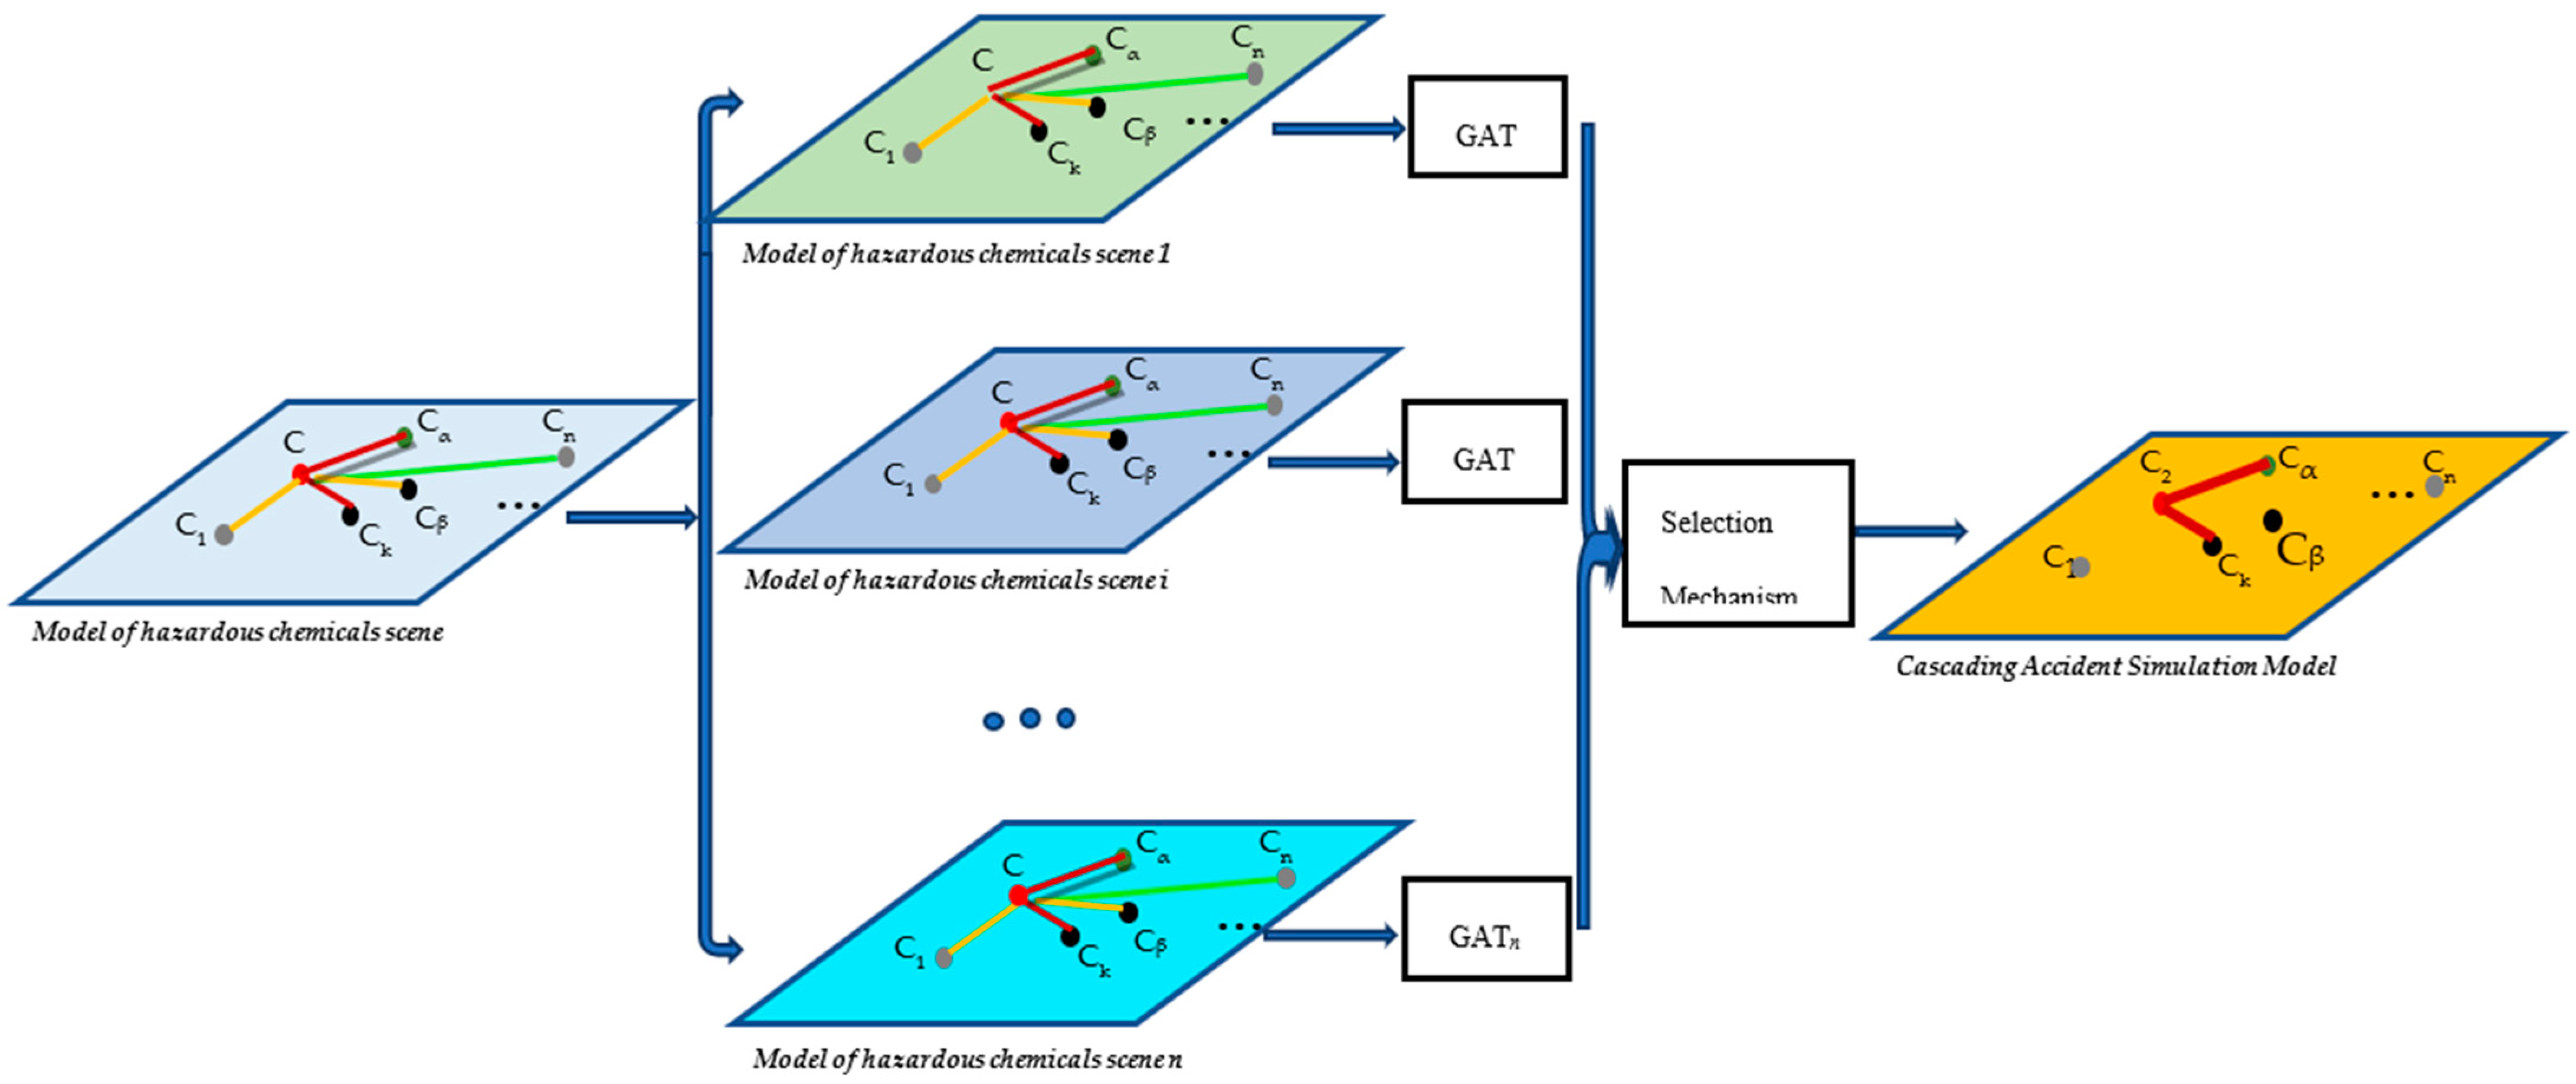
4. Cascading Accident Simulation of Hazardous Chemicals Based on Graph Attention Networks

The CASH-GAT model for hazardous chemical scenarios integrates spatial correlation data, critical conditions for triggering cascading accidents, and multidimensional knowledge of cascading accidents, including the physical and chemical properties of hazardous substances. Graph neural networks are utilized to establish links between hazardous chemicals based on their spatial distances. The graph aggregation function aggregates the states and features of neighboring hazardous chemicals to the central node where a cascade accident may occur. Supervised learning is applied to train the model to predict changes in node states. The CASH-GAT model consists of the following two components.

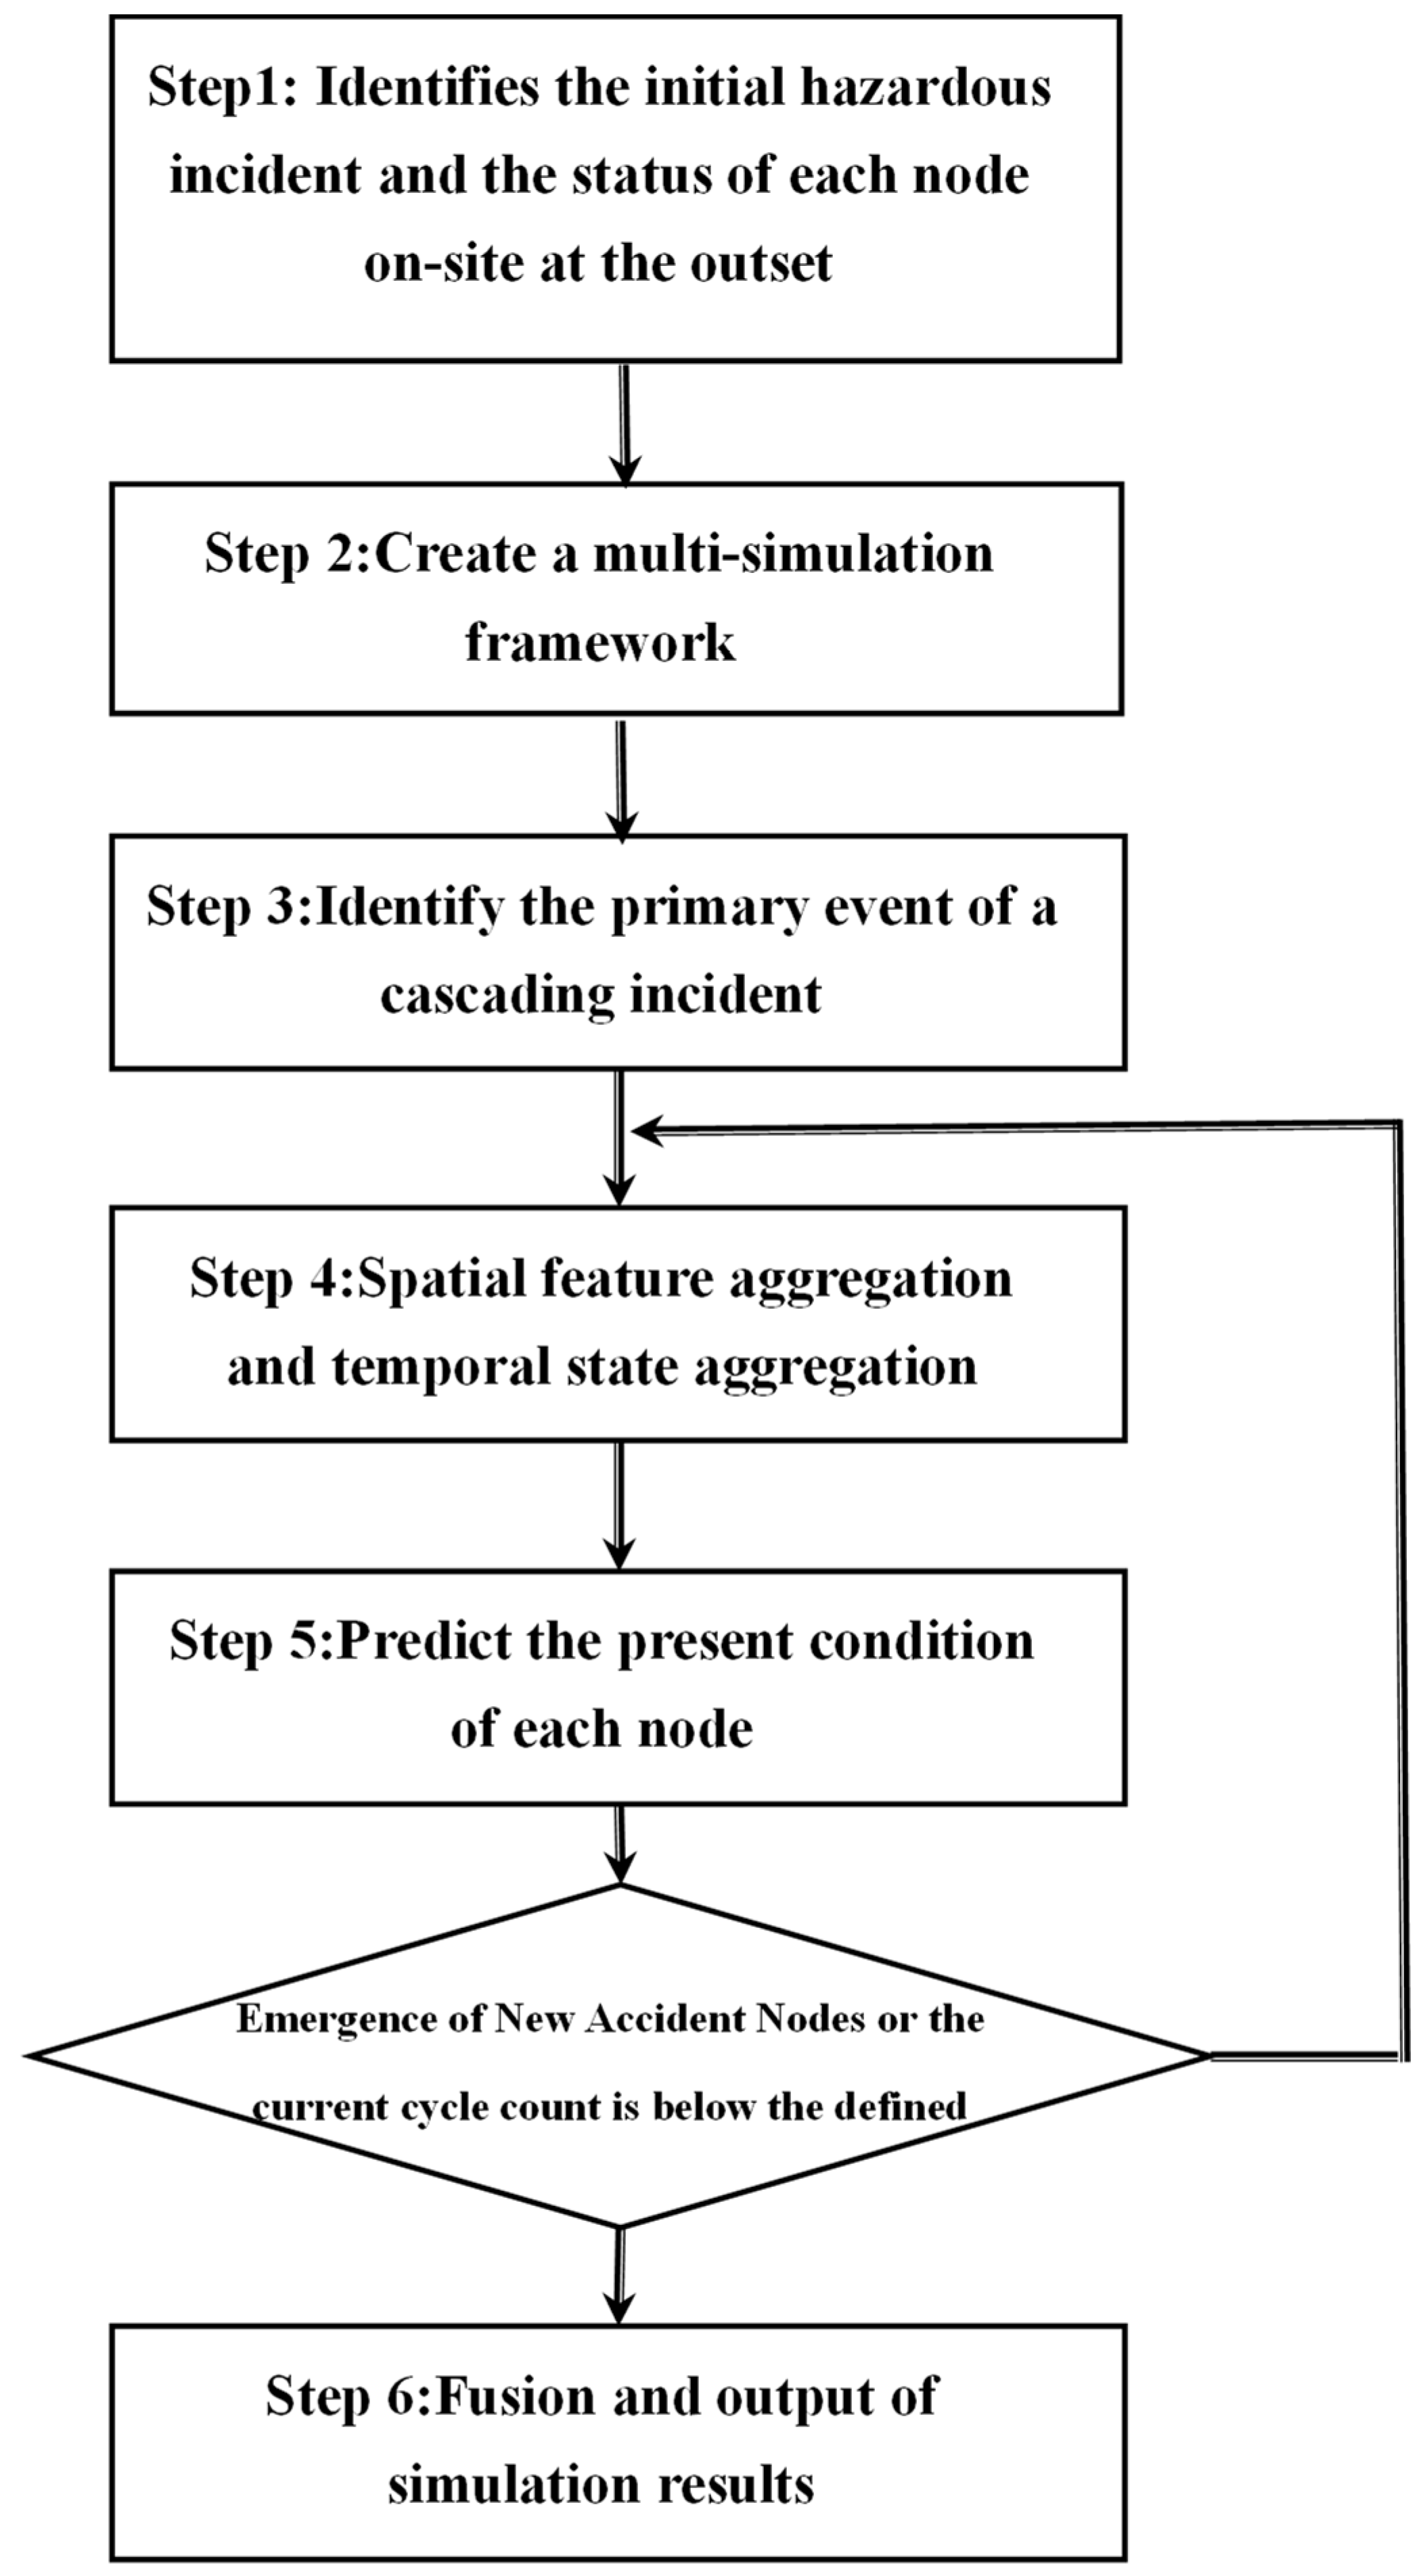
4.1. Parallel and Dynamic Simulation Strategy Design

Based on the analysis of the chemical reactions involving the extinguishing and neutralizing agents of various emergency measures with the hazardous chemicals near the central node, as well as the physicochemical properties of their hazardous products, the occurrence and evolution of cascading accidents are simulated using graph-attentive neural networks.
In Figure 3, firstly, we construct a multi-layered parallel emergency response framework corresponding to cascading accident simulations (from layer 1 to layer n − 1) and a natural diffusion simulation layer (layer n). In the cascading accident layers, hazardous chemicals involved in accidents are selected as the head node: h = node Cα, Cα ∊ {C1,…, CM}. Then, we traverse through different keys ki one by one, generating the i-th scenario graph corresponding to the conventional emergency response ki, which represents the occurrence of a dangerous chemical reaction with the tail node t = node Cβ, (αβ), where Cβ is an adjacent node to Cα that will chemically react with the extinguishing or neutralizing agent, releasing additional flammable and explosive substances vi.
Simultaneously, we incorporate an additional hazardous chemical scenario graph to simulate the propagation and diffusion process of hazardous chemical accidents in the absence of human interference.
Then, we simulate accident scenarios at different levels, embedding spatial information, physical and chemical characteristics, and other multidimensional data on the cascade accidents of hazardous chemicals based on graph neural networks using aggregation mechanisms, to achieve emergency simulation when conventional emergency measures ki are adopted.
In the Figure 4, the specific steps are as follows:
  • Step 1: Initialization: Identify the initial hazardous incident and the status of each node on-site at the outset.
Select the hazardous chemicals involved in the accident as the initial node for cascading accident layers: h = node Cα, and then iterate through different emergency measures ki one by one; generate the i-th scenario graph corresponding to the conventional emergency measure, representing the occurrence of a chemical reaction causing the release of flammable and explosive hazardous chemical vi when applying emergency measure ki to the accident node and meeting the triggering critical condition of the neighbor node t = node Cβ, (αβ).
  • Step 2: Create a multi-simulation framework.
Construct a multi-simulation layer corresponding to emergency measure ki. Add an additional layer of scenario graphs without corresponding hazardous chemicals to simulate the propagation and diffusion process of hazardous chemical accidents in the absence of human interference. Construct an adjacency matrix of cascading accidents between hazardous chemicals based on spatial pyramid distances and the physicochemical properties of these substances.
  • Step 3: Identify the primary event of a cascading incident.
Identify additional flammable and explosive hazardous chemicals that arise from the chemical reaction between the emergency response extinguishing or neutralizing agent and the hazardous chemicals near the incident node.
  • Step 4: Spatial feature aggregation and temporal state aggregation.
Utilize the aggregation mechanism of graph neural networks to sequentially aggregate the current states of hazardous chemicals alongside adjacent hazardous chemicals and the states of flammable and explosive products triggered by them.
  • Step 5: Predict the present condition of each node.
Then, predict and update their states to conduct an emergency simulation when utilizing conventional emergency measures. Determine if a new fault node has emerged or if a specified number of cycles has been reached. If so, proceed to Step 4 with the new accident point as the focal point; if not, proceed to Step 6.
  • Step 6: Fusion and output of simulation results.
Finally, employ a selection mechanism to compare and overlay the simulation results without human intervention, thereby forming a comprehensive simulation outcome based on the cascade knowledge superposition effect of accidents.
This approach considers the factors of other hazardous chemicals in the same accident space in the hazardous chemical accident state obtained, making the perceived state more comprehensive and accurate. The predictive model can continuously update the states of hazardous chemicals through the iteration of graph neural networks, simulating the development process of hazardous chemical accidents and providing decision support for the dynamic emergency response to storing hazardous chemical cascade accidents.
This approach considers additional flammable and explosive hazardous chemicals within the same accident context, enhancing the comprehensiveness and accuracy of the perceived state. The predictive model can continuously update the states of hazardous chemicals through iterations of graph neural networks, simulating the progression of hazardous chemical accidents and offering decision support for dynamic emergency responses to cascading hazardous chemical incidents.
The key to the above simulation process is to perceive the state of hazardous chemicals through the aggregation function in the graph neural network. It explores two ways: designing an injective aggregation function or adding node-centric subgraph information in the aggregation function. This allows for the aggregation of neighboring nodes’ chemical features, state information, and the subgraph structure (environment) centered around them simultaneously. This enables accurate and efficient simulation of complex emergency responses to accidents. The detailed description is shown below:
The crucial aspect of the simulation process outlined above is to understand the state of hazardous chemicals via the aggregation function in the graph neural network. It investigates two approaches: creating an injective aggregation function or incorporating node-centric subgraph information into the aggregation function. This facilitates the simultaneous aggregation of neighboring nodes’ chemical features, state information, and the subgraph structure (environment) surrounding them. Consequently, it allows for precise and efficient simulation of complex emergency responses to accidents. A detailed description is provided below.

4.2. The Design of Graph Aggregation Function

An injective aggregation function that is sensitive to the structure of the graph is designed, enhancing the aggregation of graph structure information based on the aggregation of point-to-point information of neighboring nodes; in a graph neural network, the central node v first aggregates information from its neighboring nodes.

4.2.1. Spatial Information Aggregation

In a graph neural network, the central node v first aggregates information from its neighboring nodes:
a v = A G G R E G A T E ( { α v u h u : u   N ( v )   a n d     u   v   } )
where v means the central node, and N(v) is a neighboring node of v. α v u is a weighting matrix.
Then, the status of v is renewed according to the following formula:
h v = C O M B I N E   ( h v , a v )
The aggregation of the spatial information of nodes is shown in Figure 5.

4.2.2. Bi-Temporal Information Aggregation

The aggregated information encompasses both spatial and temporal data regarding each hazardous chemical in the scene. The spatial data includes the physical and chemical properties of the hazardous chemical, the diffusion range of hydrogen cyanide, and the spatial correlation of each node (pyramid positioning and its adjacency matrix) within the scene graph of the accident at the current moment. The temporal data reflects the state of each node from the previous moment, enabling the prediction of the current state of each node in the accident based on the characteristics of the hazardous chemical, their spatial relationships, and the previous states of each node. This allows for an accurate prediction of the new state of each node in the accident.
s v t = C O M B I N E t ( h v t , s v t 1 )
where s v t and s v t 1 are the states of the v node at time t and its previous time, respectively; h v t is the feature vector of the v node at time t following spatial aggregation. The precess of bi-temporal information aggregation is shown in the Figure 6.

5. Experiment and Result Analysis

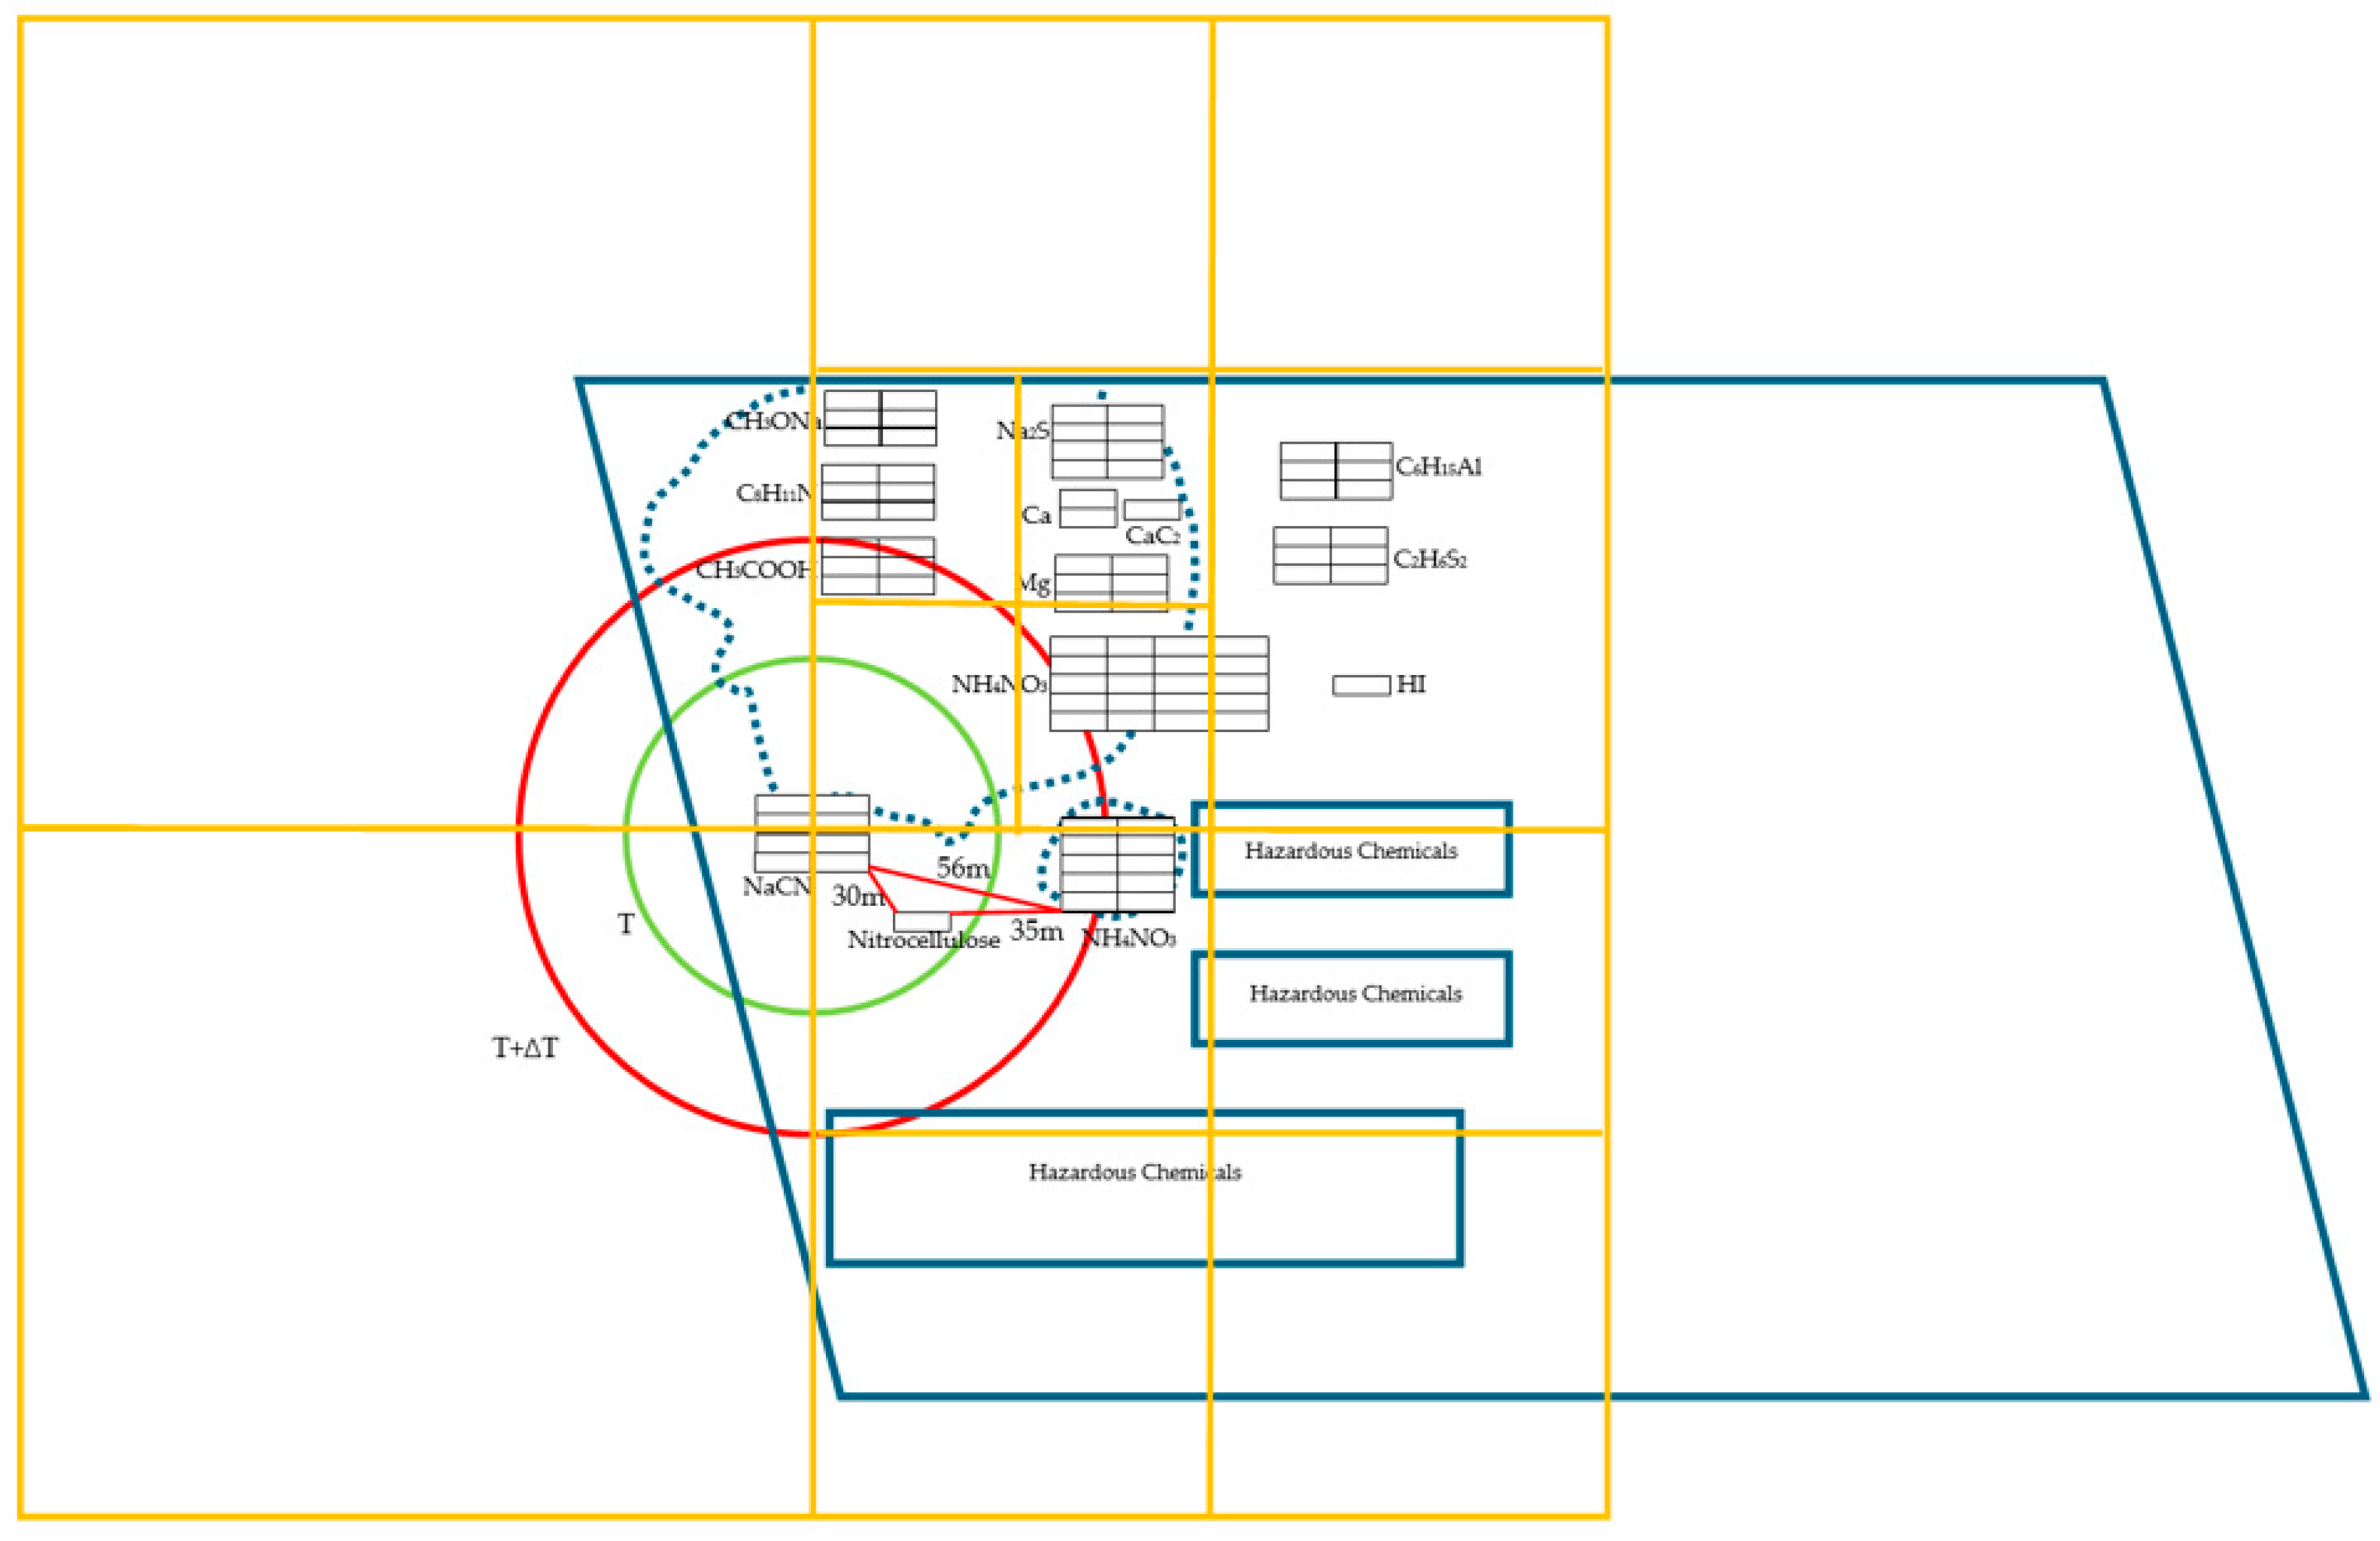
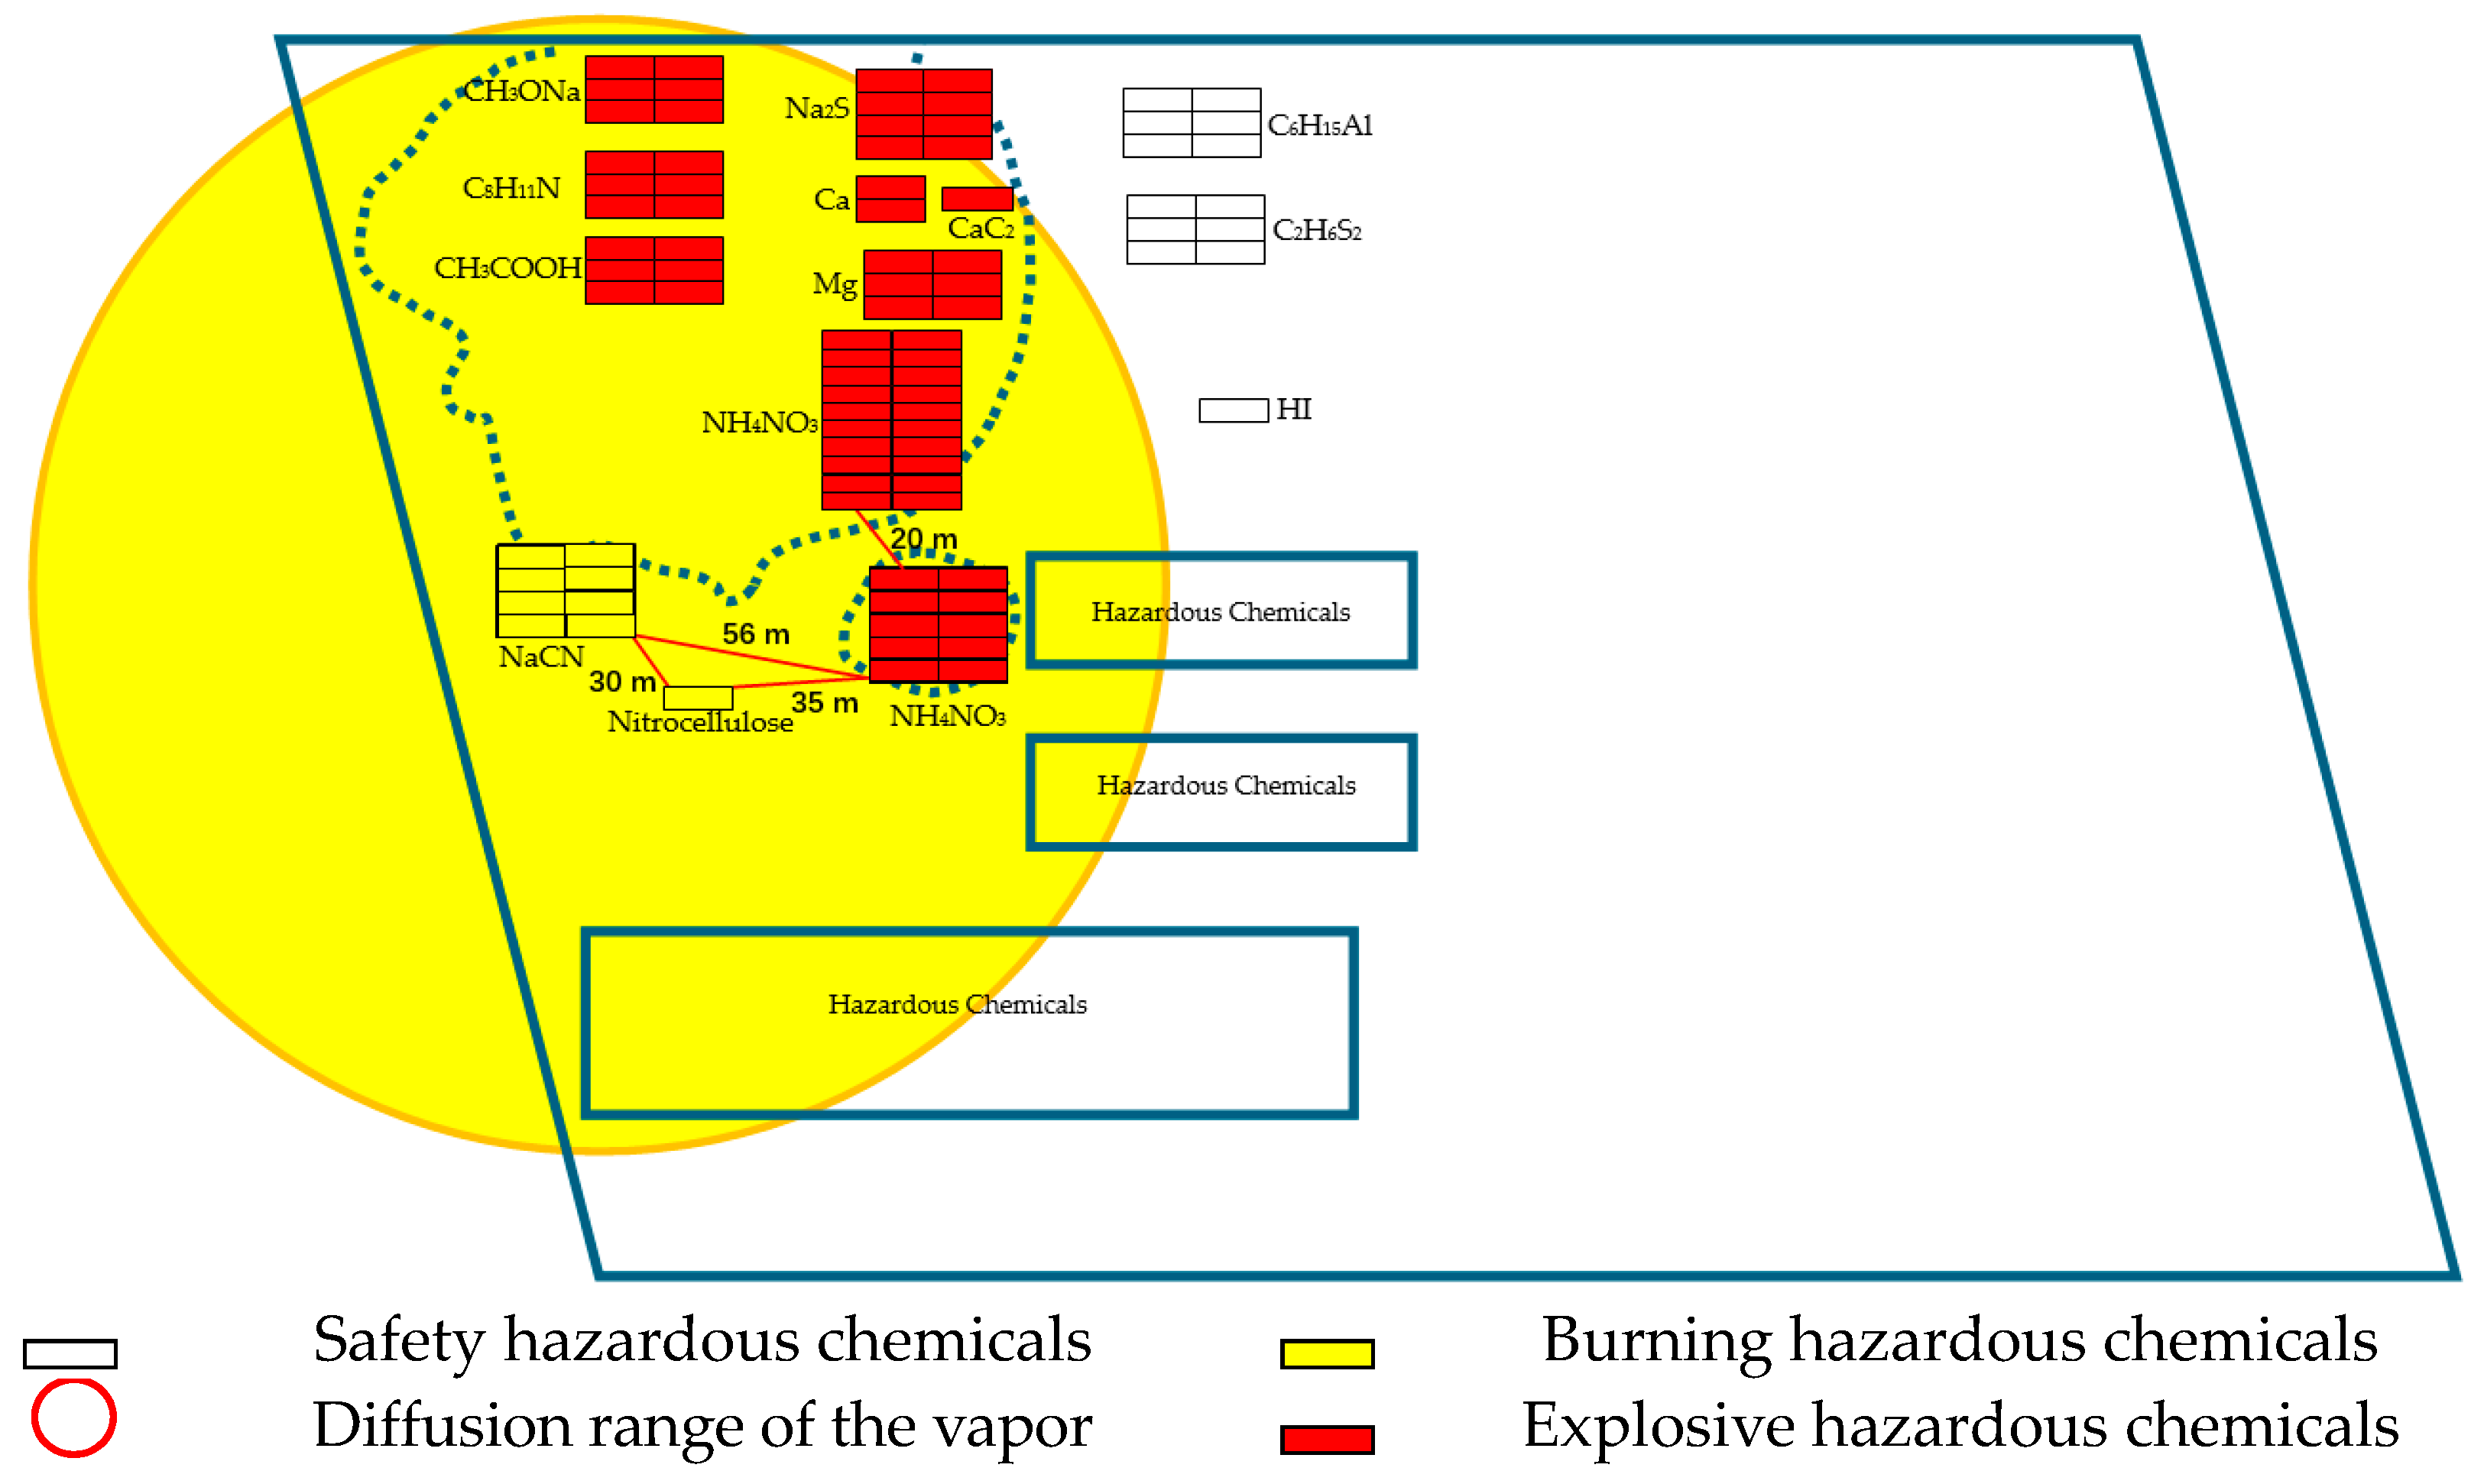
5.1. Accident Background and Scene Diagram

According to the [Tianjin Investigation Report], On 12 August 2015, a spontaneous combustion of nitrocellulose took place at a hazardous chemical storage warehouse in the port of Tianjin, leading to two explosions of hazardous materials at the site. The total energy released in this incident was approximately 450 tons of TNT equivalent.
To accurately depict the accident process, we selected a total of 10 hazardous chemicals involved in the two explosions and developed cascading accident scenarios based on their spatial pyramid coordinates, as illustrated in Figure 7.
After the nitrocellulose ignited, the emergency response involved spraying water to cool the nearby hazardous chemicals. However, water reacts with sodium cyanide to produce hydrogen cyanide gas, creating a flammable and explosive vapor cloud that initiated the primary event of the cascading accident. The specific analysis is as follows:
At an ambient temperature of 36 °C, and without considering the effect of wind, this gas forms a vapor cloud that disperses in a circular pattern with a radius that varies according to Equation (1).

5.2. Node Properties and Model Parameters

5.2.1. Experimental Data—Node Properties

The feature information for each node includes the physical and chemical properties of the hazardous chemical, along with the spatial coordinates represented by the spatial pyramid code. Therefore, the feature vectors of the graph nodes consist of the following: hazardous chemical node ID; node name; pyramid coordinates; interaction with water, carbon dioxide, and other harmful products; gas category; gas density relative to air; flash point; ignition point (°C); lower explosion limit (%); upper explosion limit (%); R (dynamic pyramid coordinates); gt; and more.
The experimental sample data were generated by selecting the diffusion process of hydrogen cyanide from the beginning of diffusion to the occurrence of the second explosion within 2317 s, with a 10 s interval for sampling in the beginning. After 2286 s leading to the first explosion, samples were generated at 1 s intervals to enhance the data on the explosion state until the end of the second explosion. A total of 1470 samples were generated, corresponding to the 10 nodes in each of the three states: 0, 1, and 2, which represent the normal, burning, and explosion states, respectively. The data set was randomly divided into an 80:20 ratio for the training and validation sets.

5.2.2. The Graph Neural Network and the Hyperparameters

The model employs an attention-based graph neural network (GAT). The hyperparameters of the model are as follows: the number of attention heads in the network is 3, the input feature dimension is 64, the output dimension is 3, the learning rate is 0.001, the batch size is 32, and the number of epoches is 200.

5.3. Experimental Analysis

5.3.1. Model Training Procedure

To compare the advantages of the spatial–temporal aggregation model, a single-temporal model that only includes spatial aggregation is designed for comparison with the spatial–temporal aggregation model proposed in the paper. Both models are trained for 200 rounds, with the single-temporal model achieving a loss of 0.85 and an accuracy of 0.82 after 197 rounds. In contrast, the bi-temporal model, after the same number of training rounds, shows a loss of 0.48 and an accuracy of 0.90. This indicates that the bi-temporal model proposed in this paper has a significant comparative advantage. The loss curves of the two models are illustrated in Figure 8 and Figure 9.

5.3.2. Cascade Accident Simulation

Unlike traditional domino accident simulations, the cascade accidents defined in this paper focus on the secondary incidents triggered by commonly used emergency measures. Therefore, it serves as a complement to domino accident simulations, and the two are sequentially related in terms of timing, together forming a comprehensive study of the hazardous material accident chain. This is illustrated in Figure 10.
It is crucial to establish the initial conditions of the simulation, which encompass the coordinates of the spatial pyramid for each hazardous chemical in the scene, their physical and chemical properties, and the state of each node at moment 0. Furthermore, the emergency measures related to the initial accident that initiated the cascade of accidents and the diffusion law must be defined.
After the training, the model can learn to accurately simulate the entire process of cascading accidents by aggregating the physical and chemical properties, along with the spatial coordinates of neighboring nodes, and integrating them with its own current state. This enables the prediction of each node’s state at any point during the cascade accident, allowing for a comprehensive simulation of the entire cascading accident process.
The specific description is as follows:
(1)
Before 22:52, the initial accident (nitrocellulose combustion) occurred.
Node 0 is nitrocellulose (C12H16N4O18), a yellowish-white, cotton-shaped chemical that is both flammable and explosive, exhibiting poor chemical stability. It can decompose gradually at room temperature, releasing heat, and above 40 °C, the decomposition rate increases, resulting in greater heat release. If this heat is not dissipated quickly, the temperature of the nitrocellulose may rise to 180 °C, potentially resulting in spontaneous combustion.
Spontaneous combustion of nitrocellulose in the containers at Node 0 formed the initial event of a cascading accident, with the heat released impacting the surrounding hazardous materials through thermal radiation.
The temperature decay of a point source of combustion in air follows the Stefan–Boltzmann law. This law states that the energy density of thermal radiation decreases with the square of the distance [36]. Nitrocellulose reaches a temperature of 1000 °C after 30 min of burning, impacting the environment through heat radiation. In addition to sodium cyanide, the nearest node to nitrocellulose was Node 6 (ammonium nitrate), located 35 m away. When combined with the air temperature of 36 °C, the temperature at Node 6 was approximately 130 °C. This exceeds the 110 °C decomposition temperature of ammonium nitrate. However, at this distance of 35 m from the nitrocellulose, it was not exposed to open flames, and the emergency rescue measures included water spray cooling, which helped reduce the temperature at Node 6 and slow the decomposition rate. Consequently, the accident remained confined to the nitrocellulose burning at a single node, while the safety of other nodes was maintained.
(2)
At 22:56, the initial state at time zero was (1, 0, 0, 0, 0, 0, 0, 0, 0, 0).
The primary incident that initiated the cascading accident was the formation and spread of the hydrogen chloride vapor cloud. The water spray and cooling strategy employed in the emergency response enabled sodium cyanide at Node 1 to react with water, producing a flammable and explosive hydrogen cyanide gas that created a vapor cloud and started to diffuse.
NaCN + H2O → NaOH + HCN
At this time, since the distance between the vapor cloud and the only accident node is 30 m, the spatial connection based on the pyramid distance is weak. Consequently, the vapor cloud is unable to incorporate the burning state of Node 0 into its own state prediction using the aggregation function (Equation (3)), resulting in a safe state. Other nodes are similarly unaffected by Node 0 at this moment due to the same mechanism. Therefore, in the scenario graph, the state values of all nodes remain at 0, indicating a safe status, except for the burning of nitrocellulose at Node 0, as illustrated in Figure 11.
(3)
The vapor cloud starts to diffuse into a combustion state.
At 1000 s, the model forecasts the state of each node as (1, 1, 0, 0, 0, 0, 0, 0, 0, 0).
It indicates that hydrogen cyanide vapor from sodium cyanide at Node 1 spreads 30 m before reaching burning Node 0 (nitrocellulose), which ignites into a flaming vapor cloud (Condition 1), as illustrated in Figure 12.
At this time, other nodes remain in their original isolated states with Nodes 0 and 1, so the states of all nodes, except 0 and 1, remain safe.
(4)
The primary event that initiated cascading accident 1—first explosion at 23:34:06.
At 2000 s, the model predicts the outcome of each node state: 1, 1, 2, 0, 0, 0, 0, 0, 0, 0.
The predicted conclusions indicate that after hydrogen cyanide vapor met the burning nitrocellulose and transformed into a burning vapor cloud, it continued to spread 56 m to reach Node 6—ammonium nitrate—which was already at 130 °C. Ammonium nitrate decomposed and interacted with the burning vapor cloud of hydrogen cyanide, igniting and causing the explosion of ammonium nitrate. The first explosion occurred at 23:34:06, 38 min after the water was poured. The energy of the first explosion is approximately 15 tons of TNT equivalent, as illustrated in Figure 13.
(5)
The first explosion triggered cascade accident 2—second explosion at 23:34:37, which occurred 31 s later.
At 2317 s, the model predicts the results of each node state: 2, 2, 2, 2, 2, 2, 2, 2, 2.
Approximately 20 m northwest of the original explosion site were several containers filled with ammonium nitrate, potassium nitrate, calcium nitrate, sodium methanol, magnesium metal, calcium metal, calcium silicate, sodium sulfide, and other oxidizers; flammable solids; and corrosive materials (Nodes 4- to 10). They were destroyed and detonated by the shockwave from the initial explosion, resulting in a significantly more violent explosion that occurred 31 s later at 23:34:37. The energy of the second explosion was roughly equivalent to 430 tons of TNT, as illustrated in Figure 14.
The model uses a graph neural network to simulate the cascading accident of the “8.12” Tianjing Port explosion triggered by emergency measures. Using dynamic Bayesian networks and cellular automata, some scholars [37,38] have carried out valuable research on the same scenario much earlier. However, these studies primarily focused on existing hazardous materials on-site for their analysis. In contrast, the model presented in this paper analyzes hazardous chemical reactions triggered by emergency measures, resulting in the emergence of additional hazardous material—the hydrogen cyanide vapor cloud—as the primary event of the cascading accident. Thus, the complex interactions between hazardous chemicals and emergency measures are revealed in greater depth.

6. Conclusions

Most of the existing research focuses on the pre-rescue phase while neglecting the simulation of rescue-induced accidents that occur post-rescue, so a cascade accident simulation model based on a graph neural network is proposed. The model analyzes the effects of hazardous chemical reactions triggered by emergency rescue measures and explores the evolution of cascade accidents induced by additional hazardous chemicals in accident scenarios. The study of the cascade accident of hazardous chemicals has made up for the incompleteness of the simulation of the domino accident of hazardous chemicals and promoted the intelligent process of research in this field through the application of a graph neural network. Experimental results validate the effectiveness of this method.
Due to the limitations of the available data, an empirical estimation method has been employed for the leakage rate of flammable gases, necessitating a more rigorous investigation in the future. The current cascade accident simulation focuses on scenarios with a single starting point, and further research should be conducted on simulations involving multiple starting points. Additional data on hazardous chemical cascade accidents are required to train the model and enhance its generalization capabilities.

Author Contributions

Data curation, K.L. (Kunjing Li); formal analysis, W.C. (Wenqi Cui), B.C. and J.C.; investigation, W.L.; methodology, W.C. (Wenqi Cui) and W.C. (Wei Cui); resources, X.C.; validation, W.C. (Wei Cui), X.C. (Xianfeng Chen) and B.C.; writing—original draft, Y.T. and W.C. (Wenqi Cui); writing—review and editing, K.L. (Kaiwen Liu), Z.F., B.C. and J.C. All authors have read and agreed to the published version of the manuscript.

Funding

This research received no external funding.

Institutional Review Board Statement

Not applicable.

Informed Consent Statement

Not applicable.

Data Availability Statement

The original contributions presented in the study are included in the article, further inquiries can be directed to the corresponding author.

Conflicts of Interest

The authors declare no conflicts of interest.

References

  1. GB15603-2022; General Rules for the Storage of Hazardous Chemicals. SAMR: Beijing, China, 2023.
  2. He, Z.; Weng, W. A Dynamic and Simulation-Based Method for Quantitative Risk Assessment of the Domino Accident in Chemical Industry. Process Saf. Environ. Prot. 2020, 144, 79–92. [Google Scholar] [CrossRef]
  3. Lan, M.; Gardoni, P.; Weng, W.; Shen, K.; He, Z.; Pan, R. Modeling the Evolution of Industrial Accidents Triggered by Natural Disasters Using Dynamic Graphs: A Case Study of Typhoon-Induced Domino Accidents in Storage Tank Areas. Reliab. Eng. Syst. Saf. 2024, 241, 109656. [Google Scholar] [CrossRef]
  4. Huang, W.; Chen, X.; Qin, Y. A Simulation Method for the Dynamic Evolution of Domino Accidents in Chemical Industrial Parks. Process Saf. Environ. Prot. 2022, 168, 96–113. [Google Scholar] [CrossRef]
  5. Huang, L.; Wu, C.; Wang, B. Complex chain evolution mechanism and its modeling of major accident based on entropy theory. J. Saf. Sci. Technol. 2016, 12, 10–15. [Google Scholar]
  6. Wu, C.; Wang, B. Research on Establishment of the Science of Safety Relations. Sci. Technol. Res. 2017, 20, 254–261. [Google Scholar]
  7. Jia, M.; Chen, G.; Hu, K. Review of risk assessment and pre-control of Domino effect in Chemical Industry Park. Park. Chem. Indus. Eng. Progress 2017, 36, 1534–1543. [Google Scholar]
  8. Yuan, N. Research on Scenario Construction of Liquid Ammonia Leakage Accident Based on Bayesian Network and Business Community Management; Beijing Jiaotong University: Beijing, China, 2016. [Google Scholar]
  9. Li, S.; Liang, D.; Wei, Y.; Zhang, X. Quantitative modeling of drought-forest fire disaster chain based on the Bayesian network. J. Nat. Dis. 2023, 1, 38–46. [Google Scholar]
  10. Kang, J.; Liu, Y. Study on safety assessment of bridge construction based on Bayesian network. China Saf. Sci. J. 2016, 7, 157–162. [Google Scholar]
  11. Wang, X.; Gui, L. Research on Emergency Disaster Events Evolution Network Based on Hypergraph. Math. Pract. Theo. 2019, 12, 63–71. [Google Scholar]
  12. Wang, B. Secondary risk and its governance: Study on the structural appearance and evolutionary mechanism of hazardous chemicals. J. ZULI 2023, 24, 60–67. [Google Scholar]
  13. Wang, S.; Wu, F.; Zhou, P. Measuring Urban Environmental Performance in China: A Euclidean Distance Function Approach. J. Environ. Manag. 2024, 361, 121272. [Google Scholar] [CrossRef] [PubMed]
  14. Lu, Y.; Wu, J.; Shao, S.; Shi, S.; Zhou, R.; Wang, W. Prediction Model for Road Transportation Accidents of Hazardous Chemicals Based on Bayesian Network. China Saf. Sci. J. 2022, 32, 174–181. [Google Scholar]
  15. Li, X.; Chen, C.; Hong, Y.; Yang, F. Exploring Hazardous Chemical Explosion Accidents with Association Rules and Bayesian Networks. Reliab. Eng. Syst. Saf. 2023, 233, 109099. [Google Scholar] [CrossRef]
  16. Hanifi, S.; Laal, F.; Ghasghaei, M.; Ahmadi, O.; Mandali, H. Providing a Model to Evaluate the Spread of Fire in a Chemical Warehouse Using Numerical Simulation and Bayesian Network. Process Saf. Environ. Prot. 2024, 183, 124–137. [Google Scholar] [CrossRef]
  17. Khan, R.; Yin, J.; Mustafa, F.; Wang, S. Analyzing Human Factor Involvement in Sustainable Hazardous Cargo Port Operations. Ocean Eng. 2022, 250, 111028. [Google Scholar] [CrossRef]
  18. Shan, X.; Wang, F.; Li, X.; Bian, J. Risk Analysis of Hazardous Chemical Road Transportation Accidents Based on Analytic Hierarchy Process. J. Sec. Saf. Technol. 2023, 11, 30–39. [Google Scholar]
  19. Ayvaz, B.; Tatar, V.; Sagir, Z.; Pamucar, D. An Integrated Fine-Kinney Risk Assessment Model Utilizing Fermatean Fuzzy AHP-WASPAS for Occupational Hazards in the Aquaculture Sector. Process Saf. Environ. Prot. 2024, 186, 232–251. [Google Scholar] [CrossRef]
  20. Jiang, X.; Wu, Z.; Dang, W.; Yu, A. Acidic gas pipe leakage risk analysis based on CFD. Fire Sci. Technol. 2016, 35, 1481–1485. [Google Scholar]
  21. Lyu, S.; Zhang, S.; Huang, X.; Peng, S.; Yang, D.; Sun, M.; Qi, Q. CFD Simulations of Instantaneously Released Liquefied Gas in Urban Area: A Case Study of LPG Tank Truck Accident in Wenling, China. Sustain. Cities Soc. 2023, 94, 104550. [Google Scholar] [CrossRef]
  22. Efthimiou, G.; Andronopoulos, S.; Tavares, R.; Bartzis, J. CFD-RANS Prediction of the Dispersion of a Hazardous Airborne Material Released During a Real Accident in an Industrial Environment. J. Loss Prev. Process Ind. 2017, 46, 23–36. [Google Scholar] [CrossRef]
  23. Yet-Polo, I.; Chen, T. Application of CFD Model in an LPG Tank Explosion Accident. J. Loss Prev. Process Ind. 2021, 69, 104367. [Google Scholar]
  24. Kim, H.; Park, M.; Kim, C.; Shin, D. Source Localization for Hazardous Material Release in an Outdoor Chemical Plant via a Combination of LSTM-RNN and CFD Simulation. Comput. Chem. Eng. 2019, 125, 476–489. [Google Scholar] [CrossRef]
  25. Kang, Y.; Wu, Z.; Ma, S.; Zhao, M.; Li, W. CFD-Based Assessment and Visualization of the Failure Consequences of LPG Tankers. J. Loss Prev. Process Ind. 2023, 82, 105008. [Google Scholar] [CrossRef]
  26. Huang, W.; Chen, J.; Qin, Q.; Wang, Z.; Song, L. Causation Analysis and Governance Strategy for Hazardous Cargo Accidents at Ports: Case Study of Tianjin Port’s Hazardous Cargo Explosion Accident. Mar. Pollut. Bull. 2021, 173, 113053. [Google Scholar]
  27. Zhao, S.; Hu, C.; Ma, L. Construction of Scenario Deduction Network for Hazardous Chemical Accidents and Analysis of Key Nodes. J. Saf. Sci. Technol. 2022, 18, 36–42. [Google Scholar]
  28. Quan, X.; Wang, K.; Wang, B.; Wang, X.; Zhang, X. Research and Design of Gas Diffusion Emergency Analysis Based on 3D GIS. Geomat. Spa. Info. Technol. 2023, 7, 82–84. [Google Scholar]
  29. Wang, H.; Li, R.; Tu, Y.; Cui, Y. Analysis of the Causes of Road Transportation Accidents for Hazardous Chemicals Based on Grounded Theory and Grey Relation. J. Hunan Univ. Sci. Technol. 2022, 37, 17–23. [Google Scholar]
  30. Veličković, P.; Cucurull, G.; Casanova, A.; Romero, A.; Lio, P.; Bengio, Y. Graph Attention Networks. In Proceedings of the ICLR 2018, Vancouver, BC, Canada, 30 April–3 May 2018. [Google Scholar]
  31. Cui, W.; He, X.; Yao, M.; Wang, Z.; Li, J.; Hao, Y.; Wu, W.; Zhao, H.; Chen, X.; Cui, W. Landslide Image Captioning Method Based on Semantic Gate and Bi-Temporal LSTM. ISPRS Int. J. Geo-Inf. 2020, 9, 194. [Google Scholar] [CrossRef]
  32. Shelhamer, E.; Long, J.; Darrell, T. Fully Convolutional Networks for Semantic Segmentation. IEEE Trans. Pattern Anal. 2015, 39, 640–651. [Google Scholar] [CrossRef]
  33. Huang, G.; Liu, Z.; Weinberger, K.Q. Densely Connected Convolutional Networks. In Proceedings of the IEEE Conference on Computer Vision and Pattern Recognition (CVPR), Honolulu, HI, USA, 21–26 July 2017; pp. 2261–2269. [Google Scholar]
  34. Kriege, M.; Johansson, D.; Morris, C. A survey on graph Neural Networks. Appl. Net. Sci. 2020, 5, 1–42. [Google Scholar]
  35. Chen, C.; Reniers, G.; Khakzad, N. A Dynamic Multi-Agent Approach for Modeling the Evolution of Multi-Hazard Accident Scenarios in Chemical Plants. Reliab. Eng. Syst. Saf. 2021, 207, 107349. [Google Scholar] [CrossRef]
  36. Ares de Parga-Regalado, A.M. Analytical Approximation of Optimal Thermoeconomic Efficiencies for a Novikov Engine with a Stefan-Boltzmann Heart Transfer Law. Results Phys. 2023, 54, 107059. [Google Scholar] [CrossRef]
  37. Zhang, J.; Feng, N. Research on the Emergency Disposal of the Hazardous Chemical Accidents Based on the Dynamic Bayesian Network Scenario Deduction. J. Saf. Environ. 2020, 20, 1420–1426. [Google Scholar]
  38. Wang, Q.; Wang, H. A Scenario Construction Based Study on Emergency Evacuation in Hazardous Chemicals Accidents. China Saf. Sci. J. 2017, 27, 147–152. [Google Scholar]
Figure 1. Coding of pyramid spatial location.
Sustainability 16 07880 g001
Figure 2. Pyramid location diagram for hazardous chemical storage scenario.
Sustainability 16 07880 g002
Figure 3. Parallel and dynamic simulation strategy design.
Sustainability 16 07880 g003
Figure 4. The flow chart of the approach.
Sustainability 16 07880 g004
Figure 5. Spatial information aggregation.
Sustainability 16 07880 g005
Figure 6. Bi-Temporal information aggregation.
Sustainability 16 07880 g006
Figure 7. The spatial distance of hazardous chemicals.
Sustainability 16 07880 g007
Figure 8. Loss curves of single-temporal model.
Sustainability 16 07880 g008
Figure 9. Loss curves of bi-temporal model.
Sustainability 16 07880 g009
Figure 10. The development of the cascading accident of hazardous chemicals in 8.12 accident.
Sustainability 16 07880 g010
Figure 11. The scenario graph of the initial state at time zero.
Sustainability 16 07880 g011
Figure 12. The scenario graph of diffusion of hydrogen cyanide.
Sustainability 16 07880 g012
Figure 13. The scenario graph of the first explosion.
Sustainability 16 07880 g013
Figure 14. The scenario graph of the second explosion.
Sustainability 16 07880 g014
Table 1. The distance and spatial relationship of the location.
Centroid Euclidean DistanceSpatial Relationship
I36.8Aparting
II36.8Aparting
Table 2. Comparison of spatial correlation representation methods.
Vector of Pyramid Spatial Distance
I0.080.000.000.080.020.060.060.730.000.080.080.080.08
II0.510.000.000.510.330.490.490.180.000.510.510.510.51
Disclaimer/Publisher’s Note: The statements, opinions and data contained in all publications are solely those of the individual author(s) and contributor(s) and not of MDPI and/or the editor(s). MDPI and/or the editor(s) disclaim responsibility for any injury to people or property resulting from any ideas, methods, instructions or products referred to in the content.

