Abstract
The purpose of this paper is to assess the changes in agricultural producers’ use of funds allocated for environmental measures under the 2007–2013 RDP (Rural Development Program) and 2014–2020 RDP in Poland. The extent to which environmental CAP (Common Agricultural Policy) funds are used was examined on a geographic basis, so as to take account of socioeconomic and environmental characteristics of districts. Correlation analysis and a cartographic method were used. The study found growing differences in how the funds are used between territorial units. The analysis of correlation provided grounds for concluding that a relationship exists between the share of environmental funds used in total RDP payments and environmental conditions, mostly including the share of permanent pasture in the structure of agricultural land (0.515 in 2014–2020). Conversely, no relationship was discovered between the level of wealth and the local agrarian structure (0.249 and 0.327 in 2014–2020). The analysis of differences between territorial units revealed that in some geographic areas that had the potential for being granted environmental funds, the farmers decided not to apply for them. Based on the above, it was concluded that the potential beneficiaries’ activity in that respect is largely impacted not only by their environmental awareness and attitude but also by historical events.
1. Introduction
Agriculture delivers a broad range of goods and services, both public and private [1,2,3]. At the same time, it generates external costs which often represent the secondary effects of a production activity. Therefore, on the one hand, farming activities viewed in broad terms have a positive impact which in addition to delivering the production function are manifested in a number of other ways, including preserving biodiversity or preventing extreme events such as floods and draughts [3,4,5]. On the other hand, however, agriculture often exerts environmental pressures whose consequences go beyond agricultural areas; this is especially true for highly intensive farming practices with a prevailing role of monoculture [6,7]. From the perspective of economic theory, the positive and negative environmental impacts of agriculture combined together can be viewed as externalities. One of the important characteristics of public goods is their shortage, which is due to the market being unable to pay for them. This is very much the same for agriculture, and therefore in order for the producers to be interested in delivering public goods, they should be remunerated with public funds. In this context, note that in addition to encouraging the farmers to undertake adequate activities, there is also a need to cover the related costs. Due to agricultural production being essential and because of income disparities between agriculture and other sectors, the ‘polluter pays’ principle can only be applied to a limited extent. Hence, the government must intervene and implement agricultural policy instruments that contribute to alleviating the adverse effects of agricultural externalities, including negative environmental impacts. The Common Agricultural Policy (CAP) offers multiple solutions for environmental measures in areas dominated by agriculture. Meanwhile, a discussion is ongoing on the most efficient ways of allocating funds to support these goals [8]. It needs to be mentioned that initially, the CAP was focused nearly exclusively on economic and production objectives; it was designed to make the agricultural sector more productive with a view to improving food security and self-sufficiency in food of Community countries [9,10]. Although the CAP proved to be highly successful in that respect, it often came at a price of environmental degradation resulting from excessive and irrational use of chemical productive inputs or monoculture farming [11,12]. This is why since the 1992 MacSharry reform, the priorities of the Common Agricultural Policy have been increasingly focused on aspects related to forming, recovering, and protecting the natural environment [13]. In addition to direct payments, that year saw the implementation of what is referred to as accompanying instruments in the form of agri-environmental or forestation programs. In turn, the 2003 direct payments reform (the Fischler reform) laid down the principles of cross-compliance, most of them relating to environmental matters. The period 2014–2020 saw the introduction of what is referred to as greening under the CAP. It made access to direct payments dependent upon meeting certain conditions, including those of an environmental nature. These matters took on particular importance in the current 2023–2027 perspective. Cross-compliance and greening principles were moved to extended conditionality provisions, whereas support measures specific to agri-environmental and forestation programs remained in the form of independent interventions. However, what matters most is the introduction of new environmental interventions, such as eco-schemes which consist of voluntary annual environmental commitments whose scope goes beyond what is provided for by the law. The CAP’s Strategic Plan includes many more solutions of this kind; all of its assumptions are consistent with the general concept of the EU’s agri-climate policy, namely the European Green Deal [14].
The CAP tends to evolve towards ensuring increased protection of the environment, which can be viewed as the right direction. Indeed, next to making Europe food-secure, the condition of the environment is among the major challenges that are decisive for the agricultural sector’s long-term production capacity (and thus, as a matter of fact, also affects future food security). Therefore, the EU currently considers its agri-environmental measures as being of key importance to rural development. This is the only group of measures that were compulsory for all member states and needed to be considered in national Rural Development Programs (RDPs). As managers of rural areas and of a large part of global agricultural land [15], farmers are the direct beneficiaries of the EU’s policy focused on the targets outlined above. The policy is driven by payments for producers who participate in measures that include the delivery of public goods related to environmental protection or to reducing the adverse environmental impacts of agricultural production. These solutions are implemented in EU countries in line with the principle of subsidiarity in order to make them better aligned with the needs [16]. Since the MacSharry reform, the CAP has been split into two pillars, of which the first includes income support and market intervention whereas the second pillar forms part of the rural development policy. Various kinds of support programs are offered under the second pillar. The farmers can decide whether they want to join such programs. Hence, the instruments offered under the 2nd pillar of the CAP are the ones that require the potential beneficiaries to make an informed decision which is primarily determined by their microeconomic interests and formal eligibility for applying for specific funds. The above is also true for environmental funds. Although they primarily serve a social purpose, the voluntary nature of applying for funds under the 2nd pillar of the CAP requires an a priori assumption to be made that accessing that kind of support is driven by the applicant’s awareness and inner need. This is because their essential concept is that the society “buys” (using public funds allocated under support programs) certain environmental public goods offered by farms. The “supply” of those goods will depend on whether the payment is more attractive than the potential drop in income from marketable production [17].
The EU’s Common Agricultural Policy places great emphasis on environmental matters, which is cause for thought regarding not only the reasons and the social rationale behind the use of such solutions but first of all the effectiveness of existing environmental protection mechanisms. From the point of view of the innovativeness of such forms of support, it is important to explore the dynamics of the processes in place. Indeed, the existence or the economic rationale of environmental funds alone does not necessarily need to translate into the actual activity of potential beneficiaries.
As indicated by some authors, the use of RDP funds is largely driven by agricultural structures and local development conditions [18,19,20,21]. Similar conclusions can be drawn from research into factors affecting the use of Polish RDP funds allocated to farm modernization [22] and the development of enterprise [23].
The studies on the use of structural funds in EU countries also address the regional aspect [24,25,26,27,28,29,30]. Some of them suggest that EU funds have a positive impact on reducing the gaps between regions [31,32], whereas others prove the existence of an opposite process [33,34].
However, since both the effects and the activity levels of agricultural producers differ in the function of RDP measures, there is a need for further investigation into how these resources are distributed in order to monitor and optimize the ways the EU funds are spent [20]. This is also true for the farmers’ participation in agri-environmental measures. For instance, a study carried out by Zindler et al. [35] with a group of farmers and nature managers in Bavaria found financial benefits, administrative simplicity, and environmental benefits to be of key importance to the farmers’ decisions on whether or not to participate in agri-environmental programs. As emphasized by the authors, the farmers’ participation in these programs is determined by different factors, such as financial incentives, environmental awareness, farm characteristics, and socio-demographic variables. The differences in the farmers’ environmental responsibility in the function of farm characteristics and the farmer’s demographic characteristics were also indicated by Vilkė et al. [36] in a study carried out in Lithuania. In turn, Defrancesco et al. [37] investigated the factors that played a decisive role in the farmers’ participation in environmental measures in South France. They emphasized that regional characteristics (including environmental conditions) play a key role in whether or not the producers want to engage in such measures. This suggests that when designed, the policies must be aligned with local contexts. Therefore, it is important to continuously monitor and assess the degree to which the CAP’s environmental instruments are used by the farmers.
Having the above in mind, this study on the use of environmental funds by agricultural producers was carried out to investigate the differences in that process between territorial units and their evolution over time. The purpose of this paper is to assess the changes in agricultural producers’ use of funds allocated for environmental measures under the 2007–2013 RDP and 2014–2020 RDP in Poland on a geographic basis. In territorial terms, the study is carried out at the district level. This study adds value by taking account of the spatial and temporal dimensions at the same time. It allowed to provide some recommendations for agricultural policy regarding strategic and land use planning in agriculture
Below you can find an outline of how this paper is structured. First, it presents the background of the topics addressed, including a brief description of the analyzed Rural Development Programs in place in Poland. Next, it analyzes the distribution of the examined forms of support at the national level and presents the results of the assessment of how the use of funds differs between the districts. Also, it investigates the relationships between the activity in accessing selected forms of support and identified characteristics of the territorial units covered by the study. The paper finishes with a discussion and presentation of conclusions.
2. Rural Development Programs in Poland
Poland is an emblematic case study of how environmental funds are used. When joining the EU, Polish agriculture and rural areas lagged far behind old member countries in terms of productivity, excessive employment, unfavorable farm structure, and insufficient infrastructural investments [38]. Considering the above, structural programs were expected to meet a number of different objectives related to agricultural and rural development. As an Eastern Bloc country, Poland remained a centrally planned economy until the early 1990s. Nevertheless, Polish agriculture was based on family farms throughout the real socialism period. This makes it even more unique compared to other Central and Eastern European countries, most of which were dominated by state-owned or cooperative farms [39,40].
Another particularity of Poland is the agricultural structure being diversified due to historical events. Before independence was regained in 1918, Polish agriculture was governed by principles of three different policies (Russian, German, and Austrian). Also, after World War 2, the country saw a change in its borders, with new territories on the west and north. As no Polish family farms operated there, in the conditions of a socialist economy, these areas were dominated by large state-owned holdings. Although privatized after the political transformation in the 1990s, they usually kept their size [41]. What also matters is that Poland, as a medium-sized country, demonstrates differences in land use patterns across its territory. In the north and west, agricultural land has a smaller share of the total area and is dominated by permanent pasture. At the same time, these parts of Poland exhibit a more beneficial farm structure than other regions, due to large and extremely large holdings playing an important role. In turn, most agricultural land is kept by small farms, especially in the southeast part of Poland [40].
The natural conditions and historical events described above not only exert an impact on today’s agricultural structures but also have a number of other repercussions, including the way agricultural producers respond to what is offered under the Common Agricultural Policy.
Although Poland was covered by both pre-accession (e.g., SAPARD) and post-accession programs (2004–2006 “Agriculture” Sectoral Operating Program, 2004–2006 Rural Development Program), only the 2007–2013 financial perspective was the one where it could choose from the complete range of measures available to all EU countries. The first 7-year program for 2007–2013 was developed based on general strategic RDP guidelines [42]. A total of EUR 17.4 billion was allocated to measures covered by it (EUR 2.5 billion per year). The 2014–2020 RDP was a follow-up program established by the Ministry of Agriculture and Rural Development pursuant to the Regulation of the EU Council No. 1305/2013, which provided for a total amount of EUR 10.8 billion (EUR 1.54 billion per year). The key goal of the program was to make agriculture more competitive, ensure sustainable management of natural resources, take climate protection measures, and promote sustainable territorial development of rural areas. To conclude, it may be asserted that while both programs were designed to support rural development, they differed in detailed provisions regarding the priority and allocation of funds. The 2014–2020 RDP focused more on sustainable development, innovation, and energy efficiency, whereas the 2007–2013 RDP was oriented toward modernizing the infrastructure and farming equipment. In the current financial perspective (2023–2027), the CAP Strategic Plan provides for an amount of EUR 7.799 million to be allocated under the 2nd pillar (EUR 1.55 billion per year). The amount initially allocated to the 2nd pillar in the current plan was reduced by 30% due to the funds being shifted to be disbursed under the 1st pillar. This is much less than in previous financial perspectives; the annual amounts (in current prices) are more than 20% and nearly 40% smaller than those recorded in 2014–2020 and 2007–2013, respectively. In the 2014–2020 RDP, the largest part (ca. 31%) of the budget was absorbed by payments for areas facing natural constraints or other specific constraints (ANC) and by the “Organic Farming” measure (payments for producers who strictly comply with defined practices which are particularly friendly to the environment. Compared to previous RDPs, farm modernization (investments) was the area that saw the greatest reduction in dedicated funds. In 2023–2027, they account for no more than half of the level recorded in previous financial perspectives. From the environmental perspective, the agri-environmental program played an important role in both periods. It included a series of packages, mostly related to protecting particularly valuable elements of the agricultural environment (primarily including permanent pasture), genetic resources, and promoting sustainable farming methods. In 2007–2013, it was measure number 214, and in 2014–2020 measure number 10 (Table 1 and Table 2). Another program of importance, the afforestation of low-productivity agricultural land, was available to both farmers and local authorities. These were measures 221 and 223 in the first period covered by the study and measure 8 in the next one.

Table 1.
Payments disbursed under environmental measures of the 2007–2013 RDP on a countrywide basis (as of 31 December 2015).
Table 2.
Payments disbursed under environmental measures of the 2014–2020 RDP on a countrywide basis (as of 31 December 2015).
The changes in the structures and budgets of successive Polish RDPs provide grounds for concluding that the growing importance of the 1st pillar of the CAP makes these programs less and less significant. In turn, the rural development policy of the 2nd pillar of the CAP was targeted at priorities related to the transfer of knowledge and innovations, farm profitability and competitiveness, and the promotion of innovative technologies. As Poczta [15] emphasizes, the support (investment funds of the CAP) granted so far to Polish agriculture certainly enabled its considerable technical modernization. However, Polish agriculture faces a series of challenges, including the need for digitization (the requirements of what is referred to as precision farming or agriculture 4.0) as well as protecting the environment and climate by applying state-of-the-art technical solutions. While these aspects are clearly taken into account in the designed investment intervention measures under the 2nd pillar of the CAP, the funds allocated to them and the extent of interventions (the number of operations planned to be implemented) reduce their amplitude.
3. Materials and Methods
These analyses rely on data retrieved from Polish public statistical resources, the Local Data Bank of the Central Statistical Office, relating to both the national (Poland as a whole) and the district level. In the Polish administrative system, the district is an intermediate territorial unit between the voivodeships (regions) and communes. It includes from several to more than ten communes and is equivalent to NUTS 4 as defined in the Union’s Classification of Territorial Units for Statistics (NUTS). Currently, there are 314 districts and 66 urban districts in Poland [43].
Of all the measures implemented under both RDPs, this study chose the ones focused on environmental upgrades (Table 1 and Table 2). The authors adopted an original approach which consisted of a detailed analysis of measures and sub-measures of the 2007–2013 and 2014–2020 RDPs, followed by the selection of those that contribute to environmental enhancements. Note that in 2007–2013, RDP support instruments were assigned to priority axes, of which the second (improving the environment and the countryside) was supposed to pursue environmental goals. However, despite the above, this study did not adopt a strict categorization into the then-applicable axes. Instead, the assumption was made that not all measures under axis 2 actually affect the environmental condition and mostly seek environmental goals. This is true for measures 211 and 212, i.e., support for farming in mountain areas and other less-favored areas. Although in accordance with a political statement they were supposed to prevent farmers from discontinuing agricultural production in less-favored areas, the payments disbursed under these measures actually constitute an instrument for supporting farming incomes. As regards the period 2014–2020, the study first chose the ones that were a follow-up to similar earlier programs and measures. This is especially true for the agri-environmental and climate program and for measures designed to support the development of forest areas. Although the names of specific measures changed between programming periods, their essence remained the same. In 2014–2020, the measure “Organic Farming” became a standalone support program, although it formed part of the agri-environmental program in the previous programming period. Also, new measures designed to improve the environmental conditions were selected for the last period, such as investments in animal welfare and water protection against nitrate pollution from agricultural sources. See Table 1 and Table 2 for a detailed list of measures and sub-measures classified as having a beneficial environmental impact in this study.
The study used data on actual payments related to specific measures and sub-measures under the 2007–2013 and 2014–2020 RDPs. In the last available period, it took account of cumulative totals (including all payments affected). The rationale behind this approach is that the payments that were actually made (rather than the initial allocations) reflect the true interest in each support instrument.
The analysis of environmental payments used by agricultural producers at the district level first examined the strength of the relationship between the payments affected and the socioeconomic, agricultural, natural, and geographic characteristics of districts (Table 3). The Pearson’s correlation coefficient was used for that purpose. The authors calculated the percent share of environmental payments in total payments at the district level in both periods under consideration and determined the changes in those shares, expressed in percentage points.
Table 3.
Correlations between the use of RDP environmental funds in 2007–2013 and 2014–2020 and selected socioeconomic, agricultural, natural, and geographic characteristics of Polish districts.
The socioeconomic development level of each district was determined based on the share of member communes’ own incomes in their total incomes. That approach was used because of the particularities of how Polish local government units are financed. Only the communes have their own incomes in the form of local taxes and fees (property taxes, agricultural taxes, and forest taxes). Furthermore, 51.19% of the personal income tax and 22.86% of the corporate income tax paid by the local residents and businesses is transferred to communes from the central budget. Thus, a large share of own income is indicative of high levels of socioeconomic development. The characteristics of districts also include their agrarian structures, expressed by the share of farms larger than 10 ha. That level is close to the average farm area in Poland, which was 11.3 ha in 2022. Hence, the authors decided that the share of farms larger than 10 ha is a reliable proxy for the level of agrarian concentration in each district. In turn, the natural and geographic characteristics of a district were measured as the share of agricultural land in its total area, and as the share of permanent pasture in its total area of agricultural land. The first metric indicates the way land is used and the importance of agriculture itself, whereas the second reflects the district’s agricultural production patterns. Both of them are indirect indicators of the quality of agricultural production space. Indeed, it can be assumed that in areas with favorable conditions for agricultural production, the landscape will be dominated by agricultural land (with a prevailing role of arable land), because the cultivation of it enables greater flexibility of production operations. The dominant role of permanent pasture somehow requires the producers to focus on the husbandry of ruminants. Obviously, it is not necessarily a direct indicator of that business being unattractive, but it does not leave much room for choosing another production type either. What also needs to be emphasized is that in northwest Poland, the prevalence of permanent pasture coexists with a favorable, concentrated agrarian structure. Thus, farms that operate there are quite profitable and demonstrate a relatively large production potential.
The next stage of the study was to indicate the importance of environmental payments in each district using the cartographic method. A similar approach, which consists of using Pearson’s correlation coefficient and exploring the differences in the phenomenon concerned across the territory, was adopted to assess other forms of support [24,25]. The correlation coefficient indicates the strength of the relationship between the characteristics, whereas using a map to visualize the results provides a clear picture of how the phenomena change across the territory. The figures below show the share of environmental payments in total payments under the 2007–2013 RDP (Figure 1) and the 2014–2020 RDP (Figure 2), and the changes in that respect (Figure 3). The analysis of correlation revealed a strong relationship between the use of land and the use of environmental funds under the 2nd pillar of the CAP. Hence, the study also presented the differences in these characteristics across the territory (Figure 4 and Figure 5).
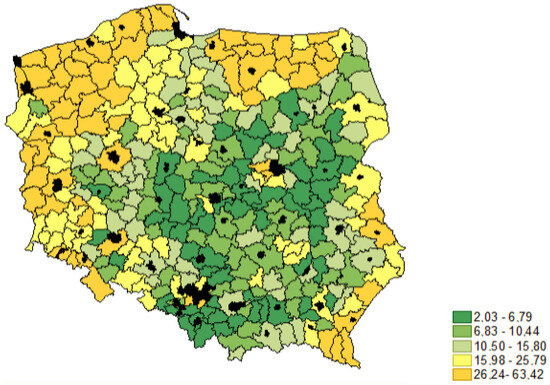
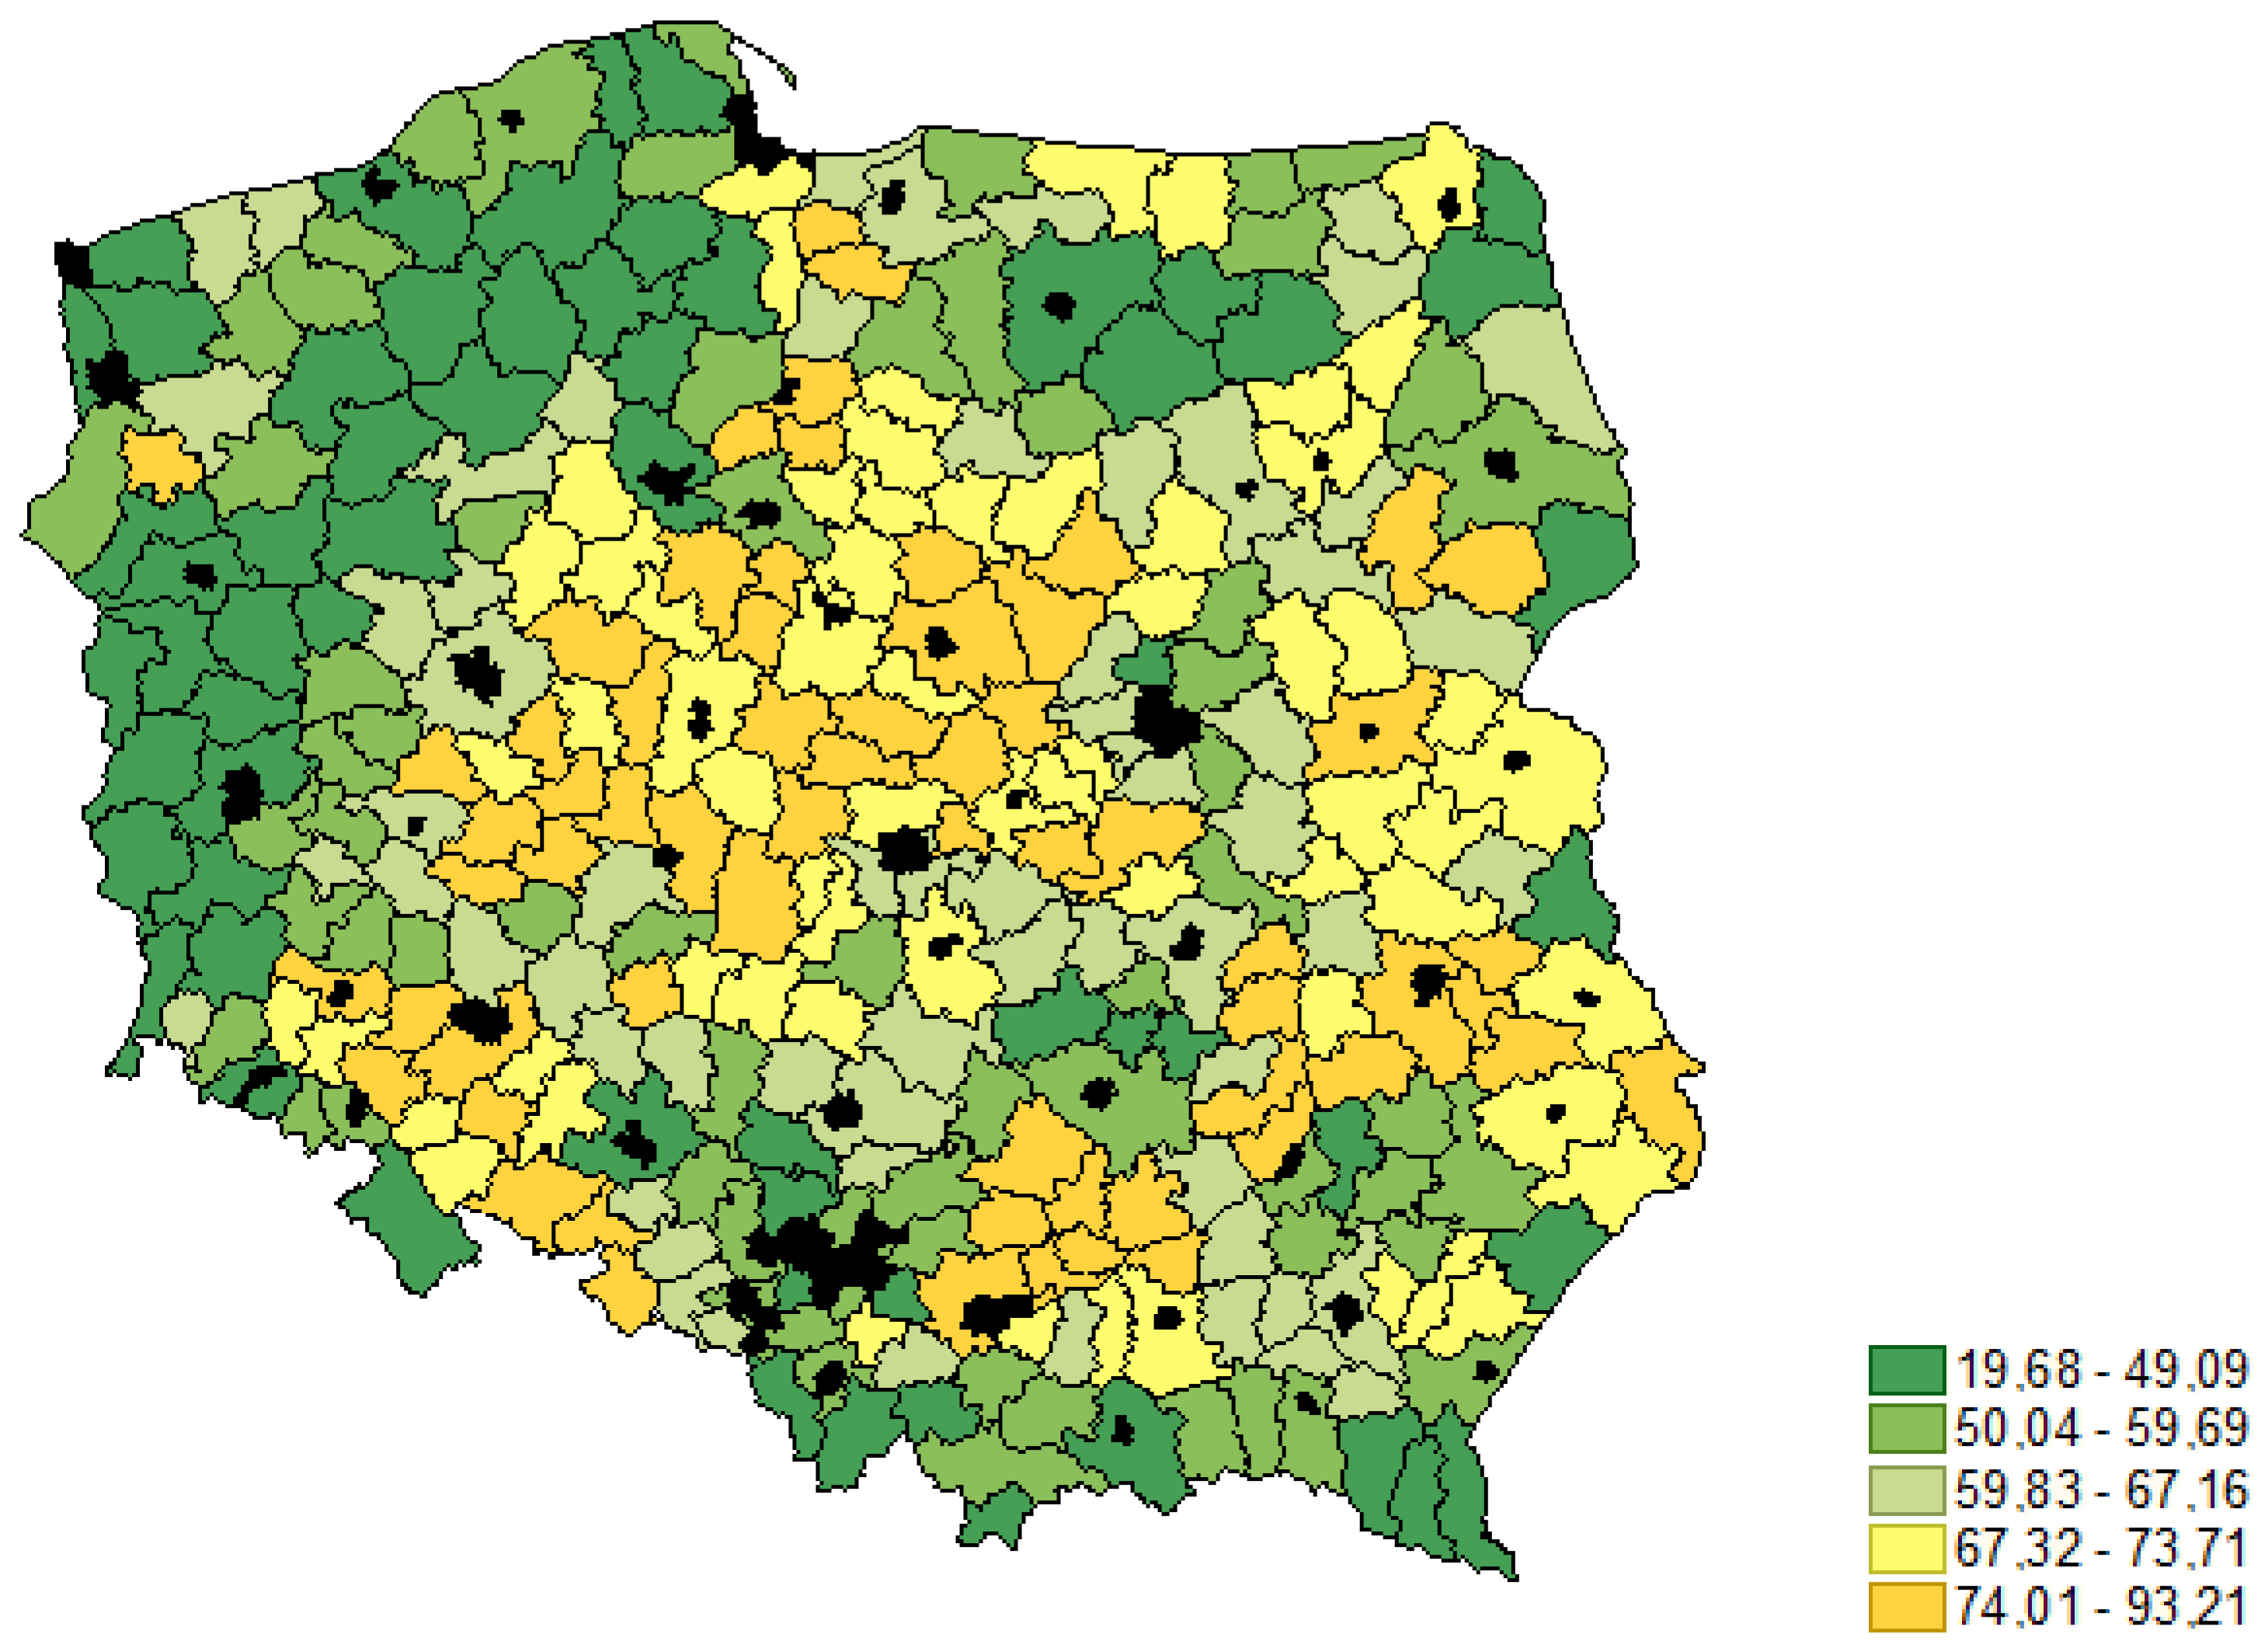
Figure 1.
Share of environmental funds in payments disbursed under the 2007–2013 RDP (2007–2013 RDP payments = 100). Source: own compilation based on https://bdl.stat.gov.pl/bdl/start, accessed on 1 September 2023.
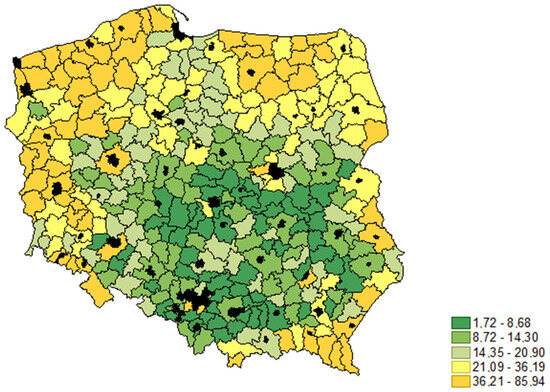
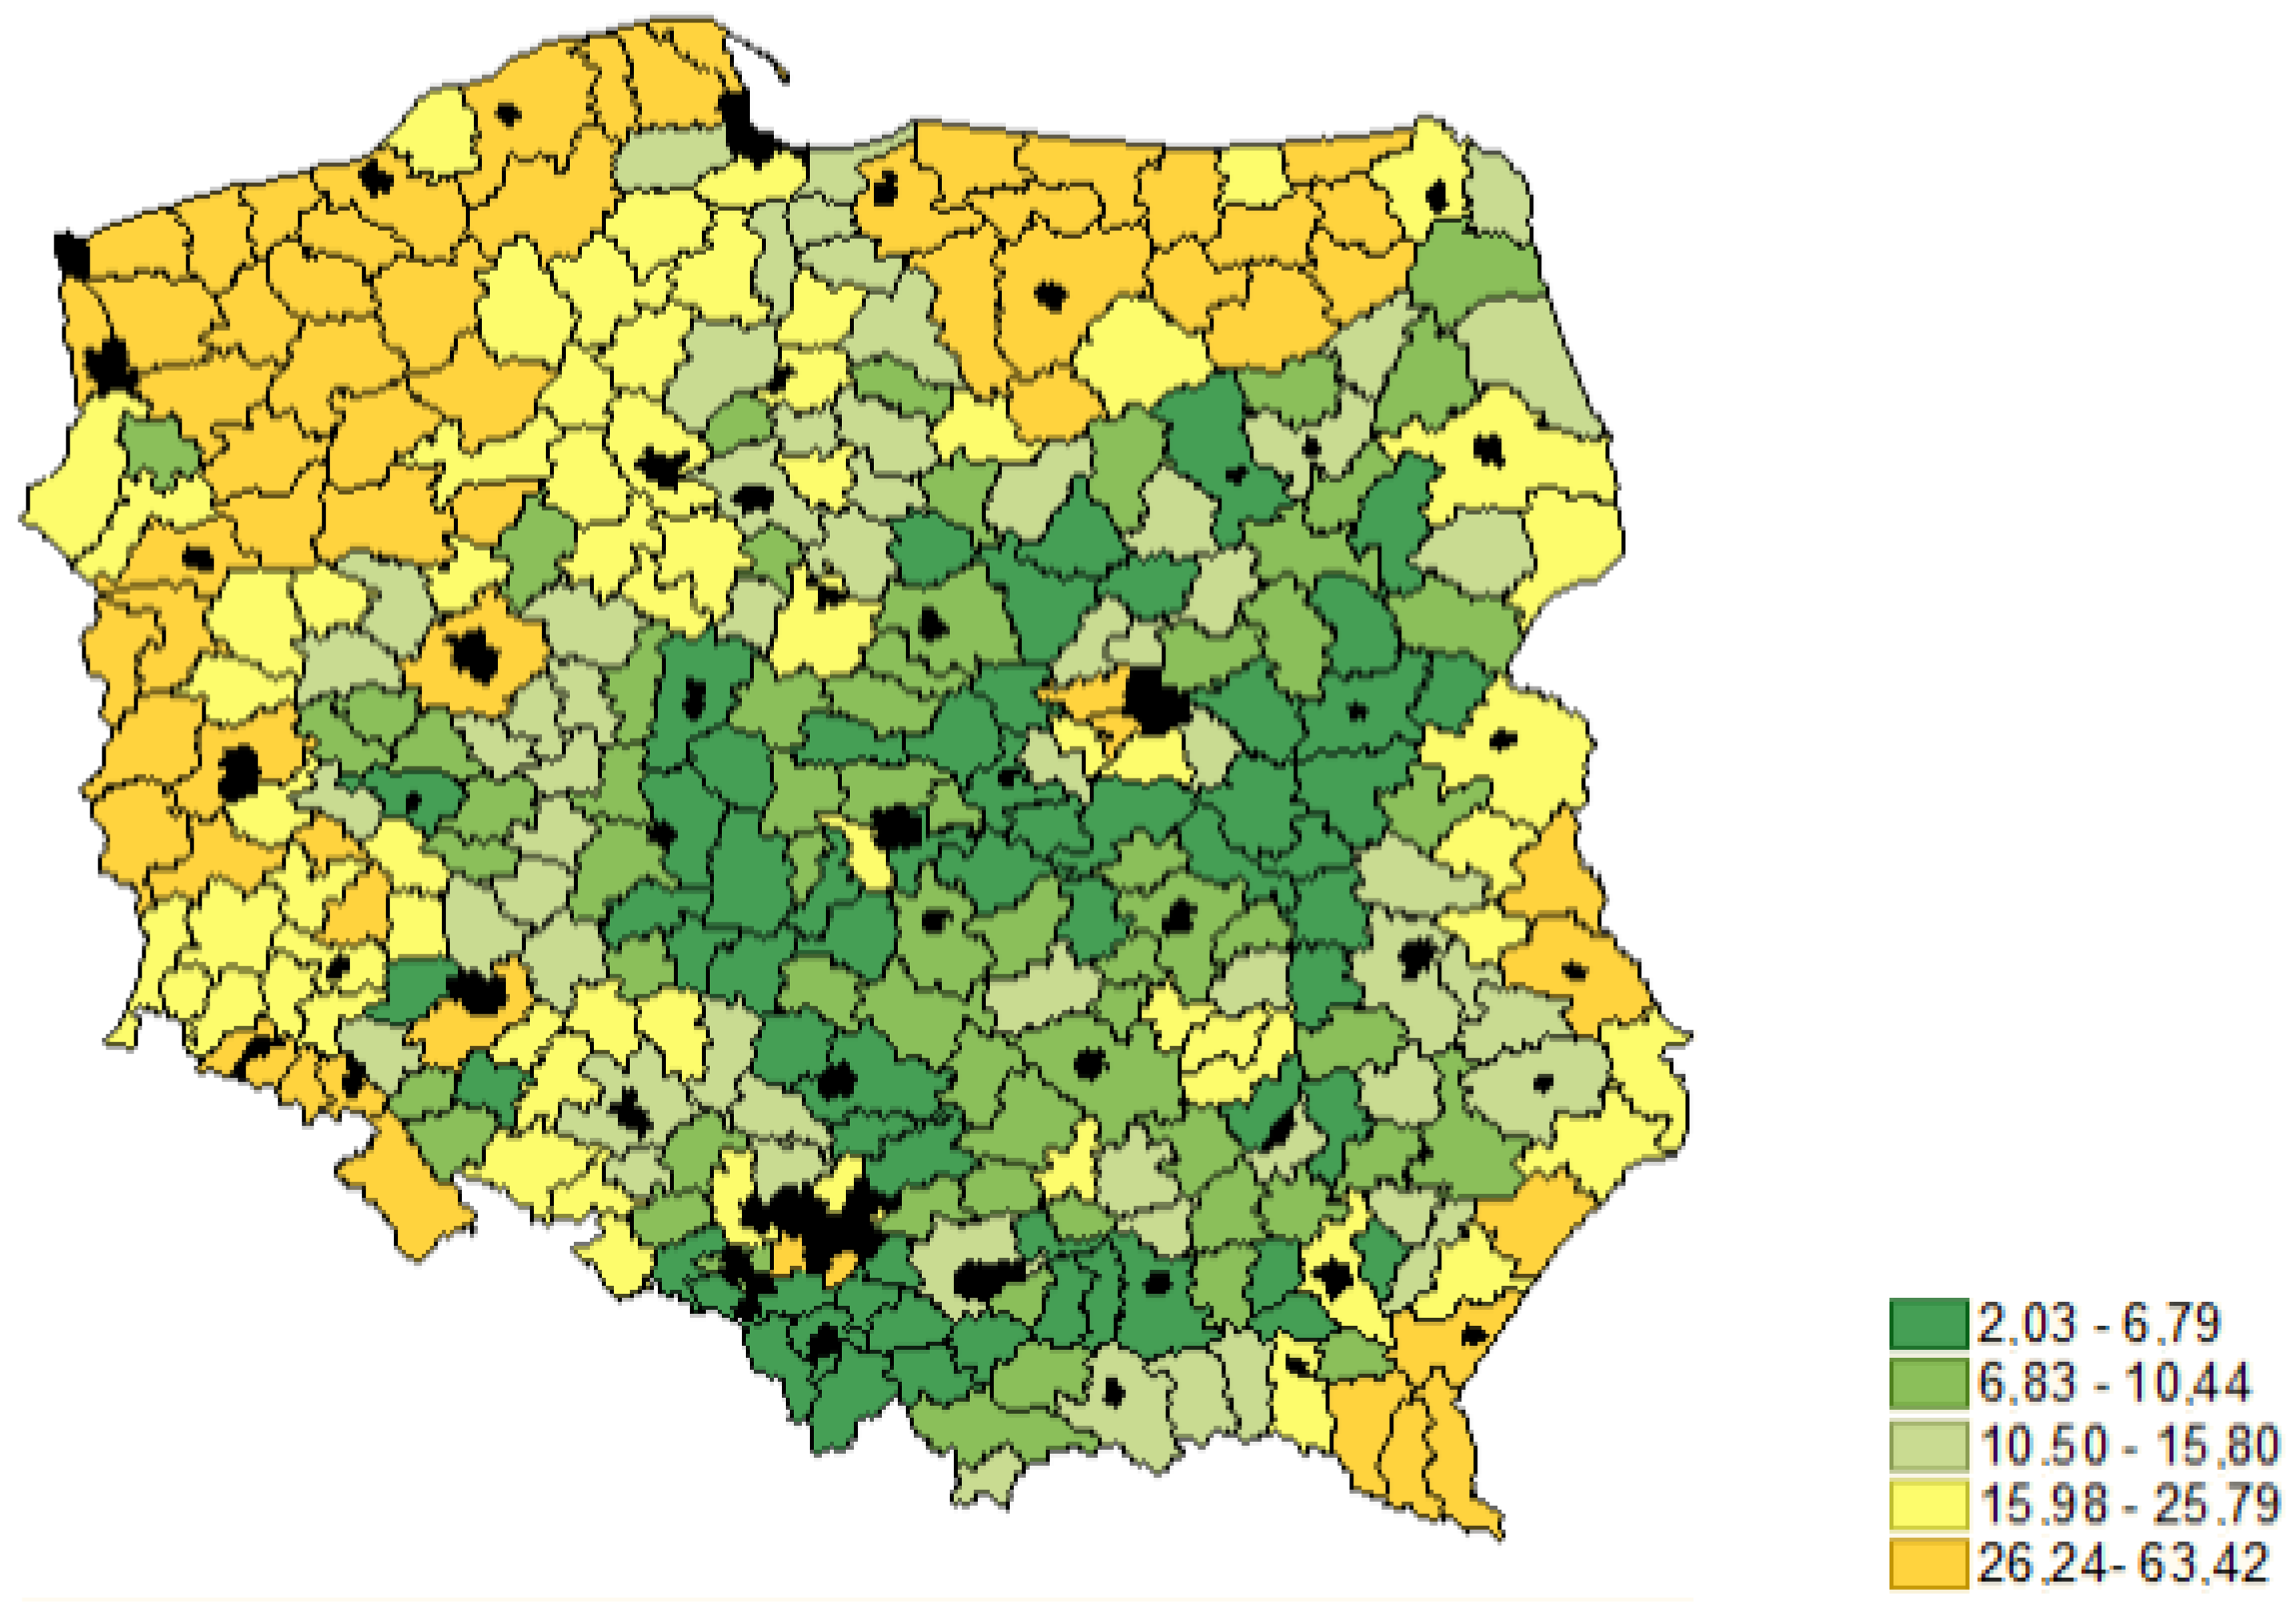
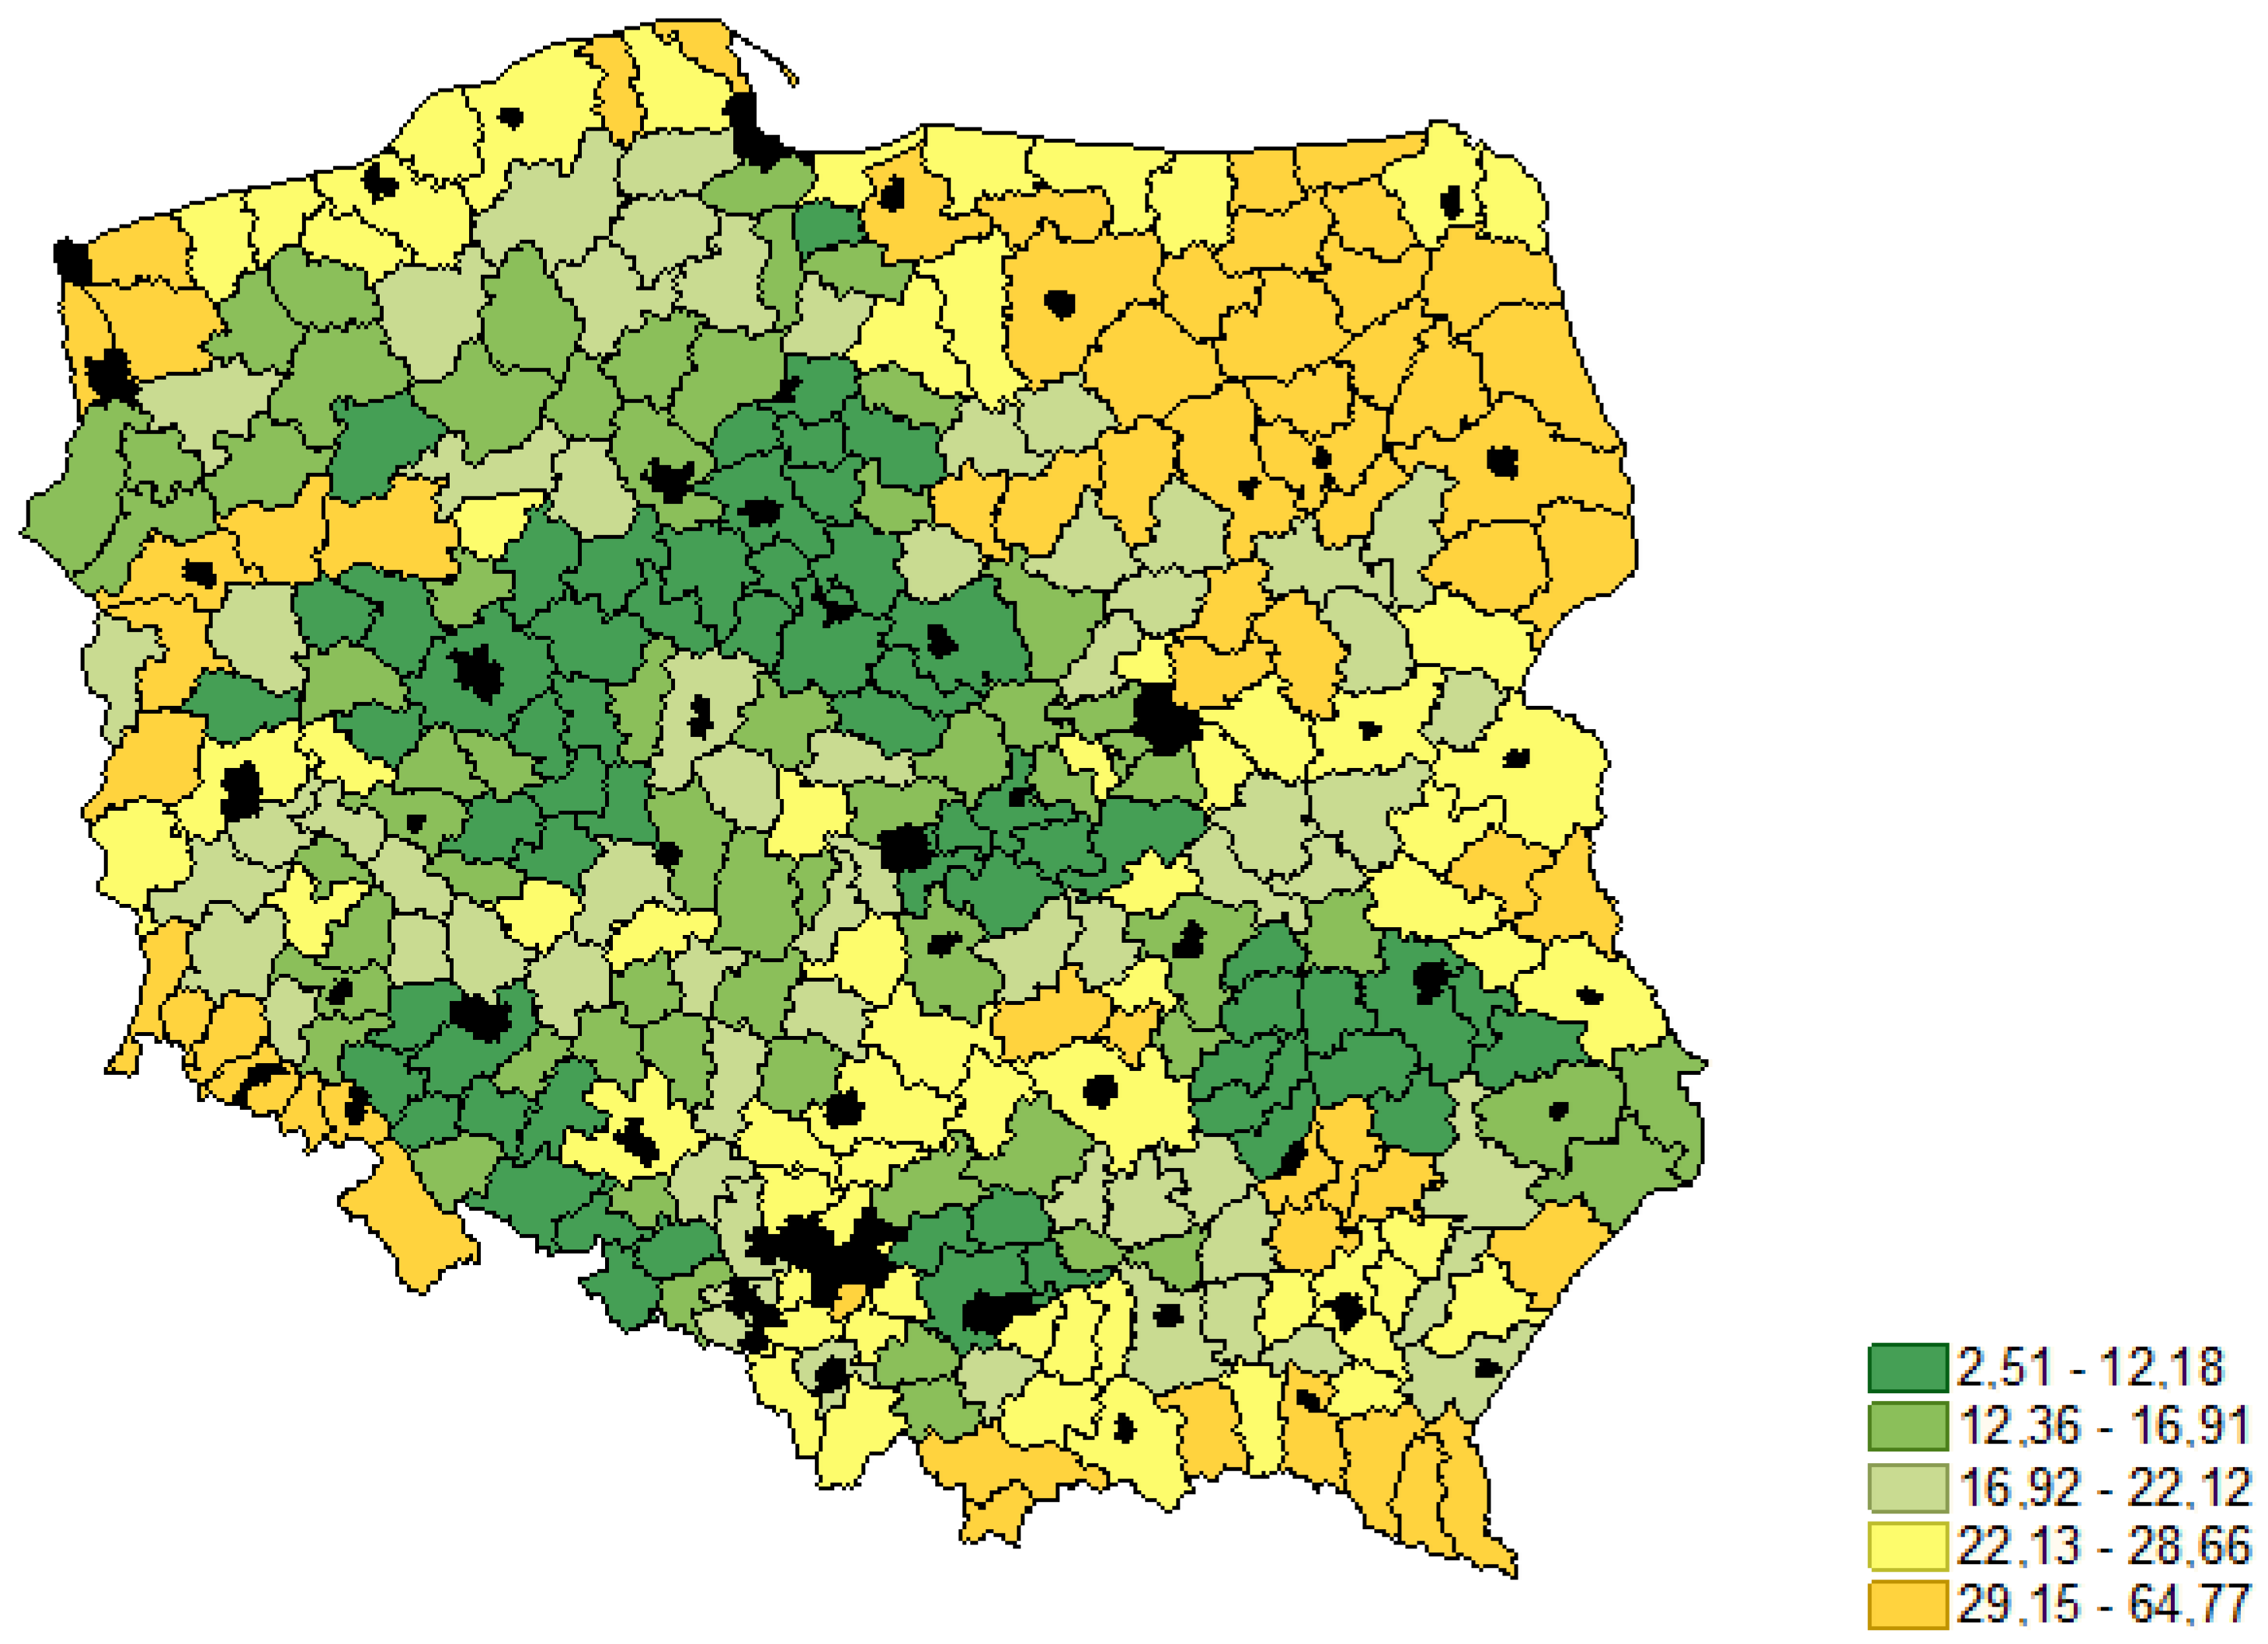
Figure 2.
Share of environmental funds in payments disbursed under the 2014–2020 Rural Development Program (2014–2020 RDP payments = 100). Source: own compilation based on https://bdl.stat.gov.pl/bdl/start, accessed on 1 September 2023.
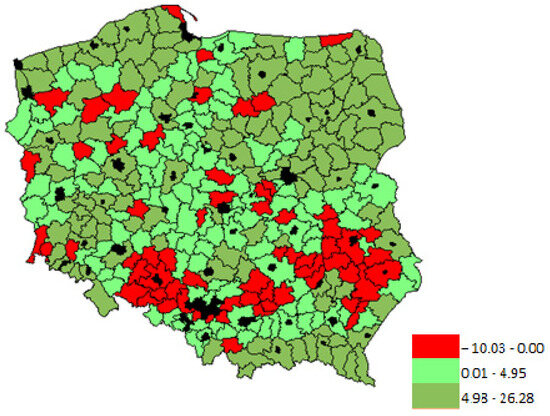
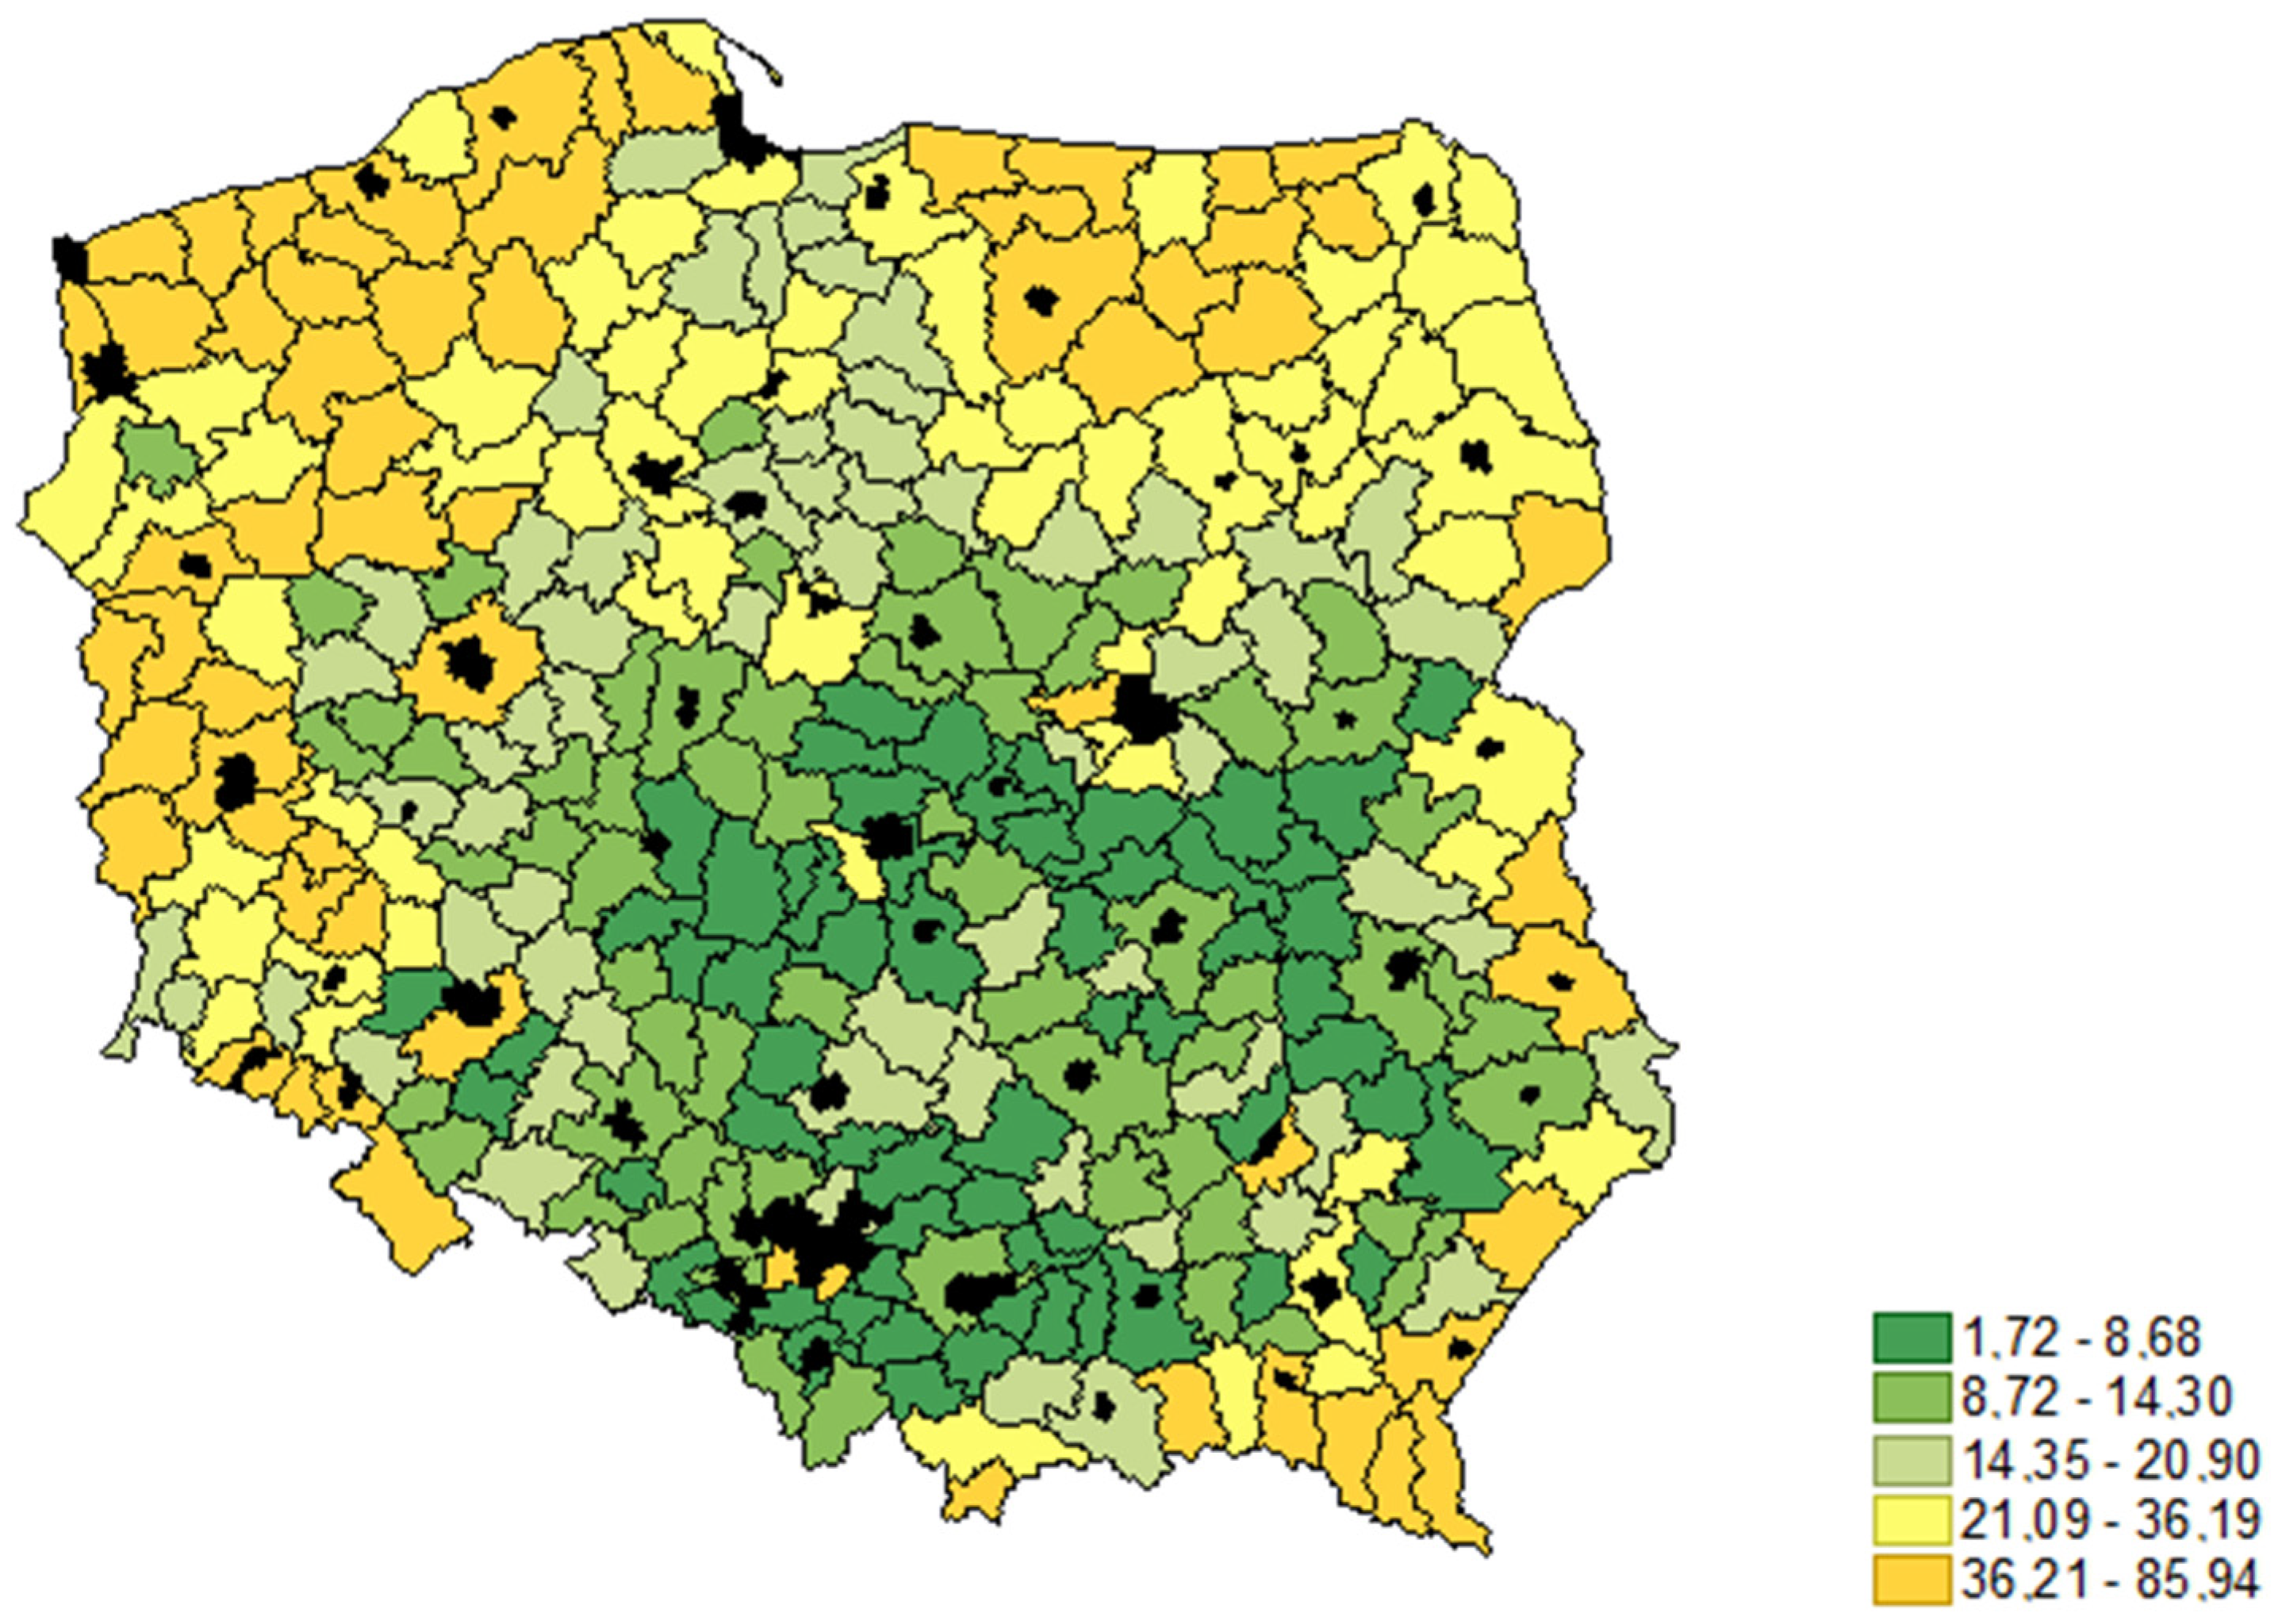
Figure 3.
Change in the share of payments disbursed under the Rural Development Program between 2007–2013 and 2014–2020 (percentage points). Source: own compilation based on https://bdl.stat.gov.pl/bdl/start, accessed on 1 September 2023.
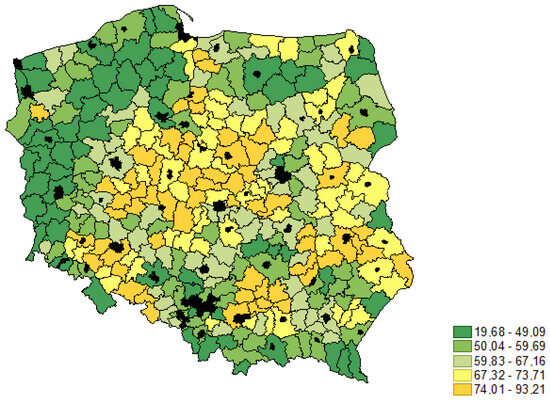
Figure 4.
Share of agricultural land (total area of the district = 100). Source: own compilation based on https://bdl.stat.gov.pl/bdl/start, accessed on 1 September 2023.
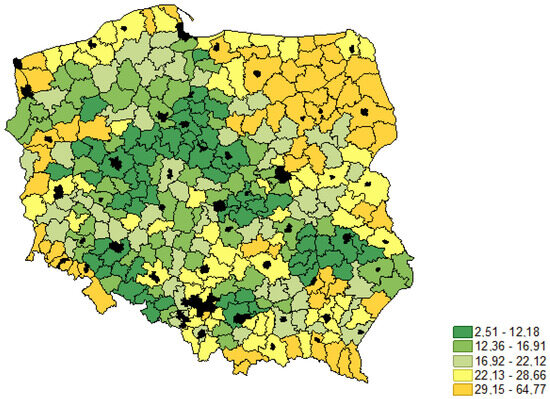
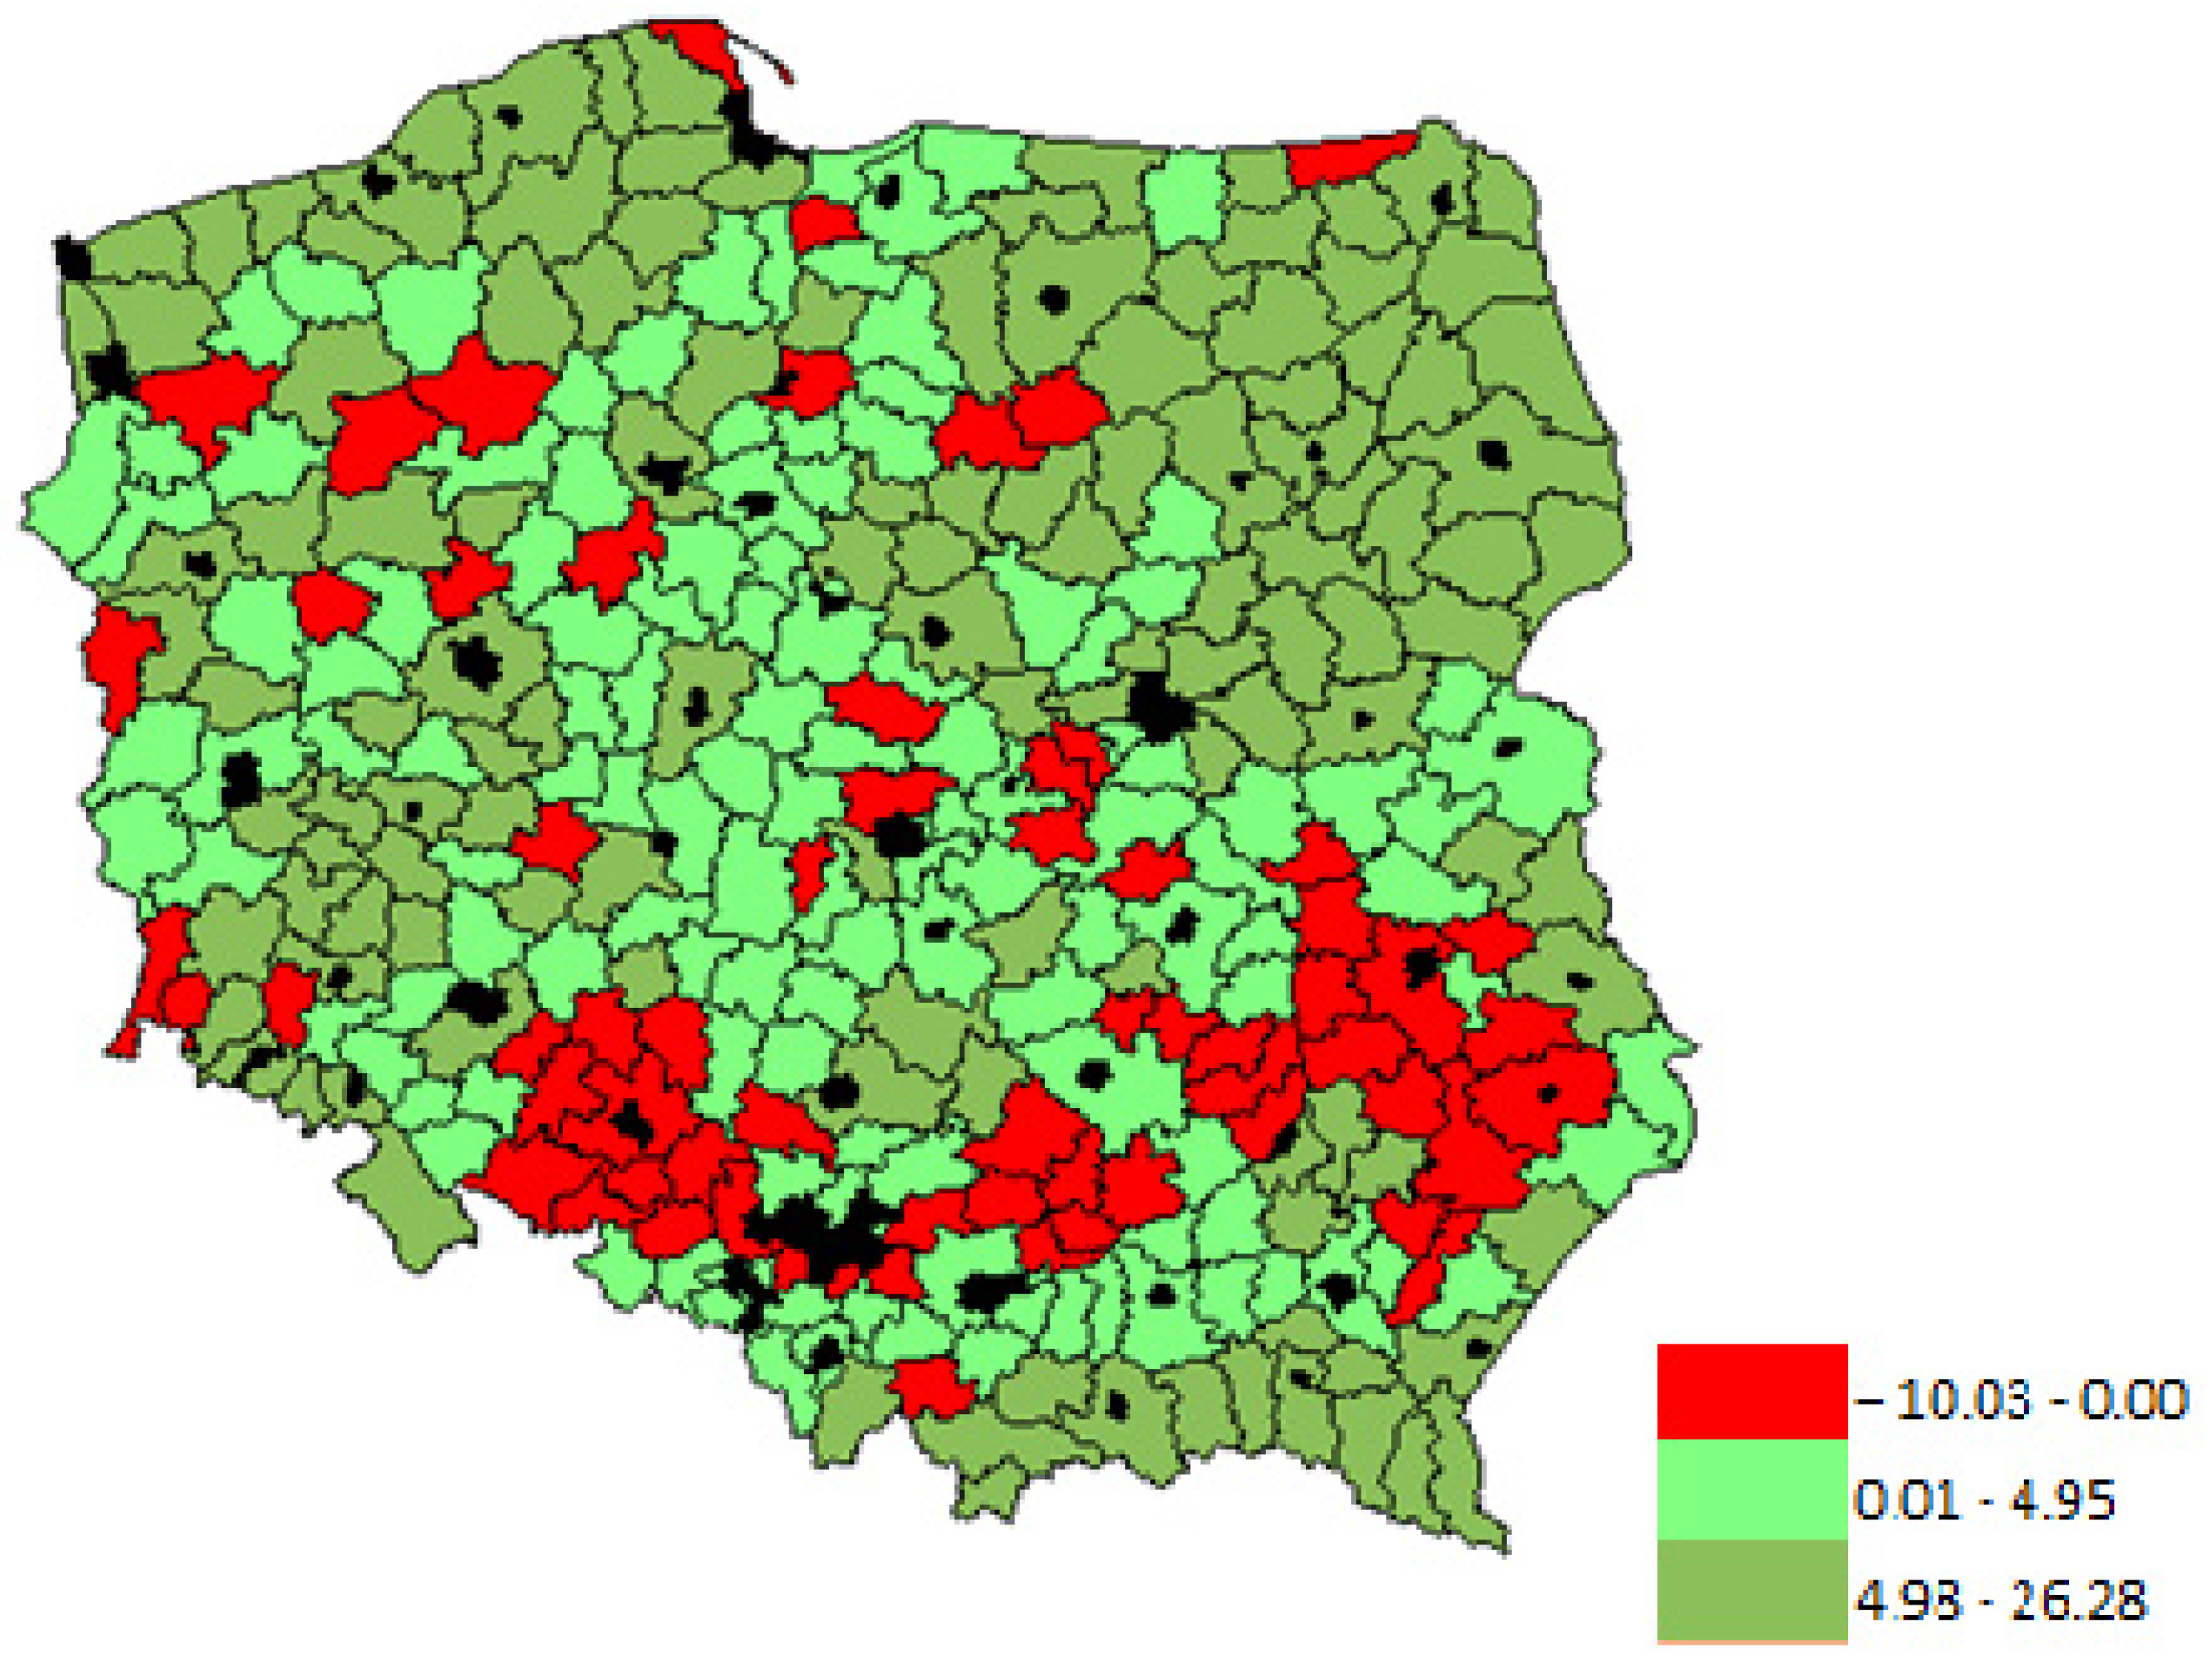
Figure 5.
Share of permanent pasture (total area of agricultural land in the district = 100). Source: own compilation based on https://bdl.stat.gov.pl/bdl/start, accessed on 1 September 2023.
4. Results and Discussion
Table 1 and Table 2 suggest that in Poland, the 2007–2013 RDP had a larger budget than the 2014–2020 RDP, which translated into greater payments. Nevertheless, the second period covered by the analysis saw a relatively higher share of environmental payments (15% in 2007–2013 vs. 21% in 2014–2020). In both periods, agri-environmental payments had a prevailing share in the forms of support covered by the study (with EUR 2.279 million and EUR 1.683 million, respectively). However, as mentioned earlier, in 2007–2013, the agri-environmental program also included the measure “Organic Farming” which became independent in 2014–2020.
The analysis of correlation strength between the parameters of how environmental RDP funds were used and selected characteristics of the districts suggests that agricultural producers tend quite strongly to continue using the environmental forms of support (Table 3). The correlation between the share of payments in the first and the second programming period is 0.888, and the correlation between the share of payments in 2014–2020 and the change recorded between both periods is 0.665. This could preliminarily suggest that, essentially, the natural and geographic factors described earlier (which are time-invariant in the short term) are an equally constant determinant of how the support is used. Conversely, no relationship exists between the wealth of communes located in particular districts (measured as the share of own incomes) and the level of use of aid forms covered by the analysis. This is a foreseeable and logical result, because the funds allocated to environmental measures are delivered to farms, and therefore the development level of the local economy does not necessarily determine the farmers’ decision-making. What this condition also reveals is agriculture enjoys a specific kind of autonomy, as a sector whose development is largely independent of how non-agricultural industries develop. In turn, the absence of a relationship between the use of environmental funds under both RDPs and the agrarian structure, presented as the share of farms larger than 10 ha, may give rise to more doubts. It follows from the study on the absorption of 2nd pillar funds in Polish agriculture that farms with an above-average production potential (relating to their land resources and total assets) make greater use of EU investment funds than smaller holdings [44]. Similar conclusions can be drawn from research by Sadowski et al. [22] and Kiryluk-Dryjska et al. [21], which suggests that the share of larger farms in a territorial unit was of key importance to geographic differences in the use of investment funds. Moreover, as indicated by Kiryluk-Dryjska et al. [21], the use level of measures intended to diversify the rural economy and improve the quality of rural living is also strongly related to the level of the local farming potential. Note however that the financing offered under the RDP for the measures covered by those studies was mostly accessed by larger operators. This was due both to formal access thresholds and to microeconomic needs. In the case of agri-environmental funds, the above is not true. First, the size of the farm does not pose any formal obstacle; second, support is granted depending on the use of ongoing practices designed to improve the environmental condition and does not involve purchasing any fixed assets. Thus, no economies of scale occur. However, the criterion for accessing these funds is often related to having naturally valuable land (e.g., in the case of some agri-environmental packages), and always requires the beneficiaries to apply the practices imposed in regulations for support programs. Note also that the agricultural suitability of a region often contradicts its natural values. In the past, territories with soils particularly suitable for farming purposes were converted into agricultural land and, as such, currently do not feature any natural values of special importance. Conversely, wherever land was less suitable for farming uses (especially including intensive agriculture and plough tillage), naturally valuable areas exist to this day. Therefore, it is understandable that quite a high negative correlation exists between the use of environmental funds in 2014–2020 and the share of agricultural land in the total area of a district, and that the correlation is quite high and positive in the case of the share of permanent pasture in agricultural land. Conversely, quite low correlation levels in 2007–2013 could be indicative of a “learning” process and of some kind of diffusion of knowledge of how to access these funds (for more details, see the graphical part of the analysis).
In the first programming period covered by this analysis, the greatest share of environmental RDP funds was found in districts located in the northern and western parts of the country (Figure 1). In the northeast, the 19th-century border between the then-existing Russia and Germany is still noticeable. Also, the areas with particularly high activity rates are located in the northwestern and western parts of the country, matching the territories regained by Poland after World War 2. A large part of environmental forms of support under the 2007–2013 RDP were directly related to practices applicable to permanent pasture (e.g., some packages of the agri-environmental program). Also, as mentioned earlier, the support has a stronger economic rationale in areas less favorable to farming. In this context, there is a noticeable similarity between the maps of the share of funds allocated to that kind of measures in 2007–2013 (Figure 1); the share of agricultural land in the total area of districts (Figure 4); and the share of permanent pasture in the districts’ agricultural land (Figure 5). At the same time, these aspects also reveal some differences. For instance, in northeast Poland (eastwards from the historical German-Russian border), the share of permanent pasture in agricultural land is relatively high while agricultural land has a small share in the districts’ total area. However, it witnessed quite moderate activity in accessing environmental funds. Things looked similar in southeast Poland. These observations are coherent with the correlation table (Table 3) which shows that in 2007–2013, the correlation between the share of environmental payments and the share of agricultural land was below −0.500, and the correlation with the share of permanent pasture was even smaller (0.283). It means that in the first period covered by the study, the beneficiaries generally made a rational use of environmental funds; the highest shares were recorded in areas with a dominant role of permanent pasture. Nevertheless, there were territories where—despite having the right potential—the farmers refrained from applying for funds. Ultimately, it can be assumed that the activity in seeking funds was driven to a higher degree by historical aspects, which is most noticeable in the northeast and west of the country. While the authors realize that these issues require a more in-depth investigation, it is reasonable to believe that the root cause of this phenomenon is the privatization procedure of state-owned agricultural holdings. They were often delivered for use to farmers who demonstrated a more informed approach not only to production itself but also to the whole set of agricultural policy instruments [45,46]. The fact alone of acquiring land from the state required an active attitude, just like applying for environmental funds under the RDP. Being the owner of permanent pastures and running a farm in naturally valuable areas was a determinant for the ways of using the broad range of aid measures under the 2nd pillar. In this context, note that the activity mentioned above was witnessed not only in areas with a particularly concentrated agrarian structure. Indeed, as indicated earlier, the correlation between the share of environmental funds and the share of farms larger than 10 ha is quite small (Table 3).
The next programming period (2014–2020) saw a slight change in this situation (Figure 2). First, there was an increase in the area where environmental forms of RDP support enjoyed greater popularity (meaning a higher share). This could be partly due to the agricultural policy placing a stronger emphasis on environmental matters. However, having in mind the key aspect of the microeconomic rationale behind the beneficiaries’ voluntary decision, the above can be mostly explained by experiences derived from the previous period. Note that in northeast Poland, the districts where the share of payments under consideration was above 21.09% were located not only within the historical German partition or in the territories regained after World War 2. However, they still mostly consist of territories with a small share of agricultural land in total area of the district (Figure 4) and with a large share of permanent pasture in agricultural land (Figure 5). Therefore, the increased interest in these payments (compared to the previous period) was well-founded, and could be driven by a specific diffusion of knowledge on how to apply for, and derive benefits from, the dedicated funds. It needs to be emphasized that a common reason why the farmers choose not to apply for funds is that they lack knowledge and have some concerns regarding the submission and the implementation of the project (which is due to complex bureaucratic procedures). The fact that the period 2014–2020 saw a stronger relationship between land use patterns and the importance of environmental funds is also reflected in a higher negative correlation (Table 3) it had with the share of agricultural land (−0.559) and a positive correlation it had with the share of permanent pasture (0.515).
At the same time, it needs to be emphasized that—as demonstrated by the analysis of changes in the share of RDP payments in northeast and north Poland—the greatest increments were witnessed indeed in the use of environmental funds (Figure 3). Generally, growth in that respect is noticeable in most Polish districts. However, the highest growth rates were recorded in the districts referred to above, i.e., in those that reported high shares of environmental payments already in 2007–2013. Conversely, a decline in the importance of these funds was discovered in districts located in southern and eastern Poland. Note that they reported a small share of environmental payments already in the first programming period. Most of them are areas with a small share of permanent pasture (Figure 5). This is also indicated by a strong correlation (Table 3) between the share of permanent pasture and the change in the share of payments (0.624). These evolutions could be indicative of farms in some districts becoming specialized in making active use of environmental funds. There are reasons for claiming that it resulted in deepening the differences between regions in how they use this kind of payment. Considerable variation in how main environmental measures are implemented between regions was also found by Matyka [47]. As mentioned earlier, southeast Poland has a fragmented agrarian structure. As local farms do not have enough potential to meet market requirements, the expectation for their owners is to show greater commitment to using measures offered under the 2nd pillar of the CAP, including environmental measures. Furthermore, a study by Kiryluk-Dryjska et al. [21] found that the activity of farmers in applying for measures under the 2007–2013 RDP was much smaller in southern and eastern Poland voivodeships than in northwestern regions.
5. Conclusions
This paper assessed the changes in agricultural producers’ use of funds allocated for environmental measures under the 2007–2013 RDP and 2014–2020 RDP in Poland. The extent to which environmental CAP funds are used was examined on a geographic basis, so as to take account of socioeconomic and environmental characteristics of districts. The study presented in this paper provides grounds for formulating a couple of key conclusions. It found a relative increase in the importance of funds allocated to environmental measures in the mix of payments under the RDP. However, in absolute terms, smaller resources were allocated to them in 2014–2020 because of the decline in the overall RDP budget. The analysis found that farmers tend to continue accessing environmentally oriented forms of support offered under successive RDPs. Moreover, increased interest in that kind of payment was shown by agricultural producers located in areas that demonstrated greater activity in accessing environmental funds already in previous years. Thus, the study discovered growing differences between regions in how they use RDP funds. Usually, the differences can be explained by land use patterns. This is mostly manifested by high levels of positive correlation between the share of permanent pasture and the use of environmental payments. In turn, a negative correlation exists between the latter and the share of agricultural land, which is particularly noticeable in 2014–2020. Contrary to what was the case for investment measures, there was no relationship between the differences in interest in accessing environmental measures and the local agrarian structure. Also, no relationship exists between the wealth of communes and the level of use of aid forms covered by the analysis; this could mean that the development level of the local economy does not determine the farmers’ decision on whether or not to use environmental funds. Based on the above, the study found that the beneficiaries engaged in agricultural production in areas with natural conditions favorable to farming activities are less interested in accessing environmental funds, as it may be economically unviable to them. Generally, this is a beneficial process because it shows that the agricultural producers’ microeconomic decisions may contribute to overarching social goals. For users of land that is favorable to farming while usually having no natural values, that goal would be to ensure food security. Conversely, wherever there is agricultural land with low production potential and high natural values, focus should be placed on environmental protection measures, especially if they include extensive farming. At the same time, it needs to be emphasized that ultimately, the use of funds that are applied for on a voluntary basis largely depends on the potential beneficiaries’ environmental awareness and activity. Indeed, as revealed by this study, in some geographic areas which had the potential for being granted environmental funds, the farmers decided not to apply for them. Based on the above, it was concluded that the beneficiaries’ activity in that respect is also largely impacted by historical events.
Findings from this study could become a source of recommendations for agricultural policy. Namely, each aid measure should be more fine-tuned to take account of local particularities, including both natural conditions (as is the case for environmental measures) and structural aspects (which are important for investment measures). Thus, the results of this study may enhance research on land-use planning and strategic agriculture with knowledge of how CAP instruments affect the geographic structure of farming.
The authors realize that this study is subject to certain limitations. It was carried out at the level of territorial units, and therefore the need arises to supplement this research project with a description of the particularities of farms that decided to use the environmental funds.
Author Contributions
Conceptualization, A.B.-N., A.S. and M.W.; methodology, A.B.-N. and A.S.; software, A.B.-N. and A.S.; validation, A.B.-N. and A.S.; formal analysis, A.B.-N., A.S. and M.W.; investigation, A.B.-N. and A.S.; resources, A.B.-N. and A.S.; data curation, A.S.; writing—original draft preparation, A.B.-N., A.S. and M.W.; writing—review and editing, A.B.-N., A.S. and M.W.; visualization, A.B.-N. and A.S.; supervision, A.B.-N.; project administration, A.B.-N. and A.S.; funding acquisition, A.B.-N., A.S. and M.W. All authors have read and agreed to the published version of the manuscript.
Funding
This research received no external funding.
Institutional Review Board Statement
Not applicable.
Informed Consent Statement
Not applicable.
Data Availability Statement
The original contributions presented in the study are included in the article, further inquiries can be directed to the corresponding author.
Conflicts of Interest
The authors declare no conflict of interest.
References
- Swinton, S.M.; Lupi, F.; Robertson, G.P.; Hamilton, S.K. Ecosystem services and agriculture: Cultivating agricultural ecosystems for diverse benefits. Ecol. Econ. 2007, 64, 245–252. [Google Scholar] [CrossRef]
- Hanson, C.; Finisdore, J.; Ranganathan, J.; Iceland, C. The Corporate Ecosystem Services Review: Guidelines for Identifying Business Risks and Opportunities Arising from Ecosystem Change; World Resources Institute: Washington, DC, USA, 2012; p. 48. [Google Scholar]
- Power, A.G. Ecosystem services and agriculture: Tradeoffs and synergies. Philos. Trans. R. Soc. B 2010, 365, 2959–2971. [Google Scholar] [CrossRef] [PubMed]
- Zhang, W.; Ricketts, T.H.; Kremen, C.; Carney, K.; Swinton, S.M. Ecosystem services and dis-services to agriculture. Ecol. Econ. 2007, 64, 253–260. [Google Scholar] [CrossRef]
- Huang, J.; Tichit, M.; Poulot, M.; Darly, S.; Li, S.; Petit, C.; Aubry, C. Comparative review of multifunctionality and ecosystem services in sustainable agriculture. J. Environ. Manag. 2015, 149, 138–147. [Google Scholar] [CrossRef]
- Stoate, C.; Baldi, A.; Beja, P.; Boatman, N.D.; Herzon, I.; van Doorn, A.; de Snoo, G.R.; Rakosy, L.; Ramwell, C. Ecological impacts of early 21st century agricultural change in Europe—A review. J. Environ. Manag. 2009, 91, 22–46. [Google Scholar] [CrossRef]
- Landis, D.A. Designing agricultural landscapes for biodiversity-based ecosystem services. Basic Appl. Ecol. 2017, 18, 1–12. [Google Scholar] [CrossRef]
- Heyl, K.; Döring, T.; Garske, B.; Stubenrauch, J.; Ekardt, F. The common agricultural policy beyond 2020: A critical review in light of global environmental goals. Rev. Eur. Comp. Int. Environ. Law 2020, 30, 95–106. [Google Scholar] [CrossRef]
- Morgan, S.L.; Marsden, T.; Miele, M.; Morley, A. Agricultural multifunctionality and farmers’ entrepreneurial skills: A study of Tuscan and Welsh farmers. J. Rural Stud. 2010, 26, 116–129. [Google Scholar] [CrossRef]
- Van Zanten, B.T.; Zasada, I.; Koetse, M.J.; Ungaro, F.; Häfner, K.; Verburg, P.H. A comparative approach to assess the contribution of landscape features to aesthetic and recreational values in agricultural landscapes. Ecosyst. Serv. 2016, 17, 87–98. [Google Scholar] [CrossRef]
- Hodge, I. Agri-environmental Relationships and the Choice of Policy Mechanism. World Econ. 2002, 23, 257–273. [Google Scholar] [CrossRef]
- Glebe, T.W. Multifunctional Agriculture: How “Green” Is the “European Model of Agriculture”? Discussion Paper 01-2 003, Technische Universitat Munchen, Environmental Economics, Resource Economics and Agricultural Policy Research Group: München, Germany, 2003; pp. 1–27.
- Mennig, P.; Sauer, J. The impact of agri-environment schemes on farm productivity: A DID-matching approach. Eur. Rev. Agric. Econ. 2020, 47, 1045–1093. [Google Scholar] [CrossRef]
- Poczta, W. Wpływ akcesji Polski do Unii Europejskiej na sytuację rolnictwa i rolników. In Polska w Unii Europejskiej. Bilans korzyści; Kluza, S., Ed.; Wyd. Jedność: Kielce, Poland, 2023. [Google Scholar]
- Tilman, D.; Cassman, K.G.; Matson, P.A.; Naylor, R.; Polasky, S. Agricultural sustainability and intensive production practices. Nature 2002, 418, 671–677. [Google Scholar] [CrossRef] [PubMed]
- Lactacz-Lohmann, U. A Policy Decision Framework for Devising Optimal Implementation Strategies for Good Agricultural And Environmental Policy Practices; COM/AGR/CA/ENV/EPOC (2000)56/FINAL; OECD: Paris, France, 2001; pp. 1–33. [Google Scholar]
- Batáry, P.; Dicks, L.V.; Kleijn, D.; Sutherland, W.J. The role of agri-environment schemes in conservation and environmental management. Conserv. Biol. 2015, 29, 1006–1016. [Google Scholar] [CrossRef]
- Camaioni, B.; Esposti, R.; Lobianco, A.; Pagliacci, F.; Sotte, F. How rural is the EU RDP? An analysis through spatial fund allocation. Bio-Based Appl. Econ. 2013, 2, 277–300. [Google Scholar] [CrossRef]
- Crescenzi, R.; De Filippis, F.; Pierangeli, F. In Tandem for Cohesion? Synergies and Conflicts between Regional and Agricultural Policies of the European Union. Reg. Stud. 2014, 49, 681–704. [Google Scholar] [CrossRef]
- Bonfiglio, S.; Camaioni, B.; Coderoni, S.; Esposti, R.; Pagliacci, F.; Sotte, F. Are rural regions prioritizing knowledge transfer and innovation? Evidence from Rural Development Policy expenditure across the EU space. J. Rural Stud. 2017, 53, 78–87. [Google Scholar] [CrossRef]
- Kiryluk-Dryjska, E.; Beba, P.; Poczta, W. Local determinants of the Common Agricultural Policy rural development funds’ distribution in Poland and their spatial implications. J. Rural Stud. 2020, 74, 201–209. [Google Scholar] [CrossRef]
- Sadowski, A.; Wojcieszak-Zbierska, M.; Beba, P. Territorial differences in agricultural investments co-financed by the European Union in Poland. Land Use Policy 2021, 100, 104934. [Google Scholar]
- Wojcieszak-Zbierska, M.; Sadowski, A. Use of Union Funds in Developing Agricultural Entrepreneurship between 2014 and 2020 in Poland. Agriculture 2024, 14, 83. [Google Scholar] [CrossRef]
- Ederveen, S.; Gorter, J.; De Mooij, R.; Nahuis, R. Funds and Games: The Economics of European Cohesion Policy; Occasional Paper no. 3; European Network of European Policy Research Institutes: Brussels, Belgium, 2002. [Google Scholar]
- Rodriguez-Pose, A.; Fratesi, U. Between Development and Social Policies: The Impact of European Structural Funds in Objective 1 Regions. Reg. Stud. 2004, 38, 97–113. [Google Scholar] [CrossRef]
- Bradley, J. Evaluating the impact of European Union Cohesion policy in less-developed countries and regions. Reg. Stud. 2006, 40, 189–200. [Google Scholar] [CrossRef]
- Bachtler, J.; Gorzelak, G. Reforming EU Cohesion Policy. Policy Stud. J. 2007, 28, 309–326. [Google Scholar] [CrossRef]
- Santos, I. Evaluating EU structural policy. Soc. Econ. 2008, 30, 195–208. [Google Scholar] [CrossRef]
- Sierhej, R. EU funds in EU new member states: Available resources and possible economic impact. Soc. Econ. 2008, 30, 181–193. [Google Scholar] [CrossRef]
- Mohl, P.; Hagen, T. Do EU structural funds promote regional growth? New evidence from various panel data approaches. Reg. Sci. Urban Econ. 2010, 40, 353–365. [Google Scholar] [CrossRef]
- Esposti, R. Regional growth and policies in the European Union: Does the common agricultural policy have a counter-treatment effect? Am. J. Agric. Econ. 2007, 89, 116–134. [Google Scholar] [CrossRef]
- Heiko, H.; Herrmann, R. The two dimensions of policy impacts on economic cohesion: Concept and illustration for the CAP. Food Policy 2012, 37, 483–491. [Google Scholar] [CrossRef]
- Shucksmith, M.; Thomson, K.J.; Roberts, D. (Eds.) The CAP and the Regions: The Territorial Impact of the Common Agricultural Policy; CABI Publishing: Wallingford, UK, 2005. [Google Scholar]
- Allanson, P. On the characterization and measurement of the redistributive effect of agricultural policy. J. Agric. Econ. 2008, 59, 169–187. [Google Scholar] [CrossRef]
- Zindler, M.; Haensel, M.; Fricke, U.; Schmitt, T.M.; Tobisch, C.; Koellner, T. Improving Agri-environmental Schemes: Suggestions from Farmers and Nature Managers in a Central European Region. Environ. Manag. 2024, 73, 826–840. [Google Scholar] [CrossRef]
- Vilkė, R.; Gedminaitė-Raudonė, Ž.; Baležentis, T.; Štreimikienė, D. Farmers’ Awareness of Eco-Efficiency and Cleaner Production as Environmental Responsibility: Lithuanian Case. Corp. Soc. Responsib. Environ. Manag. 2021, 28, 288–298. [Google Scholar] [CrossRef]
- Defrancesco, E.; Gatto, P.; Runge, F.; Trestini, S. Factors affecting farmers’ participation in agri-environmental measures: A Northern Italian perspective. J. Agric. Econ. 2008, 59, 114–131. [Google Scholar] [CrossRef]
- Pouliquen, A. Integration of the Eastern European countries with the European Union: From boom to crisis in agriculture (part I). Probl. Agric. Econ. 2011, 327, 3–40. [Google Scholar]
- Sroka, W. Historyczne uwarunkowania dominacji drobnych gospodarstw rolnych w rolnictwie Europy Środkowo-Wschodniej. Probl. Drobnych Gospod. Rolnych 2015, 4, 61–73. [Google Scholar]
- Baer-Nawrocka, A.; Poczta, W. Polish agriculture—Changes and regional differences. In Rural Poland 2018; Wilkin, J., Nurzyńska, I., Eds.; Scholar Publishing House: Warszawa, Poland, 2018; pp. 93–108. [Google Scholar]
- Grzelak, A. Związki gospodarstw rolnych z rynkiem w Polsce po roku 1990. Próba określenia intensywności i efektywności; Wyd. Akademii Ekonomicznej w Poznaniu: Poznań, Poland, 2008; p. 336. [Google Scholar]
- Ministry of Agriculture and Rural Development. Polish Rural Development Program (PRDP) 2007–2013. Available online: https://www.gov.pl/web/arimr/prow-2007-2013 (accessed on 20 January 2024).
- Statistics Poland 2024. Available online: https://bdl.stat.gov.pl/bdl/start (accessed on 24 May 2024).
- Biczkowski, M. Endogenous potential of rural areas vs. the structure and allocation of funds under the 2007–2013 RDP. J. Agribus. Rural Dev. 2019, 51, 5–14. [Google Scholar] [CrossRef]
- Halamska, M. Dekolektywizacja rolnictwa w Europie Środkowej i jej społeczne konsekwencje; Wyd. IRWIR PAN: Warszawa, Poland, 1998; p. 224. [Google Scholar]
- Zegar, J.S. Kwestia Agrarna w Polsce; Wyd. IERiGŻ-PIB: Warszawa, Poland, 2018. [Google Scholar]
- Matyka, M. Regional diversification of the intensity of implementation of selected RDP 2014-2020 measures against background environmental and organizational conditions. Ann. Pol. Assoc. Agric. Agribus. Econ. 2019, 21, 308–314. [Google Scholar] [CrossRef]
Disclaimer/Publisher’s Note: The statements, opinions and data contained in all publications are solely those of the individual author(s) and contributor(s) and not of MDPI and/or the editor(s). MDPI and/or the editor(s) disclaim responsibility for any injury to people or property resulting from any ideas, methods, instructions or products referred to in the content. |
© 2024 by the authors. Licensee MDPI, Basel, Switzerland. This article is an open access article distributed under the terms and conditions of the Creative Commons Attribution (CC BY) license (https://creativecommons.org/licenses/by/4.0/).