Abstract
Soil in karst areas is rare and precious, and karst carbon sinks play an important role in the global carbon cycle. Therefore, the purpose of karst soil improvement is to improve soil productivity and a carbon sink effect. Biomass amendment experiments in this study included three schemes: filter mud (FM), filter mud + straw + biogas slurry (FSB), and filter mud + straw + cow manure (FSC). The characteristics of soil CO2 production, transport, and the effect on soil respiration carbon emissions in two years were compared and analyzed. The results were as follows: 1. The rate, amount, and depth of CO2 concentration were affected by the combinations with biogas slurry (easy to leach) or cow manure (difficult to decompose). 2. The diurnal variation curves of soil respiration in the FSB- and FSC-improved soils lagged behind those in the control soil for three hours. While the curves of FM-improved soil and the control soil were nearly the same. 3. Soil–air carbon emissions increased by 35.2 tCO2/(km2·a−1) under the FM scheme, decreased by 212.9 tCO2/(km2·a−1) under the FSB scheme, and increased by 279.5 tCO2/(km2·a−1) under the FSC scheme. The results were related to weather CO2 accumulation in the deep or surface layers under different schemes.
1. Introduction
Global climate warming has been shown to be related to cumulative CO2 emissions [1,2]. Rising concern over reducing CO2 levels in the atmosphere has resulted in increased awareness of soil, which is the largest reservoir of carbon in the terrestrial biosphere [3,4,5], and there are significant CO2 sources and potentials for reducing emissions, especially for agricultural soil [6,7,8]. Soil management practices, such as the amendment of agricultural residues, may enhance soil carbon sequestration by increasing carbon inputs and/or reducing soil respiration [9,10,11].
In karst areas in China, the soil, being degraded, yields poorly, thus rendering the task of soil improvement challenging [12]. Filter mud (FM) is one of the by-products produced during the process of making sugar from sugarcane. It is dark brown to black, soft and porous, and rich in degradable organic matter (OM), trace elements, and cellulose. FM, as a kind of biomass, can meet the nutritional requirements of plant growth and play a role in loosening soil and improving soil quality [13,14,15]. The carbon-nitrogen ratios of FM and straw are relatively high, and the nitrogen supply is insufficient, leading to nitrogen capture by microorganisms and plants [16,17]. Therefore, livestock manure is a commonly used nitrogen additive [17,18]. Biogas slurry (BS) is obtained by the anaerobic fermentation of animal manure and is a kind of organic liquid fertilizer that contains many active substances, hydrolytic enzymes, organic acids, and organic and inorganic nutrients [19]. Cattle manure (CM) had a high yield, and there is a large total amount in karst mountainous areas. Therefore, the total amounts of mineral elements and nutrients are relatively large, and this material is also a kind of biomass resource that is worthy of promotion and application.
To achieve sustainable development, karst soil agricultural activities should not only focus on enhancing fertility but also on the effects of inorganic carbon sequestration and carbon emission reduction [20,21]. Our previous soil improvement experiments demonstrated that the accumulation of soil organic carbon, resulting from the abundant organic matter (OM) in the biomass, along with the accelerated dissolution of soil calcium carbonate, has enhanced the availability of essential nutrients for plant uptake [22,23,24]. Note that the increased dissolution rate of soil calcium carbonate was driven by the large amount of organic acids and CO2 produced by the decomposition of exogenous biomass. Specifically, we found that the application of FM and BS was more effective than CM in reducing the degassing of CO2 from soil water and enhancing the HCO3- flux into the underground water system, strengthening the inorganic carbon sequestration [25].
However, it is unknown whether these biomass-based methods can reduce the carbon emissions from the soil to the air. Thus, in this study, we analyzed the decomposition process and CO2 release flux of these biomass materials under different combination schemes.
2. Materials and Methods
2.1. Study Site
The field experiment was conducted from 2014 to 2015 at the Guohua Demonstration Zone of Comprehensive Governance of Rocky Desertification, Guangxi Zhuang Autonomous Region, China (23°23′, 107°23′). This site has typical karst peak cluster depression landform, and the epikarst zone is well developed. The area has a typical humid tropical and subtropical monsoon climate. The rainy season is from May to September, and the dry season is from October to April the following year.
There were three plots (I, II, and III) that were located close together in the experiment. Overall, no obvious gravels were found at the 0–20 cm soil depth, and a small amount of gravel was found at the 20–40 cm soil depth. Soil compaction was moderate. The soil type was brown rendzina, which has poor water and fertilizer conservation abilities. Soil consolidation was serious on continuously sunny days, and the soil was exceedingly sticky when rainwater was abundant. Samples collected from 0 to 20 cm depths were tested for the physical and chemical properties (Table 1). Soil OM density (0~20 cm) were calculated: Plot I (8.05 kg/m2) > Plot II (7.98 kg/m2) > Plot III (7.03 kg/m2).

Table 1.
Properties of soil.
2.2. Characteristics of FM and Mixed Farm Manure
FM was procured from a local sugarcane sugar mill. The main characteristics were as follows: pH, 7.47; OM, 531.2 (C g/kg); TN, 0.313 (%); TP, 0.178 (%); TK, 1.070 (%); Ca, 0.79 (%); Mg, 15.76 (%); exchangeable Ca, 206.52 (cmol/kg); and exchangeable Mg, 11.27 (cmol/kg).
Other materials used in combination with FM included straw (ST), biogas slurry (BS), and cow manure (CM). The ST was naturally sun-dried corn and was cut into 5–10 cm sections. BS was taken from the fermentation pond of a local farmer, and the raw materials were human and animal manure. The CM was naturally air-dried. The main characteristics of these three mixed manures are shown in Table 2.
Table 2.
Characteristics of straw, biogas slurry, and cow manure.
2.3. Experimental Setup
Three schemes were designed for the experiment: Filter mud (FM), FM + ST + BS (FSB), and FM + ST + CM (FSC). The quantities of FM, ST, CM, and BS utilized in the experiment were 9 kg/m2, 0.35 kg/m2, 1 kg/m2, and 0.75 kg/m2, respectively. To ensure that the carbon source of each soil system was nearly the same, the sum OM contents of the added materials and in the original soil under the different amelioration schemes were controlled. The total added OM contents in the FM, FSB, and FSC schemes were 4.7 kg/m2, 4.9 kg/m2, and 5.3 kg/m2, which were implemented in plots I, II, and III (Table 1), respectively. The sum OM contents in each plot, as determined by the added biomass and the native soil, ranged from 12.4 to 12.9 kg/m2.
Each plot was divided into an experimental plot and a control plot. The area of each plot was about 60 m2. In January 2014, ditches with a depth of approximately 20 cm were excavated at approximately 2 m intervals in the three experimental plots, and the improvement materials were placed in the ditches. First, FM was added, then farm manure was placed inside, and soil was then filled back into place. The three control plots were not treated. In late March 2014, the soil was tilled and blended.
2.4. Observations of Soil CO2
The soil CO2 concentration was measured using an AP-20 vacuum pump and a CO2 test tube produced by Guangming Physical and Chemical Corporation of Japan. Steps to test soil CO2 concentration were as follows [31]: 1. a Drill a hole in certain soil deep (10 cm, 20 cm, 30 cm, and 40 cm) by a soil auger with a diameter of 2 cm; 2. after connecting the pump, CO2 test tube, and a rubber ventilation pipe in order, extend another end of the pipe into the hole quickly and gently bulldoze to block the hole; 3. pull out the handle of the pump twice to extract gas (150 mL), and then CO2 is tested in the tube. Repeat the CO2 test three times and take the average as the final test result. In the first year of the experiment, the soil CO2 was measured in April, August, and December at four-month intervals. In the second year of the experiment, the soil CO2 was measured in the dry season (December) and rainy season (August). Each measurement was conducted at a fixed time period, which was from 9:00 to 11:00 a.m. Over the 2-year monitoring period, a total of 120 CO2 concentration results were obtained from the 6 plots.
2.5. Observations of Soil Respiration Rates
Soil respiration rates were measured by a standard method using an alkali absorption technique. A sealed chamber (diameter 26 cm, height 40 cm) made of an upside-down stainless steel bucket was placed on a flat and undisturbed land surface. The edge of the bucket was pressed 2 cm into the soil and covered with gentle bulldozing to ensure that no gas exchange occurred inside or outside the chamber. A tripod was placed in the chamber, and a 150 mL beaker was then placed on the tripod. The beaker contained 20 mL of a 1 mol/L NaOH solution to absorb CO2 that was released from the soil. Alkali liquor was removed and titrated at regular intervals and then put into a new alkali liquor.
To minimize the experimental error, the extracted alkali solutions were titrated in the field. During titration, an excessively saturated BaCl2 solution was added to precipitate CO32− in the alkali solution. Then, three drops of phenolphthalein were added. Finally, the titration was carried out with 1 mol/L HCl. The volume of HCl that was consumed was recorded, and the amount of CO2 absorbed by the alkali solution and soil respiration rate were calculated using Formulas (1) and (2):
where F is the amount of CO2 absorbed by the alkali solution, mg; V1 is the volume of the alkali solution, mL; V2 is the volume of HCl consumed by the titration, mL; N is the concentration of the alkali solution, mol/L; 44 is the molar mass of CO2, g/mol.
Here, Q is the rate of soil respiration rate, mg/m2/h; F is the amount of CO2 absorbed by the alkali solution, mg; A is the area of the chamber bottom, m2; and H refers to the duration of time for CO2 to be absorbed by the alkali solution, h.
The soil respiration experiments were conducted in August and November 2015. In August, the experiments began at 00:00, and the alkali liquor was replaced every 24 h to monitor the daily soil respiration flux. In November 2015, the experiments began at 00:00, and the alkali liquor was replaced every 3 h to monitor the diurnal dynamics of soil respiration. Each measurement was repeated three times. Finally, 54 soil respiration rate results (6 in August and 48 in November) were obtained from the six plots.
3. Results
3.1. Soil CO2 Concentration
The average CO2 concentration of the FM-improved soil was 0.52%, and that of the control soil was 0.19% (Figure 1). The former was 2.8 times higher than the latter. The coefficient of variation in the improved soil CO2 concentration reached 112.9%, with a median value of 0.35%, while those in the control soil were 72% and 0.14%, respectively. There was a significant difference in the CO2 concentration between the FM-improved and control soils (p < 0.001). Obviously, the addition of FM changed the overall soil CO2 concentration level.
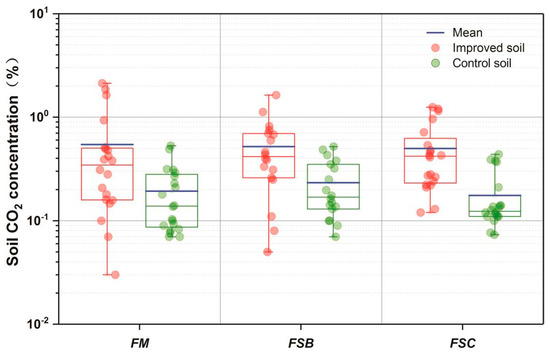
Figure 1.
Effect of external organic matter additions on the dispersion of soil CO2 concentrations. Data observed at all soil depths (10 cm, 20 cm, 30 cm, and 40 cm) from April 2014 to December 2015 were included. The external organic matter additions in the FM, FSB, and FSC schemes were filter mud, filter mud + straw + biogas slurry, and filter mud + straw + cow manure, respectively. The box plot statistics include the upper quartile (Q1), median, mean, lower quartile (Q3), maximum, and minimum.
The average CO2 concentration of the FSB-improved soil was 0.54%, and that of the control soil was 0.23% (Figure 1). The former was 2.3 times higher than the latter. The coefficient of variation in the FSB-improved soil CO2 concentration was 79.3%, with a median value of 0.42%, while those of the control were 60% and 0.17%, respectively. Compared with those in the FM scheme, the coefficient of variation and maximum value were smaller. The median, lower quartile, and upper quartile values were larger, while the mean was nearly the same. These indicate that the increase in soil CO2 was a relatively more stable and continuous process.
The average CO2 concentrations of the FSC-improved and control soils were 0.50% and 0.18%, respectively, and the former was 2.8 times higher than the latter. The multiple was the same as that of the FM-improved soil. The coefficient of variation in the FSB-improved soil CO2 concentration was 72.7%, with a median value of 0.42%, while those of the control were 67.5% and 0.12%, respectively. The mean, lower quantile, and upper quartile values were nearly the same for FSB-improved soil, but the coefficient of variation and range were smaller. These indicate that the increase in soil CO2 was a most stable and continuous process.
In summary, the biomass-amended soils have significantly elevated CO2 concentrations. Interestingly, due to the nearly identical amounts of carbon sources, the three schemes have almost the same mean and median values. However, the dispersion of CO2 concentrations suggests varying stabilities in biomass decomposition, with FM < FSB < FSC.
3.2. Soil Respiration Rate
In August of the second year of the experiment, the daily soil respiration was measured. Results showed that FM-improved soil respiration rate was 302.0 mg/m2/h, which is an increase of 13.1 mg/m2/h over the control soil that has a rate of 288.8 mg/m2 (Table 3). FSB-improved soil shows a soil respiration rate of 274.1 mg/m2/h, which is a decrease of 27.9 mg/m2/h, compared to the control soil’s rate of 302.0 mg/m2/h. FSC-improved soil has a soil respiration rate of 299.5 mg/m2/h, marking an increase of 46.8 mg/m2/h compared to the control soil’s rate of 252.7 mg/m2/h. The gap between FM-improved soil and control soil was the smallest, and only the FSB-improved soil exhibited a decrease in soil respiration rate.
Table 3.
The daily soil respiration rates of the improved and control soils.
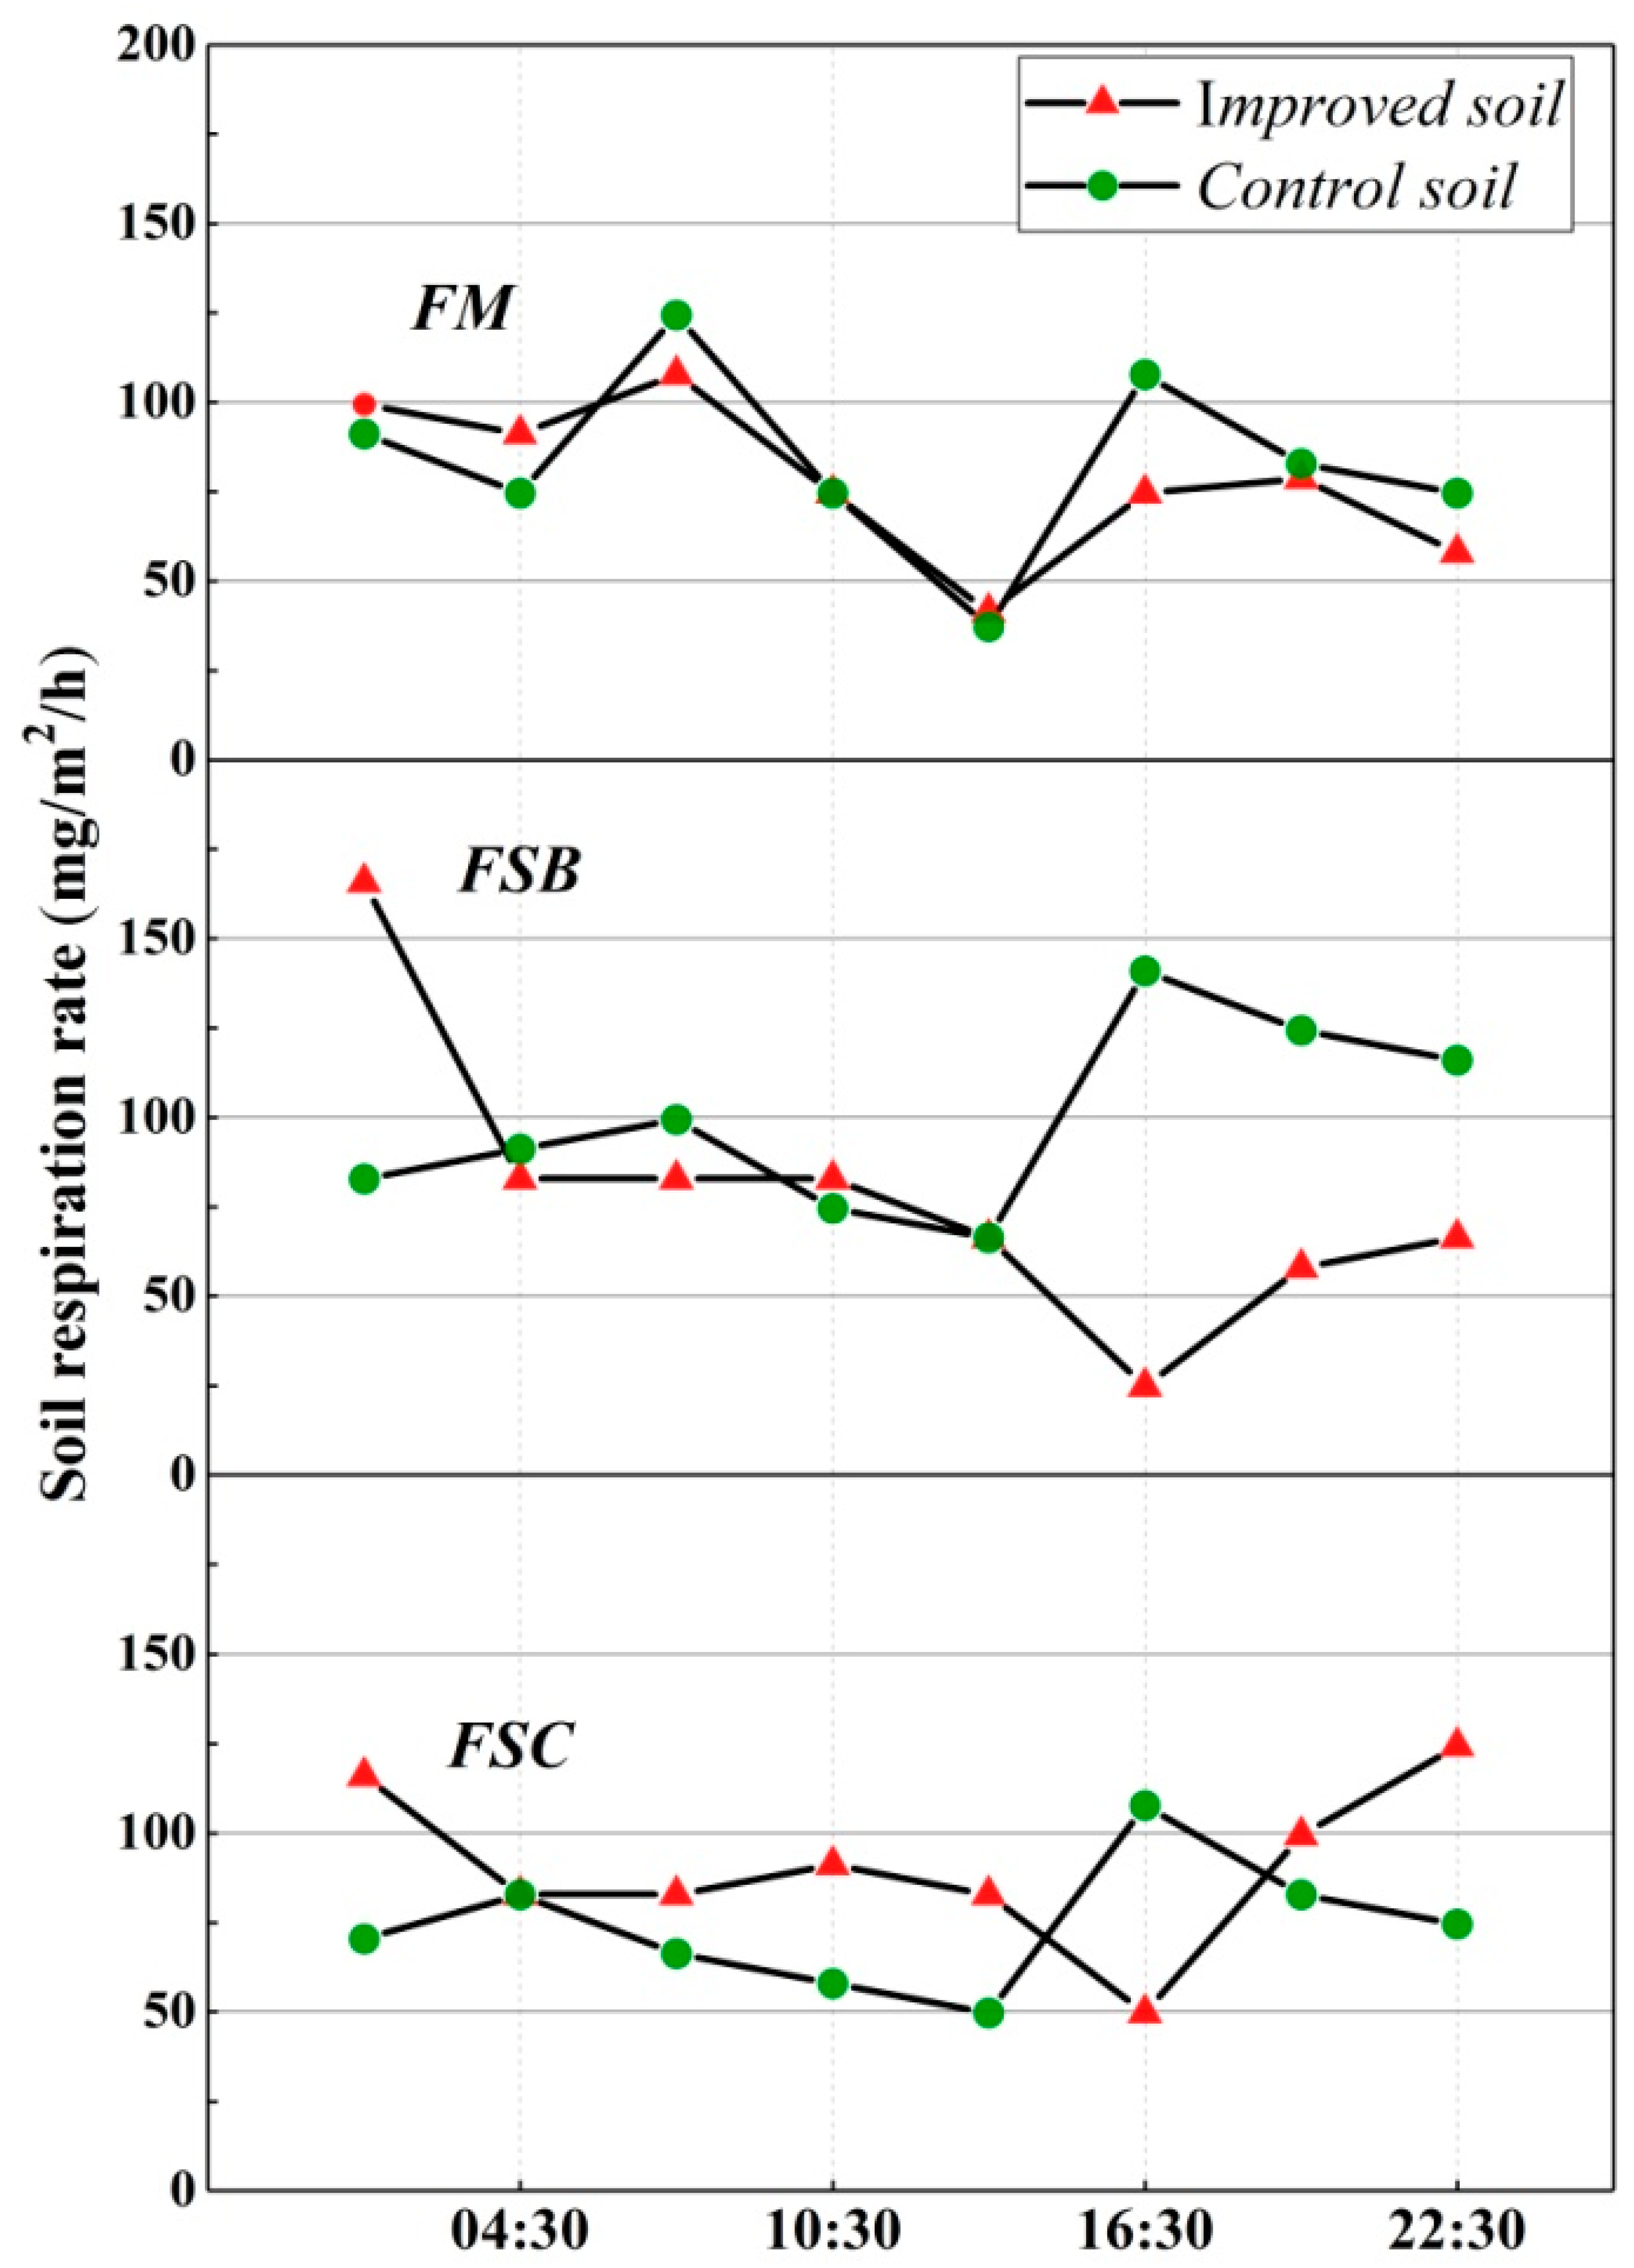
In November of the second year of the experiment, the diurnal dynamics of soil respiration were measured. Results showed that the increasing and decreasing trends in the curves of the control soil respiration rate (Rs-CK) were relatively constant (Figure 2). The values ranged from 37.3 to 141.0 mg/m2/h. The highest values appeared at 7:30 and 16:30. The lowest values of Rs-CK all appeared at 13:30. Substrate and oxygen transport are affected by temperature, and therefore, temperature indirectly affects soil respiration [32]. However, 13:30 was the time when the surface temperature was highest. The diurnal variation curve of the FM-improved soil did not change significantly, which was basically consistent with the change trends in the control soil. The diurnal variation curves of the FSB-and FSC-improved soils showed almost the opposite upward and downward trends compared with the results in the control and lagged behind that in the control soil for three hours. External OM additions increase soil porosity and decrease thermal conductivity, thus prolonging the lag time to a certain extent [33].
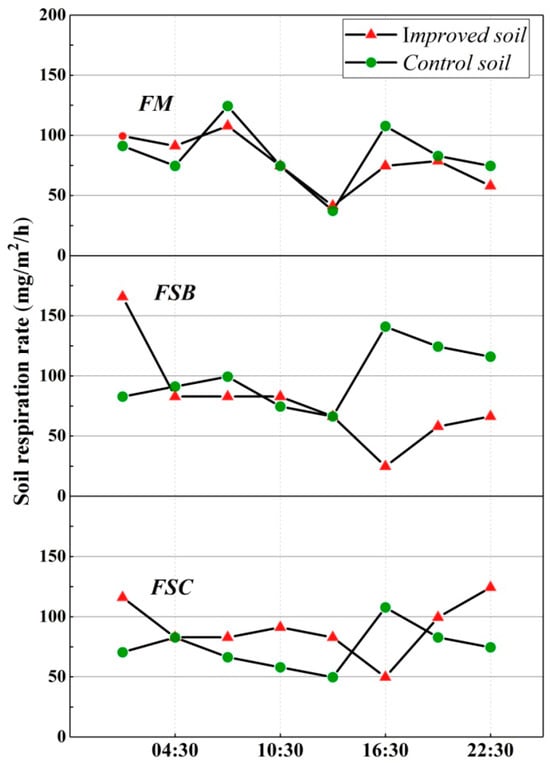
Figure 2.
The diurnal curves of the improved and controlled soil respiration rates. The FM, FSB, and FSC schemes were filter mud, filter mud + straw + biogas slurry, and filter mud + straw + cow manure, respectively.
When the diurnal dynamics of soil respiration rate are averaged to represent the daily soil respiration rate, it is found that FSB-improved soil still has a reduced rate of 20.7 mg/m2/h compared to the control soil. And the FSB-improved soil still exhibits a relatively significant increase in soil respiration rate. The gap between FM-improved soil and the control soil remains the smallest. Overall, the average soil respiration rates for August and November were 286.5 mg/m2/h and 84.2 mg/m2/h, respectively. The rate in August was 3.4 times higher than in November.
4. Discussion
4.1. Decomposition Process of the FM Scheme
As shown in Figure 3 (FM), in April 2014, although OM was most abundant in the soil, the increase in the CO2 concentration did not reach the peak because of water and heat limits. The FM-improved soil CO2 concentrations were 30 cm > 20 cm > 10 cm > 40 cm, which were 5.7 times, 4.3 times, 4.1 times, and 3.8 times the value of the control soil, respectively. Until August 2014, water and heat were abundant, and the increase in the improved soil CO2 concentration peaked: 30 cm (10.8 times) > 10 cm (5.8 times) > 20 cm (5.0 times) > 40 cm (4.9 times). However, four months later, the increase in the soil CO2 concentration at different depths was significantly weakened. The reasons may be that the OM was almost exhausted, or water and heat were insufficient, which are not conducive to microbial activities. Moreover, the soil CO2 concentration increased at different depths: 30 cm (1.6 times) > 10 cm (1.5 times) > 20 cm (75%) > 40 cm (4.7%) were the same.
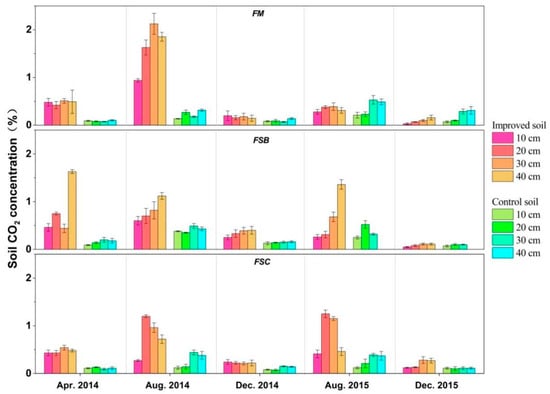
Figure 3.
CO2 concentrations in the improved soil after adding biomass compared with those in the control soils. The FM, FSB, and FSC schemes were filter mud, filter mud + straw + biogas slurry, and filter mud + straw + cow manure, respectively.
In the rainy season of the following year, even if water and heat were sufficient, the improved soil CO2 concentration increased by 65.2% at 20 cm and 33.3% at 10 cm. However, at depths of 30 cm and 40 cm, the concentration decreased by 26.4% and 36.7%, respectively. In the following dry season, the improved soil CO2 concentrations at different depths were significantly lower than those of the control soil. The soil concentrations at depths of 30 cm, 10 cm, 40 cm, and 20 cm decreased by 65.5%, 57.1%, 48.4%, and 30.0%, respectively.
Therefore, increases in the CO2 concentration in the improved soil mainly occurred in the rainy season of the first year, during which time FM decomposed rapidly to produce CO2. Furthermore, as indicated from the above results, the effects on the increase/decrease in the CO2 concentration at depths of 30 cm and 10 cm were more significant, respectively. This result indicated that the location where the improved material migrated was not obvious.
4.2. Decomposition Processes of the FSB Scheme
As shown in Figure 3 (FSB), in April 2014, which was the first dry season of the experiment, the FSB-improved soil CO2 concentration increased rapidly to a peak. It indicated that the OM assemblage of this scheme created good decomposition conditions in a short time. This may be attributed to the water quality and biological activity of BS and the more suitable C/N value [16,19]. On the one hand, the rapid infiltration of BS along with partial FM and ST resulted in a sharp increase in the CO2 concentration at 40 cm, reaching 1.63%, which was 8.3 times higher than that of the control soil (0.09%). On the other hand, most of the FM, ST, and partial nonleached BS decomposed in situ to release CO2, and the soil CO2 concentration at depths of 20 cm, 10 cm, and 30 cm increased by 4.3, 4.1, and 1.2 times, respectively.
In the following rainy season of the experiment, compared with those in the control, the FSB-improved soil CO2 concentrations at 40 cm and 20 cm increased by 1.60 times and 98.6%, respectively. Although the increases at these two depths were much lower than those at the previous stage, the increase was still the most obvious. However, unlike the previous stage, the soil CO2 concentration increase at 10 cm (57.0%) was less than that at 30 cm (68.4%). Thus, BS was leaching further downward, and the partial residual biogas liquid, FM, and ST were still decomposing in situ with abundant rainfall and heat.
By December 2014, compared with those in the control, the increases in the soil CO2 concentrations were 30 cm (1.58 times) > 20 cm (1.44 times) > 40 cm (1.43 times) > 10 cm (92.3%). Thus, the leaching degree of BS weakened due to an insufficient amount of BS, and the residual FM and ST gradually penetrated downward. Moreover, in the absence of BS, FM and ST were composed of microorganisms at an accelerated rate, resulting in an overall increase in the soil CO2 concentration, especially at 20 cm and 30 cm.
In the rainy season of the second year, the soil CO2 concentration increased by 1.1 times at 30 cm, remained almost unchanged at 10 cm, and decreased by 40.4% at the 20 cm depth. In the next dry season, the soil CO2 concentration at 30 cm increased by 10% compared with that in the control and decreased by 28.6% and 20% at 10 cm and 20 cm, respectively.
Overall, with increasing depth, the soil CO2 concentration increased, which indicated that carbon could migrate more deeply in the FSB scheme. Compared with that in the FM scheme, the amount of FM was the same, but because the substances leached into the deep soil, which exceeded the monitoring depth, the multiple of soil CO2 growth decreased from 2.8 to 2.3.
4.3. Decomposition Processes of the FSC Scheme
CM has a high moisture content, poor ventilation, and is protected by relatively more cellulose, lignin, and gum [34,35]. CM was cold manure, so it is often composed of green manure or inoculated with microbes to accelerate the decomposition rate [36]. Organic acids decomposed from ST and FM can promote the decomposition of cellulose and lignin in CM.
As shown in Figure 3, at the initial stage of the experiment, the CO2 concentration at all depths increased significantly. Compared with those in the control, the soil CO2 concentrations increased: 30 cm (4.8 times) > 40 cm (3.3 times) > 10 cm (2.8 times) > 20 cm (2.4 times). However, the multiples were significantly lower than those of the FM-improved soil (3.7–5.8 times). This finding means that the addition of CM slowed the early decomposition speed.
Unlike BS, massive CM do not leach easily, and the decomposition requires good hydrothermal conditions. Therefore, during the first rainy season, the FSC-improved soil CO2 concentration at a depth of 20 cm increased by 7.9 times, while those at other depths increased by 0.9–1.2 times. Additionally, the multiple, 7.9, was larger than that of the FM-improved (5 times) and FSB-improved (1 times) soils. In December 2014, the FSC-improved soil CO2 concentrations at 10 cm, 20 cm, 30 cm, and 40 cm increased by 2.1 times, 2 times, 45%, and 61%, respectively.
However, in the rainy season of the second year, the FSC-improved soil CO2 concentration at 20 cm still increased by 5 times. The values at 10 cm, 30 cm, and 40 cm were 2.4 times, 1.9 times, and 24%, respectively. Compared with those in the improved soils of the other two schemes, the increases at the 10 cm, 20 cm, and 30 cm depths in this period were the most significant. Moreover, from the beginning of the experiment to the present, the increase in the soil CO2 concentration was always greater in the shallow (0~20 cm) soil than that in the deep (30~40 cm) soil. At this time scale, compared with the results in the FSB scheme, the FSC scheme had no significant effect on the deep migration of CO2; in contrast, migration occurred in the surface.
Until the following dry season, the FSC-improved soil CO2 concentration was still higher than that of the control, which was different from the other two schemes. However, now, the increase in the deep soil CO2 concentration was greater than that in the shallow soil, with materials leaching downward. Specifically, the results were as follows: 30 cm (1.54 times) > 40 cm (1.48 times) > 20 cm (30%) > 10 cm (9.1%). The decomposition time of the mixed application of FM, ST, and CM was relatively longer, which had the greatest impact on the next year’s CO2 concentration.
4.4. Estimation of the Annual Carbon Emission Fluxes under the Different Schemes
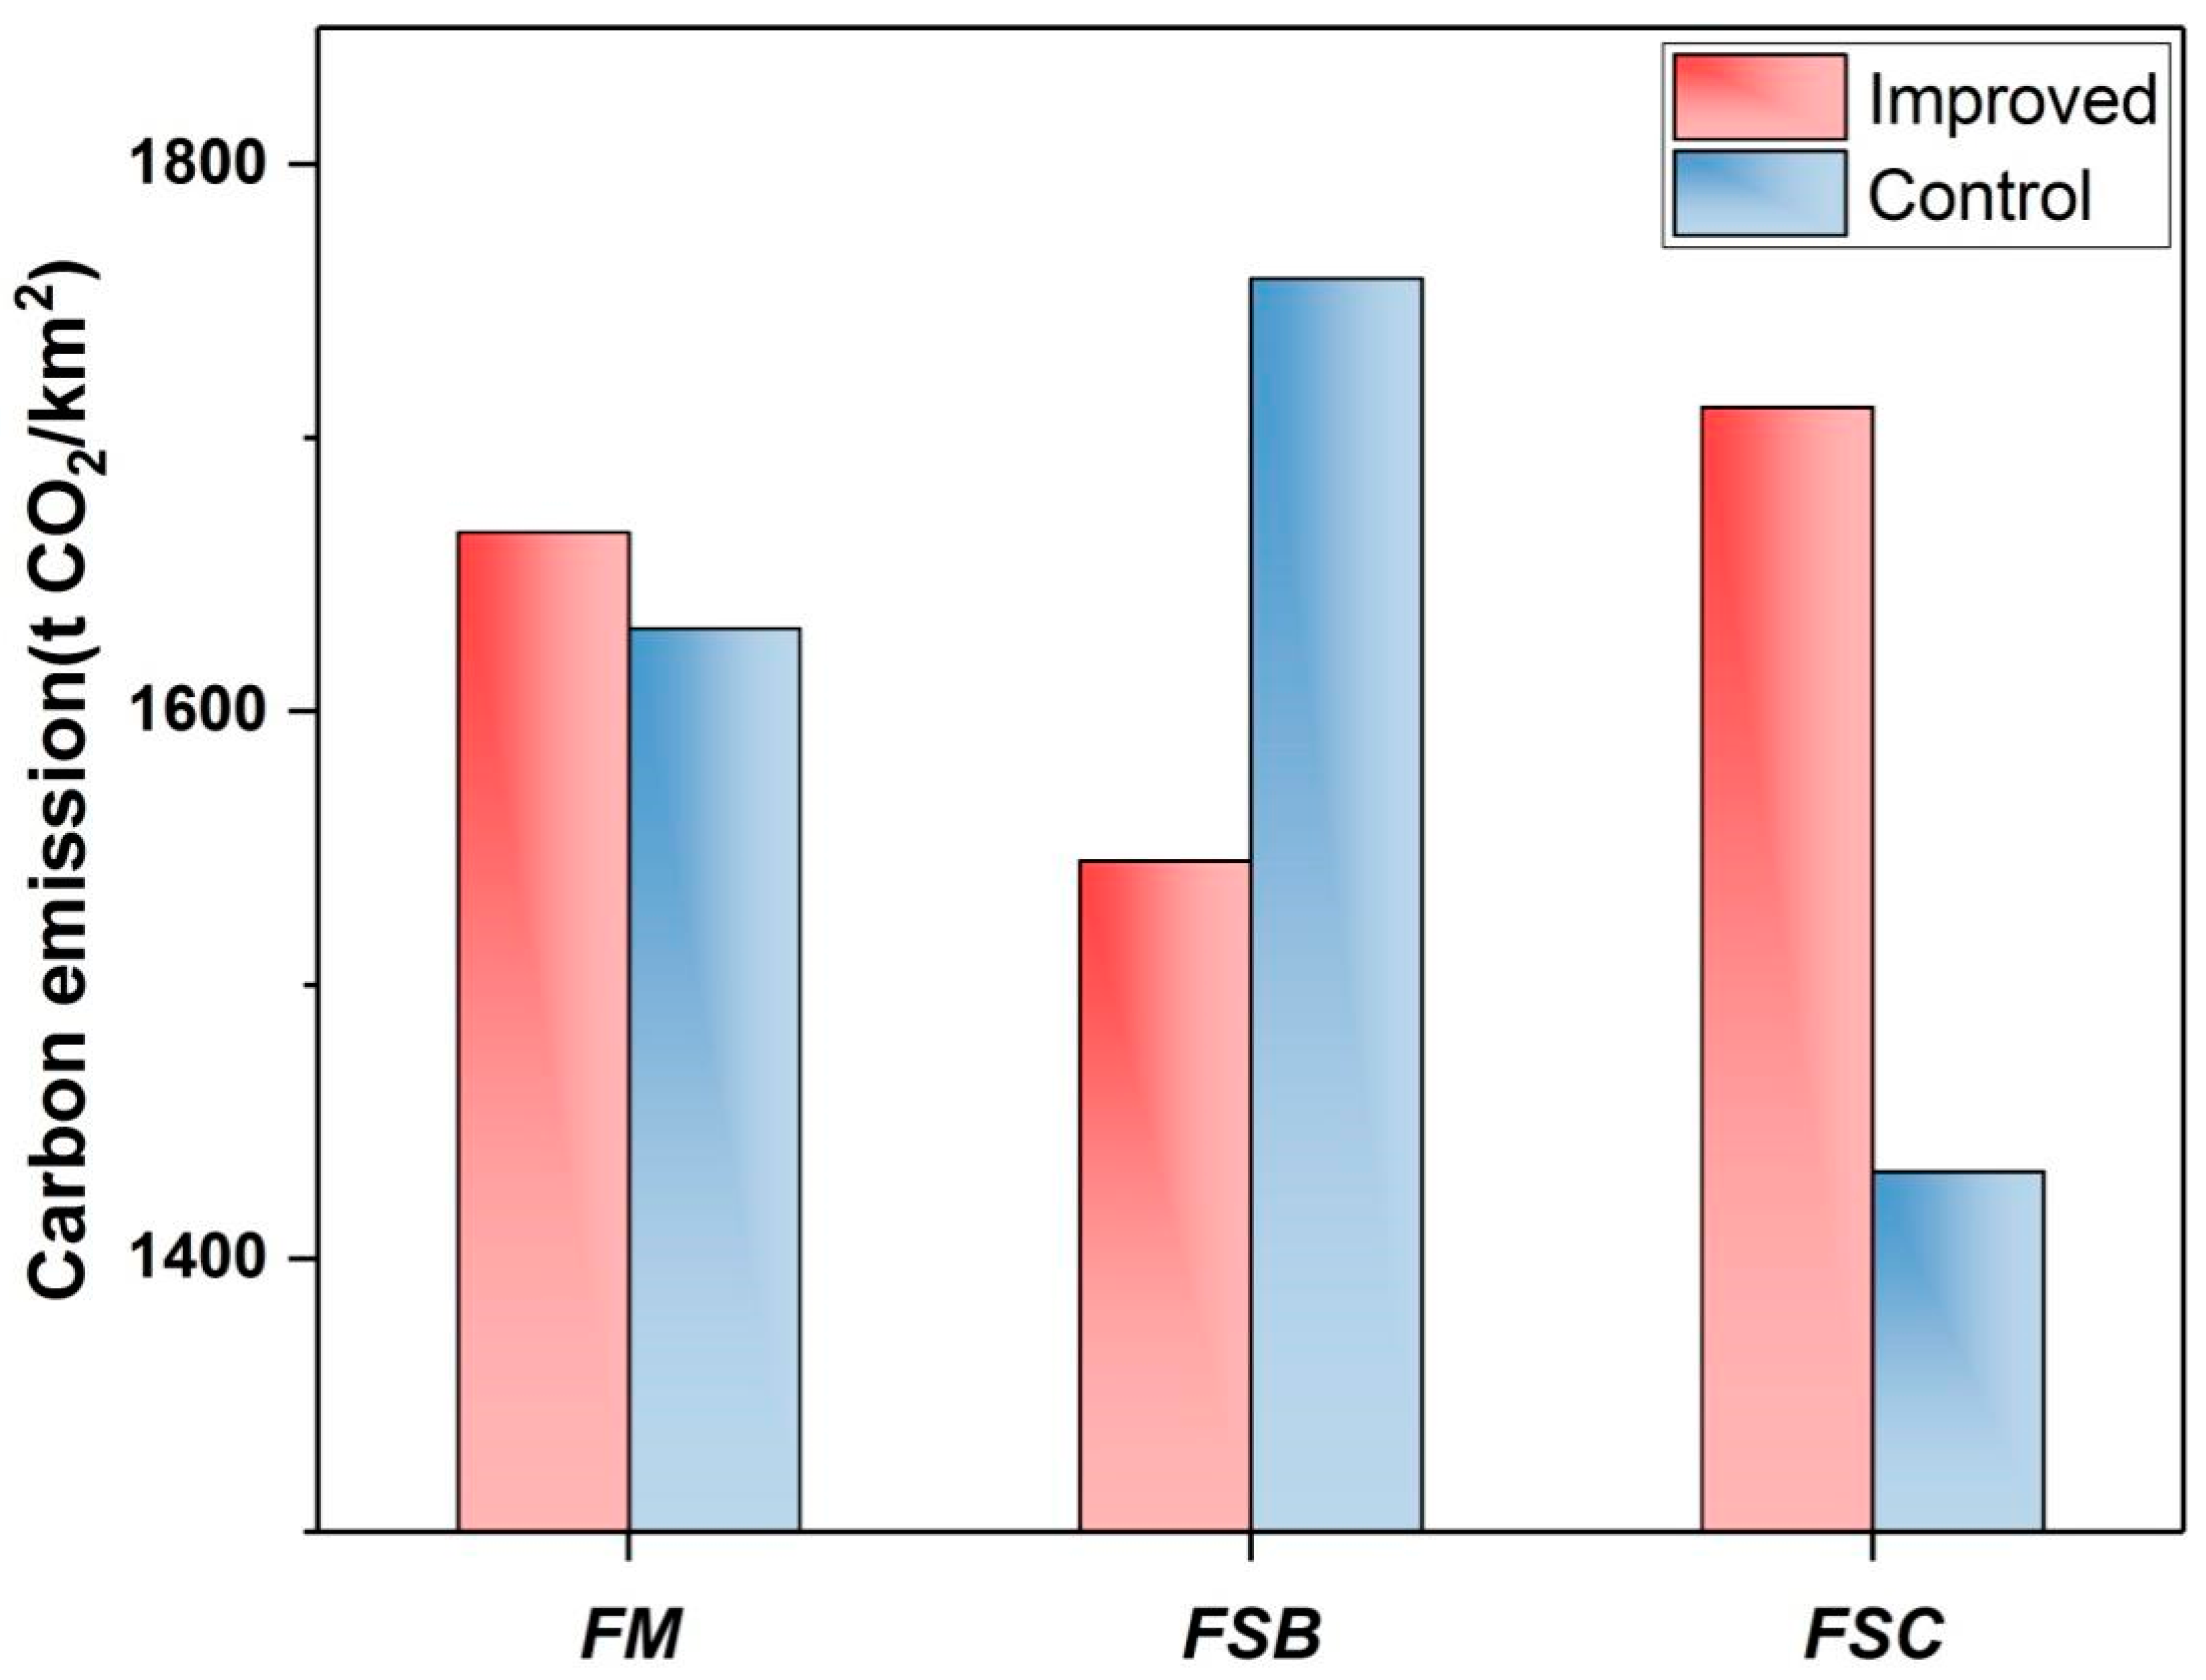
Based on the daily soil respiration rates in August, representing the rainy season, and November, representing the dry season (Tab.1), a rough estimate of the annual carbon emissions was made. As shown in Figure 4, the annual carbon emissions of the FM-improved soil and the control soil were 1665.5 t CO2/(km2·a−1) and 1630.3 t CO2/(km2·a−1), respectively. The difference between them was 35.2 t CO2/(km2·a−1). The diurnal variation in FM-improved soil respiration paralleled that of the control soil, as depicted in Figure 3. Consequently, the difference in carbon emissions from soil respiration was not significant. This also proves that under the FM scheme, the decomposition rate of biomass was fast, and the soil respiration rate was not affected in the second year.

Figure 4.
The annual carbon emissions of soil respiration in the improved and control soils. The FM, FSB, and FSC schemes were filter mud, filter mud + straw + biogas slurry, and filter mud + straw + cow manure, respectively.
The annual carbon emissions of the FSB-improved soil and the control soil were 1545.5 t CO2/(km2·a−1) and 1758.4 t CO2/(km2·a−1), respectively. The difference between them was 212.9 t CO2/(km2·a−1). For non-karst soil, the soil carbon emissions fluxes can be reduced following the amendment of biochar, primarily due to the adsorption capacity of biochar for CO2 [37]. However, as discussed in Section 4.2, under the FSB scheme, the carbon from biomass migrates deeper into the soil (which may be due to the fluidity of the biogas slurry). Relative to the FM scheme, the slower decomposition rate of biomass can gradually dissolve more into the soil water and migrate into the groundwater in the form of inorganic carbon. This reduces the CO2 emission from the soil–atmosphere interface [25]. We need to pay attention to the fact that karst soil, as a unique type of soil, had distinct inorganic carbon sink characteristics and special water flow dynamics, which affected the carbon emission patterns after biomass amendment [38].
However, the FSC-improved soil had much higher carbon emissions than the control, adding 279.5 t CO2/(km2·a−1). As previously discussed, under the FSC scheme, the decomposition of biomass was the slowest, and the difficulty for it to leach downwards was greater compared to the other two schemes. The dynamics of CO2 concentration in the profile also indicated that the carbon from biomass tended to accumulate in the topsoil layer, making it more susceptible to release into the atmosphere.
5. Conclusions
In this paper, field experiments of soil improvement for carbon sequestration and sink enhancement were conducted in a karst area in South China. The main research results are as follows:
(1) The rate, amount, and depth of CO2 production by the decomposition of materials in soil were affected by the combinations. Under the FM scheme, the concentration of soil CO2 had a single peak in the rainy season of the first year. The decomposition process was fast when heat and water were adequate. The soil CO2 concentrations at depths of 30 cm and 10 cm were most affected. When ST and BS were applied together, the materials decomposed quickly in the dry season of the first year, and nutrients leached into the deep soil. The phenomenon of single peak disappeared. The increase in the soil CO2 concentration was relatively stable and persistent: 40 cm > 30 cm > 20 cm > 10 cm. CO2 accumulated in the deep soil. When ST and CM were mixed with filter sludge, the decomposition of the improved materials produced CO2 slowest and most persistently, and the increase in the soil CO2 concentration in the following year was greater than those in the other schemes. The increase in the CO2 concentration in the surface soil was greater than that in the deep soil, and CO2 accumulated in the surface soil.
(2) Soil improvement under the FSB and FSC schemes influenced the diurnal variation in soil respiration. Soil respiration in both schemes lagged behind that in the control soil for three hours. The diurnal variation in soil respiration under the FM scheme was nearly the same as that in the control.
(3) Soil–air carbon emissions increased by 35.2 tCO2/(km2·a−1) with the application of FM alone, while soil–air emissions decreased by 212.9 tCO2/(km2·a−1) with the applications of ST and BS but increased by 279.5 tCO2/(km2·a−1) with the applications of ST and CM. This result may be related to the accumulation of soil CO2 in the deep and surface layers under the two combined application schemes.
Author Contributions
Data curation, Z.H.; Funding acquisition, Z.W.; Methodology, Z.J.; Visualization, Z.H.; Writing—original draft, Z.W.; Writing—review and editing, W.L. All authors have read and agreed to the published version of the manuscript.
Funding
This research was funded by Guangxi Scientific Base and Talents Project (No. GuiKe AD23026022), Guilin Innovation Platform and Talent Project (No.: 20220125-6) and Central Public Welfare Research Institutes, CAGS (No. 2023001, 2023020) And The APC was funded by Central Public Welfare Research Institutes, CAGS (No. 2023001).
Institutional Review Board Statement
Not applicable.
Informed Consent Statement
Not applicable.
Data Availability Statement
The datasets used and/or analyzed during the current study are available from the corresponding author on reasonable request.
Conflicts of Interest
The authors declare no conflicts of interest.
References
- Tokarska, K.; Gillett, N. Cumulative carbon emissions budgets consistent with 1.5 °C global warming. Nat. Clim. Change 2018, 8, 296–299. [Google Scholar] [CrossRef]
- Jones, M.W.; Peters, G.P.; Gasser, T.; Andrew, R.M.; Schwingshackl, C.; Gütschow, J.; Houghton, R.A.; Friedlingstein, P.; Pongratz, J.; Le Quéré, C. National contributions to climate change due to historical emissions of carbon dioxide, methane, and nitrous oxide since 1850. Sci. Data 2023, 10, 155. [Google Scholar] [CrossRef] [PubMed]
- Amelung, W.; Bossio, D.; de Vries, W.; Kögel-Knabner, I.; Lehmann, J.; Amundson, R.; Bol, R.; Collins, C.; Lal, R.; Leifeld, J.J.; et al. Towards a global-scale soil climate mitigation strategy. Nat Commun. 2020, 11, 5427. [Google Scholar] [CrossRef] [PubMed]
- Owoade, F.M.; Abolarin, A.O. Soil Carbon: Pool, Loss, Emission and Climate Change Sources and Knowledge Level of Some Land Use Systems in Sudan Savanna, Kwara State. Int. J. Life Sci. Agric. Res. 2024, 3, 151–162. [Google Scholar] [CrossRef]
- Ugbaje, S.U.; Karunaratne, S.; Bishop, T.; Gregory, L.; Searle, R.; Coelli, K.; Farrell, M. Space-time mapping of soil organic carbon stock and its local drivers: Potential for use in carbon accounting. Geoderma 2024, 441, 116771. [Google Scholar] [CrossRef]
- Nazir, M.J.; Li, G.; Nazir, M.M.; Zulfiqar, F.; Siddique, K.H.; Iqbal, B.; Du, D. Harnessing soil carbon sequestration to address climate change challenges in agriculture. Soil Tillage Res. 2024, 237, 105959. [Google Scholar] [CrossRef]
- Raihan, A. A review of climate change mitigation and agriculture sustainability through soil carbon sequestration. J. Agric. Sustain. Environ. 2023, 2, 23–56. [Google Scholar] [CrossRef]
- Basheer, S.; Wang, X.; Farooque, A.A.; Nawaz, R.A.; Pang, T.; Neokye, E.O. A Review of Greenhouse Gas Emissions from Agricultural Soil. Sustainability 2024, 16, 4789. [Google Scholar] [CrossRef]
- Wang, X.; Zhu, Z.; Huang, N.; Wu, L.; Lu, T.; Hu, Z. Impacts of biochar amendment and straw incorporation on soil heterotrophic respiration and desorption of soil organic carbon. Geosci. Lett. 2023, 10, 11–38. [Google Scholar] [CrossRef]
- Zhang, J.; Yuan, J.; Zhu, Y.; Kuang, E.; Han, J.; Shi, Y.; Chi, F.; Wei, D.; Liu, J. Transformation and Sequestration of Total Organic Carbon in Black Soil under Different Fertilization Regimes with Straw Carbon Inputs. Agriculture 2024, 14, 887. [Google Scholar] [CrossRef]
- Reuland, G.; Sleutel, S.; Li, H.; Dekker, H.; Sigurnjak, I.; Meers, E. Quantifying CO2 Emissions and Carbon Sequestration from Digestate-Amended Soil Using Natural 13C Abundance as a Tracer. Agronomy 2023, 13, 2501. [Google Scholar] [CrossRef]
- Green, S.M.; Dungait, J.A.; Tu, C.; Buss, H.L.; Sanderson, N.; Hawkes, S.J.; Xing, K.; Yue, F.; Hussey, V.L.; Peng, J.; et al. Soil functions and ecosystem services research in the Chinese karst Critical Zone. Chem. Geol. 2019, 527, 119107. [Google Scholar] [CrossRef]
- Khan, M.J.; Khan, M.Q.; Zia, M.S. Sugar industry press mud as alternate organic fertiliser source. Int. J. Environ. Waste Manag. 2012, 9, 41–55. [Google Scholar] [CrossRef]
- Khwairakpam, M.; Bhargava, R. Bioconversion of filter mud using vermicomposting employing two exotic and one local earthworm species. Bioresour. Technol. 2009, 100, 5846–5852. [Google Scholar] [CrossRef]
- Rahmad, L.A.; Kuswinanti, T.; Musa, Y. The Effect of Sugarcane Bagasse and Filter Mud Compost Fertilizer and Manure Application on the Growth and Production of Sugarcane. Int. J. Sci. Res. Sci. Technol. 2020, 6, 338–345. [Google Scholar] [CrossRef]
- Zhao, D.; Liu, Z.; Xu, Y.; Wang, Z.; Li, Z.; Ling, J.; Wu, G.; Wen, Y. Subsoil SOC increased by high C:N ratio straw application with optimized nitrogen supplementation. Soil Use Manag. 2024, 40, e13020. [Google Scholar] [CrossRef]
- Mariaselvam, A.A.; Dandeniya, W.S.; Indraratne, S.P.; Dharmakeerthi, R.S. High C/N materials mixed with cattle manure as organic amendments to improve soil productivity and nutrient availability. Trop. Agric. Res. 2015, 25, 201–213. [Google Scholar] [CrossRef]
- Chathurika, J.A.; Kumaragamage, D.; Indraratne, S.P.; Dandeniya, W.S. Improving soil carbon pool, soil fertility and yield of maize (Zea mays L.) in low-fertile tropical Alfisols by combining fertilizers with slow-decomposing organic amendments. J. Agric. Sci. 2019, 157, 45–54. [Google Scholar] [CrossRef]
- Wang, Z.; Sanusi, I.A.; Wang, J.; Ye, X.; Kana, E.B.; Olaniran, A.O.; Shao, H. Developments and Prospects of Farmland Application of Biogas Slurry in China—A Review. Microorganisms 2023, 11, 2675. [Google Scholar] [CrossRef]
- Zhang, N.; Xiao, Q.; Guo, Y.; Sun, P.; Miao, Y.; Chen, F.; Zhang, C. Characteristics of an Inorganic Carbon Sink Influenced by Agricultural Activities in the Karst Peak Cluster Depression of Southern China (Guancun). Land 2024, 13, 952. [Google Scholar] [CrossRef]
- Tang, Y.; Gao, W.; Cai, K.; Chen, Y.; Li, C.; Lee, X.; Cheng, H.; Zhang, Q.; Cheng, J. Effects of biochar amendment on soil carbon dioxide emission and carbon budget in the karst region of southwest China. Geoderma 2021, 385, 114895. [Google Scholar] [CrossRef]
- Feng, T. Experimental Study on the Effect of Soil Improvement on Karst Carbon Sequestration. Master’s Thesis, Nanning Normal University, Nanning, China, 2015. [Google Scholar]
- Luo, W.Q.; Jiang, Z.C.; Zhao, C.Z.; Yang, F.J.; Deng, Y. Stduy on calcareous soil amelioration with filtered sludge of sugar refinery. J. Agric. Mod. Res. 2009, 30, 248–252. [Google Scholar]
- Luo, W.; Jiang, Z.; Tan, X. Contrast experiment study on the methods of calcareous soil amelioration in karst mountainous area—A case study of Longhe Hamlet, Pingguo County, Guangxi. Earth Environ. 2008, 36, 87–92. [Google Scholar]
- Zeyan, W.U.; Weiqun, L.U.; Zhongcheng, J.I.; Cheng, Z.H.; Zhaoxin, H.U.; Jianhua, C.A. Effects of filter sludge and organic manure on improving soil hydraulic conductivity and net CO2 consumption of carbonate rocks. Carsoclogica Sin. 2019, 38, 60–69. [Google Scholar]
- GB 7173-87; Determination of Total Nitrogen in Soil (Kjeldahl Method). Standards Press of China: Beijing, China, 1987.
- GB 9837-88; Method for Determination of Soil Total Phosphorus. Standards Press of China: Beijing, China, 1988.
- GB 9836-88; Method for Determination of Total Potassium in Soil. Standards Press of China: Beijing, China, 1988.
- NY/T 1121.6-2006; Soil Testing—Part 6: Method for Determination of Soil Organic Matter. China Agriculture Press: Beijing, China, 2006.
- NY/T 296-1995; Soil Total Calcium, Magnesium, Sodium Determination. China Agriculture Press: Beijing, China, 1995.
- Wu, Z.; Zhang, C.; Jiang, Z.; Luo, W.; Xiao, Q.; Hu, Z.; Wu, H. Subsoil carbonate dissolution rates and their determining factors in a karst drainage basin, SW China. Environ. Earth Sci. 2020, 79, 508. [Google Scholar] [CrossRef]
- Liu, Q.; Edwards, N.T.; Post, W.M.; Gu, L.; Ledford, J.; Lenhart, S. Temperature-independent diel variation in soil respiration observed from a temperate deciduous forest. Glob. Change Biol. 2006, 12, 2136–2145. [Google Scholar] [CrossRef]
- Fu, Y.; de Jonge, L.W.; Moldrup, P.; Paradelo, M.; Arthur, E. Improvements in soil physical properties after long-term manure addition depend on soil and crop type. Geoderma 2022, 425, 116062. [Google Scholar] [CrossRef]
- Zhang, Y.; Yao, S.; Hu, J.; Xia, J.; Xie, T.; Zhang, Z.; Li, H. Numerical Modeling of Biomass Gasification Using Cow Dung as Feedstock. Front. Agric. Sci. Eng. 2023, 10, 458–467. [Google Scholar] [CrossRef]
- Ding, Y.; Feng, L.; Zhang, Z.; Zhang, S.; Zhang, X.; Li, Y.; Fang, X.; Hu, X.; Wang, X.; Tam, K.C.; et al. Lignocellulose Nanoparticles Extracted from Cattle Dung as Pickering Emulsifiers for Microencapsulating Phase Change Materials. ACS Sustain. Chem. Eng. 2023, 11, 14255–14266. [Google Scholar] [CrossRef]
- Liu, Z.; Awasthi, M.K.; Zhao, J.; Liu, G.; Syed, A.; Al-Shwaiman, H.A.; Fang, J. Unraveling impacts of inoculating novel microbial agents on nitrogen conversion during cattle manure composting: Core microorganisms and functional genes. Bioresour. Technol. 2023, 390, 129887. [Google Scholar] [CrossRef] [PubMed]
- Ojeda, G.; Gil, J.M.; Mattana, S.; Bachmann, J.; Quenea, K.; Sobral, A.J. Biochar ageing effects on soil respiration, biochar wettability and gaseous CO2 adsorption. Mitig. Adapt. Strateg. Glob. Chang. 2024, 29, 11. [Google Scholar] [CrossRef]
- Yang, H.; Zhou, L.; Huang, L.; Cao, J.; Groves, C. A comparative study of soil carbon transfer between forest soils in subtropical karst and clasolite areas and the karst carbon sink effect in Guilin, Guangxi, China. Environ. Earth Sci. 2015, 74, 921–928. [Google Scholar] [CrossRef]

Disclaimer/Publisher’s Note: The statements, opinions and data contained in all publications are solely those of the individual author(s) and contributor(s) and not of MDPI and/or the editor(s). MDPI and/or the editor(s) disclaim responsibility for any injury to people or property resulting from any ideas, methods, instructions or products referred to in the content. |
© 2024 by the authors. Licensee MDPI, Basel, Switzerland. This article is an open access article distributed under the terms and conditions of the Creative Commons Attribution (CC BY) license (https://creativecommons.org/licenses/by/4.0/).