Article

Performance Evaluation of a Romanian Zeolite: A Sustainable Material for Removing Ammonium Ions from Water

by
Thaaer Hameed Abed
1,
Daniela Simina Stefan
1,*,
Daniela Cristina Berger
1,
Nicolaie Cicerone Marinescu
2 and
Mircea Stefan
3,*
1
Faculty of Chemical Engineering and Biotechnologies, National University of Science and Technology POLITEHNICA Bucharest, 1–7 Polizu Street, 011061 Bucharest, Romania
2
Faculty of Sciences, Physical Education and Informatics, Pitesti University Center, National University of Science and Technology POLITEHNICA Bucharest, 1. Targul din Vale Street, 210002 Pitesti, Romania
3
Pharmacy Faculty, Titu Maiorescu University, No. 22 Dâmbovnicului Street, District 4, 040441 Bucharest, Romania
*
Authors to whom correspondence should be addressed.
Sustainability 2024, 16(18), 7888; https://doi.org/10.3390/su16187888
Submission received: 9 August 2024 / Revised: 4 September 2024 / Accepted: 5 September 2024 / Published: 10 September 2024
(This article belongs to the Section Sustainable Water Management)

Abstract

:
Ammonium ion is a chemical species that is found in abundance in natural waters, whether underground or surface, but also in wastewater resulting from agricultural and industrial activities. Even if the removal of the ammonium ion from water has been studied for a very long time, it has been found that its removal is far from being solved. In this study, we evaluated the performance of the ammonium ion adsorption process on two adsorbents, zeolite clinoptilolite, ZR, a sustainable material (manufacturer: Zeolite Development SRL, Rupea, Brasov, Romania), and the other granular activated carbon type, Norit GAC 830 W. Zeolite ZR is found in very large deposits in Romania; it is a natural, cheap material with costs between 50 and 100 EUR/ton, compared to other adsorbents that cost over 500 EUR/ton and which can be regenerated and reused in the technological process of water treatment and purification, but also after exhaustion, as an amendment for the soil. In the first step, this paper presents the mineralogic (XRD) and structural (SEM and EDX) characterization of the ZR and the determination of the pH zero-point charge, pHZPC, for all the adsorbents. Studies were carried out in equilibrium and kinetic conditions. The efficiency of the adsorbent was investigated in different experimental conditions by varying the initial concentration, particle size, temperature, pH, ionic strength, and contact time. The mathematical models and parameters specific to the adsorption isotherms that best describe the experimental results were identified. Langmuir, Freundlich, Temkin, and Dubinin–Radushkevich mathematical models were used for comparison. The Langmuir isotherm proved to be the most appropriate to describe the adsorption of ammonium ions on all types of adsorbents used. The adsorption capacity of ammonium ions from synthetic solutions at 20 °C, pH = 6.09, for the range of initial concentrations 0–50 mg/L for Rupea zeolite is in the range of 10.46 mg/g−12.34 mg/g, and for granular activated carbon GAC W830, it is 16.64 mg/g. It was found that the adsorption capacity of the ammonium ion on both activated carbon and zeolite increases with increasing temperature and pH. Also, it was observed that as the ionic strength increases, the adsorption capacity decreases for all four adsorbents. Kinetic models were also identified that best describe the experimental processes. In this sense, pseudo-first order, pseudo-second order, intra-particle diffusion and the Elovich model were used. The results of the investigation showed that second-order kinetics governs the adsorption process on ZR, and pseudo-first order governs activated carbon.

1. Introduction

The removal of ammonium ions from water was, and still is, an area of current research. The removal of ammonium ions at increasingly high concentrations in natural waters, and from industrial and agricultural wastewater, is a challenge using simple and cheap methods for high efficiency [1,2].
Lately, the growth of the global population has determined a sharp development of anthropogenic, agricultural, and industrial activities that have a special impact on the environment, especially regarding the increase in the concentration of the ammonium ion [2,3].
The intensive exploitation of agricultural areas and the administration of large quantities of fertilizers have altered the underground water resources where, in some cases, the ammonium ion has reached concentrations of around 10 mg/L. In industrial wastewater and agricultural wastewater, ammonium ion concentrations can reach over 50 mg/L [3,4].
In the literature studies, numerous methods of ammonium ion removal are presented, which are effective. Of these, special attention is given to biological degradation processes for domestic wastewater [5], adsorption and biosorption on various materials [6,7], ion exchange [8,9], oxidation with ozone [10,11], chlorine compounds [12] with ultrasound [13], stripping [3], membrane processes [14], photocatalytic nitrification–denitrification process [15], etc. Although these processes are effective in choosing the optimal method of water treatment and purification, the following aspects must be taken into account: the efficiency of the process, the cost of materials, the costs of operation, exploitation, and maintenance, the amount and fate of the materials resulting from the processes after exhaustion (waste), their toxicity, and their capacity for regeneration and valorization [16,17].
In order to choose a sustainable method of water treatment and purification, materials must be chosen that have low costs, that are found in natural deposits with low exploitation and preparation costs, that after exhaustion are not toxic and can be exploited or regenerated, with long life cycles, in accordance with the principles of sustainable development and circular economy policies [18,19]. A viable solution is the retention of the ammonium ion on clinoptilolite-type zeolite. There are numerous studies that have developed this subject where numerous zeolites from all over the world are used, each with its own specificity [20,21].
There are numerous natural deposits of zeolites worldwide (China, South Korea, Japan, Jordan, Turkey, Brazil, Romania, etc.) that deserve to be exploited and used, taking into account their efficiency and cost, but also their capacity for adsorption and ion exchange, their long life span with the capacity for regeneration and long-term use, but also for valorization after total exhaustion, as an amendment in agriculture [3,22].
The general purpose of this study is to identify viable solutions for removing the ammonium ion from water up to the limits imposed by the legislation in force, depending on the final utility of the water (water discharged into a natural receiver or drinking water).
Maximum admissible limit is 0.5 mg/L for drinking water—according to the European Directive 2020/2184 and the World Health Organization (WHO), and of 7–10 mg/L total nitrogen, depending on the number of equivalent inhabitants, according to the Directive 91/271/EEC for wastewater. It will soon be replaced by the Proposal for a Directive of the European Parliament and of the Council concerning urban wastewater treatment (recast) of the Council of the European Union, which will impose a minimum 80% reduction of the total nitrogen concentration values at the exit from the treatment plant [23,24,25].
In this article, we evaluated the performance of the ammonium ion adsorption process on two adsorbents, zeolite clinoptilolite, ZR (manufacturer: Zeolite Development SRL, Rupea, Brasov, Romania), and the other granular activated carbon type Norit GAC 830 W. In the first step, the study presents the mineralogical (XRD) and structural (SEM and EDX) characterization of the ZR, as well as the determination of the pH zero-point charge, pHZPC, for all the adsorbents. Studies were carried out in equilibrium and kinetic conditions. The influence of the zeolite particle sizes, the initial concentration of the ammonium ion, the temperature, pH, and the ionic strength on the adsorption capacity were identified. The experimental results were compared with mathematical models of Langmuir, Freundlich, Temkin, and Dubinin–Radushkevich isotherms, and the mathematical model that best describes the process was identified. In order to identify the mathematical model that best describes the adsorption kinetics, we compared the experimental results with the kinetic models of pseudo-first order, pseudo-second order, Elovich, and intra-particle diffusion.

2. Materials and Methods

2.1. Characterization of Adsorbents

2.1.1. Adsorbents Preparation

The article presents a comparative study of the equilibrium and kinetics of the adsorption process of ammonium cations from synthetic waters on natural zeolites of the clinoptilolite type, ZR, and on granular activated carbon, GAC 830 W, in statical conditions. The zeolite and activated carbon samples used in these experiments were washed with distilled water until all dust was removed, and the washing water remained clear. The adsorbents were dried in an oven at 105 °C until constant weight, cooled, and stored in a desiccator. From them, the necessary samples for the experiments were weighed. In the first step, the study presents the mineralogical (XRD) and structural (SEM and EDX) characterization of the ZR, as well as the determination of the pH zero-point charge, pHZPC, for all the adsorbents.

2.1.2. XRD Characterization

The crystallographic structure was determined by X-ray diffraction (XRD) using PANalytical Empyrean (Almelo, The Netherlands) equipment provided with a characteristic Cu X-ray tube (λ Cu Kα1 = 1.541874 Å). The sample was scanned in the 2θ angle range of 10–80°, with a scan increment of 0.02° and a time of 100 s/step. Phase identification and Rietveld quantitative phase analysis were performed using X′Pert High Score Plus 3.0 software (PANalytical, Almelo, The Netherlands).

2.1.3. SEM and EDX Analysis for ZR

The internal structural aspect of zeolite ZR was analyzed using the HRSEM high-resolution scanning electron microscopy images (secondary electron images—SEI) technique. Scanning electron microscope QUANTA INSPECT F50, equipped with a field emission electron gun—FEG (field emission gun) with a resolution of 1.2 nm, and an energy dispersive X-ray spectrometer (EDX) with a resolution of MnK of 133 eV-+9, was used, manufactured by FEI, Eindhoven, The Netherlands.

2.1.4. Zero-Point Charge for Adsorbents

In this study, we determined pHZPC for ZR with sizes between 0.5 < d < 1.25 mm and d > 3 mm, and for GAC. In this sense, there were 0.5 g of each adsorbent sample in contact with 50 mL of 0.01 M NaCl solution for 48 h. The initial pH of the solutions between 2 and 12 was corrected with 0.1 M HCl and 0.1 M NaOH solutions. The initial and final pH were measured with a Jenway 370 pH-meter. It was graphically represented as ∆pH (pHinitial–pHfinal) as a function of the pHinitial, and the point of intersection with the Ox axis represents the pHzPC.

2.2. Adsorption Experiments

2.2.1. Experiments Development

In the studies carried out both for equilibrium and for kinetics, ZR with sizes in ranges 0.5 mm < d < 1.25 mm, 1.25 < d < 3 mm, and d > 3 mm and GAC with sizes in range 0.6 < d < 3 mm. A solid/liquid ratio of 1/1 was worked on. The samples were shaken using a VELP analog orbital shaker at a frequency of 150 rotations per minute. The influence of initial concentration, particle sizes, pH, temperature, and ionic strength on the adsorption process was studied. It was worked at three temperatures, 10 °C, 20 °C, and 40 °C; at three ionic states, 0, 0.01, and 0.1 M, obtained with KCl solution; and at a pH variation in the range 5.02–9.16. The pH was maintained at the working values using buffer solutions prepared from an equimolecular mixture of phosphoric, acetic, and boric acids to which different doses of sodium hydroxide were added [26].
The concentration of ammonium ions in the synthetic solutions for the sorption equilibrium study varied between 0 and 50 mg/L, and the contact time was 93 h. In the case of reaction kinetics, synthetic solutions were used with an ammonium concentration of 38.6 mg/L, working pH 6.09. The initial and final NH4+/N (ammonium) concentrations from the systems were determined according to SR ISO 7150-1/2001 using a Jenway Aquanova spectrophotometer.
Adsorption capacity (a) at equilibrium or for kinetics studies of adsorbents is calculated using relations:
a = C 0 C × V m , mg / g
where C0 and C represent the initial at equilibrium or, for moment t, the concentration of ammonium solution; mg/L, V—the volume of the solution, L; and m—mass of the adsorbent, g.

2.2.2. Mathematical Models for Characterization the Equilibrium of Adsorption Processes

In order to identify the mathematical models that best describe the adsorption process in static conditions at equilibrium, the experimental results were compared with the adsorption isotherm models Langmuir, Freundlich, Temkin, and Dubinin–Radushkevich. Table 1 shows the linear, L, and non-linear, NL, equations specific for the adsorption isotherm models used.

2.2.3. Mathematical Models for Characterization the Kinetic of Adsorption Processes

The experimental results obtained in the study of the kinetics of the adsorption process were compared with mathematical models. The mathematical model’s pseudo-first order, pseudo-second order, Elovich, and intra-particle diffusion were used. The characteristic equations are presented in Table 2.

3. Results and Discussions

3.1. Characterization of Adsorbents

The zeolite, ZR, used has the total surface area BET analyses 50 m2/g, apparent density 2.38 kg/m3 [32]. Activated carbon type Norit GAC 830 W, has a particle size greater than 2.36 mm with a maximum mass unit of 15%, and particle sizes lower than 0.6 mm with a maximum mass unit of 5%, the total surface area BET analyses is 1100 m2/g and the apparent density is 500 kg/m3 [33]. The functional groups with which activated carbon can participate in reactions are fenoxyl, carboxyl, ketone, anhydride, ather, pyrone, and lactone [34].

3.1.1. Mineralogical Structure of ZR, XRD Characterization

The mineralogical composition of ZR is shown in Figure 1 and the proportion of phases highlighted after the Rietveld processing was centralized in Table 3.
The main crystalline forms present in ZR include Ca clinoptinolite ((Na1.32K1.28Ca1.72Mg0.52) (Al6.77Si29.23O72)(H 2O)26.84), at over 80%; followed by Phlogopite-1M (KMg3Si3AlO10(OH)2), at over 11%; and Albite ((Na0.84Ca0.16 )Al1.16Si2.84 O8) and SiO2, at over 2%.

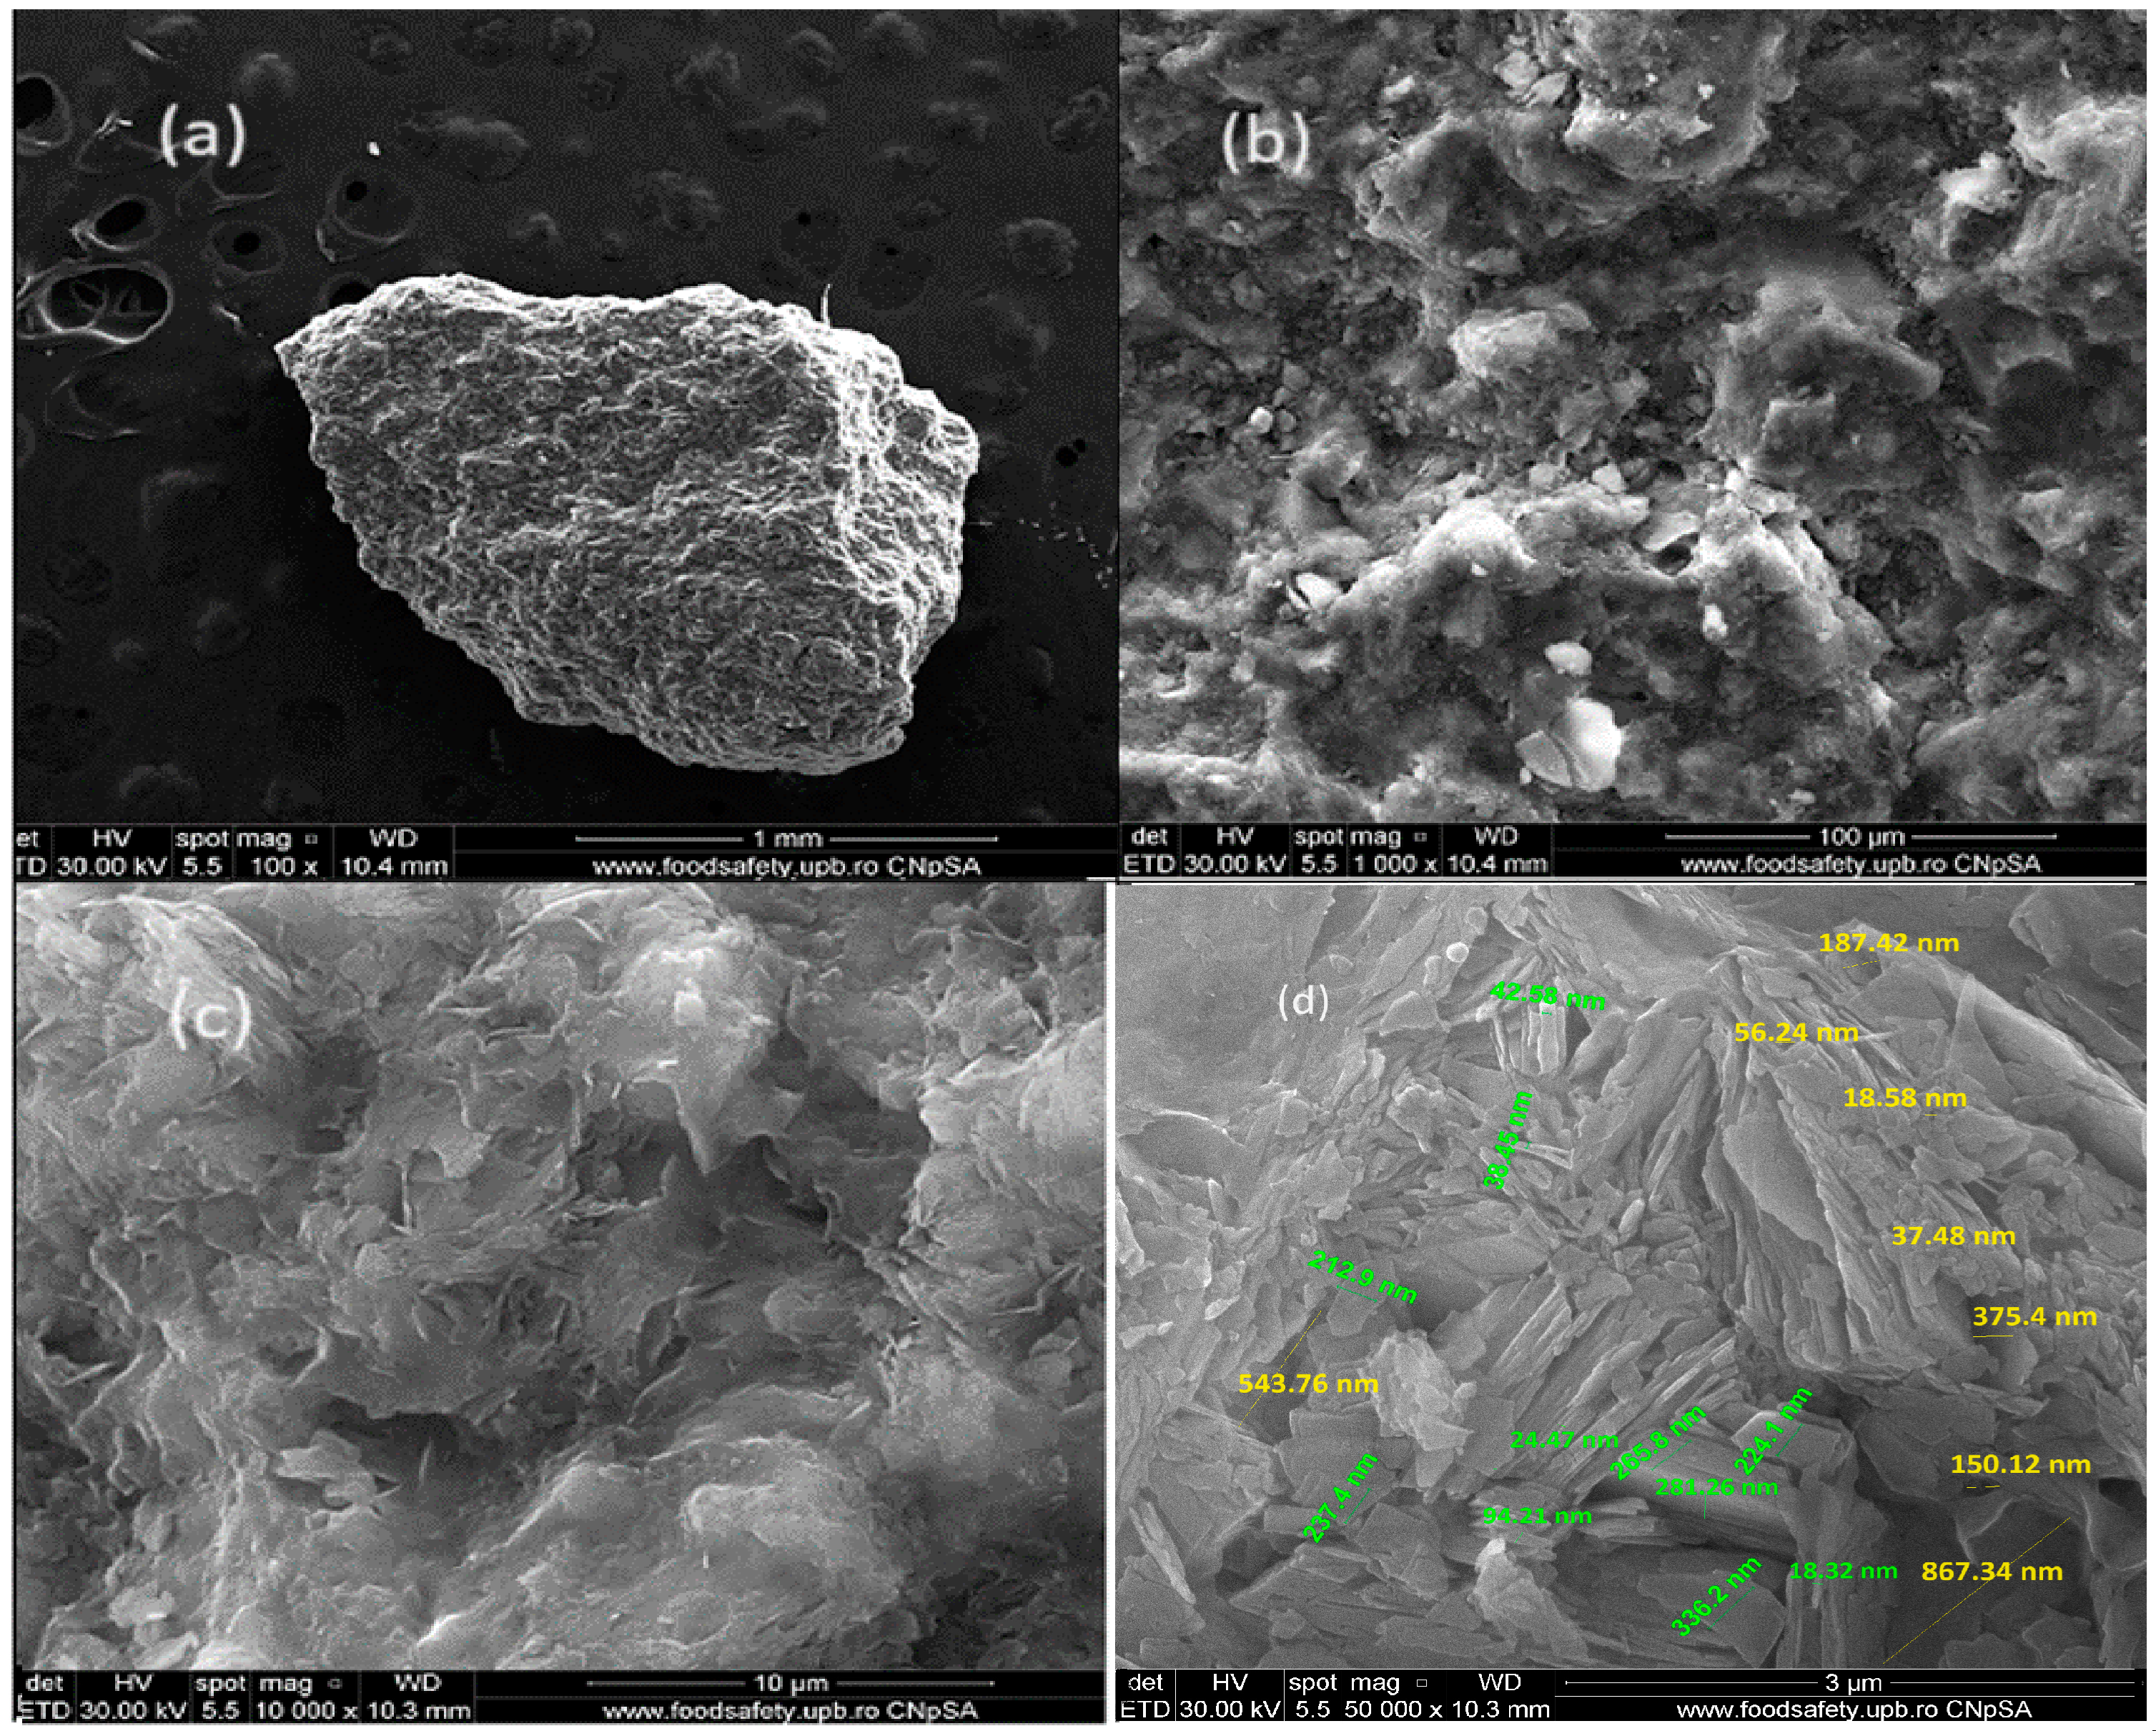
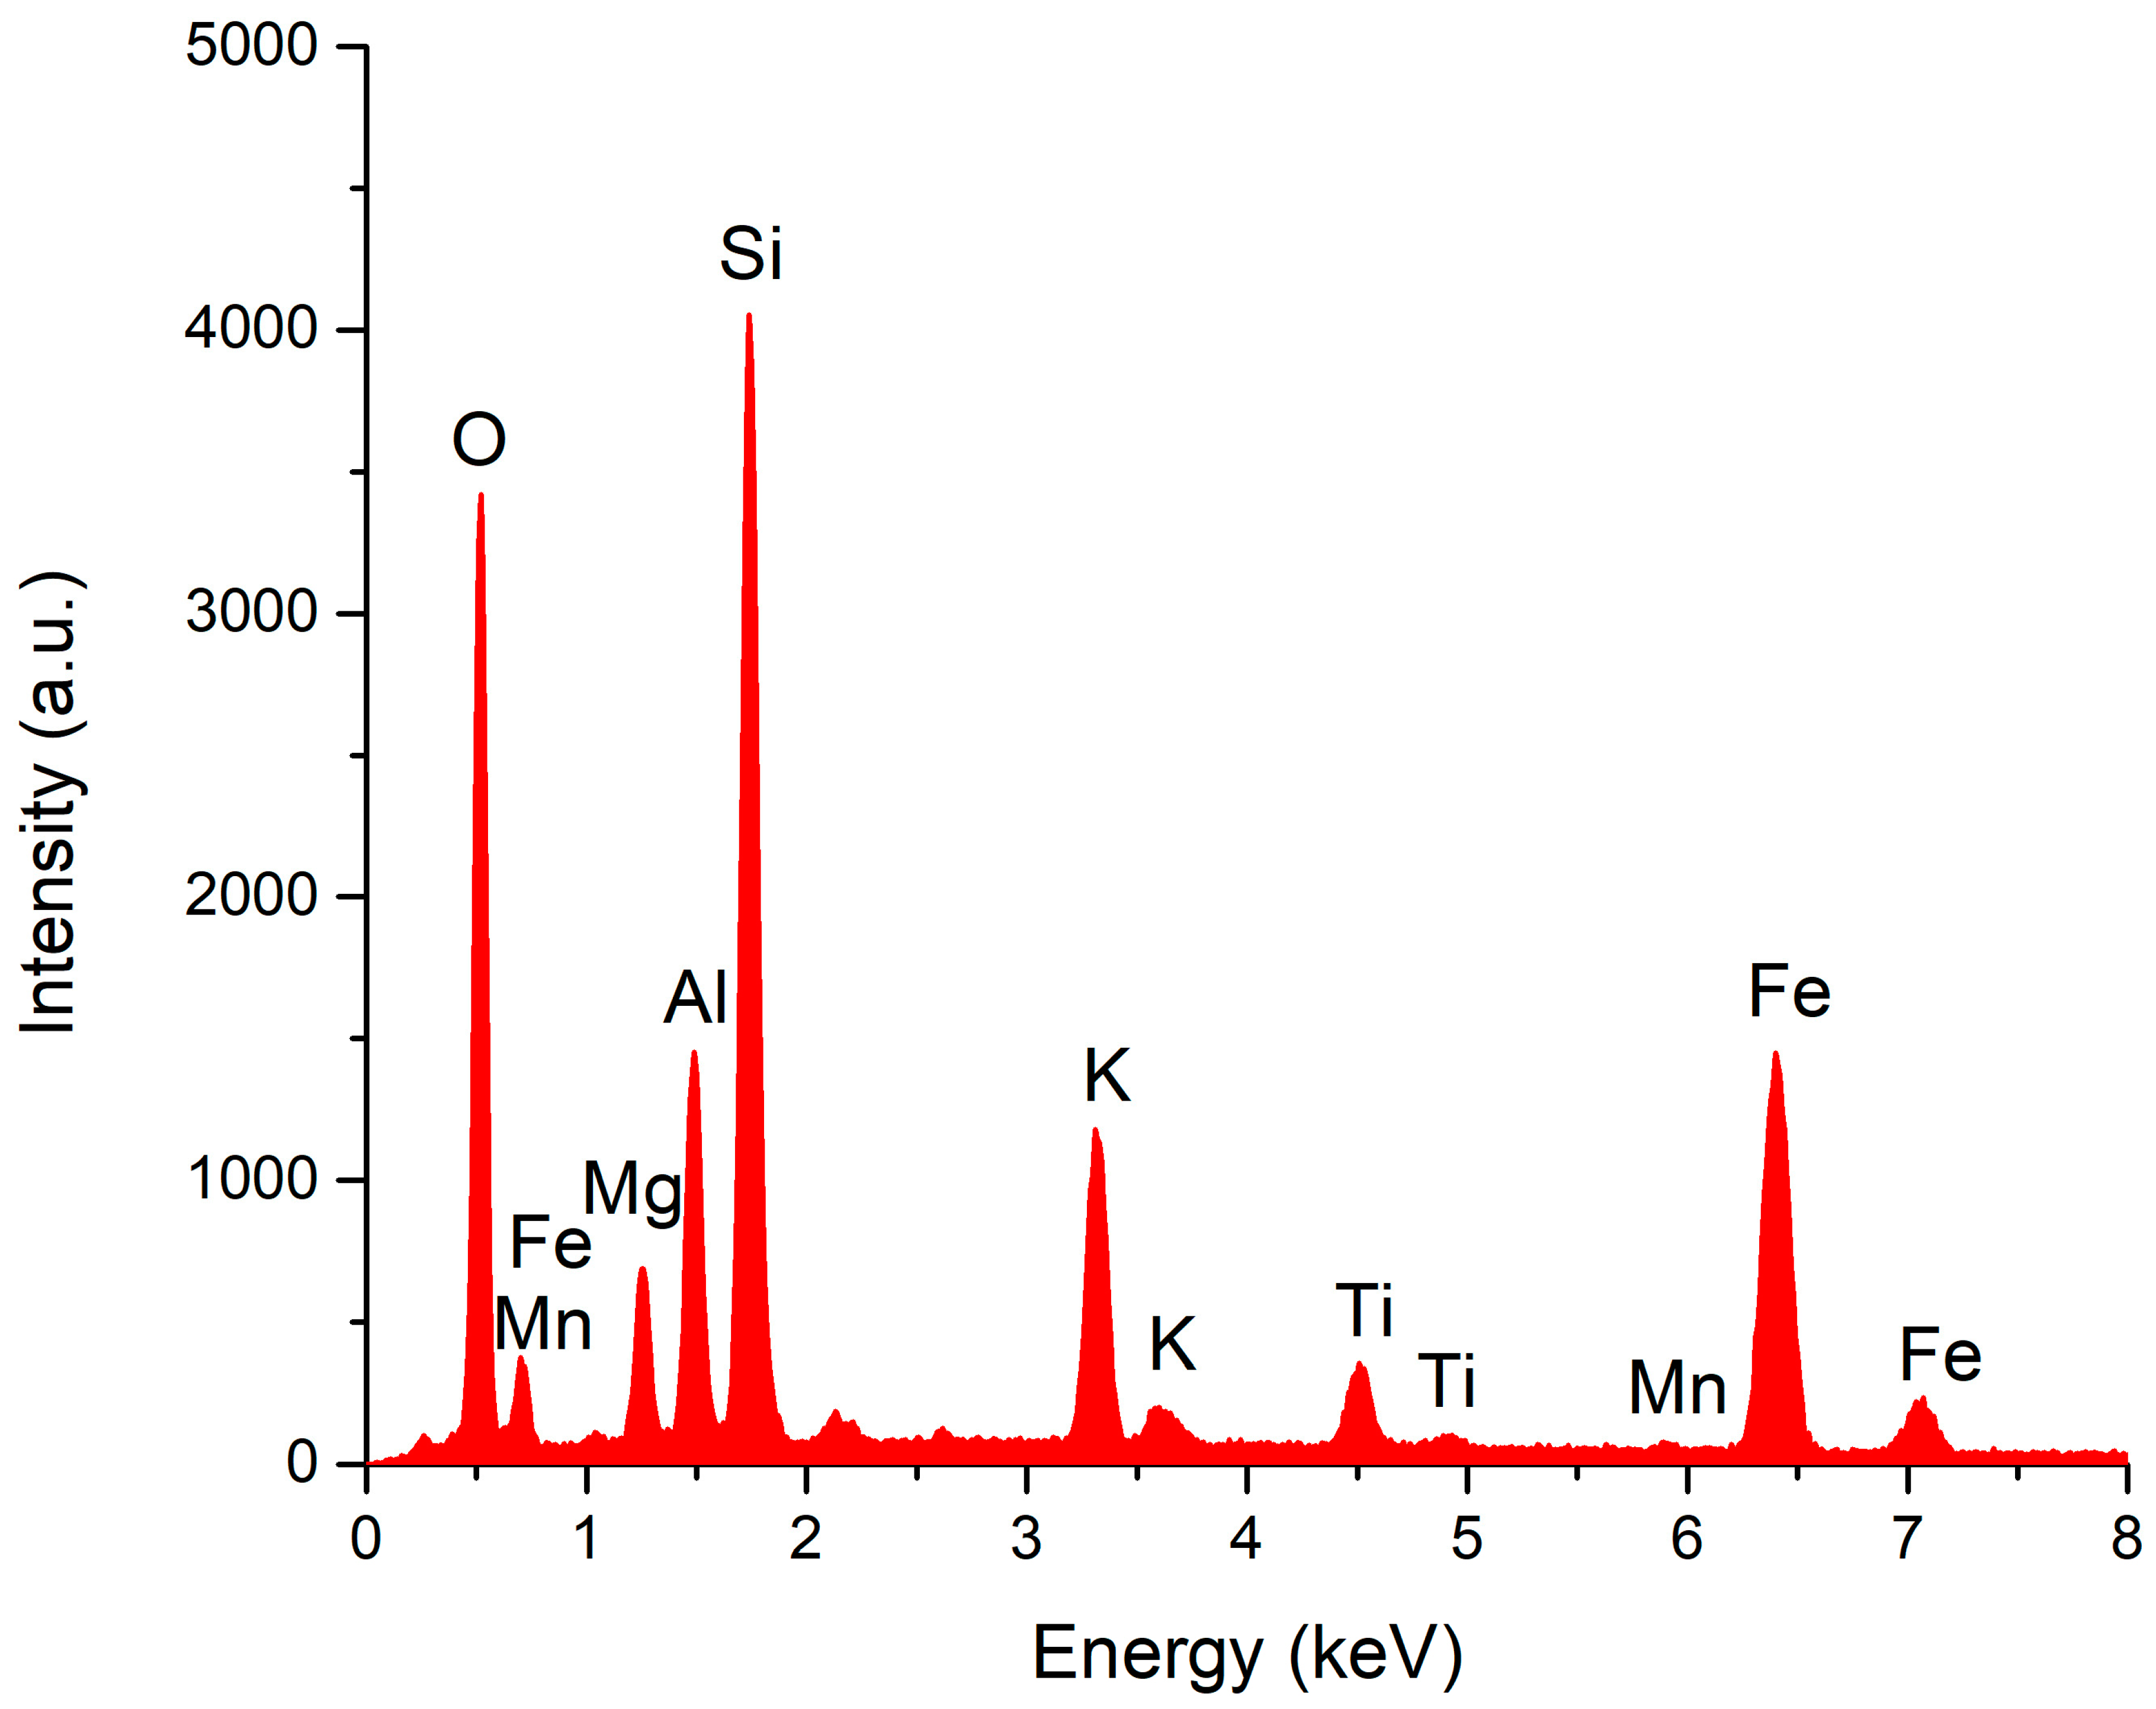
3.1.2. SEM and EDX Analysis for ZR

Figure 2 represents the morphological image of a ZR granule at various magnification levels: (a)—100 times, (b)—1000 times, (c)—10,000 times, and (d)—50,000 times.
From the analysis of Figure 2, we can see that the external and internal aspects of the zeolite particles show a morphological uniformity with a lamellar structure, with platelet degrees of thickness of up to 100 nm (details of the dimensions can be seen in Figure 2d). Zeolite can adsorb chemical species with sizes ranging from nanometers to micrometers; according to Figure 2c,d, the pore sizes varied from 10 nm to a few micrometers. The EDX spectrum from Figure 3 highlighted the presence of the main elements: O, Na, Mg, Al, Si, K, Ca, and Fe. The main component element is oxygen, which confirms that the metals present are in the form of oxides, and the high content of silicon, whose atomic ratio Si/Al is 4.8 times greater than 4, ensures good ZR performance in terms of adsorption and ionic exchange capacity. The ion species that can be substituted include Na, Mg, Al, Si, K, Ca, and Fe (see Table 4).

3.1.3. Zero-Point Charge, pHZPC, for Adsorbents

The zero-charge point, pHZPC, of the ZR varied with particle sizes; if the particle size increases, the zero-charge point value decreases (see Figure 4a–c). Thus, for particle sizes between 0.5 < d < 1.25 mm, pHZPC is 4.34, and for sizes d > 3 mm, pHZPC is 2.97. If the zeolite is in the ZR-Ca form, the pHZPC is 5.43. It can also be seen that the pHZPC for CA is 6.79 (see Figure 4d).
Zero-point charge (pHZPC) represents the pH at which the electric charge of a solid surface is zero when of equal numbers of cations and anions [35]. At a pH less than pHZPC, the surface of the adsorbent has positive charges, while at pH greater than pHZPC, the surface has predominated negative charges [27].
In 2008, Cotton A. highlighted that pHZPC for SiO2 is 2.4, and for Al(IV)2O3 pHZPC is between five and seven, and for Al(VI)2O3 pHZPC it is eight (where IV and VI represent tetrahedrally and octahedrally co-ordinated Al, respectively). This suggests that silica is most likely a source of negative charges at higher pH [35]. In ZR clinoptilolite, the higher ratio between Si/Al influences the values of pHZPC. The low pHZPC values of 2.97 for d > 3 mm and of 4.34 for d > 0.5 mm determine the increase in the pH range for which the adsorbent surface is negative, stimulating the retention processes of positively charged species. The increase in pHZPC values with the decrease in the size of the zeolite particles suggests that the proportion of Si in smaller particles decreases through mechanical processes. Activated carbon is loaded with negative charges from a pHZPC higher than 6.79, which explains the low adsorption capacity of positive ions compared to the very large active surface of 1100 m2/g.

3.2. Adsorption Process

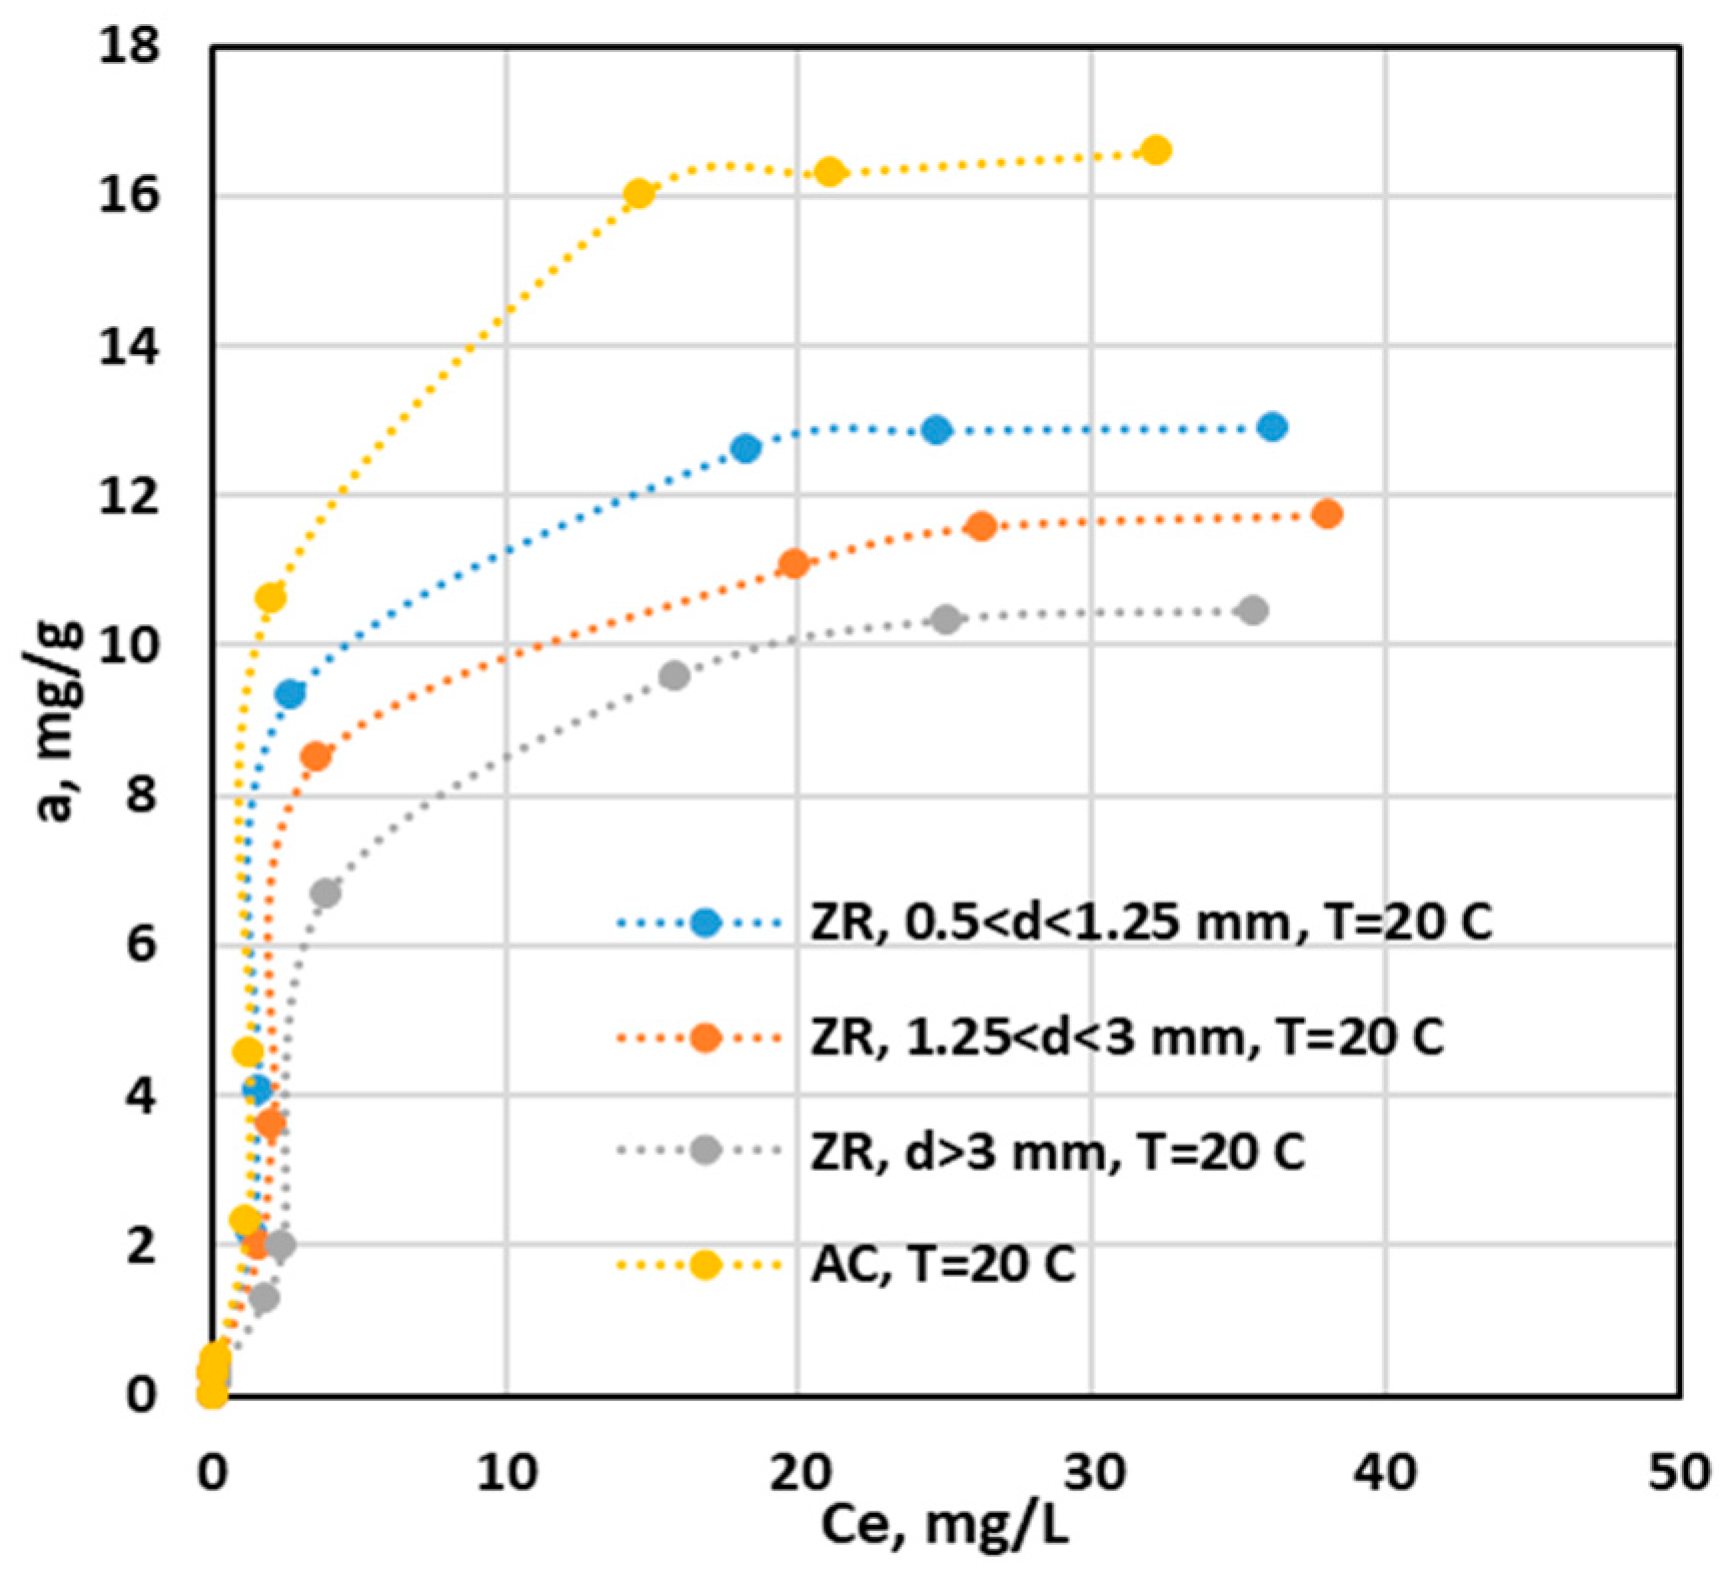
3.2.1. Equilibrium of Adsorption

Isotherm of Adsorption

The experiments were performed in triplicate, and the graphical points represent the average values of the experimental data.
The experiments to obtain the adsorption isotherms for ZR at the three particle sizes and for AC were carried out at a temperature of 20 C, pH = −6.09, at a stirring speed of 150 rotations per minute, and at an initial concentration of the ion ammonium in synthetic solutions ranging from 0 to 50 mg/, with a contact time of 93 h. The experimental results are presented in Figure 5.
It can be seen that GAC has an adsorption capacity for ammonium ions that varies depending on the working conditions between 15 and 19 mg/g at an ionic strength of 0.1 M KCl and at zero ionic strength and 40 C, respectively. Similar results were obtained by Halim and Latif (2013) for organic acid-modified activated carbon, whose adsorption capacity was 19.34 mg/g [36]. Other activated carbons obtained from vegetable waste have adsorption capacities between 1.7 and 39.2 mg/g [2]. Rupea zeolite has an adsorption capacity for ammonium that decreases with increasing grain size, varying from 12.34 mg/g for 0.5 < d < 1.25 mm to 10.46 mg/g for d > 3 mm under the working conditions mentioned in Figure 5. Similar results were obtained for Chinese clinoptilolites (11.2 mg/g) [37] and for natural Iranian zeolites (8.5–10.30 mg/g) [38]. For the zeolitic tuff from Romania, for a granulometry between 0.16 and 0.25 mm, the adsorption capacity was 19 mg/g under similar working conditions [39]. In order to identify the mechanism by which the adsorption process takes place, the experimental data were compared with different mathematical models of Langmuir, Freundlich, Temkin, and Dubinin–Radushkevich adsorption isotherms, which are presented in Table 1, both in non-linear (NL) and linear (L) form, Equations (2)–(11). In Table 5, the values of the specific parameters of the mathematical models were presented. They were obtained through the graphic representation of the linearized forms, the identification of the specific equation, the specific coefficients from which the parameters were determined, and the mean square deviation, R2. The latter highlights the degree of overlap of the mathematical model on the experimental results; the closer its value is to the value of one, the better the equation describes the process [29].
The results presented in Table 5 show that the Langmuir model best describes the ammonium ion adsorption process on all four adsorbent materials, with R2 values over 0.970. This suggests that the adsorption process takes place in a monolayer, there is a small number of active sites on the surface of the adsorbent involved in the process, and the binding forces between ammonium and active sites are weak, Van der Waals type [29].
R L = 1 1 + K L C 0
In order to highlight the affinity of the adsorbent for an adsorbate, RL is calculated, a dimensionless constant referred to as the separation factor or equilibrium parameter. Relation (2) makes possible the calculation of RL, where KL (L·mol−1) is the Langmuir constant and C0 (mol·L−1) the highest initial ion concentration [3,40].
If the values of the RL coefficient are lower than 1, then it means that the adsorption process is favored. In Table 6, the values of RL calculated for all the adsorbents used are presented:
From Table 6, it can be seen that the values of RL are sub-unit, which proves a high affinity of the studied adsorbents for ammonium ions [27].

Influence of Temperature
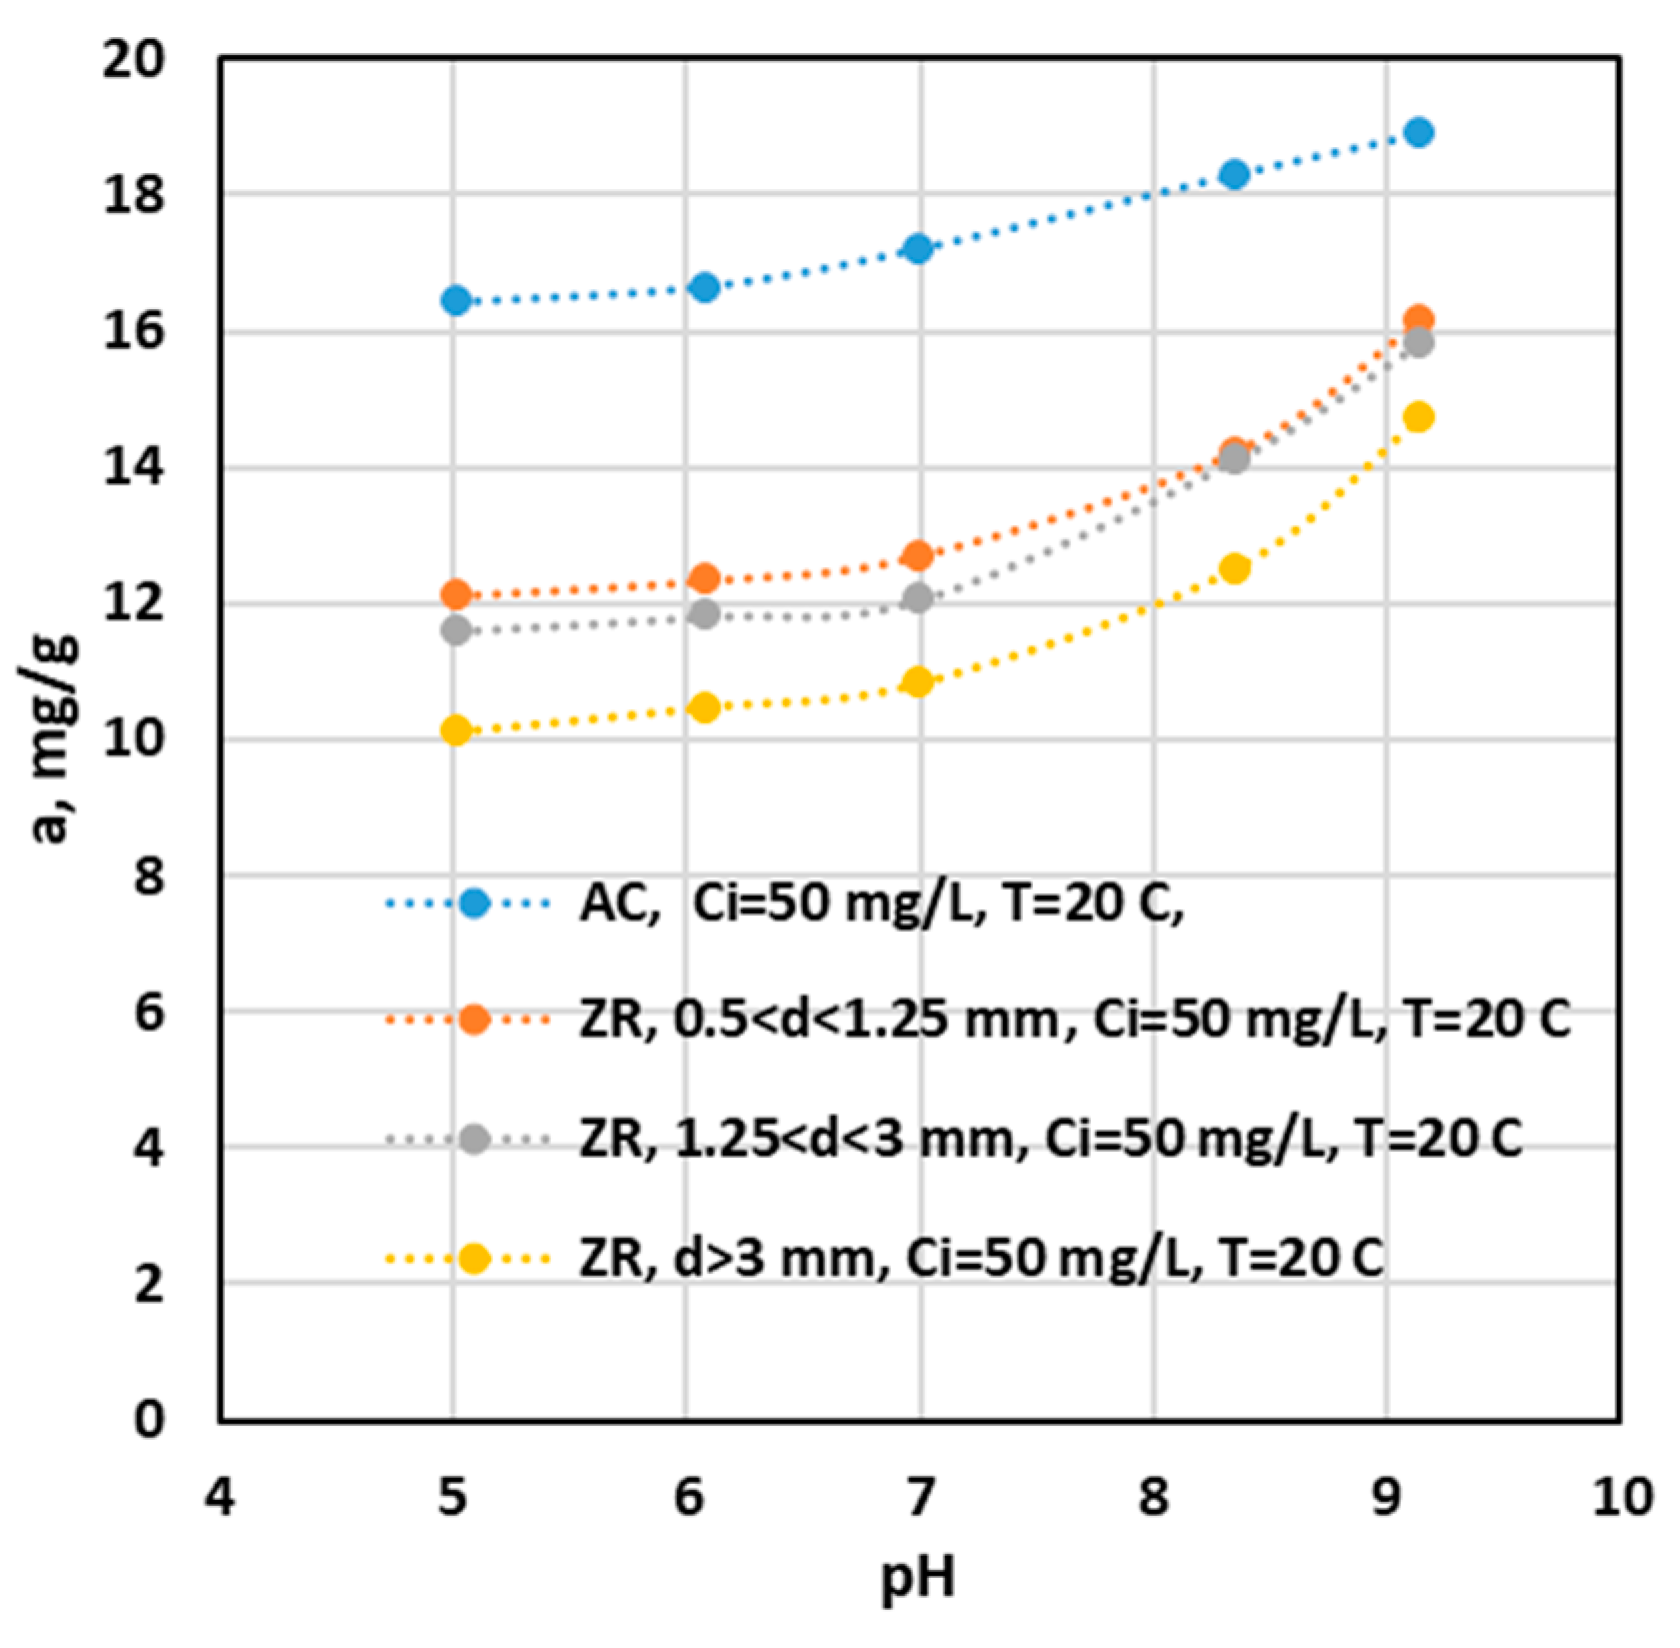
The temperature influences the adsorption process. It can be observed that the adsorption capacity of the ammonium ion on both activated carbon and zeolite increases with increasing temperature. Thus, between 10 and 40 degrees, the adsorption capacity for the ammonium ion increases by 4.25 mg/g, 5.09 mg/g, 4.31 mg/g, and 3.36 mg/g for GAC and zeolite, in the increasing order of sizes, respectively (see Figure 6).

Influence of pH

The adsorption capacity of the ammonium ion increased with increasing pH for all adsorbent samples (see Figure 7). The increase in the adsorption capacity for GAC is reduced until the pH value is equal to the pHZPC, after which this increase is constant with the increase in pH. This increase is slow in the range 5.02–7.0, with a capacity of 0.2 mg/g for each pH unit, after which the increase in capacity is uniform and equals to 1.2 mg/g for each pH unit. ZR also has a slow increase in adsorption capacity of only 0.28 mg/g per pH unit, for the range 5.02–7.0, after which there is an increase in the adsorption capacity for ammonium ions of 1.6 mg/g per pH unit. The increase in the adsorption capacity of the ammonium ion in the basic pH range is mainly due to increasing the negative charges on the adsorbent surface resulting from the deprotonation process [35]. The mechanism starts with electrostatic attraction between positively charged ammonium ions and negatively charged active sites followed, by the formation of an adsorbed monolayer [41]. In addition to this fact, the hydroxyl ions react with the ammonium ion, forming ammonia, a slightly volatile compound that can be removed from the system by desorption through agitation [3].

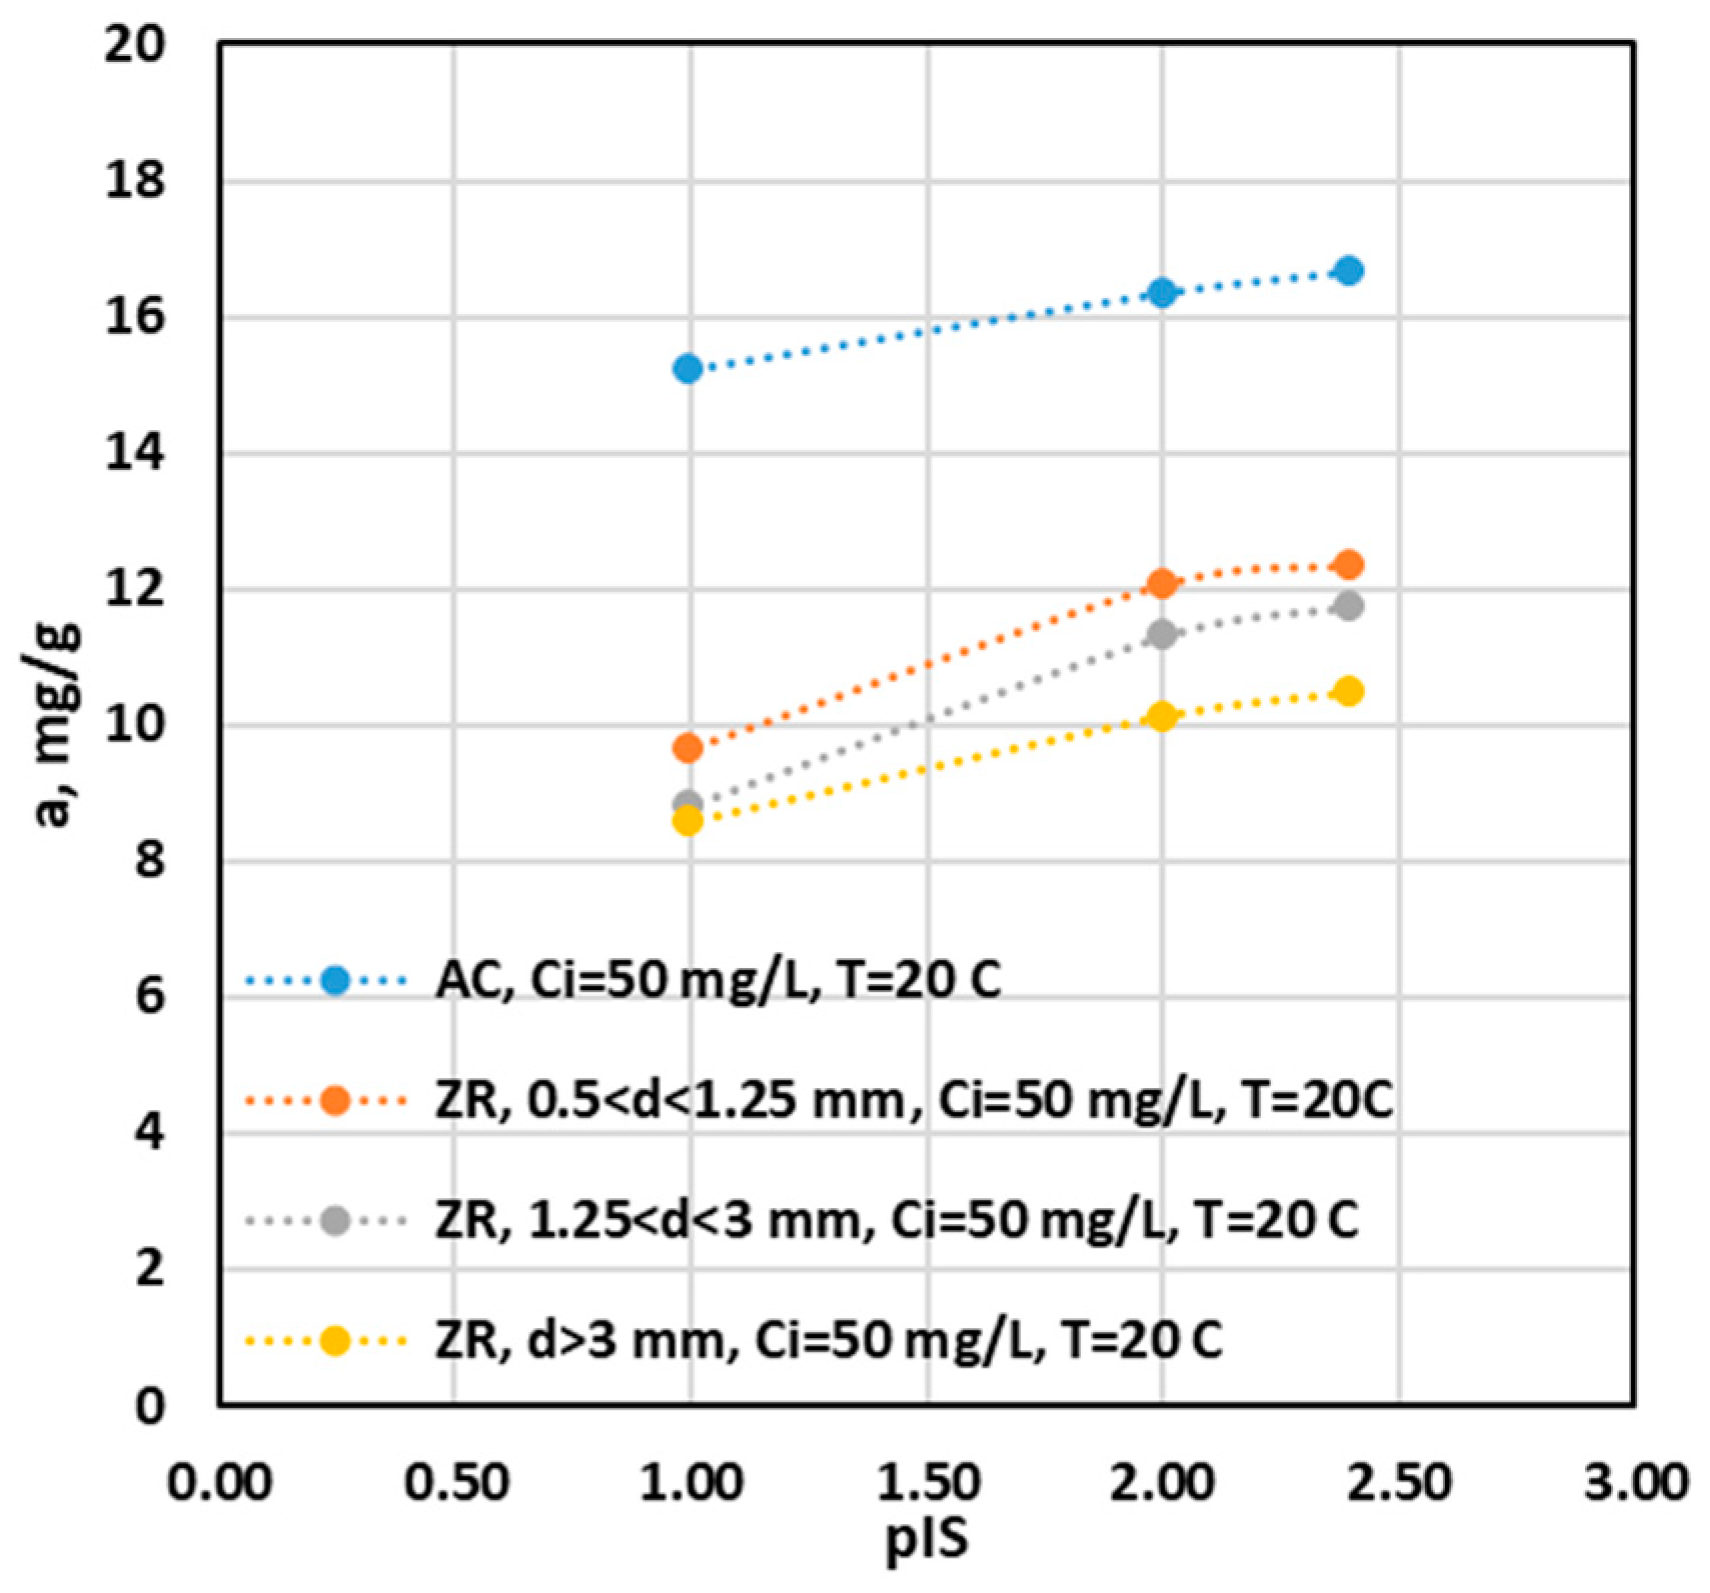
Influence of Ionic Strength

The ionic strength is another important parameter that influences the adsorption capacity of the ammonium ion on ZR and GAC, as seen in Figure 8. To simplify the evaluation, we defined with an analogous pH using the following:
pIS = −log [IS]
where [IS] is the ionic strength of the solution expressed in mol/L.
The research was performed at three ionic states: the initial one introduced by the ammonium ion and the other two introduced by a KCl of 0.01 M and 0.1 M. Work was performed at a temperature of 20 °C, pH = 6.09, with an initial concentration of 39 mg/L. In Figure 8, we graphically represented the variation of the adsorption capacity of the ammonium ion as a function of pIS for all ZR with the three dimensions, and for GAC. It can be observed that as the ionic strength increases, the adsorption capacity decreases for all four adsorbents. With an increase in the ionic strength at a pIS equal to two, it can be observed that there is a decrease to 98% of the adsorption capacity of GAC, and, at a pIS equal to one, the capacity decreases to 91%, compared to the value of the initial adsorption capacity of 16.64 mg/g. This demonstrates that the active centers on the active surface of GAC do not have a high affinity for the ionic species present in the solution.
For ZR, an ionic strength with pIS equal to two, the adsorption capacity of the ammonium ion decreases to values between 75% and 82%, and for pIS equal to one, to values between 96% and 98%, compared to the initial capacity. This decrease shows us that the active surface has active centers for which the ammonium ion competes with the potassium ion and possibly with other ions. Therefore, there is a possibility that, under the conditions of using real waters with a varied content of cationic species, the adsorption capacity for the ammonium ion will be much lower, due to the competition between ammonium and the other cations for the active centers.

3.3. Kinetic of Adsorption

From the analysis of Figure 9, it can be seen that the size of the granule influences the time required to reach the sorption equilibrium of the ammonium ion on ZR, so it is approximately 48, 72, and 93 h for ZR with 0.5 < d < 1.25 mm, 1.25 < d < 3 mm, and d > 3 mm, respectively. In the first 10 min of contact, ZR at all sizes retains about 12% of the total adsorption capacity; after 60 min, the adsorption capacities are 41%, 22.5%, and 25.6% for ZR, in the order of increasing size, respectively. After 48 h, the adsorption capacities increase to values of 98%, 94%, and 85.4% for ZR, in the order of increasing size. Other studies have been performed on ammonium sorption on zeolites, the periods of time mentioned as being necessary to reach equilibrium in the range of tens and hundreds of minutes [2], up to 72 h for New Zealand zeolites and mordenites [42]. GAC has a different behavior; as you can see in Figure 10, it retains 60% of the total adsorption capacity in the first 15 min, and it reaches a capacity of 96.6% of this after two hours.
The kinetic study of the adsorption process is very important because it provides information about the rate at which the adsorption process takes place and the mass transfer mechanism. The kinetics of the adsorption process takes into account the particularities of adsorbents that have a porous structure [31]. The porosity of the adsorbent must be high, and the size of the pores must be larger than the size of the chemical species that are adsorbed. Another important parameter is the size of the internal surface of the adsorbent; the larger it is, the better the adsorbent can come into contact with the adsorbate. In order for the adsorbent to perform well, it is absolutely necessary to have a significant number of active centers on the internal surface that show affinity for the adsorbate, and these active centers to be uniformly distributed on the surface [31].
The mass transfer kinetics in the adsorption process takes place in three stages: external diffusion determined by the concentration difference between the solution and the adsorbent surface; internal diffusion that depends on the size of the pores and the adsorbed species; and the proper adsorption at the level of the active center, where physical or chemical processes take place between the active center and adsorbates [40].
To characterize the kinetics of the ammonium ion adsorption process on zeolites ZR and GAC, they chose pseudo-first order, pseudo-second order, Elovich, and intra-particle diffusion mathematical models. In Table 2, the mathematical equations that characterize the different kinetics models are presented. From Table 7, it can be seen that the kinetics of the ammonium ion adsorption process on ZR zeolite for all three dimensions is best characterized by the pseudo-second order mathematical model; the values of R2 are between 0.995 and 0.999.
In this case, the retention of the ammonium ion is controlled by the stage of the chemical adsorption process, that is, the reaction between the active center and the ammonium ion. In this situation, the concentration of the ammonium ion in the solution in the pores is equal to its concentration outside the granule. This model characterizes the materials that have a very large number of active centers, uniformly distributed on the specific surface of the adsorbent, and the concentration of the adsorbate is low [31]. The zeolite ZR has an active surface of 41 m2/g and an adsorption capacity of 12.34 mg/g, which proves that there is a large number of active centers that are involved in adsorption or ion exchange processes.
The kinetics of the ammonium ion adsorption process on GAC are best characterized by the pseudo-first-order kinetic model; R2 is 0.990. This kinetic model is specific to processes in which the adsorbents have a small number of active cents that react with ammonium, the concentration of ammonium is very high, and the rate-determining step is either external diffusion or internal diffusion [31]. Although activated carbon has a specific surface area of 1100 m2/g, meaning 23 times greater than that of ZR, the ammonium ion retention capacity is reduced by only 16.7 mg/g. Active cents can contain hydroxyl and carboxyl groups that can react with the ammonium ion, and the process can be especially a Van der Waals-type physical process.

4. Conclusions

This paper presents a comparison between the efficiency of zeolite-type clinoptilolite from Romania and granular activated carbon Norit GAC 830 E, an adsorbent frequently used in water treatment. The choice of this absorbent was not accidental.
Zeolite is found in very large deposits in Romania; it is a natural, cheap material with costs between 50 and 100 EUR/ton, compared to other adsorbents that cost over 500 EUR/ton. Zeolite can also be regenerated and reused in the technological process of water treatment and purification, but also after exhaustion, as an amendment for the soil.
The zeolite type clinoptilolite from Romania is a material that meets all the conditions to be called sustainable. The main crystalline form present in ZR is Ca-clinoptinolite ((Na1.32K1.28Ca1.72Mg0.52) (Al6.77Si29.23O72)(H2O)26.84), at over 80%, with a ratio of Si/Al greater than four. The size of the pores is predominantly of the order of nanometers. The pH for which the number of positive charges is equal to the number of negative charges, ZPC pH, is between 2.97 and 4.34 for zeolite and 6.79 for GAC. The adsorption capacity of ammonium ions from synthetic solutions at 20 °C, pH = 6.09, for the range of initial concentrations 0–50 mg/L, for Rupea zeolite is in the range of 10.46–12.34 mg/g, and for granular activated carbon GAC W830 is 16.64 mg/g. It was found that the increase in temperature has a positive effect and indicates that the adsorption process is endothermic. The increase of pH has a positive effect, and the increase of the ionic strength determines the negative effect.
The Langmuir isotherm proved to be the most appropriate to describe the adsorption of ammonium ions on all types of adsorbents used. Kinetic models were also identified as the best that describe the experimental processes. The results of the investigation showed that second-order kinetics governs the adsorption process on ZR zeolites, and pseudo-first order governs activated carbon.

Author Contributions

Conceptualization, D.S.S. and M.S.; data curation: D.S.S.; methodology, D.C.B. and M.S.; software, D.S.S.; validation, M.S., T.H.A., and N.C.M.; formal analysis, T.H.A.; investigation, T.H.A.; resources, D.S.S.; writing—original draft preparation, D.S.S. and T.H.A. writing—review and editing, D.C.B. and N.C.M.; visualization, M.S.; supervision, M.S.; funding acquisition, D.S.S. All authors have read and agreed to the published version of the manuscript.

Funding

This research received no external funding.

Institutional Review Board Statement

Not applicable.

Informed Consent Statement

Not applicable.

Data Availability Statement

The original contributions presented in the study are included in the article, further inquiries can be directed to the corresponding author/s.

Conflicts of Interest

The authors declare no conflict of interest.

References

  1. Li, P.; Wu, J.; Qian, H.; Zhang, Y.; Yang, N.; Jing, L.; Yu, P. Hydrogeochemical characterization of groundwater in and around a wastewater irrigated forest in the Southeastern Edge of the Tengger Desert, Northwest China. Expo. Health 2016, 8, 331–348. [Google Scholar] [CrossRef]
  2. Huang, J.; Kankanamge, N.R.; Chow, C.; Welsh, D.T.; Li, T.; Teasdale, P.R. Removing ammonium from water and wastewater using cost-effective adsorbents: A Review. J. Environ. Sci. 2018, 63, 174–197. [Google Scholar] [CrossRef] [PubMed]
  3. Abed, T.H.; Ștefan, D.S.; Pauna, G.; Ștefan, M. Study of the effectiveness of membrane aeration systems on the removal of ammonium ions from natural waters. U.P.B. Sci. Bull. Ser. B 2024, 86, 57–66. [Google Scholar]
  4. Gao, Y.; Yu, G.; Luo, C.; Zhou, P. Groundwater nitrogen pollution and assessment of its health risks: A case study of a typical village in rural-urban continuum, China. PLoS ONE 2012, 7, e33982. [Google Scholar] [CrossRef]
  5. Turan, M. Application of Nanoporous Zeolites for the Removal of Ammonium from Wastewaters: A Review, Low-Dimensional and Nanostructured Materials and Devices; Springer: Berlin/Heidelberg, Germany, 2016; pp. 477–504. [Google Scholar]
  6. Boopathy, R.; Karthikeyan, S.; Mandal, A.B.; Sekaran, G. Adsorption of Ammonium Ion by Coconut Shell-Activated, Carbon From Aqueous Solution: Kinetic, Isotherm, and Thermodynamic Studies. Environ. Sci. Pollut. Res. 2013, 20, 533–542. [Google Scholar] [CrossRef] [PubMed]
  7. Dey, S.; Charan, S.S.; Pallavi, U.; Sreenivasulu, A.; Haripavan, N. The removal of ammonia from contaminated water by using various solid waste biosorbents. Energy Nexus 2022, 7, 100119. [Google Scholar] [CrossRef]
  8. Sica, M.; Duta, A.; Teodosiu, C.; Draghici, C. Thermodynamic and kinetic study on ammonium removal from a synthetic water solution using ion exchange resin. Clean Technol. Environ. Policy 2014, 16, 351–359. [Google Scholar] [CrossRef]
  9. Gupta, V.; Sadegh, H.; Yari, M.; Shahryari Ghoshekandi, R.; Maazinejad, B.; Chahardori, M. Removal of ammonium ions from wastewater: A short review in development of efficient methods. Glob. J. Environ. Sci. Manag. 2015, 1, 149–158. [Google Scholar]
  10. Yang, Y.; Liu, H. The mechanisms of ozonation for ammonia nitrogen removal: An indirect process. J. Environ. Chem. Eng. 2022, 10, 108525. [Google Scholar] [CrossRef]
  11. Jian, J.; Hashemi, H.; Wu, H.; Glarborg, P. Study of Ammonia Oxidation with Ozone Addition. Appl. Energy Combust. Sci. 2023, 14, 100137. [Google Scholar] [CrossRef]
  12. Zhang, C.; He, D.; Ma, J.; Waite, T.D. Active chlorine mediated ammonia oxidation revisited: Reaction mechanism, kinetic modelling and implications. Water Res. 2018, 145, 220–230. [Google Scholar] [CrossRef]
  13. Liu, C.; Chen, Y.; He, C.; Yin, R.; Liu, J.; Qiu, T. Ultrasound-Enhanced Catalytic Ozonation Oxidation of Ammonia in Aqueous Solution. Int. J. Environ. Res. And. Public Health 2019, 16, 2139. [Google Scholar] [CrossRef]
  14. Bodalo, A.; Gomez, J.-L.; Gomez, E.; Leon Gerardo Tejera, M. Ammonium Removal from Aqueous Solutions by Reverse Osmosis Using Cellulose Acetate Membranes. Desalination 2005, 184, 149–155. [Google Scholar] [CrossRef]
  15. Li, H.; Cao, Y.; Liu, P.; Li, Y.; Zhou, A.; Ye, F.; Xue, S.; Yue, X. Ammonia-nitrogen removal from water with gC3N4-rGO-TiO2 Z-scheme system via photocatalytic nitrification-denitrification process. Environ. Res. 2022, 205, 112434. [Google Scholar] [CrossRef]
  16. Zuo, R.; Chen, X.; Li, X.; Shan, D.; Yang, J.; Wang, J.; Teng, Y. Distribution, genesis, and pollution risk of ammonium nitrogen in groundwater in an arid loess plain, northwestern China. Environ. Earth Sci. 2017, 76, 629. [Google Scholar] [CrossRef]
  17. Potting, J.; Hekkert, M.; Worrell, E.; Hanemaaijer, A. Report Circular Economy: Measuring Innovation in the Product Chain, Policy Report January 2017; PBL Netherlands Environmental Assessment Agency: The Hague, The Netherlands, 2017. [Google Scholar]
  18. Hungaro Arruda, E.; Brancalhão Melatto, R.A.P.; Levy, W.; Conti, D. Circular economy: A brief literature review (2015–2020). Sustain. Oper. Comput. 2021, 2, 79–86. [Google Scholar] [CrossRef]
  19. Han, B.; Butterly, C.; Zhang, W.; Zheng He, J.; Chen, D. Adsorbent Materials For Ammonium and Ammonia Removal: A Review. J. Clean. Prod. 2012, 283, 124611. [Google Scholar] [CrossRef]
  20. Khosravi, A.; Esmhosseini, M.; Khezri, S. Removal of Ammonium Ion from Aqueous Solutions Using Natural Zeolite: Kinetic, Equilibrium and Thermodynamic Studies. Res. Chem. Intermed. 2014, 40, 2905–2917. [Google Scholar] [CrossRef]
  21. Millar, G.J.; Winnett, A.; Thompson, T.; Couperthwaite, S.J. Equilibrium Studies of Ammonium Exchange with Australian Natural Zeolites. J. Water Process. Eng. 2016, 9, 47–57. [Google Scholar] [CrossRef]
  22. Clark, R.N.; Swayze, G.A.; Gallagher, A.J.; King, T.V.; Calvin, W.M. The US Geological Survey, Digital Spectral Library, Version 1 (0.2 to 3.0 um); Geological Survey (US): Reston, VA, USA, 1993. [Google Scholar]
  23. Directive EU 2020/2184 on the Quality of Water Intended for Human Consumption (Recast) 2020, Drinking Water—Essential Quality Standards; europa.eu; Council of European Union: Brussels, Belgium, 2020.
  24. Council Directive 91/271/EEC of 21 May 1991 Concerning Urban Waste-Water Treatment; Directive-91/271-EN-EUR-Lex; europa.eu; Council of European Union: Brussels, Belgium, 1991.
  25. Council of European Union. Interinstitutional File: 2022/0345(Cod, Proposal for A Directive of the European Parliament and of the Council Concerning Urban Wastewater Treatment 2022; Recast; Pdf, Europa.Eu; Council of European Union: Brussels, Belgium, 2022. [Google Scholar]
  26. Lurie, I.I. Director of Analytical Chemistry; Technical Publishing House: Bucharest, Romania, 1970; pp. 250–252. [Google Scholar]
  27. Aziam, R.; Stefan, D.S.; Nouaa, S.; Chiban MAnd Bosomoiu, M. Adsorption of metal ions from single and binary aqueous systems on bio-nanocomposite, alginate-clay. Nanomaterials 2024, 14, 362–383. [Google Scholar] [CrossRef]
  28. Ngenoa, E.C.; Shikukua, V.O.; Orataa, B.F.; Barazaa, L.D.; Kimosopa, S.J. Caffeine and Ciprofloxacin Adsorption from Water Onto Clinoptilolite: Linear Isotherms, Kinetics, Thermodynamic and Mechanistic Studies. Shouth Afr. Chem. 2019, 72, 136–142. [Google Scholar] [CrossRef]
  29. Wang, J.; Guo, X. Adsorption isotherm models: Classification, physical meaning, application and solving method. Chemosphere 2020, 258, 127279. [Google Scholar] [CrossRef] [PubMed]
  30. Al-Ghouti, M.A.; Da’ana, D.A. Guidelines for the use and interpretation of adsorption isotherm models: A review. J. Hazard. Mater. 2020, 393, 122383. [Google Scholar] [CrossRef] [PubMed]
  31. Wang, J.; Guo, X. Adsorption Kinetic Models: Physical Meanings, Applications, and Solving Methods. J. Hazard. Mater. 2020, 390, 12215. [Google Scholar] [CrossRef] [PubMed]
  32. Dura, A.M.; Stefan, D.S.; Chiriac, F.L.; Trusca, R.; Nicoara, A.I.; Stefan, M. Clinoptilolite—A Sustainable Material for the Removal of Bisphenol A from Water. Sustainability 2023, 15, 13253. [Google Scholar] [CrossRef]
  33. Norit Gac 830 W: Datasheet. Specification (Technical Standard). Carbon. Norit Gac 830 W: Datasheet | PDF | Specification. Available online: https://www.linkengineers.net/assets/pdf/GAC_830_W_Chemicals.pdf (accessed on 10 May 2024).
  34. Bulushev, D.A.; Yuranov, I. Noble Metal Nanoparticles on Carbon Fibers. In Dekker Encyclopedia of Nanoscience and Nanotechnology, 2nd ed.; Taylor and Francis: New York, NY, USA, 2009; pp. 3195–3205. Available online: https://www.researchgate.net/publication/280943506_Noble_Metal_Nanoparticles_on_Carbon_Fibers#fullTextFileContent (accessed on 21 August 2024).
  35. Cotton, A. Research article Dissolution kinetics of clinoptilolite and heulandite in alkaline conditions. Biohorizons 2008, 1, 38–43. [Google Scholar] [CrossRef]
  36. Halim, M.T.; Latif, A.I. Ammonia Removal from Aqueous, Solution Using Organic Acid Modified Activated Carbon. World Appl. Sci. J. 2013, 24, 1–6. [Google Scholar] [CrossRef]
  37. Wang, Y.F.; Lin, F.; Pang, W.Q. Ammonium Exchange n Aqueous Solution Using Chinese Natural Clinoptilolite and Modified eolite. J. Hazard. Mater. 2007, 142, 160–164. [Google Scholar] [CrossRef]
  38. Mazloomi, F.; Jalali, M. Ammonium Removal from Aqueous Solutions by Natural Iranian Zeolite in the Presence of organic Acids, Cations and Anions. J. Environ. Chem. Eng. 2016, 4, 240–249. [Google Scholar] [CrossRef]
  39. Marañón, E.; Ulmanu, M.; Fernández, Y.; Anger, I.; Castrillón, L. Removal of Ammonium from Aqueous Solutions with Volcanic Tuff. J. Hazard. Mater. 2006, 137, 1402–1409. [Google Scholar] [CrossRef]
  40. Tien, C.; Ramarao, B.V. Further Examination of the Relationship Between th Langmuir Kinetics and the Lagergren and the Second-Order Rate Models of Batch Adsorption. Sep. Purif. Technol. 2014, 136, 303–308. [Google Scholar] [CrossRef]
  41. Elmorsi, R.R.; Abou-El-Sherbini, K.S.; El-Dein, W.A.S.; Lotfy, H.R. R. Activated eco-waste of Posidonia oceanica rhizome as a potential adsorbent of methylene blue from saline water. Biomass Convers. Biorefinery 2024, 14, 2529–2542. [Google Scholar] [CrossRef]
  42. Weatherley, L.R.; Miladinovic, N.D. Comparison of the Ion Exchange Uptake of Ammonium Ion Onto New Zealand Clinoptilolite and Mordenite. Water Resour. 2004, 38, 4305–4312. [Google Scholar] [CrossRef] [PubMed]
Figure 1. Characteristic diffractograms for ZR.
Sustainability 16 07888 g001
Figure 2. The SEM analysis for ZR at different magnifications levels: (a)—100 times, (b)—1000 times, (c)—10,000 times, and (d)—50,000 times.
Sustainability 16 07888 g002
Figure 3. EDX spectrum specific to ZR.
Sustainability 16 07888 g003
Figure 4. The pHzPC for adsorbants.
Sustainability 16 07888 g004
Figure 5. Isotherms of adsorption of ZR and AC.
Sustainability 16 07888 g005
Figure 6. Effect of temperature on adsorption capacity of ZR and AC.
Sustainability 16 07888 g006
Figure 7. Effect of initial pH on adsorption capacity of ZR and AC.
Sustainability 16 07888 g007
Figure 8. Effect of ionic strength on adsorption capacity of ZR and AC.
Sustainability 16 07888 g008
Figure 9. Variation of ZR adsorption capacity for ammonium ion over time.
Sustainability 16 07888 g009
Figure 10. Variation of AC adsorption capacity for ammonium ion over time.
Sustainability 16 07888 g010
Table 1. Characteristic mathematical equations for adsorption isotherms models [27,28,29,30].
Isotherm
Model
Form
Type
Mathematic RelationsParameters Signification
LangmuirNL a e = a L K L C e 1 + K L C e a e —adsorption capacity, mg/g;
Ce—equilibrium concentration, mg/L;
a L—maximum adsorption capacity, mg/g;
KL—Langmuir constant, L/mg.
L 1 a e = 1 a L + 1 a L K L C e
FreundlichNL a e = K F C e 1 / n ae—adsorption capacity, mg/g;
Ce—equilibrium concentration, mg/L;
KF—Freundlich constant, mg/g;
n—empirical constant related to heterogeneity of the adsorbent surface.
L ln a e = ln K F + 1 n ln C e              
TemkinNL a = R T b T ln K T C e T—temperature, K;
R—universal gas constant, 8.314, J·mol−1K−1;
bT—Temkin isotherm constant related to the heat of adsorption, J/mol;
KT—equilibrium constant for the maximum binding energy, L/mg.
L a = R T b T ln K T + R T b T ln C e
Dubinin–Radushkevich.NL a = a m e K p ε 2 am—maximum adsorption capacity, mg/g;
ε—Polanyi potential that can be calculated from Equation (10);
Ce—equilibrium concentration, mg/L;
KD—constant, (mol2 J–2).
L ln a e = ln a m K D ε 2    
  ε = R T ln 1 + 1 C e
E= 1 ( 2 K D ) 1 2
Table 2. Characteristic mathematical equations for kinetics adsorption models [26,27,31].
Kinetic
Model
Form
Type
Mathematic RelationsParameters Signification
Pseudo-first order NL d a t d t = k 1 a m a t                                         am—adsorption capacity at equilibrium, mg/g;
at—adsorption capacity at moment t, mg/g;
k2—rate constant for the pseudo-first order kinetics model, (g·mg−1min−1);
t—contact time t, min.
L ln a m a t = ln a m k 1 t        
`Pseudo-Second order NL d a t d t = k 2 a m a t 2     am—adsorption capacity, mg/g;
at—adsorption capacity at moment t, mg/g;
k2—rate constant for the pseudo-second order kinetics model, g·mg−1min−1;
t—contact time t, min.
L t a t = 1 k 2 a m 2 + 1 a m t
Elovich NL d a t d t = α e β a t         at -adsorption capacity at time t, mg/g;
t—time, minute;
α—initial adsorption rate, mg·g−1min−1;
β—desorption constant, g·mg−1.
L a t = l n α β β + 1 β   l n ( t )
Intra-particle diffusion L a t = k I D t 1 / 2 + C I D   KID—intra-particle diffusion rate constant, mg−1·min1/2;
cID—ammonium concentration, mg/L;
at—adsorption capacity at moment t, mg/g;
t—contact time, minutes.
Table 3. Proportion of crystals in ZR.
No.CompoundCrystallographic FormulaContribution (%)
1Clinoptilolite Ca(Na1.32K1.28Ca1.72Mg0.52)(Al6.77Si29.23O72)(H2O)26.8481.0
2Phlogopite-1M (KMg3Si3AlO10(OH)2)11.5
3Albite(Na0.84Ca0.16)Al1.16Si2.84O85.4
4QuartzSiO22.1
Table 4. Elemental composition and weight, and atomic percent of the component elements for ZR.
ElementWeight %Atomic %
O52.5466.94
Na0.390.35
Mg0.520.44
Al6.975.27
Si32.8123.81
K2.521.32
Ca2.321.18
Fe1.920.7
Table 5. Characteristic parameters of the isotherm models describe the adsorption of the ammonium ion on ZR and GAC at 20 °C.
ModelParametersAdsorbents
AC
GAC
ZR
0.5 < d,1.25 mm
ZR
1.25 < d < 3 mm
ZR
d > 3 mm
LangmuiraL(mg/g)15.2211.999.5011.04
KL (L/mg)0.260.310.340.13
R20.9900.9910.9900.970
Freundlich1/n0.2510.6320.6300.757
KF (mg/g)2.212.041.7261.031
R20.8990.9170.9360.948
TemkinKT (L·mg–1)0.00270.010.02250.07
bT (J·mol–1)8323.216328.95724.25644.1
R20.8290.8980.8970.857
D-RKD (mol2·J–1)1.431.421.430.3
am (mg/g))9.417.957.099.74
E (J·mol−1)0.590.590.591.58
R20.8250.8540.8450.812
Table 6. The RL values for ZR and GAC from Equation (19).
Dimensionless ConstantAmmonium
GACZR
0.5 < d < 1.25 mm
ZR
1.25 < d < 3 mm
ZR
d > 3 mm
RL0.58060.53730.51420.7346
Table 7. Characteristic parameters of the kinetic models that describe the adsorption of the ammonium ion on ZR and GAC.
Kinetics ModelParametersAdsorbents
AC
GAC
ZR
0.5 < d < 1.25 mm
ZR
1.25 < d < 3 mm
ZR
d > 3 mm
Pseudo-first order modelam,exp (mg/g)16.6412.209.8768.26
K1 (min−1)2.750.00510.040.034
am,cal (mg/g)12.977.847.0426.59
R20.9900.8750.9450.976
Pseudo-second order modelam,exp (mg/g)16.6412.209.8768.264
K2 (g·mg−1min−1)0.0180.0560.0430.036
am,cal (mg/g)14.112.249.7948.21
R20.9640.9990.99850.995
Elovich modelam,exp (mg/g)16.6412.209.8768.264
α0.00630.00260.0180.018
β6.8341.631.321.32
R20.9840.9410.9510.951
Intra-particle diffusion KInt (mg·g−1min−1/2)0.23841.210.970.74
CI0.6712.431.21.3
R20.9430.790 0.8950.947
Disclaimer/Publisher’s Note: The statements, opinions and data contained in all publications are solely those of the individual author(s) and contributor(s) and not of MDPI and/or the editor(s). MDPI and/or the editor(s) disclaim responsibility for any injury to people or property resulting from any ideas, methods, instructions or products referred to in the content.

