Abstract
The capacity of carbon sinks varies among the different types of ecosystems, and whether national parks, as an important type of nature reserve, have a high carbon sink capacity (CSC) and whether eco-tourism in national parks affects their CSC are the main scientific issues discussed. Using MODIS Net Primary Production (NPP) product data, this study analysed the spatiotemporal variation in carbon sources and sinks (CSSs) in the ecosystem of Huangshan National Park from 2000 to 2020, as well as the impact of tourism on these carbon sources and sinks. The findings indicate that, while the ecosystems of national parks generally have a strong CSC, they may not always function as carbon sinks, and during the study period, Huangshan National Park served as a carbon source for four years. Temporally, the CSSs in the ecosystem of the national park exhibit a cyclical pattern of change with a four-year cycle and strong seasonality, with spring and autumn functioning as carbon sinks, and summer and winter as carbon sources. Spatially, the CSSs of the national park ecosystem exhibited a vertical band spectrum of spatial distribution, and the CSC showed a trend of gradual enhancement from low altitude to high altitude. Tourism is a major factor that has an impact on the CSC of national park ecosystems.
1. Introduction
The global terrestrial ecosystem, which covers roughly one-third of the planet’s surface, is an important carbon sink and a significant carbon source. It performs the primary function of the natural carbon cycle. With global climate change in recent decades, terrestrial ecosystems have played an increasingly important role as carbon sinks, effectively mitigating global warming [1]. Carbon sinks within terrestrial ecosystems from 2011 to 2020, according to data from the Global Carbon Project, were capable of mitigating approximately 29% of human-generated carbon dioxide emissions [2]. China’s contribution to current climate warming has been assessed to be approximately 9% [3,4]. At the 75th session of the United Nations held in 2020, China promised to reach the peak of its carbon emissions by 2030 and achieve carbon neutrality by 2060. Therefore, it is critical to understand whether terrestrial ecosystems act as carbon sinks or carbon sources in the global carbon cycle, which has become a vital environmental concern in China [5,6]. Various methods have been employed to assess regional-scale carbon balance and sinks: the inventory approach [7,8], the eddy covariance technique [9], ecosystem process modelling [10], and atmospheric inversion methodology [11,12]. Nonetheless, each of these techniques yields results that are to some extent uncertain. To determine whether the terrestrial biosphere is a carbon sink or a carbon source, Woodwell et al. [13] proposed net ecosystem productivity (NEP). NEP is calculated by subtracting from Net Primary Production (NPP) the carbon lost through respiration by consumers and decomposers [14], and is a physical quantity for measuring atmosphere–terrestrial carbon exchange. Without accounting for the effects of various disturbances, the value of NEP reflects the net carbon exchange of terrestrial ecosystems [15]. In regional-scale research, the NEP in terrestrial forest ecosystems can reflect carbon sink/source situations. NEP is essential to analysing the mechanisms involved with the carbon cycle and understanding the carbon sequestration potential of ecosystems [16,17]. NEP is typically estimated using the model method and product data. The widely used model is the Carnegie-Ames-Stanford Approach [18,19]. Several NPP product data are available; the most widely used are the United States Geological Survey (USGS) MODIS NPP product data [20,21], which have a relatively high resolution, rich data categories, and convenient access. It has been increasingly utilized and verified in research, including the assessment of vegetation biomass and the study of carbon cycling across diverse spatial scales [22,23].
The role of national parks ecosystems as carbon sinks or sources has been debated [24,25,26]. On the one hand, empirical studies have revealed the impact of human activities and climate change on the NEP in terrestrial ecosystems [27,28,29]. Industrial production and daily life activities generate greenhouse gases such as CO2, which has become one of the main carbon emission sources [30]. Meanwhile, natural sources of carbon exist, such as soil, rocks, oceans, and living organisms [31]. On the other hand, China is developing a system of nature reserves, with national parks serving as the mainstay, to protect the originality, wholeness, and systematicity of natural ecosystems. The system of nature reserves, with national parks as the mainstay, is an important source of carbon sinks for China’s terrestrial and marine ecosystems [32]. Although considerable research has been conducted on the spatial and temporal characteristics of carbon sinks in national parks [33], scenario modelling [34], and carbon emission management [35], there remains a lack of systematic research on whether the natural ecosystems of the national parks themselves serve primarily as carbon sinks or carbon sources. Therefore, it is of great significance to objectively evaluate the carbon sink capacity (CSC) of national park ecosystems, and to explore their spatiotemporal evolution characteristics and trends, in order to promote the restoration of the natural ecosystems, to improve the CSC of the natural ecosystems, and to achieve “carbon neutrality” [36].
With the increase in global temperatures, melting of glaciers, and rise in sea levels, the impact of climate change on the growth and development of tourism has become increasingly prominent [37]. While tourism is affected by global climate change, it is also conversely having a significant impact on climate change. Tourism-related energy consumption and carbon emissions are substantial contributors to global greenhouse gas emissions, accounting for approximately 8% of the total emissions worldwide [38]. It is also important to consider the impact of tourism on climate change in the context of the relationship between climate change and tourism [39,40,41]. Tourism contributes economic development, which, in turn, can help control the CO2 emissions from tourism activities [42]. The construction of national parks is not equivalent to creating “no man’s lands”. Rather, providing high-quality eco-tourism services is a key expression of the public interest that national parks hold for everyone. At present, many scenic spots in China are exploring and constructing ‘zero-carbon scenic spots’, and national parks are important places for zero-carbon scenic spot construction. Creating a detailed assessment of the carbon sink levels in national park ecosystems and their evolution characteristics, thus engaging in moderate tourism development based on rational protection, is of significant value for establishing a system of indicators and standards for assessing the sustainability of tourism management in national parks. This promotes the sustainable development of tourism within national parks and contributes to the carbon peak and neutrality targets [32,43,44].
In previous studies, regression analysis, structural equation models, partial differential analysis, and other methods have been commonly used to explore the influencing factors and degrees of carbon sources and sinks (CSS) in terrestrial ecosystems [33,45,46,47]. These methods can effectively quantify the effect of various factors, but are lacking in the spatial expression of various factors. GeoDetector represents a geospatial analytical method that is capable of identifying spatial differentiation and elucidating the underlying drivers of such differentiation. This method can be employed to assess both quantitative and qualitative data, as well as to discern the interaction of two factors with respect to dependent variables [48]. Moreover, this is a dynamic method for studying the interactions among various driving factors [49] and reveals the intricate relationships between different influencing factors and response variables [50,51,52].
Ecosystems were typically recognized as carbon sinks [53,54], and most studies were conducted on a large scale, using countries and temperature zones as research units [55,56], while fewer studies were conducted on ecosystems in national parks, which serve as landscape-scale samples. National parks possess both a pristine ecological environment and a close connection with human activities, making their ecosystems more sensitive and rapid in responding to local climate change, and their ecosystem carbon sequestration and emission performances will be more pronounced. In this study, the ecosystem NEP was measured and obtained using Huangshan National Park as the research unit, exploring the identification of whether national park ecosystems are carbon sources or sinks. The measurements obtained in this study focus on the natural ecosystem’s background attributes, that is, the level of carbon source and sink. We integrated meteorological data, remote sensing data, soil analysis, field survey findings, and statistical information to employ GeoDetector technology for a thorough driver analysis. We systematically investigate the spatiotemporal variations in ecosystem carbon sources and sinks (CSSs) and their underlying mechanisms, addressing the challenges of determining the carbon sequestration capacity of the natural ecosystems within Huangshan National Park and promoting sustainable tourism development in the national park. Our objectives are two-fold: (1) to estimate the CSSs of the ecosystem of the Huangshan Scenic Area (the core area of Huangshan National Park) and its temporal and spatial changes from 2000 to 2020, and (2) to explore the major drivers of the temporal and spatial changes in the NEP and clarify their implications for the NEP. By addressing the questions of whether Huangshan National Park functions as a carbon sink or source and to what degree tourism development influences the park’s carbon sinks, our research aims to offer a solid scientific foundation for the ecological preservation and tourism planning within the national park. Additionally, our findings aim to guide the pursuit of carbon neutrality within the tourism sector, providing strategic insights for the environmentally sustainable development of tourism in national parks.
2. Materials and Methods
2.1. Study Area
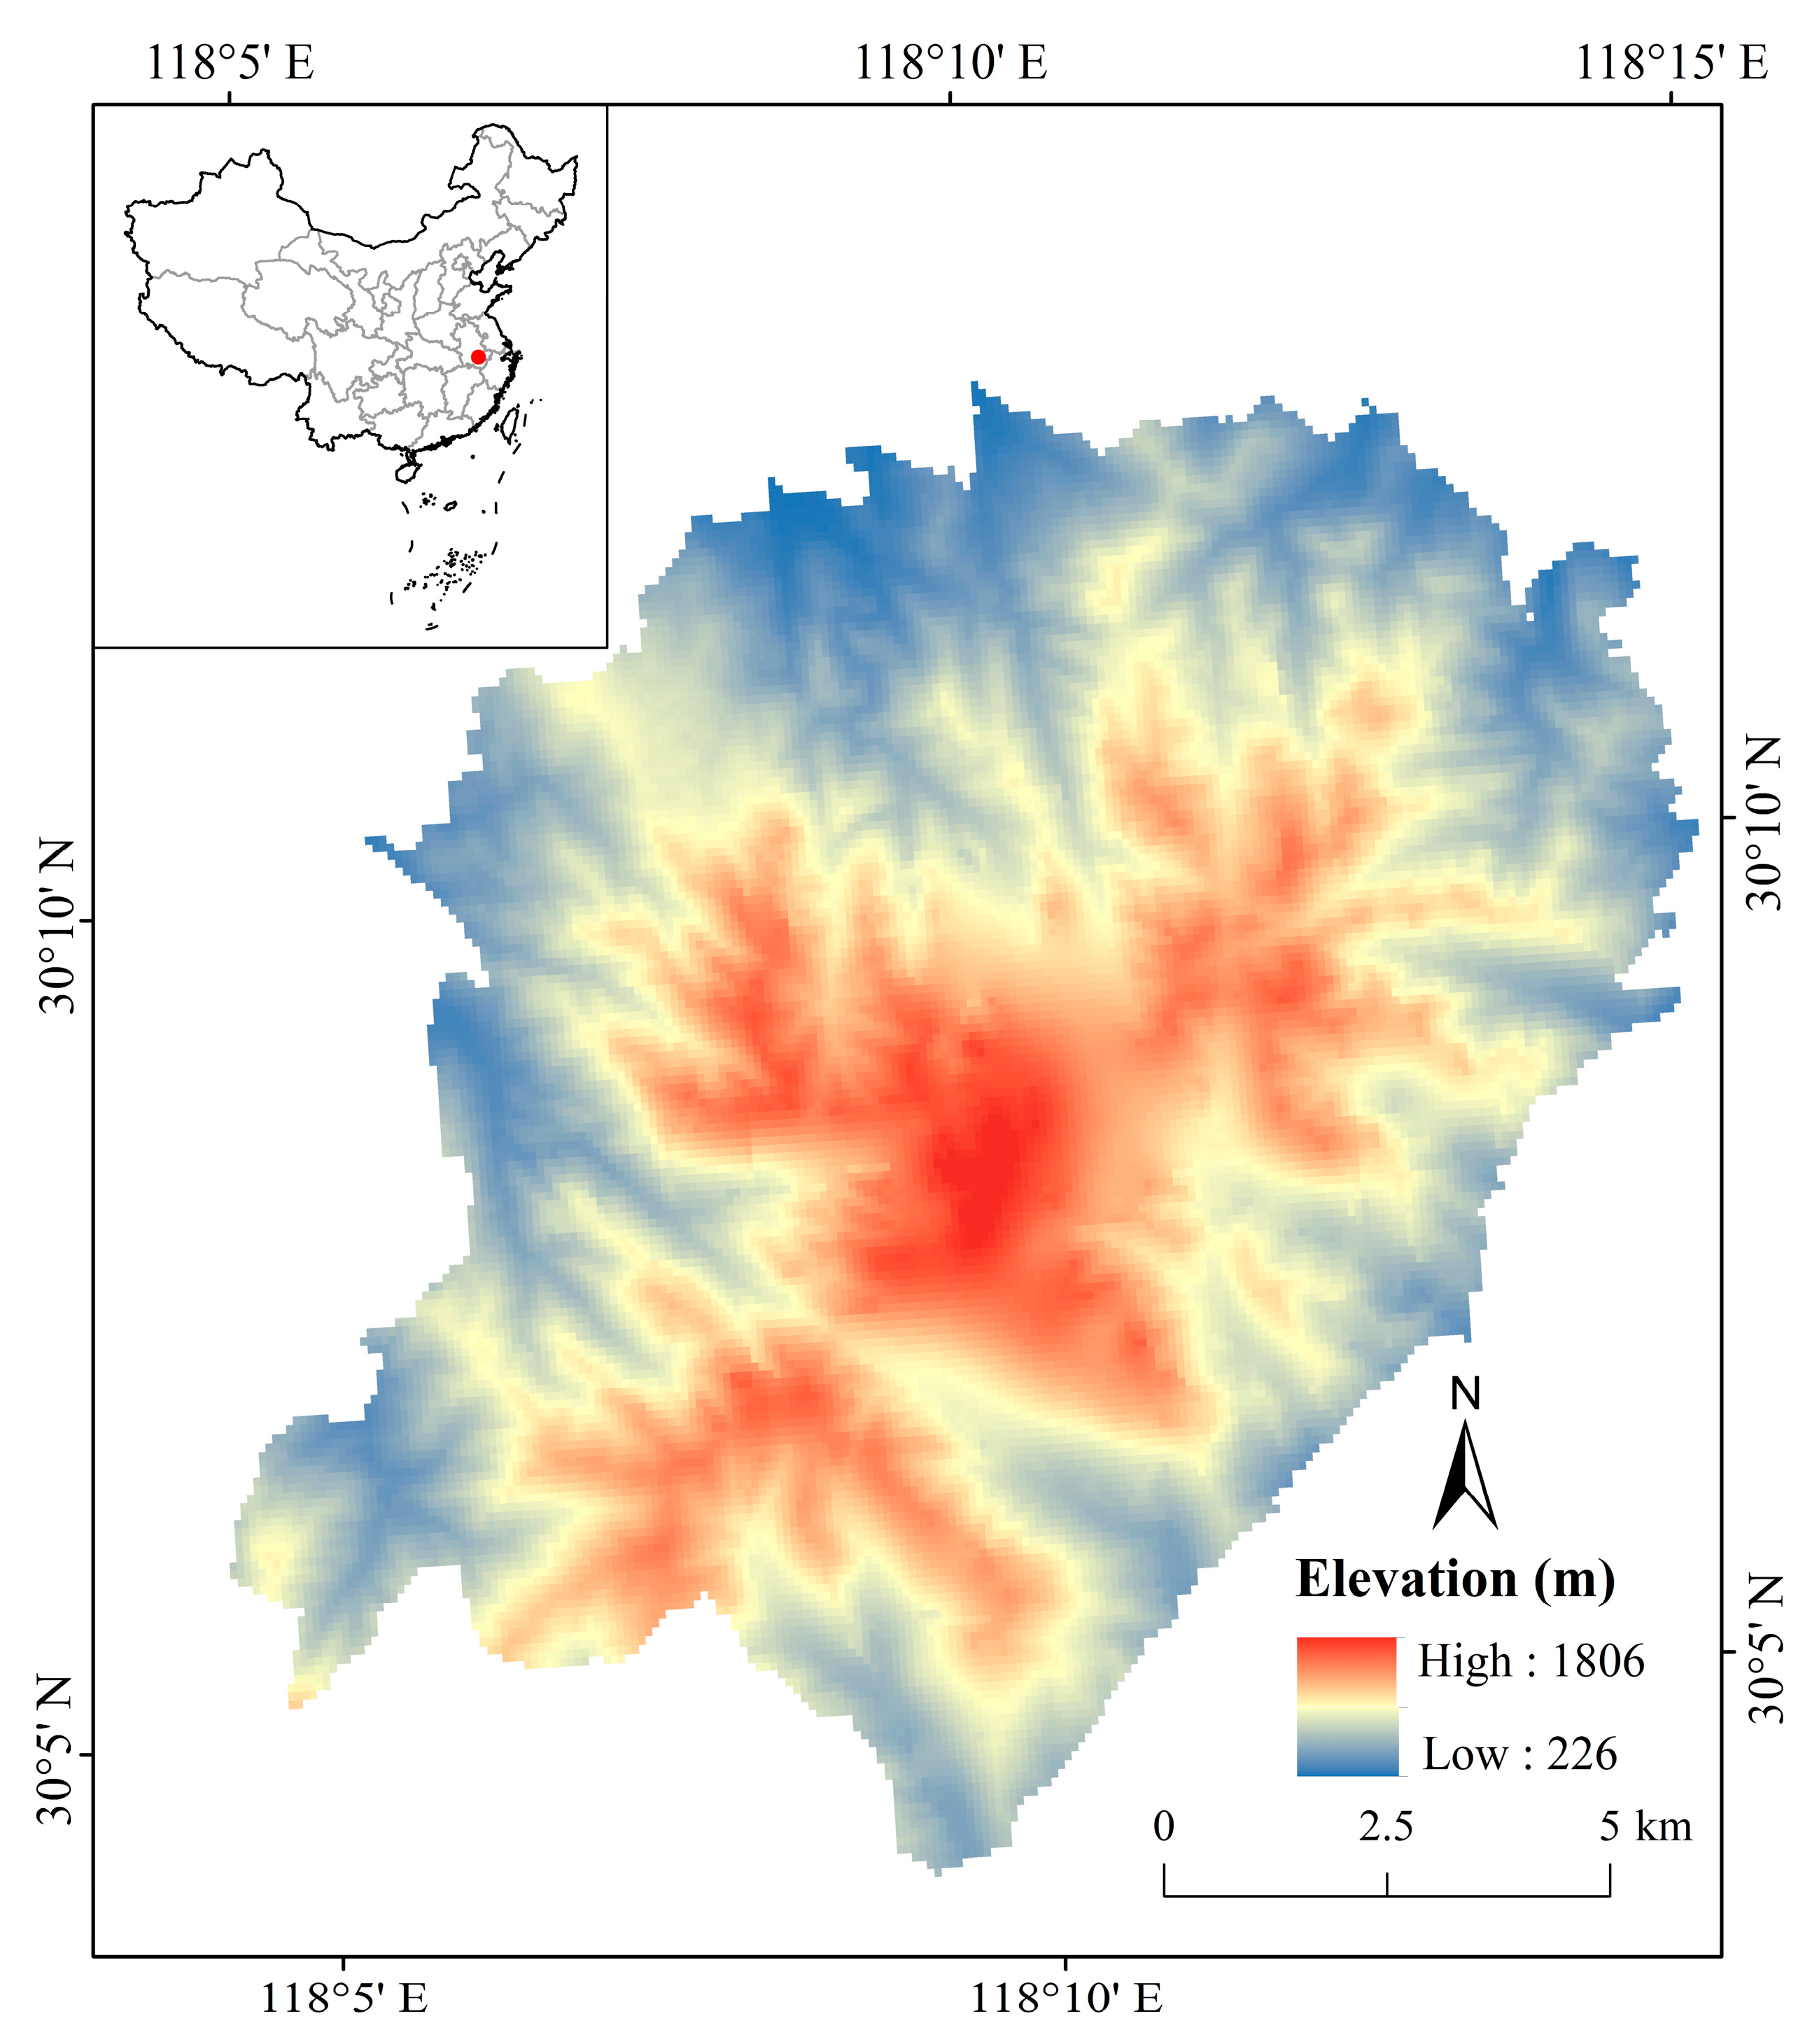
The Huangshan Scenic Area (118°01′ E–118°17′ E, 30°01′ N–30°18′ N) is located in Huangshan City, Anhui Province (Figure 1). It is the core area of Huangshan National Park, covering an area of approximately 160.6 km2. As the core of the Huangshan Mountains, the area has a unique natural landscape and cultural landscape resources. It is located at the transition between the temperate zone and subtropical zone, which is dominated by the East Asian monsoon climate, with apparent seasonal temperature variation which is the highest in the summer and an annual mean temperature of 7.8 °C. The terrain and altitude of the area affect the annual and daily temperature differences, which are generally the highest in valleys and lowest in the peak area, and the local and vertical climates of the mountains are obvious. Precipitation exhibits clear seasonality and slope orientation. The annual average precipitation is 2395 mm, with more than 70% of the annual total rainfall occurring in spring and summer. The area has a relatively low annual sunshine duration and percentage, with many clouds and high humidity, which provide important conditions for the formation of unique natural landscapes such as the sea of clouds, rime, and sunsets. The vegetation has the dual characteristics of subtropical and temperate flora. The forest community has a complete three-layer structure of trees, shrubs, and herbs, and the forest ecosystem is stable and balanced with obvious vertical zoning of plants and a forest coverage rate of approximately 98.29%. While some areas have developed tourism, most maintain a relatively complete primitive natural state, with a large area of well-preserved natural forests, allowing for natural ecological succession and normal ecological functions.
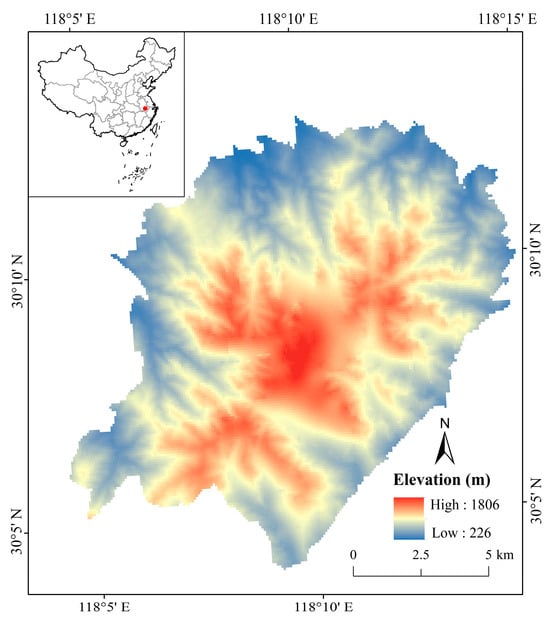
Figure 1.
Location of Huangshan Scenic Area (core area of Huangshan National Park).
Huangshan was the inaugural region worldwide to be designated a World-Class Outstanding Destination Scenic Area and was among the first to earn recognition as an Observational Area for Sustainable Tourism Development. It remains the solitary representative from the Asia-Pacific region contributing to the formulation of the Global Destination Sustainable Tourism Standard. Huangshan stands as a vital natural habitat for preserving local biodiversity and offers the public ample opportunities for leisurely sightseeing, cultural exploration, and eco-tourism experiences.
2.2. NPP Product Data
The estimation of carbon sequestration in the Huangshan National Park ecosystem was mainly based on MODIS NPP product data. The data used were the MOD17A3H global NPP data from the USGS for 2000 to 2020 (https://www.usgs.gov/, accessed on 9 May 2021). According to the orbit number segmentation law of the MOD17A3H product data and the geographical location of the study area, satellite orbit number H28V05 was selected.
Temperature and precipitation are the meteorological data provided by the National Qinghai–Tibet Plateau Scientific data center of China (https://data.tpdc.ac.cn/, accessed on 6 June 2023) [57,58], and the solar radiation intensity data were provided by the geographic remote-sensing ecological network platform (http://www.gisrs.cn, accessed on 8 June 2023). Land cover data were obtained from Earth System Science Data [59] and GlobeLand30. DEM data were obtained from the Geospatial Data Cloud at 30 m resolution for precise spatial analysis. All of these data are the raster data, and are resampled to 500 m, consistent with the resolution of NPP data, in order to calculate NEP accurately (Table 1).

Table 1.
Data and data sources.
2.3. Estimation of NEP
NEP can directly and quantitatively describe the nature and capability of carbon sources and carbon sinks in terrestrial ecosystems. NEP is calculated by subtracting the photosynthetic products consumed by heterotrophic respiration from NPP [60]. When the value of NEP is positive, the measured terrestrial ecosystem area acts as a carbon sink, otherwise, the measured terrestrial ecosystem area acts as a carbon source. NEP means the difference between NPP and soil heterotrophic respiration (Rh):
Rh was calculated using the computational model of Xie et al. [61]:
where Rs represents the annual soil respiration rate (kg C m−2 a−1), R0 represents the annual soil respiration rate (kg C m−2 a−1) at 0 °C without precipitation and carbon storage restrictions, Q is the parameter describing the relationship between the temperature coefficient and soil respiration, T and P are the annual average temperature and the annual precipitation, SOC is the organic carbon storage at surface soil (0–20 cm), and K and M represent the semi-saturation constant of the “Michaelis–Menten” equation to describe the relationship between soil respiration and annual precipitation, and the relationship between soil respiration and organic carbon storage, respectively. The monthly soil respiration rate (g C m−2 d−1) was calculated by the following equation [62,63]:
where DS represents SOC density at a soil depth of 20 cm, RDs=0 represents the Rs monthly rate when the SOC density is zero, M is a parameter, and α and β are fitted parameters. P and T are the monthly precipitation and the monthly average temperature, and P0 was added to the model to account for the capability of water retention in the soil.
2.4. GeoDetector
GeoDetector was used to determine the geospatial differences in NEP and its driving forces in this study [64,65,66]. GeoDetector can determine two-way interactions between factors by comparing the q values of each independent factor and the combined effects of both factors. It can also determine whether an interaction is enhanced or weakened, linear or nonlinear [65]. GeoDetector includes differentiation and factor detection, ecological detection, interaction detection, and risk detection methods.
Among these methods, differentiation and factor detection measure the spatial differentiation of variable Y through the q value and the explanatory power of self-variable factor X on the spatial differentiation of variable Y. The expression is as follows:
where h is the strata of variable NEP or influencing factor for this study; Nh and N are the number of cells in stratum h and the entire region, respectively; and and σ2 are the variance of NEP values in stratum h and the entire region, respectively. SSW (Within Sum of Squares) is the within-stratum variance of the entire region, and SST (Total Sum of Squares) is the total variance of the entire region. q ranges from 0 to 1, with larger values indicating that the spatial heterogeneity of NEP is more pronounced and that the independent factor has a stronger explanatory power for the dependent variable NEP.
Interaction detection was performed to identify the interactions between different influencing factors (Table 2) and assess whether the explanatory power of the dependent variable NEP is enhanced or weakened when two factors act together or whether the two factors act independently.
Table 2.
Interaction detector relationship.
Considering the characteristics and accessibility of various influencing factors, five factors (Table 3) were selected to analyse the influence of each factor on the NEP of the Huangshan National Park ecosystem. Temperature (TEM), precipitation (PRE), and solar radiation intensity (SRI) have been identified as the most important natural factors that influence the change in NEP [67,68,69,70]. Among anthropogenic factors, land cover (LC) changes can reflect the change in land use type caused by human activities on the one hand, and the change in forest cover area caused by artificial afforestation on the other hand. As a popular tourist destination, Huangshan National Park attracts millions of tourists annually. The development of tourism activities is an important function of the national park, while the scenic spot tourism POI (POI) can reflect the development of tourism as well as the carrying capacity, which in turn can characterise the impact of tourism activities on the NEP. Each factor must be discretised before using geographic detectors. The equidistant method was used to classify PRE into seven categories, the natural discontinuity method was used to classify TEM and SRI into seven categories, and the natural discontinuity method was used to classify LC and POI into nine categories. Huangshan National Park was divided into regular grid partitions based on the variable spatial resolution and point density, with a grid size of 500 m × 500 m, totalling 653 sampling points.
Table 3.
Potential factors of net ecosystem productivity.
3. Results
3.1. Spatial and Temporal Changes in Ecosystem NEP
3.1.1. Interannual Change
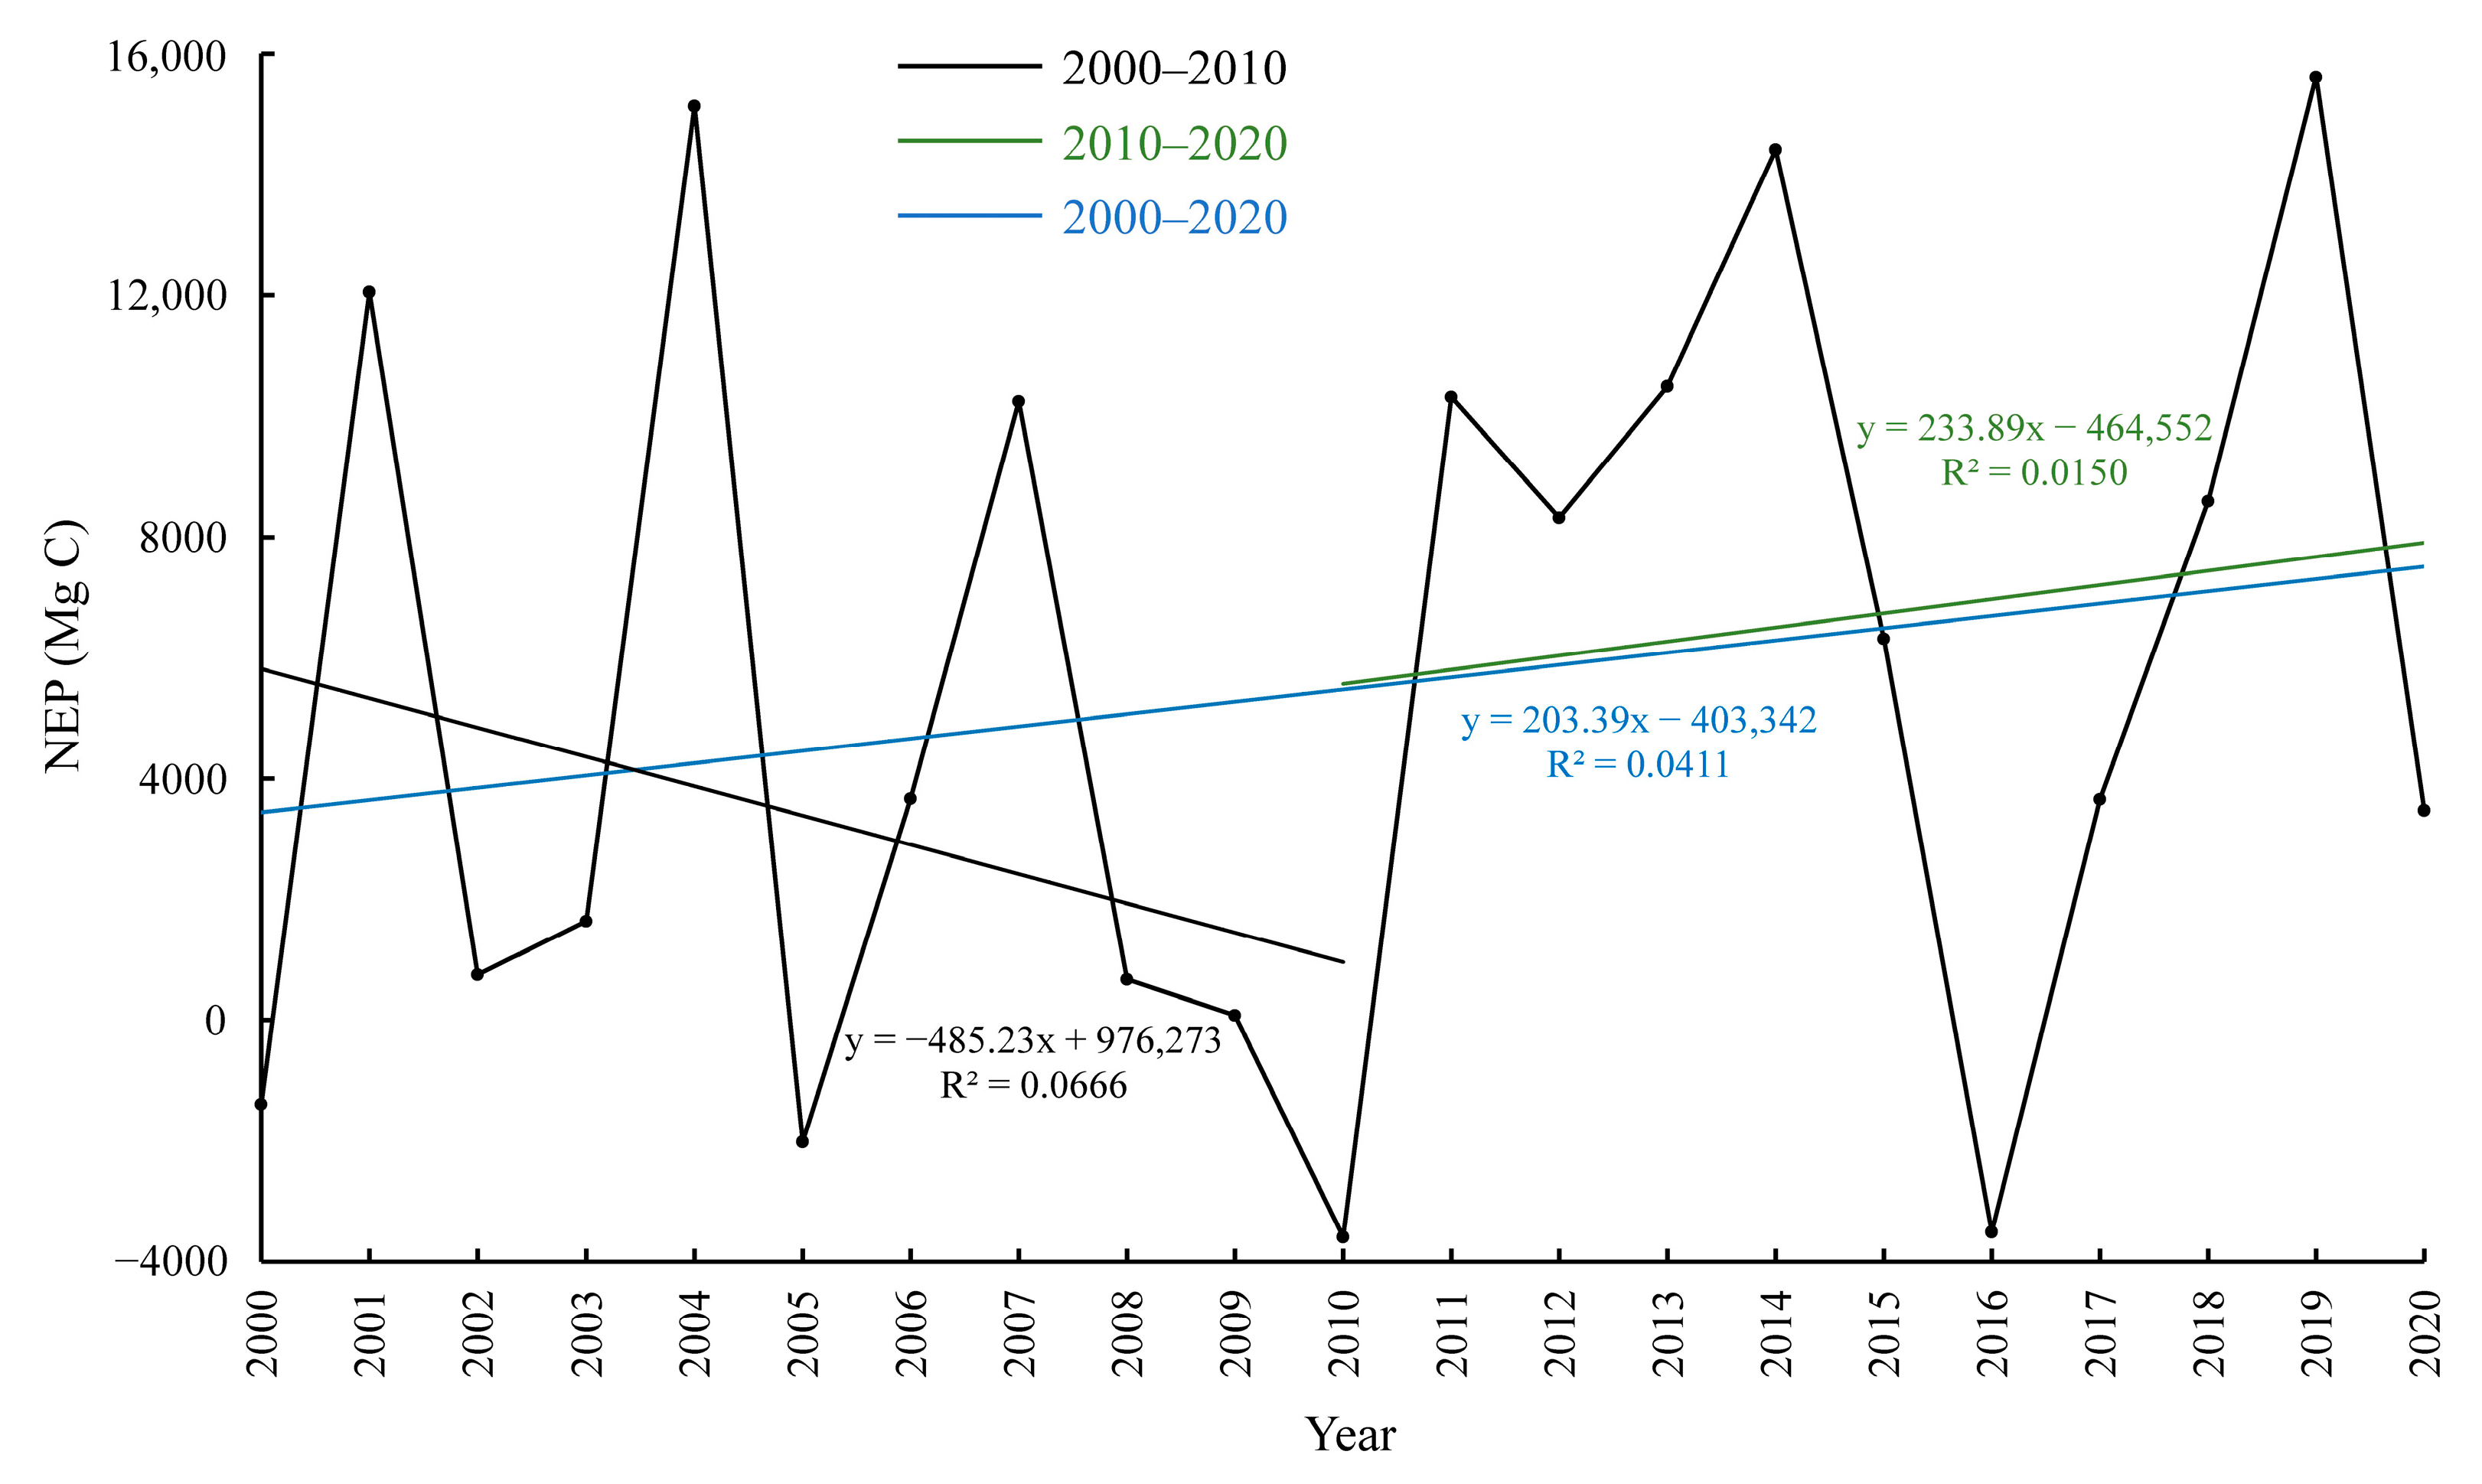
From 2000 to 2020, the total NEP of the Huangshan National Park ecosystem was 114,973 tons, with an average annual NEP of 5474.9 tons. The amount of NEP in the Huangshan National Park ecosystem fluctuated during the study period and showed periodic oscillation changes for 3–4 years (Figure 2, Table S1). This variation may be related to local climate cycles, such as the quasi-biennial oscillation of the climate and the 2- to 7-year quasiperiodic variations in the El Niño-Southern Oscillation (ENSO) [71,72]. The ecosystem showed carbon sources in 2000, 2005, 2010, and 2016 and carbon sinks in other years. The year with the highest NEP value was 2004, at 15,133 tons, while the year with the lowest NEP value was 2010, at −3586 tons, indicating net carbon emissions. Between 2000 and 2020, the NEP of the ecosystem changed from a downward trend from 2000 to 2010 (−485.23 Mg C/yr) to an upward trend from 2010 to 2020 (203.39 Mg C/yr), and it showed an overall upward trend (233.89 Mg C/yr).
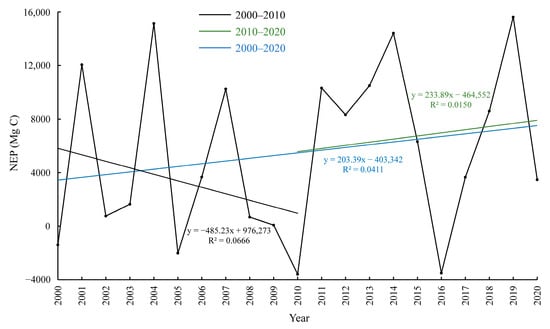
Figure 2.
Interannual variation in ecosystem NEP in Huangshan National Park.
3.1.2. Seasonal Variation
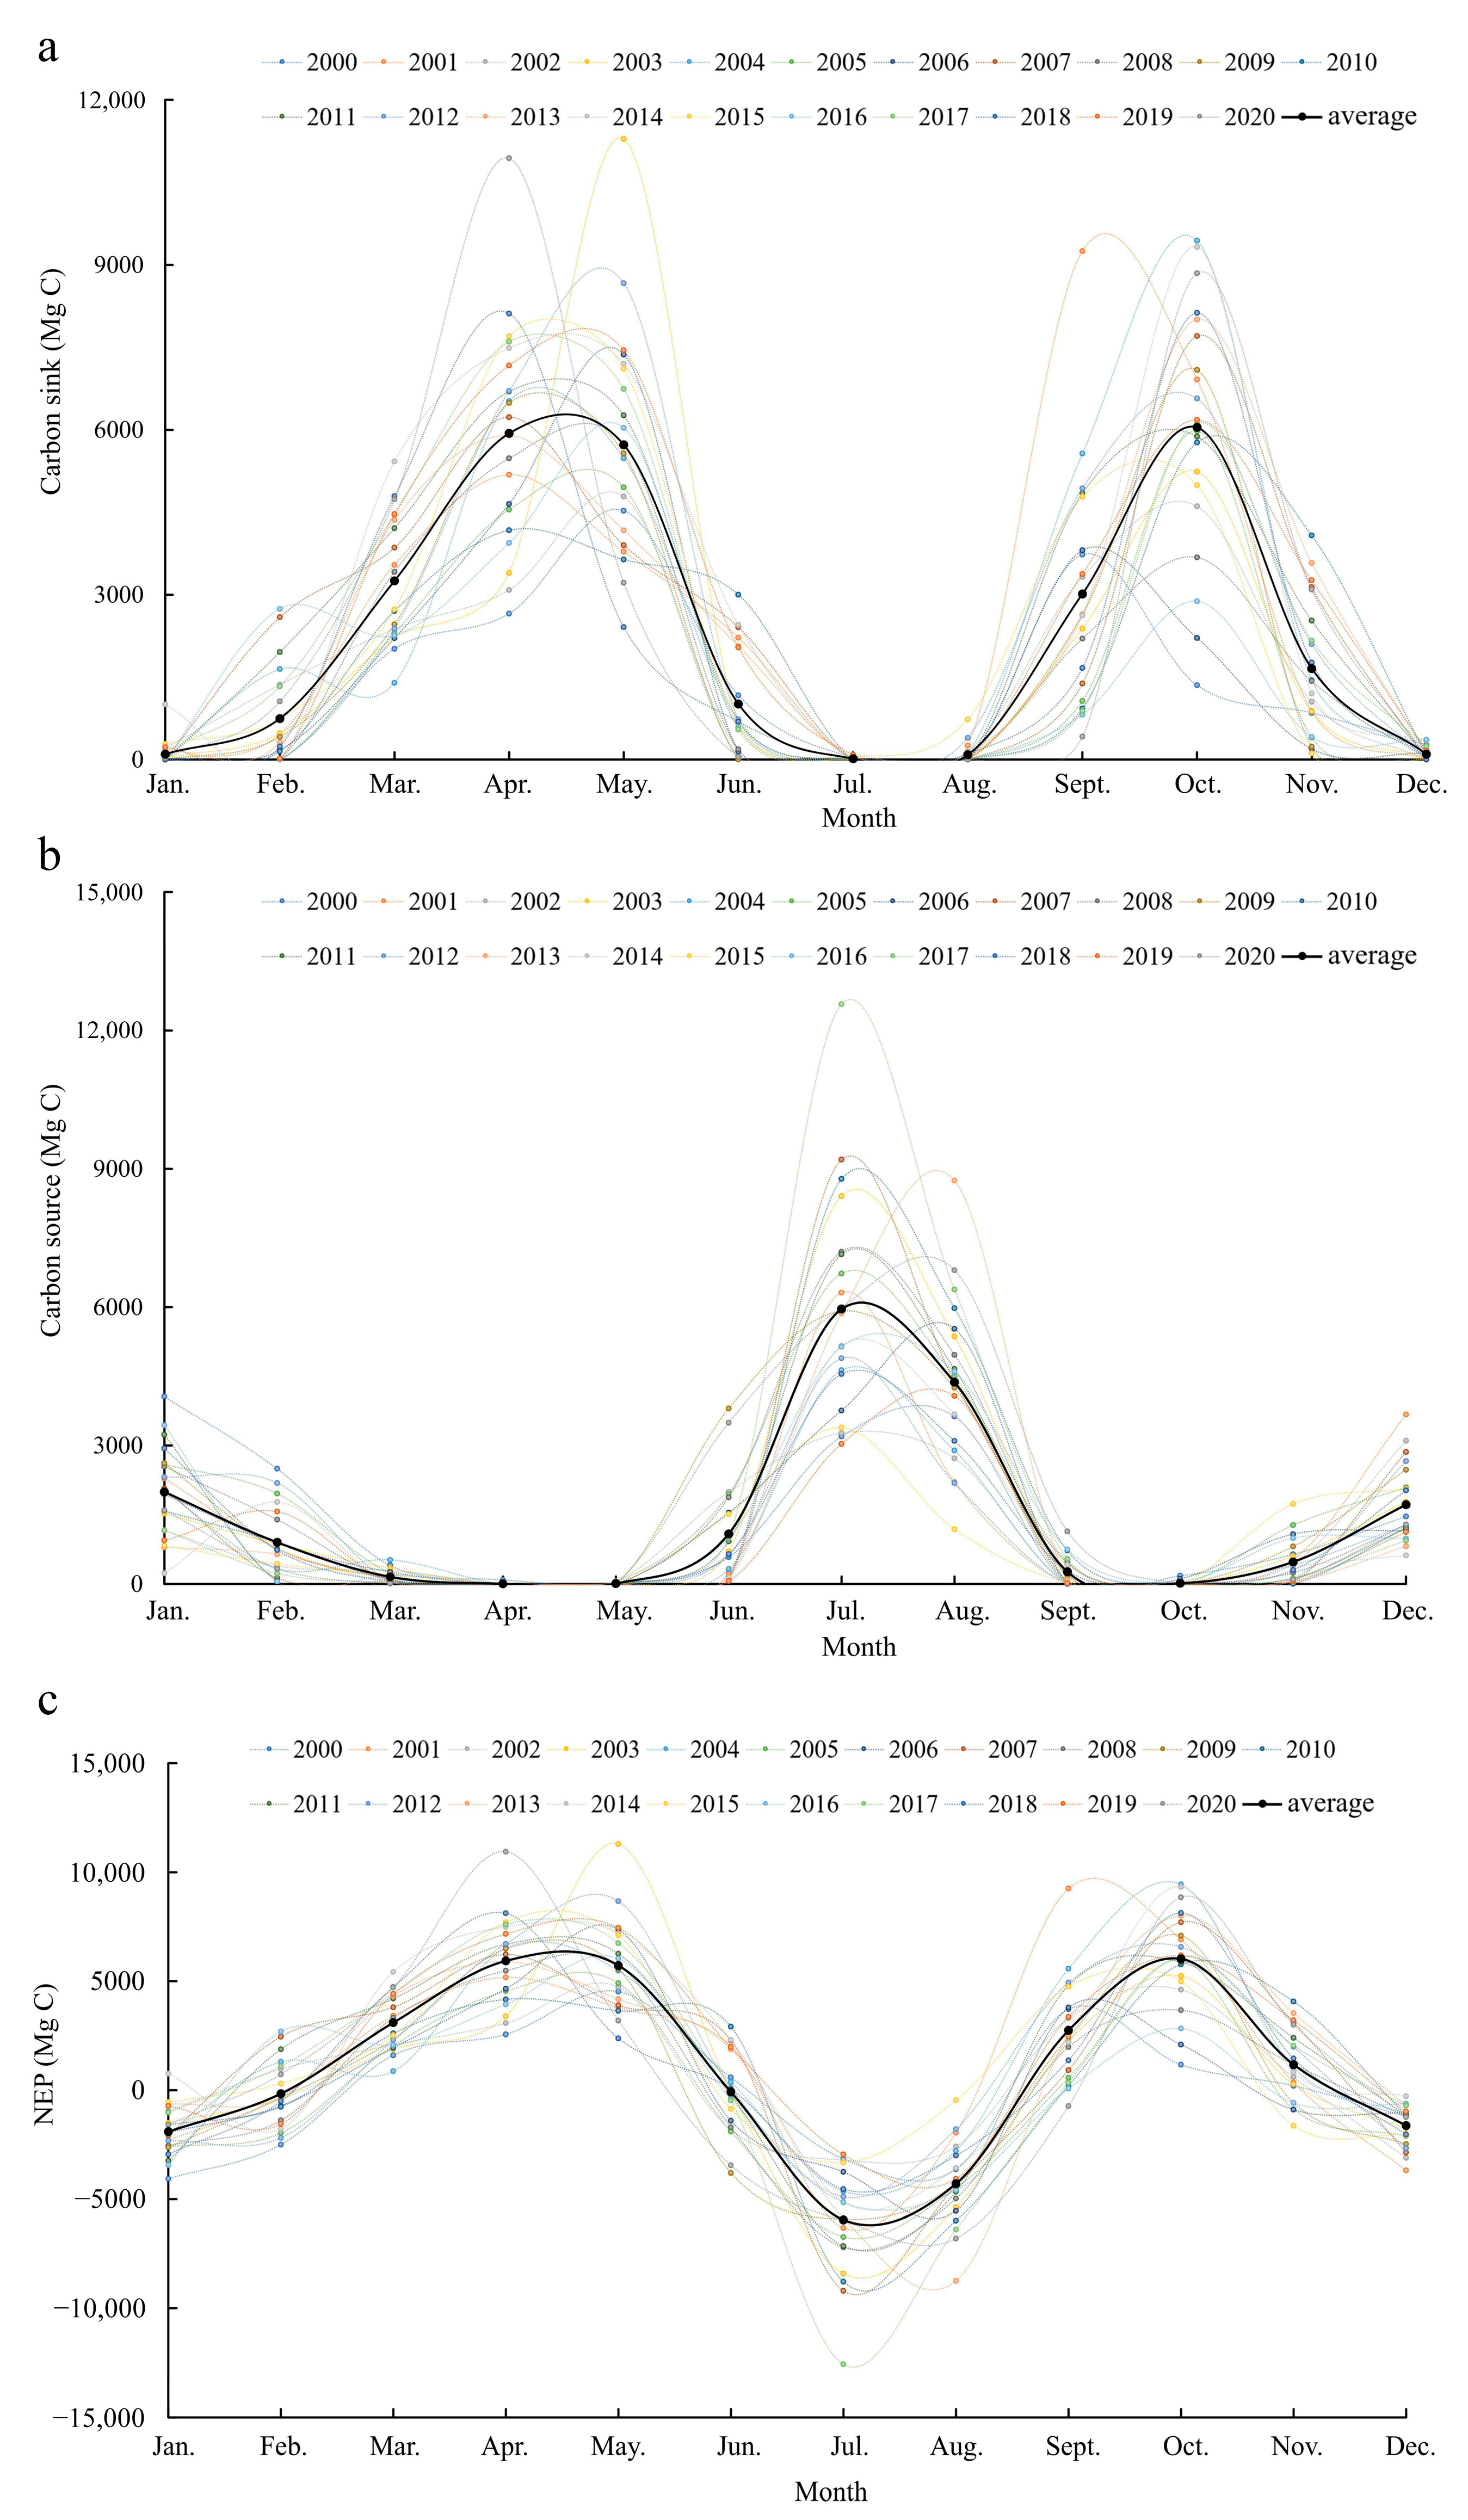
From 2000 to 2020, the Huangshan National Park ecosystem displayed significant seasonal variations in CSSs. The ecosystem exhibited carbon sink characteristics in spring and autumn, in which the carbon sink contribution rate of the ecosystem in the spring was about 98.9%, and the carbon source contribution rate was about 1.1%; the carbon sink contribution rate of the ecosystem in autumn was about 93.4%, and the carbon source contribution rate was about 6.7%. The difference in CSC between spring and autumn was not significant, with a higher carbon sink contribution rate in spring than in autumn. In contrast, the ecosystem showed a carbon source characteristic in summer and winter, in which the carbon source contribution rate in summer was about 91.1%, and the carbon sink contribution rate was about 8.9%; the carbon source contribution rate in winter was about 83.0%, and the carbon sink contribution rate was about 17% (Figure 3).

Figure 3.
Seasonal variation in Huangshan National Park from 2000 to 2020. (a) Monthly distribution of carbon sink, which was the sum of positive NEP; (b) monthly distribution of carbon source, which was the sum of negative NEP; and (c) monthly distribution of total NEP.
In years with elevated NEP, the ecosystem’s fluctuations were more pronounced, especially during spring and autumn when it acted as a carbon sink. Conversely, the troughs in winter and summer were also relatively noticeable in years that functioned as a carbon source. In general, the Huangshan National Park ecosystem’s total carbon sink distribution is significantly affected by natural elements. Factors such as the ecosystem’s temperature and precipitation patterns, the duration of the plant growth season, and the disparate capacities for carbon sequestration among various vegetation and soil types all contribute to influencing the ecosystem’s carbon sink.
3.2. Spatial Change
3.2.1. Vertical Variation
Huangshan National Park exhibits distinct vertical zonality characteristics under the restriction and influence of environmental conditions including climate, topography, vegetation, and soil-forming age. Based on field survey findings regarding soil types and vegetation distributions, the soil profile ascending Huangshan Mountain consists of yellow-red loam transitioning to mountain yellow loam, followed by mountain yellow-brown loam, and culminating in mountain meadow soil. Correspondingly, the vegetation types ascend from evergreen broadleaf forest, through mixed evergreen and deciduous broadleaf forest, to deciduous broadleaf forest, and finally to meadow, scrub, or sparse and short Huangshan pine forests. According to the distribution ranges of these soil and vegetation types, boundaries were set at 700 m, 1100 m, and 1650 m. These boundaries facilitated the reclassification of NEP raster data pixel values within the Huangshan National Park (Figure 4a).
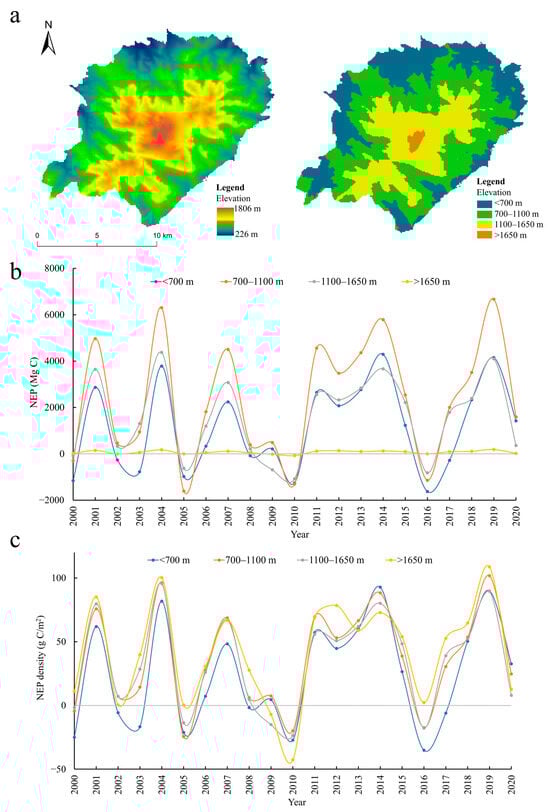
Figure 4.
NEP changes at different altitudes in Huangshan National Park from 2000 to 2020. (a) Reclassification of Huangshan National Park based on soil types and vegetation type distribution. (b) NEP changes at different altitudes in Huangshan National Park. (c) Unit area NEP at different altitudes. The grey line in (b) and (c) means NEP of zero.
Overall, all zones of Huangshan National Park showed carbon sinks during the study period (Figure 4b). Specifically, the total NEP of the area below 700 m was 23,929 tons, of which 2000, 2002, 2003, 2005, 2008, 2010, 2016, and 2017 were carbon sources and other years were carbon sinks. Although the zone below 700 m exhibited carbon sinks overall, it had the largest number of carbon source years and fluctuated greatly. The total NEP of the area at an altitude of 700–1100 m was 50,026 tons, of which 2000, 2005, 2010, and 2016 were carbon sources and other years were carbon sinks. The interannual change trend of CSS in this area was most similar to the overall CSS change trend in Huangshan National Park. The total NEP of the area at an altitude of 1100–1650 m was 33,097 tons, of which 2000, 2005, 2009, 2010, and 2016 were carbon sources and other years were carbon sinks. The total NEP of the area above 1650 m was 1549 tons, except in 2009 and 2010, both of which showed carbon sinks. Because this zone was located on the top of the mountain and had a small area, the annual change in NEP volume was small and the trend was stable, which showed the volatility of weak carbon sinks and weak carbon sources (Figure 4b, Table S2).
The CSSs of the Huangshan National Park ecosystem exhibited spatial differentiation with vertical bands. From 2000 to 2000, the unit area NEP of the ecosystem gradually increased from low-altitude to high-altitude areas, and the total unit area NEP values at <700 m, 700–1100 m, 1100–1650 m, and >1650 m were 519 g C/m2, 746 g C/m2, 723 g C/m2, and 887 g C/m2, respectively (Figure 4c).
3.2.2. Horizontal Changes
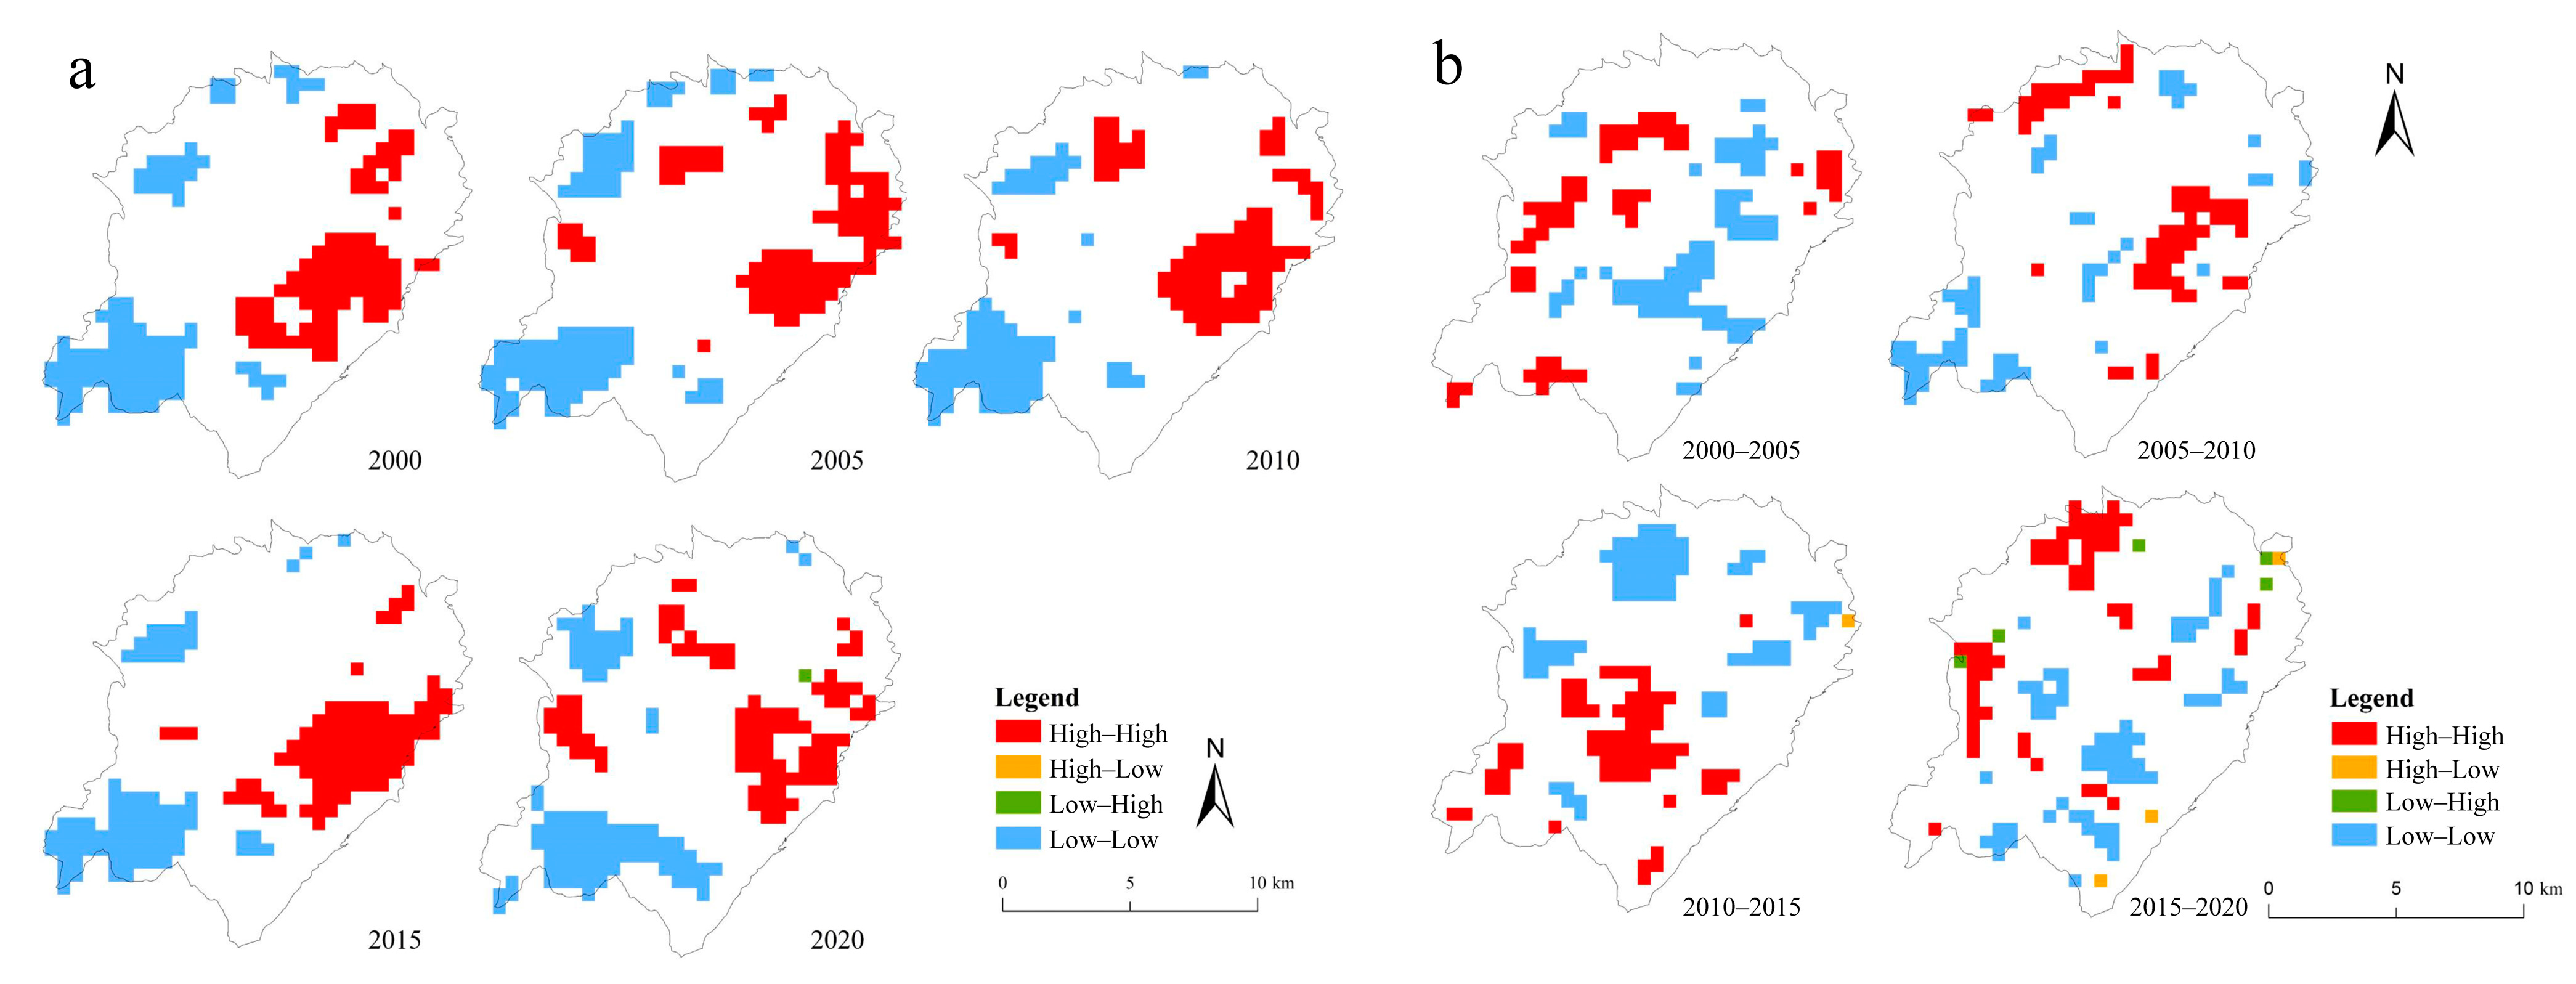
We employed the Anselin Local Moran I algorithm to examine changes in the spatial distribution of the overall NEP of the Huangshan National Park ecosystem, which identifies high–high clustering, low–low clustering, high–low clustering, and low–high clustering relationships. High–high and low–low are referred to as “hot spots” and “cold spots”, respectively. The other two clusters represent the “anomalies” of high value and low value (Figure 5). We selected 2000, 2005, 2010, 2015, and 2020 to demonstrate the spatial distribution changes and the changing trend of each period.
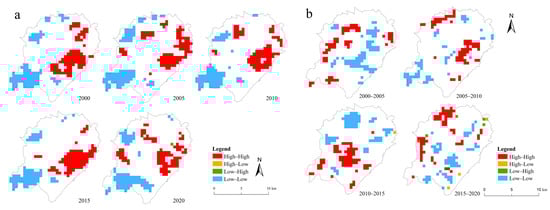
Figure 5.
Changes in the horizontal distribution of NEP. (a) Spatial distribution of NEP from 2000 to 2020. (b) Spatial trend of NEP from 2000 to 2020.
The results showed that, from 2000 to 2020, the NEP hot spots in the Huangshan National Park ecosystem were mainly distributed near the eastern area, which is characterised by deep valleys and dense vegetation with high ecosystem productivity and less anthropogenic disturbance. The cold spots were mainly distributed in the northwest and southwest areas, which feature more peaks and predominantly consist of sparsely vegetated granite landscapes. Furthermore, the cold spot area was formed because the southwestern region of Huangshan National Park was adjacent to the villages and towns under the mountains, with more anthropogenic interference such as production and living (Figure 5a). The interannual change trends of NEP during the four periods in Huangshan National Park were not distinct (Figure 5b).
3.3. Factor Detection
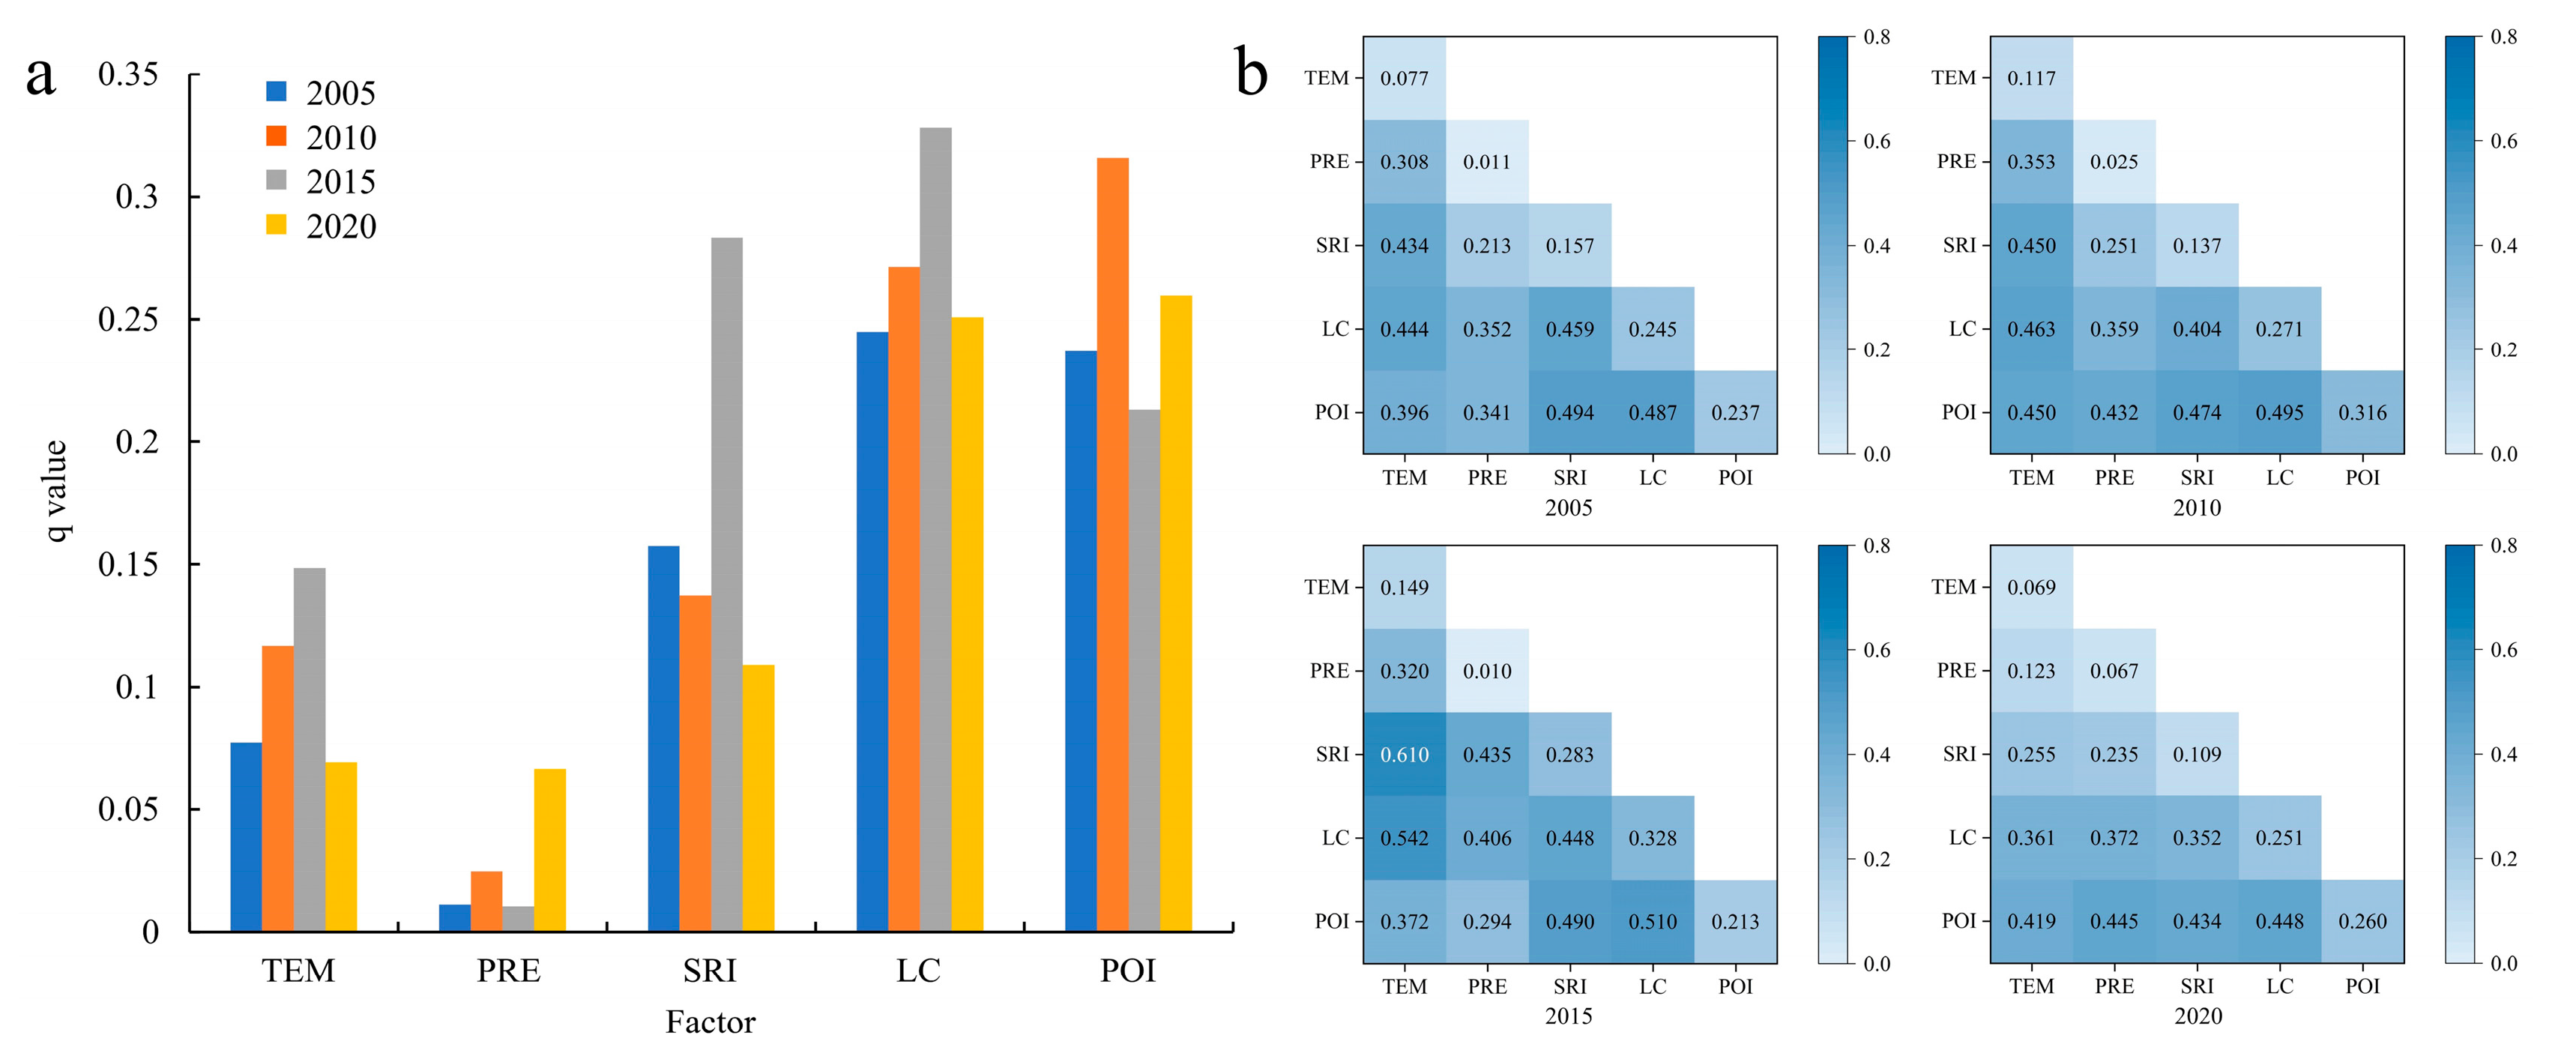
The GeoDetector method was applied to determine the individual effects of influencing factors on the changes in CSS in the Huangshan National Park ecosystem. Figure 6a shows the factor detection results for 2005, 2010, 2015, and 2020.
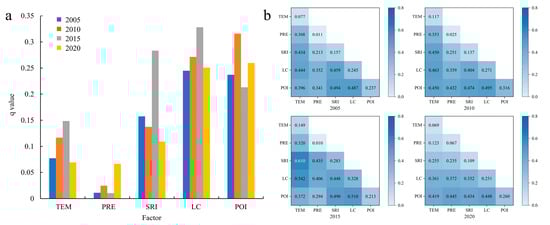
Figure 6.
Individual and interactive effects of driving factors on NEP change. (a) Results of factor detection. (b) Results of interactive detection.
As shown in Figure 6a, the first two influencing factors with higher q values in 2005 were LC (0.245) and POI (0.237), and both passed the hypothesis test at the 1% significance level. SRI (0.157), TEM (0.077), and PRE (0.011) were sequentially followed, with SRI passing the hypothesis test at the 1% significance level and TEM passing the test at the 5% significance level. LC, POI, and SRI at this stage had a greater impact on changes in CSS in the Huangshan National Park ecosystem, with LC being the most influential factor.
The first two influencing factors with higher q values in 2010 were POI (0.316) and LC (0.271); SRI (0.137), TEM (0.117), and PRE (0.025) followed sequentially. All factors except PRE passed the hypothesis test at the 1% level. POI and LC showed a stronger effect on changes in CSSs in the Huangshan National Park ecosystem. At this stage, the POI increased significantly and became the most influential factor, reflecting that the increase in tourism facilities has greatly affected CSSs in the ecosystem.
The first two influencing factors with higher q values in 2015 were LC (0.328) and SRI (0.283); POI (0.213), TEM (0.149), and PRE (0.010) followed sequentially. Except for PRE, all of the factors passed the hypothesis test at the 1% level. LC, SRI, and POI had strong explanatory power. At this stage, LC has become the most influential factor affecting CSS in the Huangshan National Park ecosystem. The influence of SRI increased, and this was the factor with the greatest impact on ecosystem CSSs among natural factors.
The first two influencing factors with higher q values in 2020 are POI (0.260) and LC (0.251), followed by SRI (0.109), TEM (0.069), and PRE (0.067) in sequence. LC, POI, and SRI passed the hypothesis test at the 1% significance level, while PRE passed the test at the 5% significance level. At this stage, POI, LC, and SRI had a stronger effect on CSS changes in the Huangshan National Park ecosystem. In contrast to the previous three stages, the impact of PRE on the changes in CSSs in the ecosystem of Huangshan National Park in this stage was more significant, while the influence of TEM was relatively reduced.
In general, land use and tourism activities, which correlated with LC and POI separately, always had a stronger impact on the CSS of the ecosystem, whereas cloud cover, which was related to the SRI, had a greater impact among natural factors.
3.4. Interaction Factor Detection
Interactive detection can reflect the difference in the influence of CSS changes in the ecosystem of Huangshan National Park when the factors interact with each other, compared to the impact of a single factor. Figure 6b shows the interactive detection results for 2005, 2010, 2015, and 2020.
The interaction detection results for 2005 showed that all factor combinations exhibited a nonlinear enhancement effect, indicating that the change in CSS in the ecosystem was a complex process involving multiple factor interactions. Among all of the interactions, the strengths of SRI and POI (0.494), LC and POI (0.487), and SRI and LC (0.459) were the highest. This indicated that the changes in CSS in the ecosystem at this stage were mainly driven by the combined influence of SRI, POI, and LC.
In 2010, the interaction detection results showed an enhancement in nonlinearity. Among all interactions, the strengths of LC and POI (0.495), SRI and POI (0.474), and TEM and LC (0.462) were the highest. This suggests that variations in the CSS of the ecosystem at this stage were mainly driven by the combined influence of SRI, POI, and LC, with TEM promoting changes to a relatively large extent.
The interaction detection results for 2015 showed an enhancement of nonlinearity, and among all of the interactions, the strength of TEM and SRI (0.610), TEM and LC (0.542), and LC and POI (0.510) were the highest, indicating that the variations in CSSs of the ecosystem at this stage were mainly driven by the combined influence of TEM, LC, and POI.
The interaction detection results of TEM and PRE for 2020 showed a double-factor enhancement, indicating that the explanatory power of the interaction of influencing factors was greater than the explanatory power of each single factor. The other interactions also showed a nonlinearity enhancement. The strength of POI and LC (0.448), POI and PRE (0.445), and POI and SRI (0.434) were the highest, indicating that the variations in CSSs in the ecosystem at this stage were driven mainly by the combined influence of POI, LC, PRE, and SRI. Meanwhile, POI had a strong interaction with all factors except TEM. It can be concluded that tourism activities at this stage had a strong influence.
4. Discussion
4.1. Effect of Natural Factors on NEP Changes
Soil heterotrophic respiration is a major contributor to soil carbon loss and is highly sensitive to temperature changes over a short period of time. Soil organic carbon in forests responds differently to temperature in different climates [73]. In subtropical areas, the sensitivity of total soil respiration to temperature increases with altitude [74,75]. Additionally, soil temperature is the most critical controlling factor; as a result, soil respiration decreases with increasing altitude [76]. Climate warming accelerates soil microbial metabolism, causing soil carbon to be converted back into CO2 in the atmosphere [77,78,79], which leads to a positive feedback loop between the carbon cycle and climate change [77,80]. Temperature has a considerable influence on ecosystem productivity. Low and high temperatures are detrimental to vegetative growth. Soil organic carbon (SOC) is an essential variable for calculating soil respiration rates. Climate warming extends the growth period, leading to an increase in NPP and the promotion of SOC input. However, a rise in temperature may also accelerate the decomposition of SOC, resulting in a decline in the soil carbon sequestration [81].
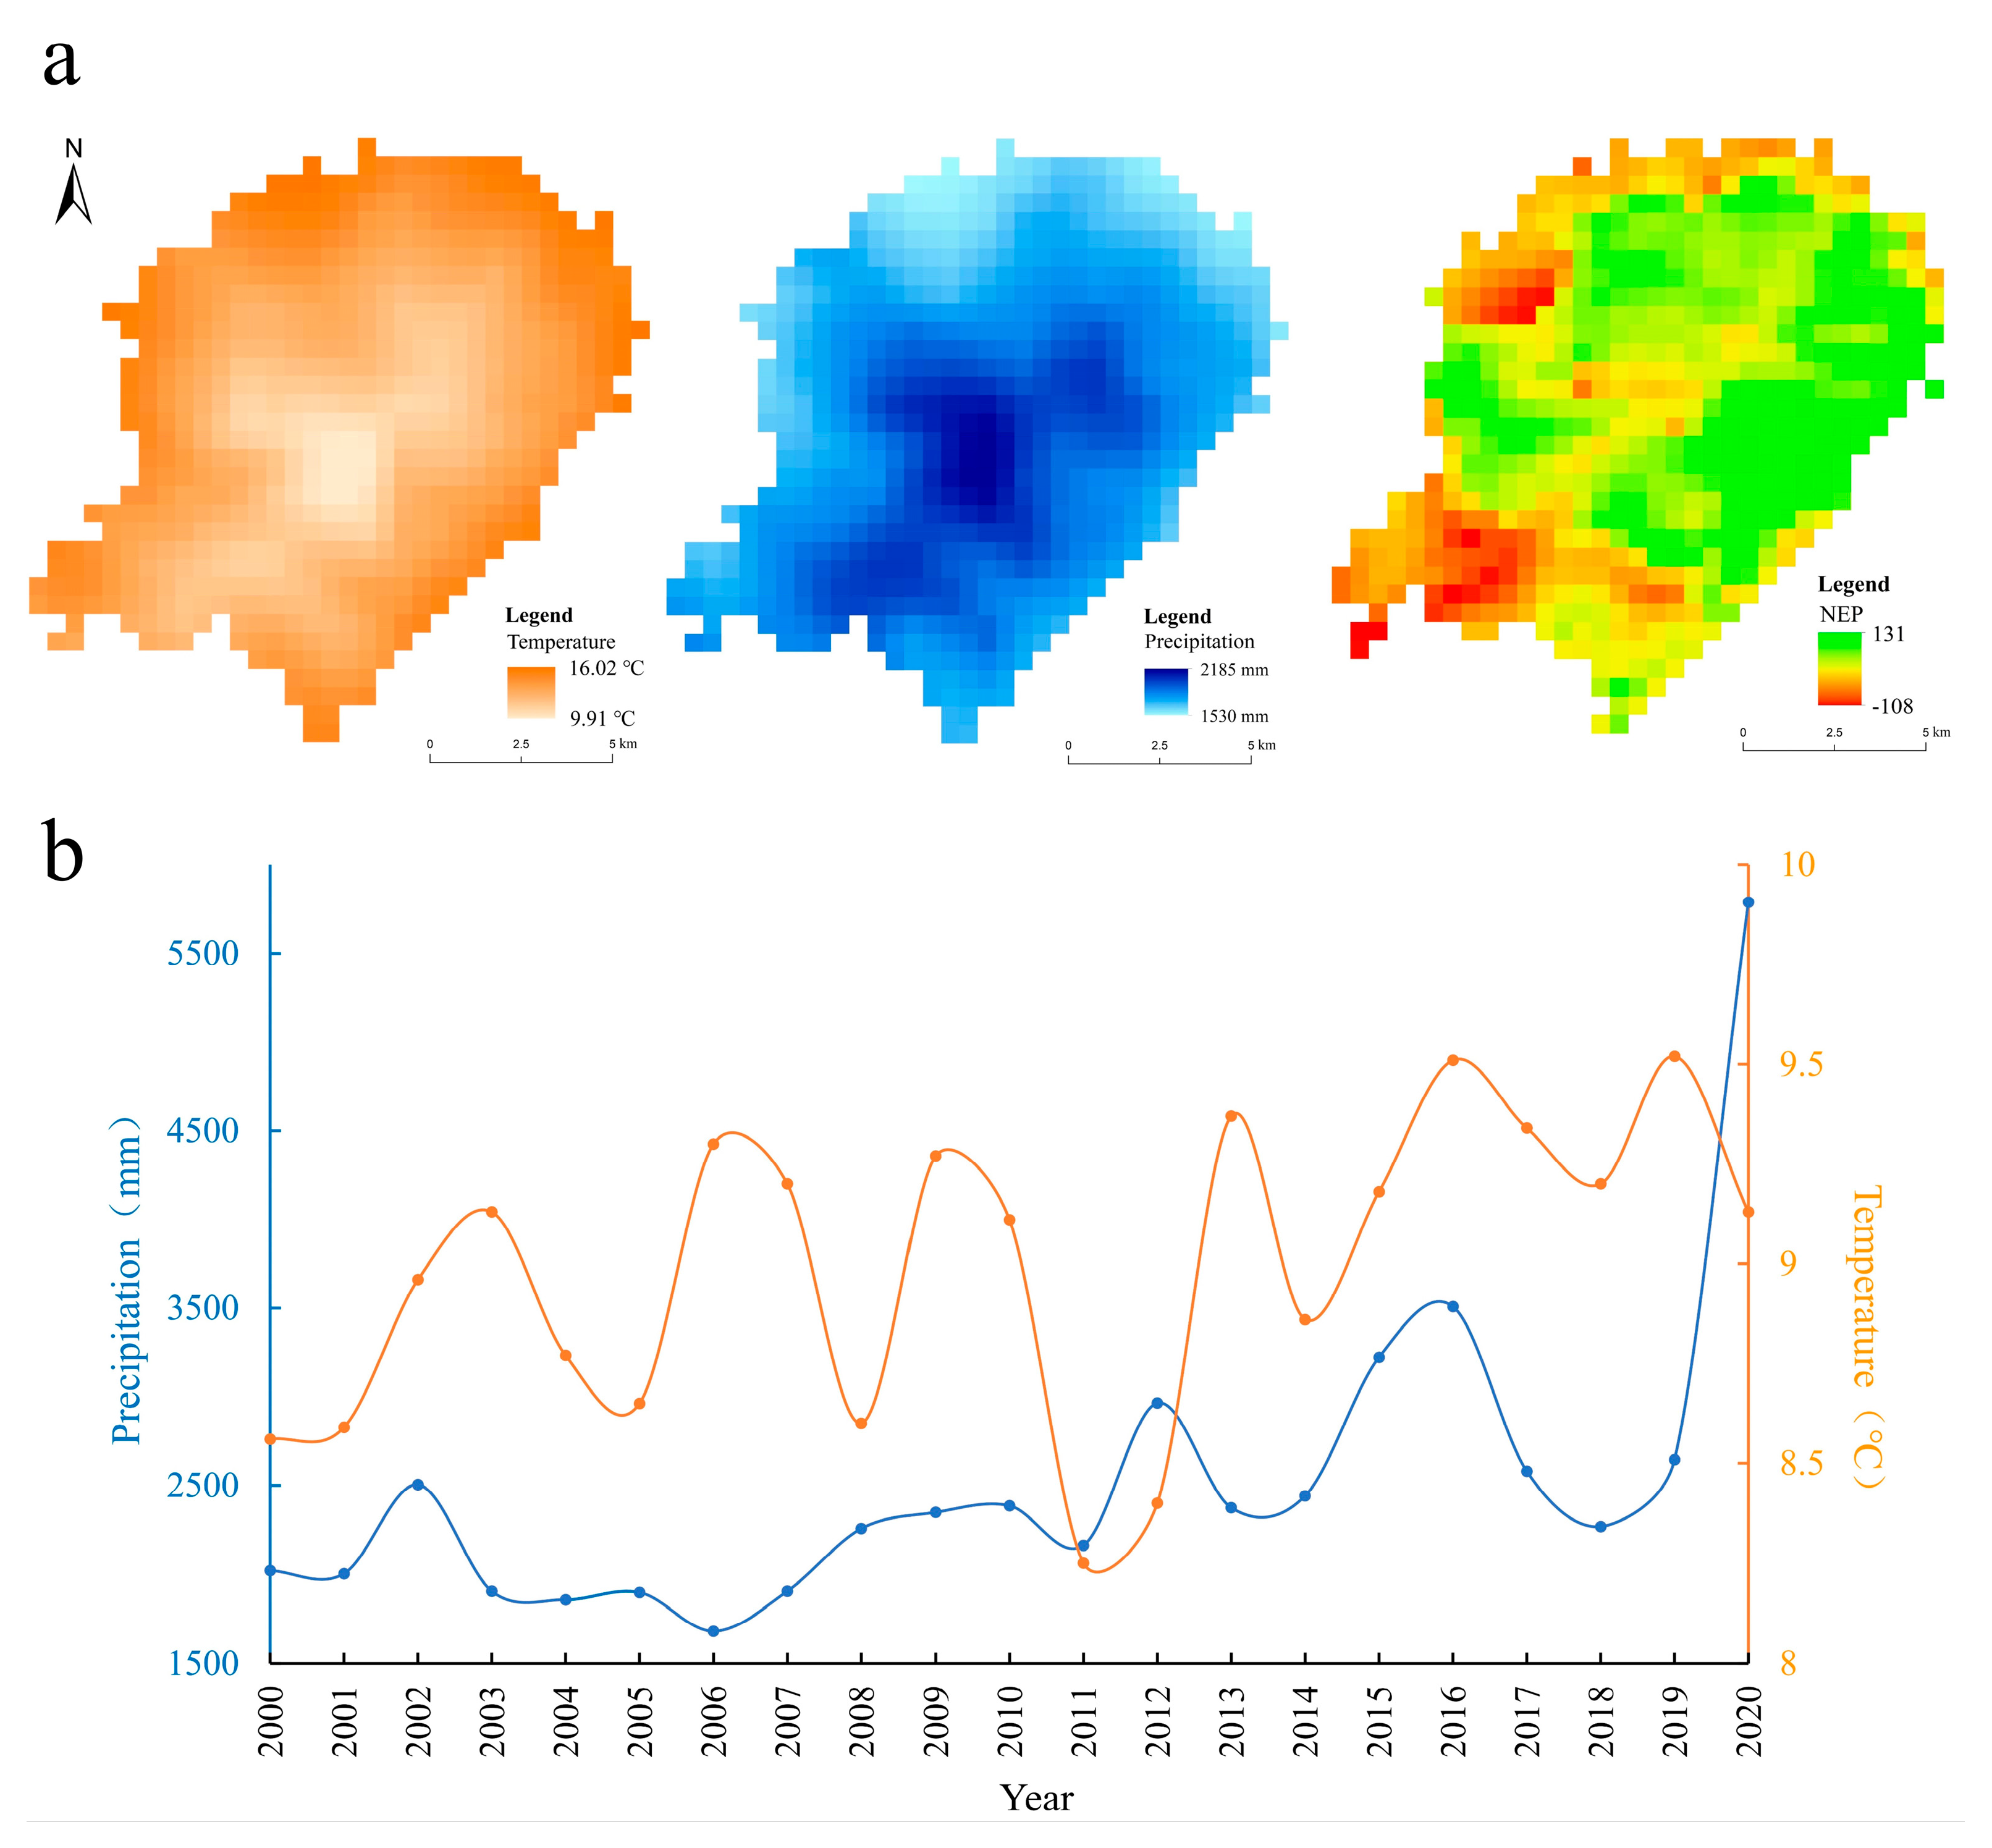
Figure 7a shows a comparison between the average NEP value of the ecosystem in Huangshan National Park and the average annual temperature during the study period. Higher and lower temperatures may have decreased the NEP value of the ecosystem, indicating that temperature had a greater impact on the productivity and respiration of vegetation in the ecosystem. Carbon sequestration in the ecosystem can improve only within a suitable temperature range.

Figure 7.
Comparison of temperature, precipitation, and NEP. (a) Average annual temperature, annual precipitation, and NEP of Huangshan National Park from 2000 to 2020. (b) Changes in precipitation and temperature in Huangshan National Park from 2000 to 2020.
The plant biomass scale, microbial activities, and community distribution of terrestrial ecosystems are remarkably influenced by water conditions, which can alter the photosynthesis, autotrophic respiration, and soil microbial respiration of vegetation. The instability of precipitation characteristics, such as precipitation volumes, precipitation frequency, drought frequency, and extreme precipitation, can prolong the soil water deficit cycle and increase soil water variability. This can impact the growth rate and productivity of plants. Soil water content affects the respiration of microorganisms and the temperature sensitivity coefficient of soil respiration. Previous studies have shown that aboveground NEP and annual average precipitation exhibit a trend of initial escalation, followed by a subsequent decline. When the mean annual precipitation is roughly 2500–3000 mm/yr, the NEP is relatively saturated and then shows a downward trend [82]. This indicates that excessive rainfall can also inhibit forest productivity. The average precipitation distribution in Huangshan National Park from 2000 to 2020 was consistent with this conclusion (Figure 7).
Comparing the annual mean temperature and precipitation trends in Huangshan National Park from 2000 to 2020 (Figure 7), it is apparent that 2002, 2012, 2016, and 2020 were the years with above-average annual precipitation. This increase in precipitation led to elevated respiration rates, causing vegetation to emit more carbon dioxide, consequently resulting in diminished carbon sequestration levels during these years. Particularly, Huangshan City faced severe flooding in July 2020 due to unprecedented heavy rains, with annual precipitation reaching 5787 mm, far exceeding levels in other years. Nevertheless, the NEP of Huangshan National Park in 2020 did not reach its lowest point. It is hypothesized that while excessive precipitation could potentially decrease NEP, respiration rates are also influenced by temperature to some degree. Higher temperature also results in increased respiration. In 2020, although precipitation was significantly higher than usual, temperature was slightly below average. Consequently, the combined impact of precipitation and temperature on NEP did not result in the lowest NEP value for Huangshan National Park. Similarly, in 2012, despite higher precipitation, lower temperatures mitigated the decrease in NEP, resulting in a value close to zero, as the carbon dioxide released through respiration did not substantially outweigh the carbon sequestration in Huangshan National Park.
Light is essential for photosynthesis in green plants. The intensity of sunlight directly affects the photosynthesis intensity. The intensity of sunlight often changes according to geographical location, terrain height, season, cloud cover, and rainfall; it weakens with an increase in latitude and increases with an increase in altitude. The sea of clouds is an important mountain landscape and is one of the famous “four unique features” of Huangshan Mountain. The sea of clouds refers to clouds formed under certain weather conditions, where the height of the cloud top is lower than that of the top of the mountain. The flowing clouds that people can overlook on the mountain are shaped like waves; hence, they are called a “sea of clouds”. Their formation needs to meet the two necessary conditions of “high mountain” and “sufficient water vapor”. The sea of clouds in Huangshan is a low-cloud sea with relatively high altitudes. It is formed by low clouds and ground fog with a bottom height of less than 2500 m. The condensation height of the low clouds is as low as 800–1000 m. Huangshan Mountain is characterised by deep valleys and high peaks, with peaks in the core rising above 1000 m. Trees and short sunshine durations make it difficult for water to evaporate, resulting in high humidity and water vapour in the air. Furthermore, this area is characterised by a subtropical monsoon climate, with an annual average precipitation of 2393 mm and sufficient water vapour. The sea of clouds and perennial fog affect the sunshine duration in Huangshan, especially in the area at approximately 1000 m. The decrease in sunshine duration weakened the solar radiation intensity, which, in turn, affected the change of NEP. The results indicate that the changes in the CSS in Huangshan National Park show a trend of increasing from low-altitude areas to high-altitude areas, but the unit area NEP in the area at 1100–1650 m was slightly lower, which may have been affected by the low cloud sea and fog in this area. As altitude increased, sunshine duration and NEP increased. In addition, the sea of clouds in Huangshan always appears in winter, which may also partly explain the low NEP value in Huangshan National Park in winter.
The sea of clouds is an important tourism resource of Huangshan. From the perspective of enjoying the scenery, the best scenery of Huangshan is in the peak zone, and it is best when clouds and fog are present. However, from the perspective of increasing carbon sinks, excessive water vapour and cloudy weather can be unfavourable factors. From the perspective of observation, the changeable climate and complex terrain create Huangshan’s unique natural scenery, but at the same time, it brings severe challenges to meteorological monitoring. It is important to note here that the bedrock of Huangshan Mountain is granite, and the weathering process of granite is also capable of absorbing carbon dioxide. It is therefore necessary to acknowledge that there may be a degree of inaccuracy in the calculations used to determine the overall CSS of Huangshan National Park. Furthermore, the vegetation of Huangshan Mountain is dense, and the trees in some high mountains and deep valleys are intertwined, which may result in an underestimate of carbon sequestration amount calculated using remote sensing data. This represents a potential limitation of the study. In future studies, we intend to adopt a more refined research methodology, combined with more fieldwork, in order to provide more accurate results of the distribution of carbon sources and sinks within the ecosystems of natural tourism destinations.
4.2. Effect of Human Activity Factors on NEP Changes
It is evident that human-induced disturbances can lead to alterations in land use, directly impacting the productivity and spatial distribution patterns of terrestrial ecosystems. The primary anthropogenic disturbances include deforestation, forest management practices, the conversion of agricultural land from grasslands and wetlands, ploughing, and grazing [83]. Artificial afforestation and tourism activities stand out as critical examples of land use transformation. Plantations play a vital role in conserving global biodiversity, with the biodiversity found in planted forests—particularly mixed forests—being comparable to that of their natural counterparts. Over recent decades, large-scale reforestation and afforestation efforts have taken place globally. The establishment of diverse planted forests for various objectives has made significant contributions to biodiversity conservation, ecological restoration, landscape rehabilitation, ensuring timber supplies, and enhancing the environment [84]. The Chinese government has long emphasized the importance of forestry development. Since the 1950s, it has gradually begun the artificial regeneration of natural forest logging sites. From the early years of the 21st century, there was a shift from a primary emphasis on timber production to a primary focus on ecological construction.
The lower elevations of Huangshan, specifically those around 500 m, are largely composed of artificial secondary forests. Despite indications of human intervention, the planting of these forests plays a role in sequestering atmospheric carbon, particularly during the initial 20 years of their growth. Research indicates that younger forests absorb more carbon dioxide during their growth phase, and as the trees reach an age range of 21 to 22 years, they may release more carbon dioxide, potentially reducing their role as carbon sinks or even transforming into sources of carbon [85].
Tourism furnishes visitors with amenities for dining, lodging, transportation, shopping, and recreation, along with associated products and services. The expansion of tourism often leads to modifications in the local land use pattern, especially during developmental phases, which can affect the local ecological environment. The development of tourism in the Huangshan National Park commenced at an early time. The advancement of tourism has resulted in the generation of carbon emissions, both directly and indirectly. Additionally, it has altered the land use structure and led to notable impact on ecosystem carbon sinks. In the early stages of tourism growth, large-scale tourism projects lead to altered land use patterns, drawing in an increasing visitor amount. During this period, tourism activities tend to intensify the ecosystem’s carbon source. As tourism continues to develop, the management and development of the National Park becomes more sophisticated. This progression is expected to lessen the changes in land use while boosting investments in ecosystem conservation and restoration. Simultaneously, there will be an increase in tourists’ awareness of low-carbon practices, leading to a decrease in carbon sources attributable to land alterations and an enhancement of the carbon sink capacity.
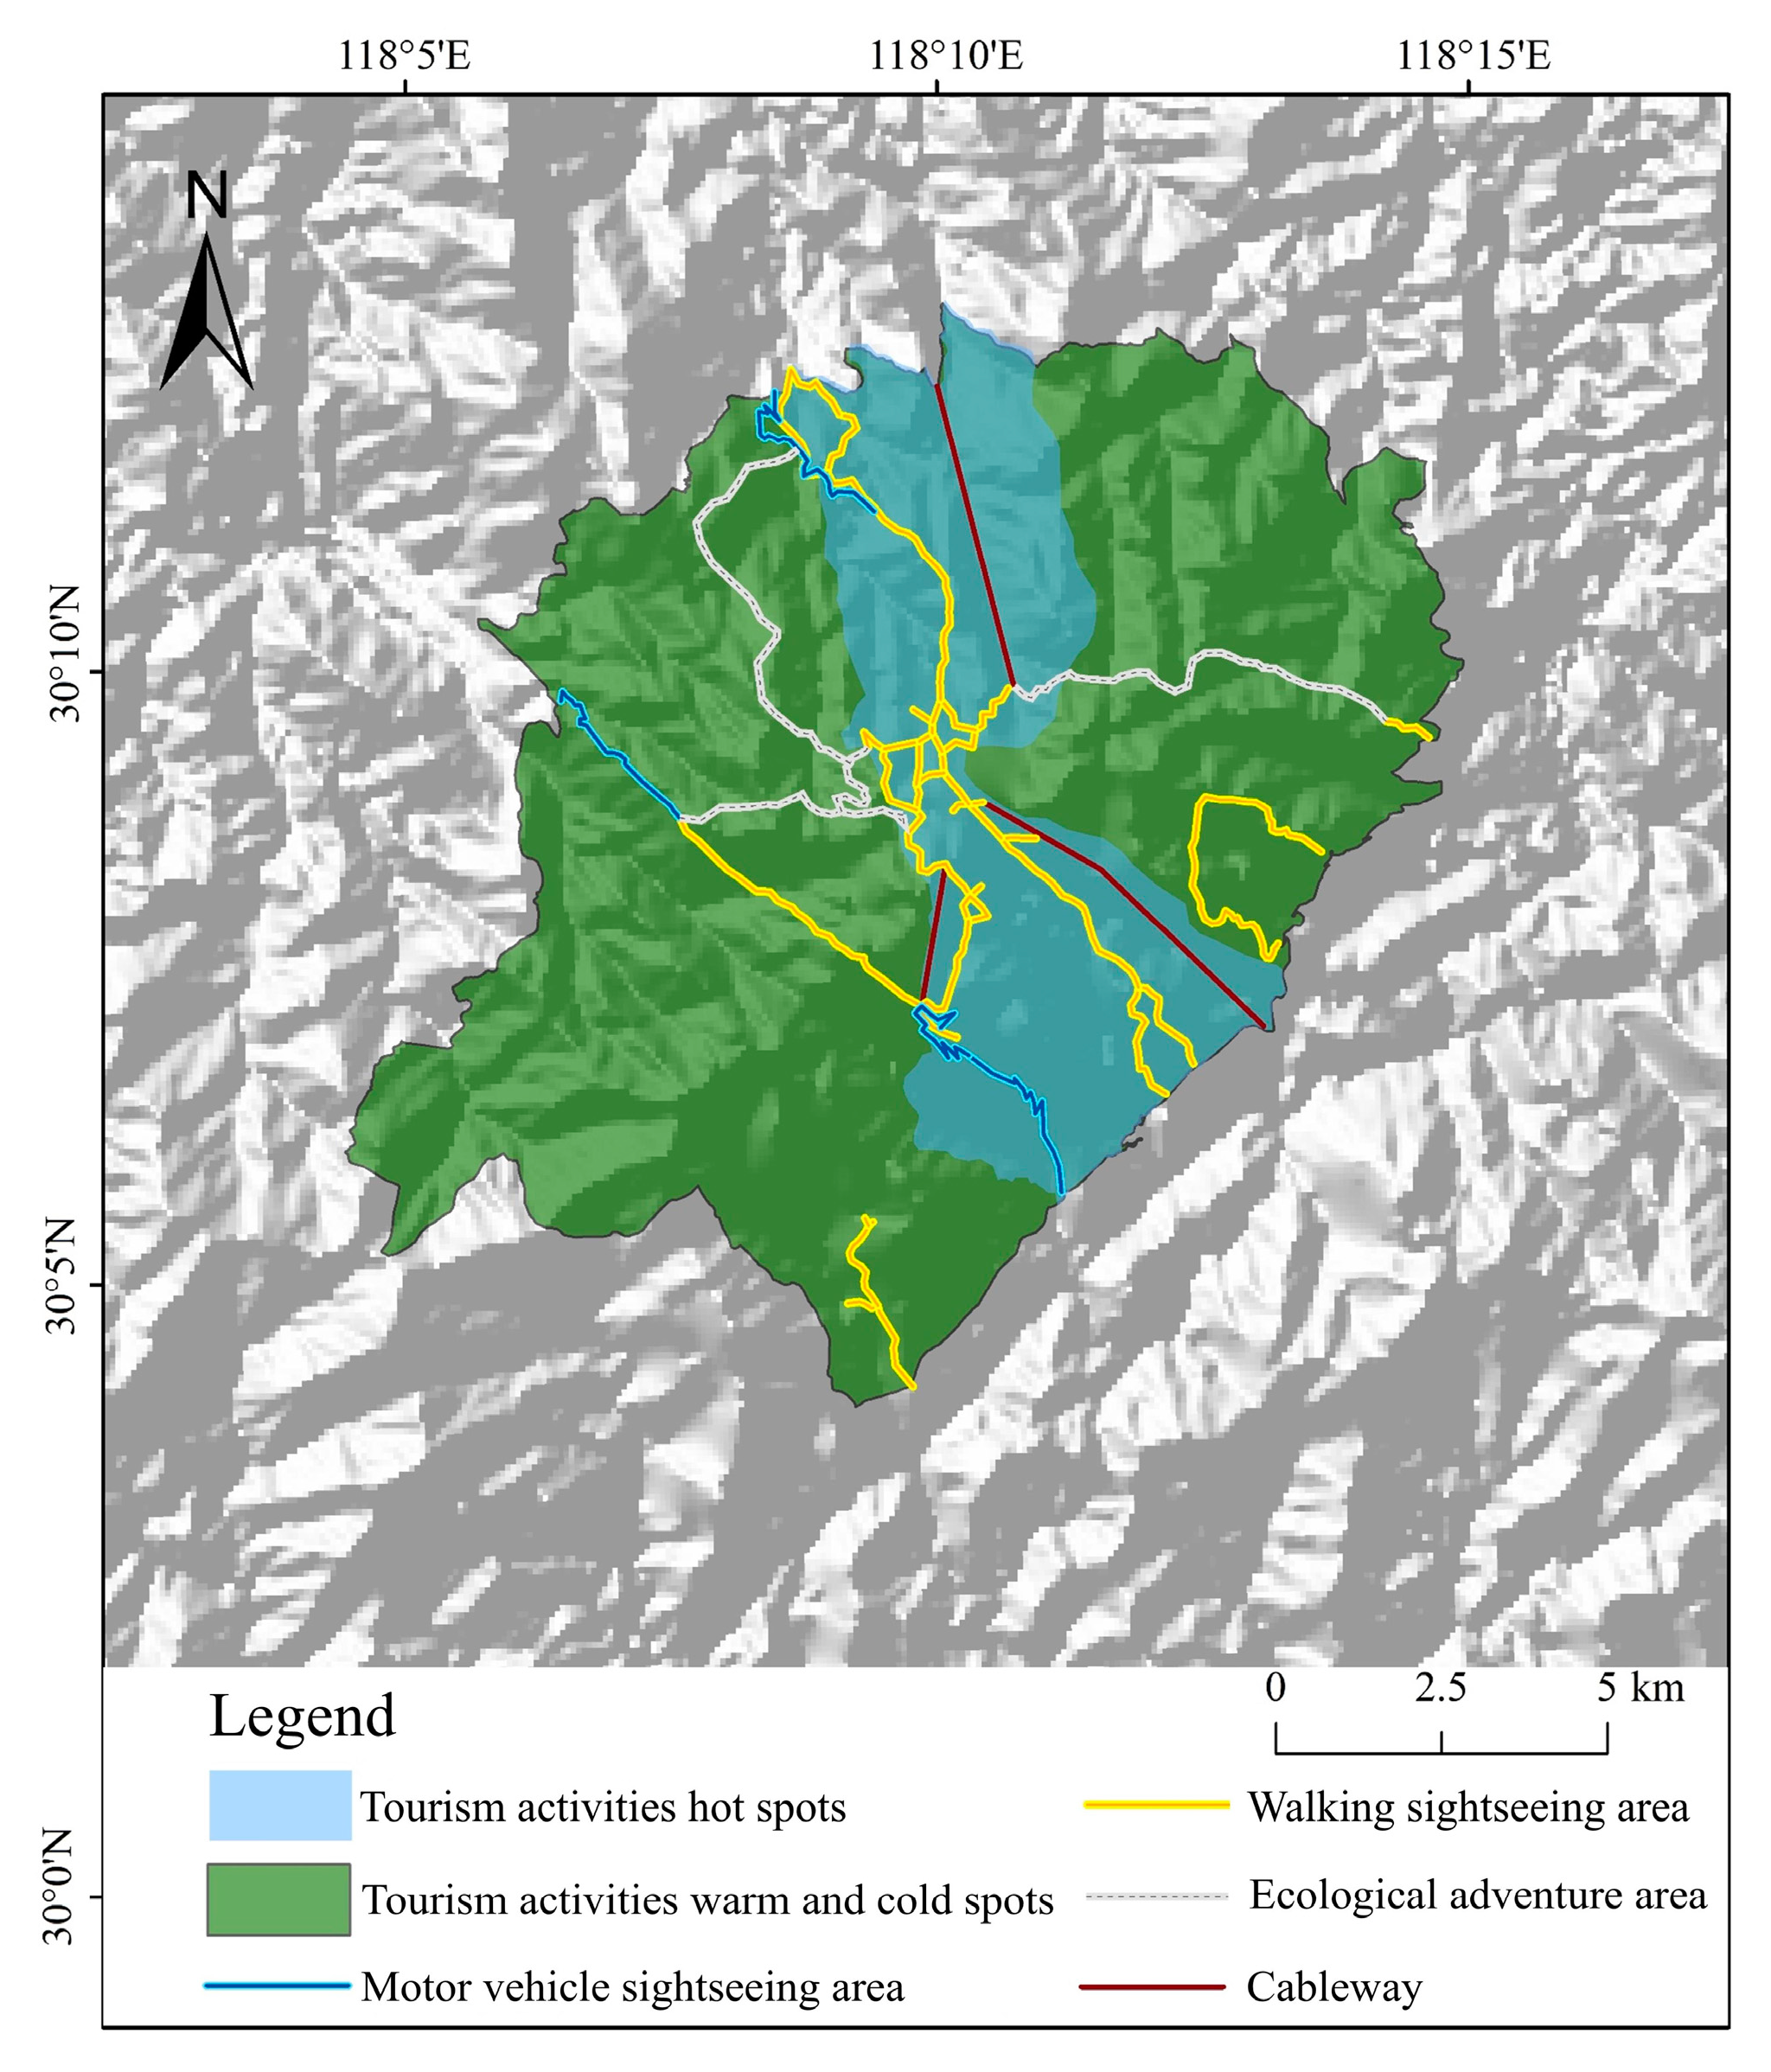
Functional zoning within Huangshan National Park is closely linked to the scale of tourism activities in the region (Figure 8). As a renowned mountainous tourist destination, the Huangshan National Park attracts visitors primarily for its mountain climbing and mountain scenery. Consequently, the majority of tourism-related activities are focused in the higher-elevation zones. With the development of the tourism industry, there has been a growing recognition of the importance of low-carbon tourism, alongside the enforcement of effective management strategies within the National Park. These have contributed to the effective protection of tourist buildings and tourist service facilities, as well as the adjacent areas. Additionally, the relatively fast renewal rate of trees in the area has helped preserve the ecosystem’s stability, preventing any significant increase in the intensity of the ecosystem’s carbon source.

Figure 8.
Huangshan National Park functional area.
4.3. Interaction of Various Factors on NEP Changes
The results indicated that NEP exhibited a nonlinear response (nonlinearity enhancement and two-factor enhancement) to the interaction of various driving factors (Figure 6). While the factor interaction that caused changes in the CSSs in the ecosystem varied from year to year, the interaction between both LC and POI and other factors consistently had a high statistical q value, indicating that land use changes and tourism activities have had a significant influence on changes in the CSSs of the ecosystem.
Tourism activities inevitably lead to changes in land use, including increases in artificial land and greening. These changes have two-way effects; therefore, tourism activities and land use changes are inseparable from the impacts of CSS in the ecosystem. Similarly, among natural factors, temperature and precipitation generally worked together as CSS in the ecosystem. When the impact of temperature was significant, the significance of the precipitation impact was reduced.
4.4. Impact Mechanism of Tourism on Ecosystem CSS
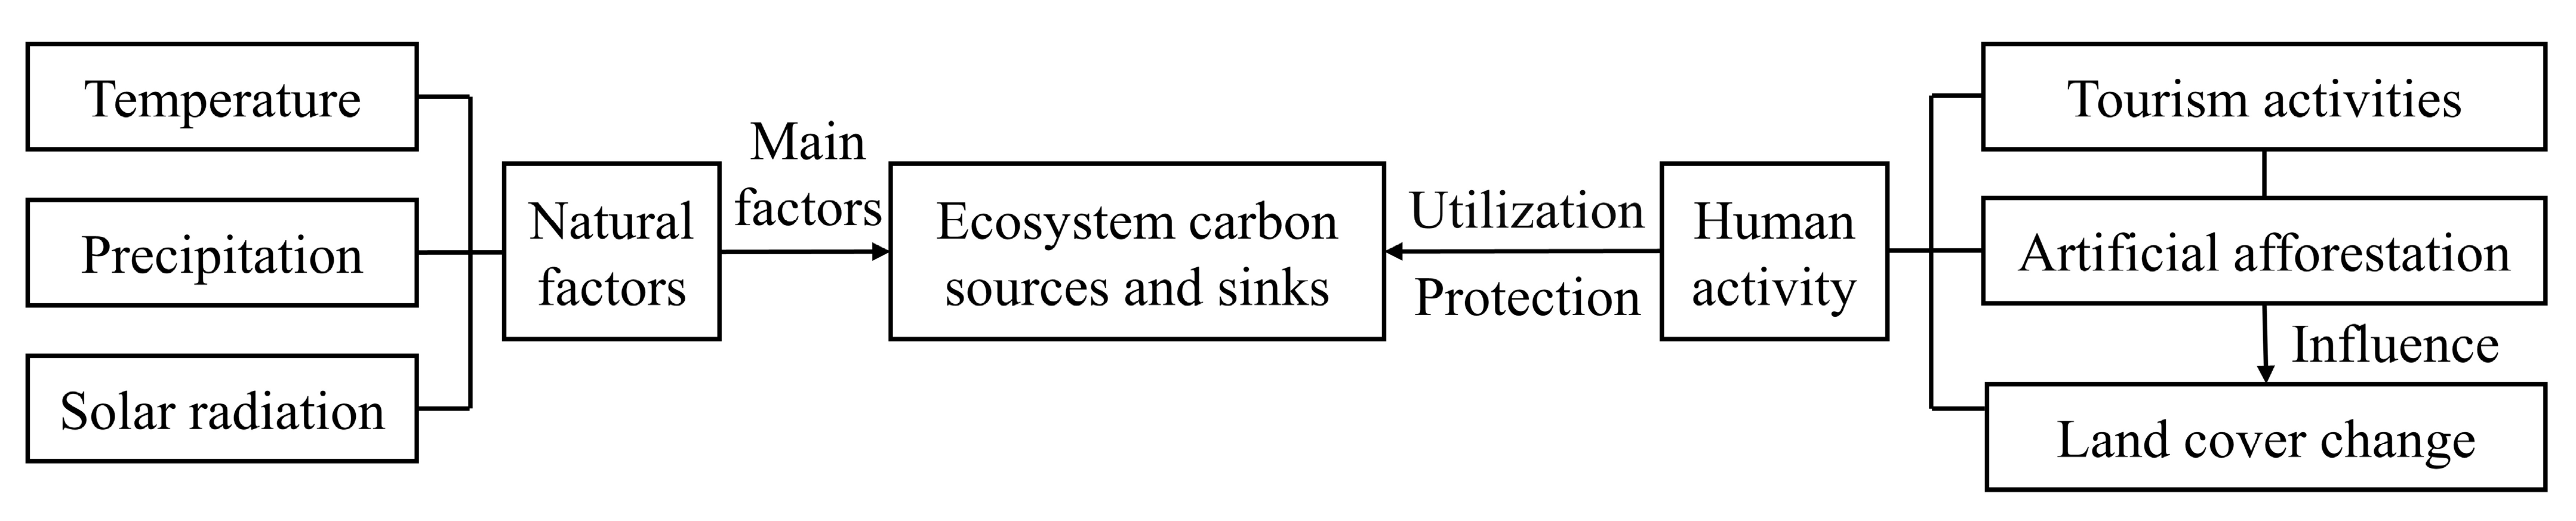
Generally, the impact of tourism development on the ecosystem was attributed to human activities, which can be expressed by direct or indirect carbon emissions. If tourism activities and ecosystem CSS are removed, the impact of tourism activities will be transformed into the impact of land use change. This influence manifested itself as the construction of tourism facilities that alter land use, which directly affects the ecosystem’s CSSs. We analysed natural factors such as temperature, precipitation, and cloud cover using GeoDetector, as well as land use change, artificial afforestation, tourism activities, and other human activities, in terms of the impact intensity of CSSs in the ecosystem of Huangshan National Park. Furthermore, we obtained the impact mechanism of tourism on ecosystem CSSs (Figure 9).
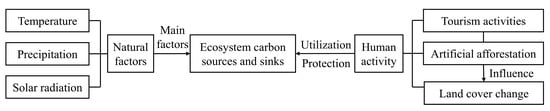
Figure 9.
Impact mechanism of tourism on CSSs of the ecosystem.
Ecosystem CSSs are primarily affected by natural factors. When suitable natural conditions appear, the carbon sink of an ecosystem increases; when natural conditions are not suitable for plant growth or increase the respiration of plants and soil, the carbon sink of the ecosystem decreases and more carbon sources are generated. Tourism activities and artificial afforestation are manifestations of land use change. Changes in land use during the early development stages of tourism activities, such as an increase in artificial land, may be destructive. However, as tourism develops, scenic area management improves and capital investment rises, and changes in land use may gradually become protective, such as protecting ancient trees and rare plants and improving greening around scenic spots. The impact of tourism activities has also changed from weakening the CSC to enhancing the CSC. Changes in land use caused by artificial afforestation mainly increase the area of forestland, but different tree species have different carbon sink capacities. If the CSC of an ecosystem needs to increase, more tree species with strong sink capacities should be planted. Additionally, because younger and older trees reduce the CSC, a certain time interval can be maintained during secondary forest planting. Future tourism development should be primarily performed on barren slopes. First, the construction of tourism facilities on barren slopes will result in less change in local land use attributes and will not cause losses in large areas of forestland. Second, with the development of tourism, greening will be strengthened on barren slopes, thereby increasing vegetation on these slopes.
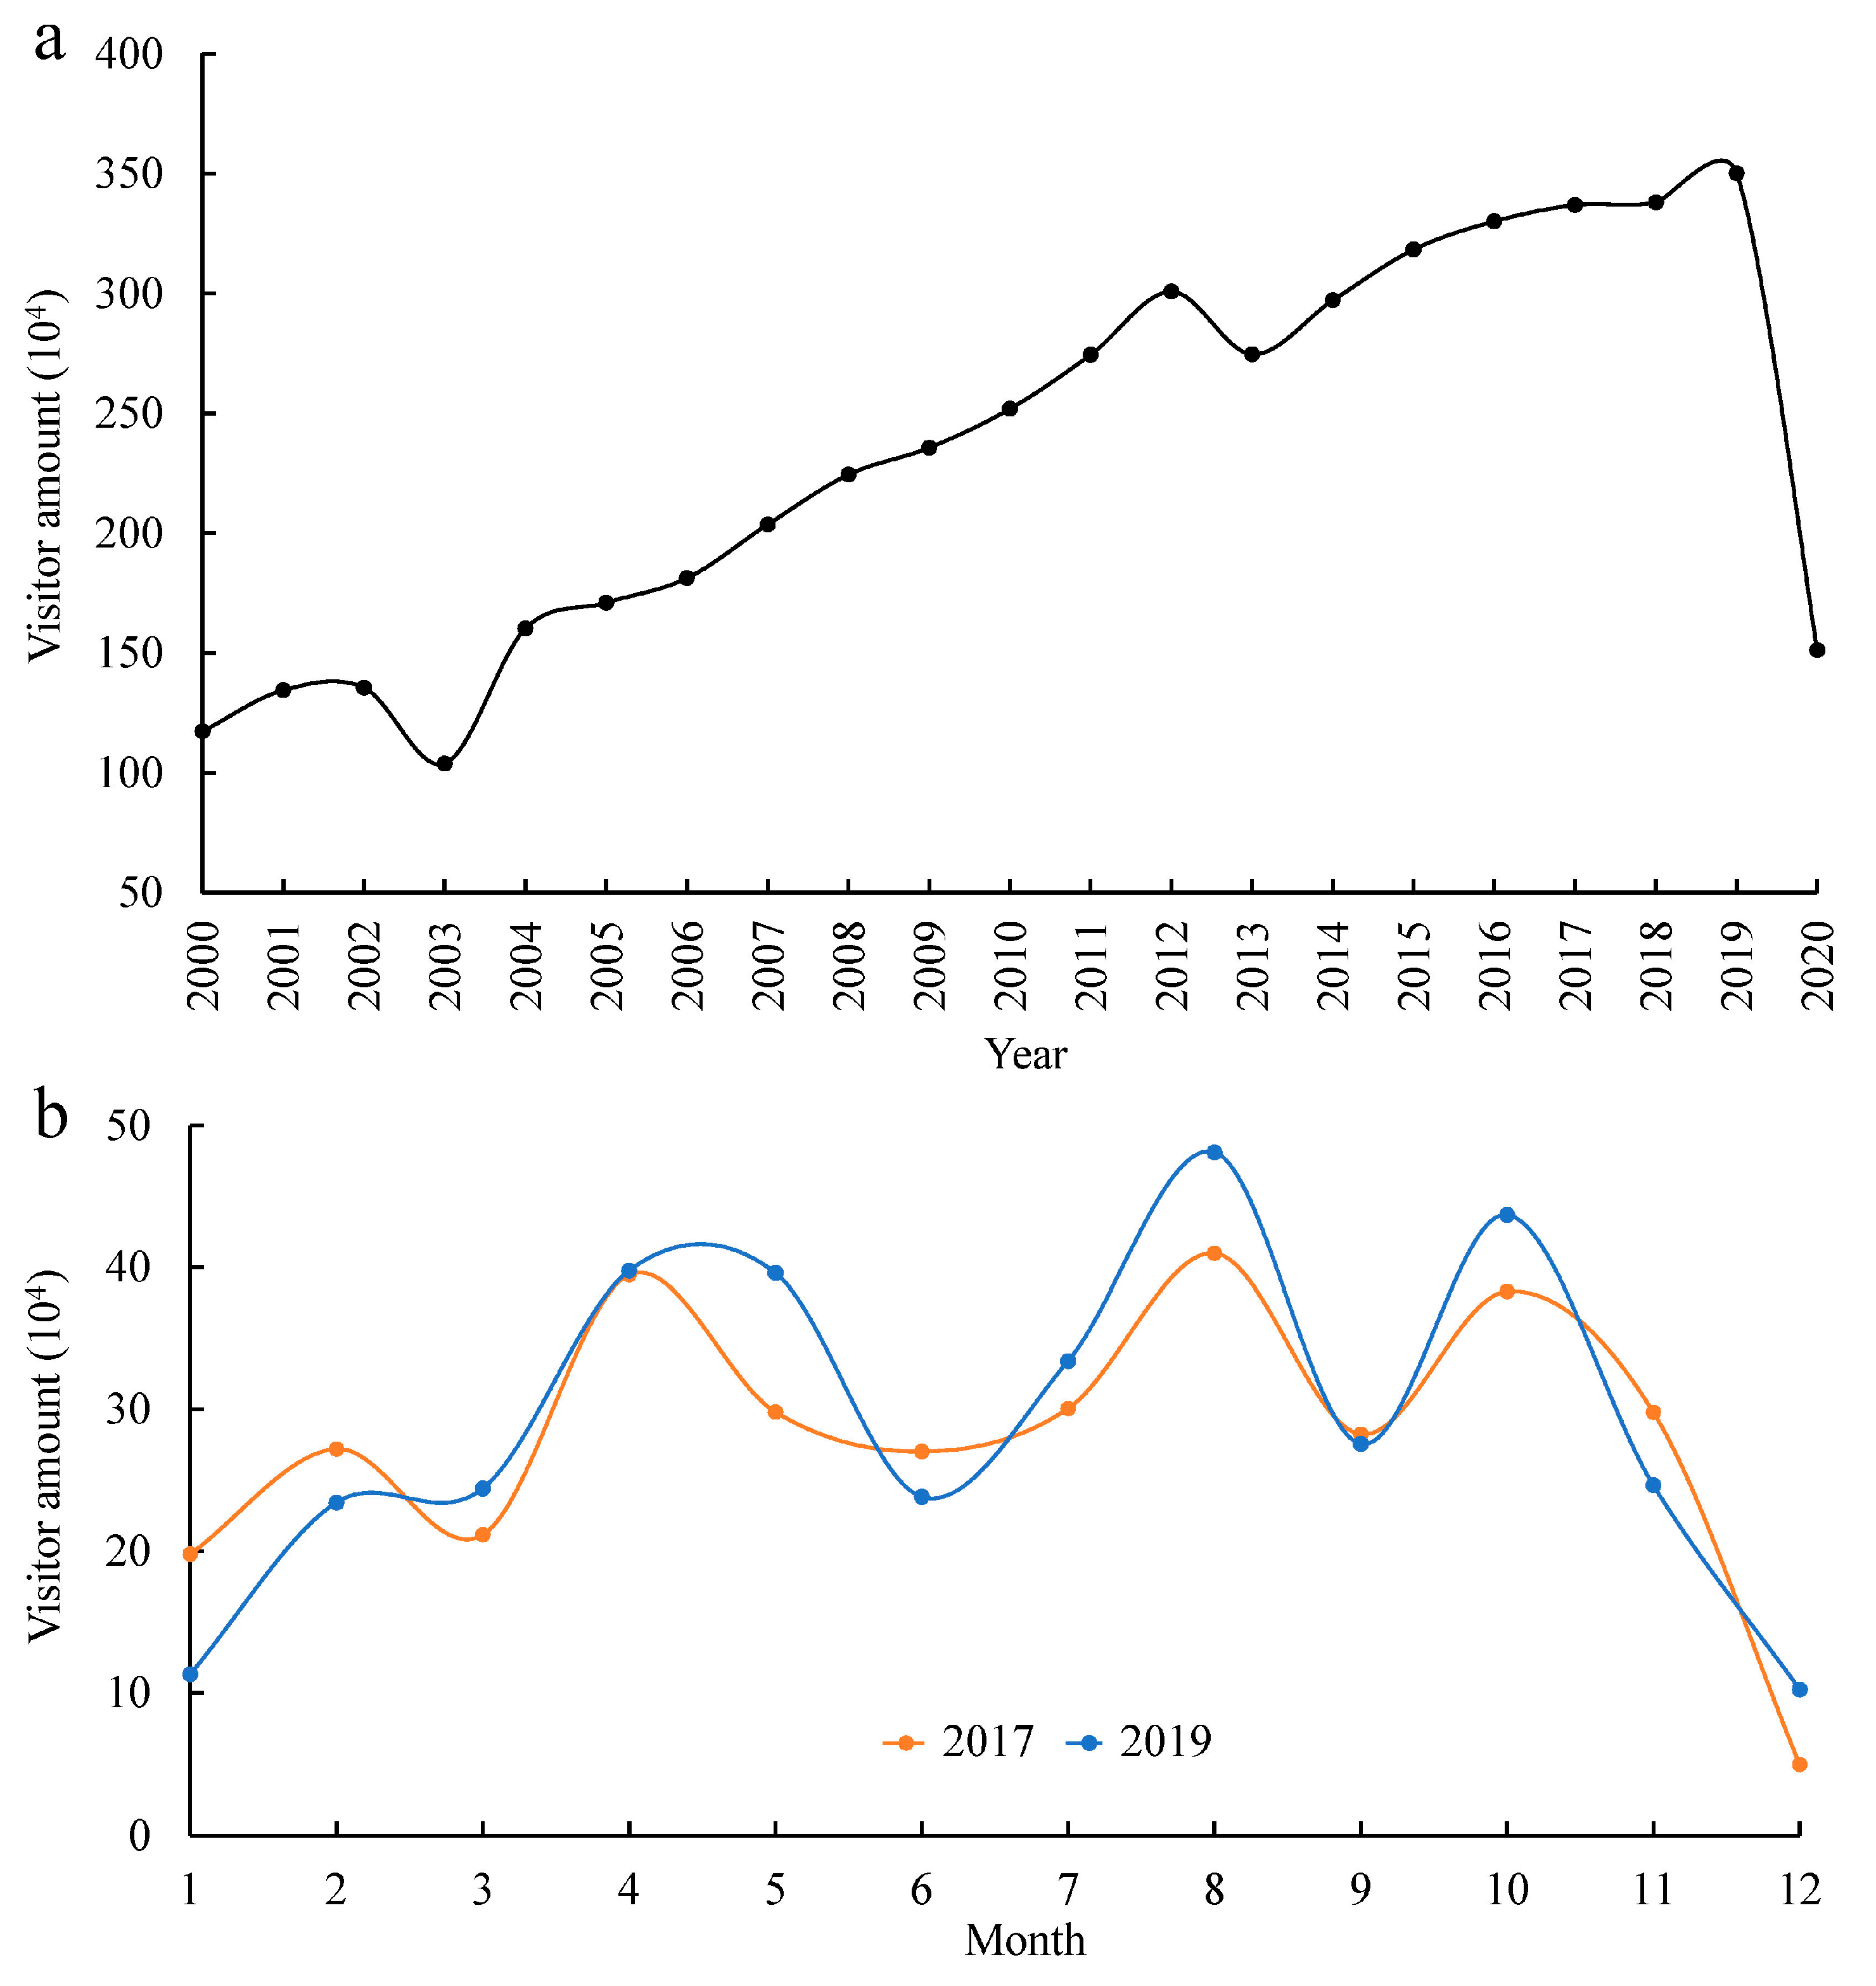
It is also crucial to assess the impact of tourist scale on ecosystem CSSs. An increase in visitor amount will inevitably result in an increase in carbon emissions from the tourism industry. However, it has also been observed that arrival of tourists has a negative effect on per capita carbon emissions, which lead to less per capita carbon emissions in developing countries [86]. Although a rise in the visitor amount will undeniably result in an increase in tourism-related carbon emissions and a greater impact on the ecosystem of Huangshan National Park, a reduction in visitor amount will also result in a certain degree of resource waste and increased per capita tourism carbon emissions because the tourist facilities are not being fully employed. During the research period, the trend in tourist arrivals at Huangshan National Park did not exhibit a clear correlation with changes in the ecosystem NEP (Figure 10a). There was no evident increase in ecosystem NEP during years marked by a significant decrease in visitor amount. Similarly, there was no notable drop in ecosystem NEP during years when the visitor amount was higher. The results of the study showed that in 2020, the visitor amount to Huangshan National Park decreased significantly under the influence of COVID-19, while the ecosystem NEP did not increase significantly and remained near the average level of the study period; additionally, the ecosystem NEP did not exhibit a decline in 2019, which was the year with the highest visitor amount during the study period. Essentially, an upsurge in the visitor amount invariably leads to a greater discharge of carbon dioxide into the atmosphere, either directly or indirectly. Nonetheless, this does not translate to a substantial effect on the natural ecosystem’s carbon sink capacity. Based on the available and reliable data, we selected the monthly distribution of tourists in 2017 and 2019 (Figure 10b). The analysis revealed that the distribution of tourists in Huangshan National Park aligns with major Chinese holidays throughout the year (Figure 10b). Notably, the months of April and October witness higher visitor numbers as well as elevated ecosystem NEP. In the future, it might be worthwhile to consider managing the flow of tourists, boosting the number of visitors during periods of heightened ecosystem carbon sinks, and utilizing the ecosystem’s carbon sink capability to counterbalance the carbon emissions produced by the increased visitor amount. This approach could facilitate the attainment of ‘carbon neutrality’ within the tourism sector.
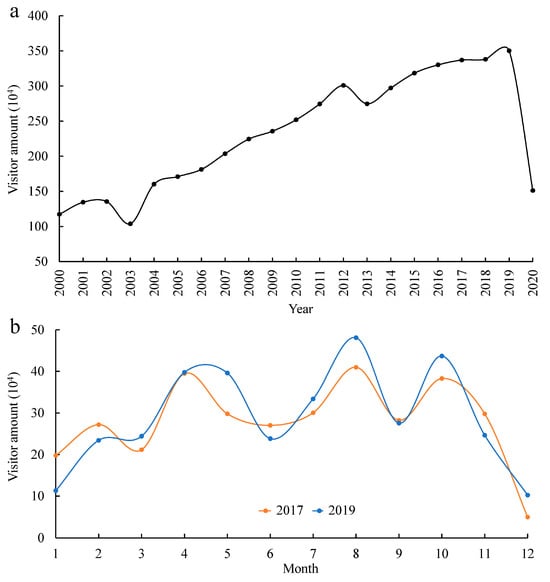
Figure 10.
Visitor amount distribution: (a) the interannual visitor amount and (b) the seasonal visitor amount.
This study on the CSSs of national parks is exploratory and inspiring. With the establishment of a system of nature reserves primarily based on national parks, future work can be extended to the investigation of different types of national parks or nature reserves, as well as comparative analyses. With regard to the content of future studies, the identification of carbon sinks will be followed by further investigation into the subject of carbon trading in national parks. Additionally, the scope of the study can be expanded to regional or larger scales.
5. Conclusions
Current research on sustainable and low-carbon tourism predominantly concentrates on the reduction of emissions from tourism activities and infrastructure. However, there is a scarcity of research on the distribution of carbon sinks within the ecosystems of eco-tourism locations, such as national parks. This study focuses on the ecosystem background of national parks, and evaluates and investigates the spatiotemporal dynamics of the CSSs within the ecosystems of Huangshan National Park. Furthermore, the study employs GeoDetector to analyse the influencing mechanisms of the ecosystem CSSs. The main conclusions are as follows:
From 2000 to 2020, the ecosystem of Huangshan National Park displayed the characteristics of a carbon sink. During this period, the ecosystem exhibited carbon sources for four years, while all other years showed carbon sinks. The NEP experienced a shift in trend, transitioning from a decrease pattern from 2000 to 2010 to an increase pattern from 2010 to 2020, with an overall increase trend. The oscillation between carbon sources and sinks within the ecosystem can be attributed to the effects of climate change.
The ecosystem’s carbon sources and sinks exhibit temporal variability throughout the year. The entire ecosystem in the study area exhibits the characteristics of carbon sinks in spring and autumn, and carbon sources in summer and winter. Factors such as the ecosystem’s temperature and precipitation conditions, the plant growth season, and variations in carbon sequestration abilities among different vegetation and soil types all influence the ecosystem’s carbon sources and sinks. Furthermore, the ecosystem’s carbon sources and sinks display a clear spatial variation across vertical zones. During the study period, each elevation zone within Huangshan National Park exhibited carbon sinks, with an increase trend in carbon sink strength from lower to higher altitudes.
The primary driving factors of NEP changes were land use change and tourism activities. Additionally, the intensity of solar radiation significantly affected NEP changes, which was related to the phenomenon of the “sea of clouds” in Huangshan. In the context of tourism development, the enhancement of low-carbon tourism awareness and the implementation of management measures have facilitated the effective preservation of tourist buildings, tourist service facilities, and surrounding areas. This has also enabled the allocation of increased financial resources and support for the conservation of natural landscapes and the rehabilitation of the ecological environment. Despite the continuous expansion of tourism service facilities, these areas were not revealed to be carbon sources under the influence of appropriate management and protection measures. Conversely, in regions with denser tourist facilities, a higher level of carbon sink capacity is observed.
Supplementary Materials
The following supporting information can be downloaded at: https://www.mdpi.com/article/10.3390/su16187895/s1, Table S1: Annual NEP of Huangshan National Park; Table S2: NPP and NEP at different altitudes of Huangshan National Park.
Author Contributions
Conceptualization, Q.H. and J.Z.; methodology, Q.H.; Formal analysis, Q.H. and J.Z.; investigation, Q.H. and J.W.; Funding acquisition, J.Z.; resources, J.Z. and H.X.; data curation, Q.H. and A.L.; writing—original draft preparation, Q.H.; writing—review and editing, Q.H. and J.Z.; visualization, Q.H.; project administration, J.Z. and J.W. All authors have read and agreed to the published version of the manuscript.
Funding
This research was funded by National Natural Science Foundation of China (grant number 42271251, 42361038).
Data Availability Statement
All of the remote sensing and meteorological data used in this study are publicly and freely available.
Acknowledgments
The authors thank the United States Geological Survey (USGS), National Qinghai-Tibet Plateau Scientific data center of China and Geographic Remote Sensing Ecological Network Scientific Data Registration and Publication System for providing remote sensing and gridded meteorological data for free.
Conflicts of Interest
The authors declare no conflicts of interest.
References
- IPCC. Climate Change 2013: The Physical Science Basis. In Contribution of Working Group I to the Fifth Assessment Report of the Intergovernmental Panel on Climate Change; Cambridge University Press: Cambridge, UK; New York, NY, USA, 2013. [Google Scholar]
- Friedlingstein, P.; Jones, M.W.; O’Sullivan, M.; Andrew, R.M.; Bakker, D.C.E.; Hauck, J.; Quéré, C.L.; Peters, G.P.; Peters, W.; Pongratz, J.; et al. Global Carbon Budget 2021. Earth Syst. Sci. Data 2022, 14, 1917–2005. [Google Scholar] [CrossRef]
- Li, B.; Gasser, T.; Ciais, P.; Piao, S.; Tao, S.; Balkanski, Y.; Hauglustaine, D.; Boisier, J.P.; Chen, Z.; Huang, M.; et al. The contribution of China’s emissions to global climate forcing. Nature 2016, 531, 357–361. [Google Scholar] [CrossRef] [PubMed]
- Fu, B.; Li, B.; Gasser, T.; Tao, S.; Ciais, P.; Piao, S.; Balkanski, Y.; Li, W.; Yin, T.; Han, L.; et al. The contributions of individual countries and regions to the global radiative forcing. Proc. Natl. Acad. Sci. USA 2021, 118, e2018211118. [Google Scholar] [CrossRef] [PubMed]
- Piao, S.; He, Y.; Wang, X.; Chen, F. Estimation of China’s terrestrial ecosystem carbon sink: Methods, progress and prospects. Sci. China-Earth Sci. 2022, 65, 641–651. [Google Scholar] [CrossRef]
- Wang, J.; Feng, L.; Palmer, P.I.; Liu, Y.; Fang, S.; Bösch, H.; O’Dell, C.W.; Tang, X.; Yang, D.; Liu, L.; et al. Large Chinese land carbon sink estimated from atmospheric carbon dioxide data. Nature 2020, 586, 720–723. [Google Scholar] [CrossRef]
- Xu, L.; Yu, G.; He, N. Increased soil organic carbon storage in Chinese terrestrial ecosystems from the 1980s to the 2010s. J. Geogr. Sci. 2019, 29, 49–66. [Google Scholar] [CrossRef]
- Fernández-Martínez, M.; Sardans, J.; Chevallier, F.; Ciais, P.; Obersteiner, M.; Vicca, S.; Canadell, J.G.; Bastos, A.; Friedlingstein, P.; Sitch, S.; et al. Global trends in carbon sinks and their relationships with CO2 and temperature. Nat. Clim. Chang. 2019, 9, 73–79. [Google Scholar] [CrossRef]
- Baldocchi, D.D. How eddy covariance flux measurements have contributed to our understanding of Global Change Biology. Glob. Chang. Biol. 2020, 26, 242–260. [Google Scholar] [CrossRef]
- He, H.; Wang, S.; Zhang, L.; Wang, J.; Ren, X.; Zhou, L.; Piao, S.; Yan, H.; Ju, W.; Gu, F.; et al. Altered trends in carbon uptake in China’s terrestrial ecosystems under the enhanced summer monsoon and warming hiatus. Natl. Sci. Rev. 2019, 6, 135–144. [Google Scholar] [CrossRef]
- He, W.; Jiang, F.; Ju, W.; Chevallier, F.; Baker, D.F.; Wang, J.; Wu, M.; Johnson, M.S.; Philip, S.; Wang, H.; et al. Improved constraints on the recent terrestrial carbon sink over China by assimilating OCO-2 XCO2 retrievals. J. Geophys. Res. Atmos. 2023, 128, e2022JD037773. [Google Scholar] [CrossRef]
- Philip, S.; Johnson, M.S.; Baker, D.F.; Basu, S.; Tiwari, Y.K.; Indira, N.K.; Ramonet, M.; Poulter, B. OCO-2 satellite-imposed constraints on terrestrial biospheric CO2 fluxes over South Asia. J. Geophys. Res. Atmos. 2022, 127, e2021JD035035. [Google Scholar] [CrossRef]
- Woodwell, G.M. The carbon dioxide question. Sci. Am. 1978, 238, 34–43. [Google Scholar] [CrossRef]
- Chapin, F.S.; Woodwell, G.M.; Randerson, J.T.; Rastetter, E.B.; Lovett, G.M.; Baldocchi, D.D.; Clark, D.A.; Harmon, M.E.; Schimel, D.S.; Valentini, R.; et al. Reconciling carbon-cycle concepts, terminology, and methods. Ecosystems 2006, 9, 1041–1050. [Google Scholar] [CrossRef]
- Chuai, X.W.; Qi, X.X.; Zhang, X.Y.; Li, J.S.; Yuan, Y.; Guo, X.M.; Huang, X.J.; Park, S.; Zhao, R.Q.; Xie, X.L.; et al. Land degradation monitoring using terrestrial ecosystem carbon sinks/sources and their response to climate change in China. Land Degrad. Dev. 2018, 29, 3489–3502. [Google Scholar] [CrossRef]
- Ouyang, Z.; Zheng, H.; Xiao, Y.; Polasky, S.; Liu, J.; Xu, W.; Wang, Q.; Zhang, L.; Xiao, Y.; Rao, E.; et al. Improvements in ecosystem services from investments in natural capital. Science 2016, 352, 1455–1459. [Google Scholar] [CrossRef]
- Sun, B.F.; Zhao, H.; Lu, F.; Wang, X.K. Spatial and temporal patterns of carbon sequestration in the Northeastern Forest Regions and its impact factors analysis. Acta Ecol. Sin. 2018, 38, 4975–4983. [Google Scholar]
- Wan, W.; Liu, Z.; Li, J.H.; Xu, J.N.; Wu, H.Q.; Xu, Z.H. Spatiotemporal patterns of maize drought stress and their effects on biomass in the Northeast and North China Plain from 2000 to 2019. Agric. For. Meteorol. 2022, 315, 108821. [Google Scholar] [CrossRef]
- Yan, Y.C.; Liu, X.P.; Ou, J.P.; Li, X.; Wen, Y.Y. Assimilating multi-source remotely sensed data into a light use efficiency model for net primary productivity estimation. Int. J. Appl. Earth Obs. Geoinf. 2018, 72, 11–25. [Google Scholar] [CrossRef]
- Liu, Z.H.; Wang, T.; Qu, Y.H.; Liu, H.M.; Wu, X.F.; Wen, Y. Prediction of High-Quality MODIS-NPP Product Data. Remote Sens. 2019, 11, 1458. [Google Scholar] [CrossRef]
- Nemani, R.R.; Keeling, C.D.; Hashimoto, H.; Jolly, W.M.; Piper, S.C.; Tucker, C.J.; Myneni, R.B.; Running, S.W. Climate-driven increases in global terrestrial net primary production from 1982 to 1999. Science 2003, 300, 1560–1563. [Google Scholar] [CrossRef]
- Dong, S.; Du, S.; Wang, X.C.; Dong, X. Terrestrial vegetation carbon sink analysis and driving mechanism identification in the Qinghai-Tibet Plateau. J. Environ. Manag. 2024, 360, 121158. [Google Scholar] [CrossRef] [PubMed]
- Xia, B.; Ma, P.Y.; Xu, C.; Zhang, L. Spatiotemporal Variation of NPP and Its Response to Extreme Climate Indices in Yellow River Basin in Recent 20 Years. Res. Soil Water Conserv. 2023, 30, 256–266. [Google Scholar]
- Zhao, L.; Du, M.; Du, W.; Guo, J.; Liao, Z.; Kang, X.; Liu, Q. Evaluation of the Carbon Sink Capacity of the Proposed Kunlun Mountain National Park. Int. J. Environ. Res. Public Health 2022, 19, 9887. [Google Scholar] [CrossRef] [PubMed]
- Piao, S.L.; Yue, C.; Ding, J.Z.; Guo, Z.T. Perspectives on the role of terrestrial ecosystems in the ‘carbon neutrality’ strategy. Sci. China-Earth Sci. 2022, 65, 1178–1186. [Google Scholar] [CrossRef]
- Yang, Y.; Shi, Y.; Sun, W.; Chang, J.; Zhu, J.; Chen, L.; Wang, X.; Guo, Y.; Zhang, H.; Yu, L.; et al. Terrestrial carbon sinks in China and around the world and their contribution to carbon neutrality. Sci. China-Life Sci. 2022, 52, 534–574. [Google Scholar]
- Dai, E.F.; Huang, Y.; Wu, Z.; Zhao, D.S. Analysis of spatio-temporal features of a carbon source/sink and its relationship to climatic factors in the Inner Mongolia grassland ecosystem. J. Geogr. Sci. 2016, 26, 297–312. [Google Scholar] [CrossRef]
- Li, Z.; Chen, Y.N.; Zhang, Q.F.; Li, Y. Spatial patterns of vegetation carbon sinks and sources under water constraint in Central Asia. J. Hydrol. 2020, 590, 125355. [Google Scholar] [CrossRef]
- Liang, L.; Geng, D.; Yan, J.; Qiu, S.Y.; Shi, Y.Y.; Wang, S.G.; Wang, L.J.; Zhang, L.P.; Kang, J.R. Remote Sensing Estimation and Spatiotemporal Pattern Analysis of Terrestrial Net Ecosystem Productivity in China. Remote Sens. 2022, 14, 1902. [Google Scholar] [CrossRef]
- Wang, Q.H.; Zhang, Z.Q.; Qu, J.S. A Review of the Research on Household Carbon Emission. Adv. Earth Sci. 2013, 28, 1305–1312. [Google Scholar]
- Duffy, K.A.; Schwalm, C.R.; Arcus, V.L.; Koch, G.W.; Liang, L.Y.L.; Schipper, L.A. How close are we to the temperature tipping point of the terrestrial biosphere? Sci. Adv. 2021, 7, eaay1052. [Google Scholar] [CrossRef]
- Cao, H.; Wu, H.Z.; Shen, S.S.; Zhan, X.Y.; Yan, S.J. “National carbon source” or “national carbon sink”? Based on the carbon balance analysis of Wuyi Mountain National Park. J. Nat. Resour. 2023, 38, 934–950. [Google Scholar] [CrossRef]
- Peng, Q.; Wang, R.; Jiang, Y.; Li, C. Contributions of climate change and human activities to vegetation dynamics in Qilian Mountain National Park, northwest China. Glob. Ecol. Conserv. 2021, 32, e01947. [Google Scholar] [CrossRef]
- Dimobe, K.; Kuyah, S.; Dabré, Z.; Ouédraogo, A.; Thiombiano, A. Diversity-carbon stock relationship across vegetation types in W National park in Burkina Faso. For. Ecol. Manag. 2019, 438, 243–254. [Google Scholar] [CrossRef]
- Grossi, G.; Vitali, A.; Bernabucci, U.; Lacetera, N.; Nardone, A. Greenhouse Gas Emissions and Carbon Sinks of an Italian Natural Park. Front. Environ. Sci. 2021, 9, 706880. [Google Scholar] [CrossRef]
- Xue, L.F.; Luo, X.F.; Li, Z.L.; Wu, R.X. Spatial spillover effects and influencing factors of forest carbon sink in China: Spatial econometric analysis based on forest resources inventory in 31 provinces of the mainland of China. J. Nat. Resour. 2017, 32, 1744–1754. [Google Scholar]
- Xu, X.; Feng, C.; Droma, P.; Tan, Y. A carbon neutral account framework for the Qomolangma mountaineering tourism area. Environ. Dev. Sustain. 2023, 25, 14101–14130. [Google Scholar] [CrossRef]
- Lenzen, M.; Sun, Y.-Y.; Faturay, F.; Ting, Y.-P.; Geschke, A.; Malik, A. The carbon footprint of global tourism. Nat. Clim. Chang. 2018, 8, 522–528. [Google Scholar] [CrossRef]
- Scott, D.; Becken, S. Adapting to climate change and climate policy: Progress, problems and potentials. J. Sustain. Tour. 2010, 18, 283–295. [Google Scholar] [CrossRef]
- Sun, Y.-Y.; Cadarso, M.A.; Driml, S. Tourism carbon footprint inventories: A review of the environmentally extended input-output approach. Ann. Touris. Res. 2020, 82, 102928. [Google Scholar] [CrossRef]
- Zhang, J.; Zhang, Y. Carbon tax, tourism CO2 emissions and economic welfare. Ann. Touris. Res. 2018, 69, 18–30. [Google Scholar] [CrossRef]
- Paramati, S.R.; Alam, M.S.; Chen, C.-F. The Effects of Tourism on Economic Growth and CO2 Emissions: A Comparison between Developed and Developing Economies. J. Travel Res. 2016, 56, 712–724. [Google Scholar] [CrossRef]
- Nhamo, G.; Dube, K.; Chapungu, L.; Chikodzi, D. Quest for NetZero emissions in South African national parks: A tourism perspective. Heliyon 2023, 9, e16410. [Google Scholar] [CrossRef] [PubMed]
- Gou, R.; Li, W.; Yang, Y.; Bai, J.; Meng, Y.; Wu, J.; Ding, Y.; Dai, Z.; Shi, Q.; Song, S.; et al. Changes in Water Retention and Carbon Sequestration in the Huangshan UNESCO Global Geopark (China) from 2000 to 2015. Forests 2020, 11, 1152. [Google Scholar] [CrossRef]
- Leroux, L.; Bégué, A.; Lo Seen, D.; Jolivot, A.; Kayitakire, F. Driving forces of recent vegetation changes in the Sahel: Lessons learned from regional and local level analyses. Remote Sens. Environ. 2017, 191, 38–54. [Google Scholar] [CrossRef]
- Teng, M.J.; Zeng, L.X.; Hu, W.J.; Wang, P.C.; Yan, Z.G.; He, W.; Zhang, Y.; Huang, Z.L.; Xiao, W.F. The impacts of climate changes and human activities on net primary productivity vary across an ecotone zone in Northwest China. Sci. Total Environ. 2020, 714, 136691. [Google Scholar] [CrossRef]
- Zhang, J.J.; Hao, X.M.; Hao, H.C.; Fan, X.; Li, Y.H. Climate Change Decreased Net Ecosystem Productivity in the Arid Region of Central Asia. Remote Sens. 2021, 13, 4449. [Google Scholar] [CrossRef]
- Wang, J.F.; Zhang, T.L.; Fu, B.J. A measure of spatial stratified heterogeneity. Ecol. Indic. 2016, 67, 250–256. [Google Scholar] [CrossRef]
- Nie, T.; Dong, G.T.; Jiang, X.H.; Lei, Y.X. Spatio-Temporal Changes and Driving Forces of Vegetation Coverage on the Loess Plateau of Northern Shaanxi. Remote Sens. 2021, 13, 613. [Google Scholar] [CrossRef]
- Liu, C.L.; Li, W.L.; Wang, W.Y.; Zhou, H.K.; Liang, T.G.; Hou, F.J.; Xu, J.; Xue, P.F. Quantitative spatial analysis of vegetation dynamics and potential driving factors in a typical alpine region on the northeastern Tibetan Plateau using the Google Earth Engine. Catena 2021, 206, 105500. [Google Scholar] [CrossRef]
- Song, Y.Z.; Wang, J.F.; Ge, Y.; Xu, C.D. An optimal parameters-based geographical detector model enhances geographic characteristics of explanatory variables for spatial heterogeneity analysis: Cases with different types of spatial data. GISci. Remote Sens. 2020, 57, 593–610. [Google Scholar] [CrossRef]
- Wang, Y.M.; Zhang, Z.X.; Chen, X. Quantifying Influences of Natural and Anthropogenic Factors on Vegetation Changes Based on Geodetector: A Case Study in the Poyang Lake Basin, China. Remote Sens. 2021, 13, 5081. [Google Scholar] [CrossRef]
- Ahlström, A.; Raupach, M.R.; Schurgers, G.; Smith, B.; Arneth, A.; Jung, M.; Reichstein, M.; Canadell, J.G.; Friedlingstein, P.; Jain, A.K.; et al. The dominant role of semi-arid ecosystems in the trend and variability of the land CO2 sink. Science 2015, 348, 895–899. [Google Scholar] [CrossRef] [PubMed]
- Chen, J.M.; Ju, W.; Ciais, P.; Viovy, N.; Liu, R.; Liu, Y.; Lu, X. Vegetation structural change since 1981 significantly enhanced the terrestrial carbon sink. Nat. Commun. 2019, 10, 4259. [Google Scholar] [CrossRef] [PubMed]
- Yu, Z.; Ciais, P.; Piao, S.; Houghton, R.A.; Lu, C.; Tian, H.; Agathokleous, E.; Kattel, G.R.; Sitch, S.; Goll, D.; et al. Forest expansion dominates China’s land carbon sink since 1980. Nat. Commun. 2022, 13, 5374. [Google Scholar] [CrossRef] [PubMed]
- Yu, G.; Chen, Z.; Piao, S.; Peng, C.; Ciais, P.; Wang, Q.; Li, X.; Zhu, X. High carbon dioxide uptake by subtropical forest ecosystems in the East Asian monsoon region. Proc. Natl. Acad. Sci. USA 2014, 111, 4910–4915. [Google Scholar] [CrossRef]
- Peng, S. 1-km Monthly Maximum Temperature Dataset for China (1901–2022); National Tibetan Plateau/Third Pole Environment Data Center: Beijing, China, 2020. [Google Scholar]
- Peng, S. 1-km Monthly Precipitation Dataset for China (1901–2022); National Tibetan Plateau/Third Pole Environment Data Center: Beijing, China, 2020. [Google Scholar]
- Yang, J.; Huang, X. The 30 m annual land cover dataset and its dynamics in China from 1990 to 2019. Earth Syst. Sci. Data 2021, 13, 3907–3925. [Google Scholar] [CrossRef]
- Randle, E.J.; Hoye, R. Stakeholder perception of regulating commercial tourism in Victorian National Parks, Australia. Tour. Manag. 2016, 54, 138–149. [Google Scholar] [CrossRef]
- Xie, W.; Chen, S.T.; Hu, Z.H. Factors influencing the variability in soil heterotrophic respiration from terrestrial ecosystem in China. Environ. Sci. 2014, 35, 334–340. [Google Scholar]
- Zheng, Z.M.; Yu, G.R.; Fu, Y.L.; Wang, Y.S.; Sun, X.M.; Wang, Y.H. Temperature sensitivity of soil respiration is affected by prevailing climatic conditions and soil organic carbon content: A trans-China based case study. Soil Biol. Biochem 2009, 41, 1531–1540. [Google Scholar] [CrossRef]
- Yu, G.R.; Zheng, Z.M.; Wang, Q.F.; Fu, Y.L.; Zhuang, J.; Sun, X.M.; Wang, Y.S. Spatiotemporal pattern of soil respiration of terrestrial ecosystems in China: The development of a geostatistical model and its simulation. Environ. Sci. Technol. 2010, 44, 6074–6080. [Google Scholar] [CrossRef]
- Liu, Y.; Yang, R. The spatial characteristics and formation mechanism of the county urbanization in China. Acta Geogr. Sin. 2012, 67, 1011–1020. [Google Scholar]
- Wang, X.G.; Xi, J.C.; Yang, D.Y.; Chen, T. Spatial Differentiation of Rural Touristization and Its Determinants in China: A Geo-Detector-Based Case Study of Yesanpo Scenic Area. J. Resour. Ecol. 2016, 7, 464–471. [Google Scholar]
- Xu, Q.R.; Zheng, X.Q. Analysis of Influencing Mechanism of Urban Growth Using Geographical Detector. Acta Geod. Cartogr. Sin. 2015, 44, 96–101. [Google Scholar]
- Wei, D.; Tao, J.; Wang, Z.; Zhao, H.; Zhao, W.; Wang, X. Elevation-dependent pattern of net CO2 uptake across China. Nat. Commun. 2024, 15, 2489. [Google Scholar] [CrossRef] [PubMed]
- Natali, S.M.; Watts, J.D.; Rogers, B.M.; Potter, S.; Ludwig, S.M.; Selbmann, A.K.; Sullivan, P.F.; Abbott, B.W.; Arndt, K.A.; Birch, L.; et al. Large loss of CO2 in winter observed across the northern permafrost region. Nat. Clim. Chang. 2019, 9, 852–857. [Google Scholar] [CrossRef]
- Hou, Q.; Yang, H.; Wu, J.; Yu, X. Carbon budget response to climate change varies with grassland type in Qilian Mountains, China. Glob. Ecol. Conserv. 2023, 47, e02670. [Google Scholar] [CrossRef]
- Zhang, Y.; Zheng, J.; Zhang, J.; Mu, C.; Han, W.; Liu, L. Characteristic Analysis of Carbon Sink Capacity Changes in Xinjiang’s Terrestrial Ecosystem Based on EEMD. Sustainability 2024, 16, 2277. [Google Scholar] [CrossRef]
- Yu, T.; Feng, J.; Chen, W.; Hu, K.; Chen, S. Enhanced tropospheric biennial oscillation of the East Asian summer monsoon since the late 1970s. J. Clim. 2022, 35, 1613–1628. [Google Scholar] [CrossRef]
- Wei, S.; Wang, X.; Wang, C.; Xie, Q. El Niño phase transition by deforestation in the Maritime Continent. npj Clim. Atmos. Sci. 2024, 7, 3. [Google Scholar] [CrossRef]
- Crowther, T.W.; Todd-Brown, K.E.; Rowe, C.W.; Wieder, W.R.; Carey, J.C.; Machmuller, M.B.; Snoek, B.; Fang, S.; Zhou, G.; Allison, S.D. Quantifying global soil carbon losses in response to warming. Nature 2016, 540, 104–108. [Google Scholar] [CrossRef]
- Faber, J.; Quadros, A.F.; Zimmer, M. A Space-For-Time approach to study the effects of increasing temperature on leaf litter decomposition under natural conditions. Soil Biol. Biochem. 2018, 123, 250–256. [Google Scholar] [CrossRef]
- Wang, H.; Liu, S.; Schindlbacher, A.; Wang, J.; Yang, Y.; Song, Z.; You, Y.; Shi, Z.; Li, Z.; Chen, L. Experimental warming reduced topsoil carbon content and increased soil bacterial diversity in a subtropical planted forest. Soil Biol. Biochem. 2019, 133, 155–164. [Google Scholar] [CrossRef]
- Kane, E.S.; Pregitzer, K.S.; Burton, A.J. Soil respiration along environmental gradients in Olympic National Park. Ecosystems 2003, 6, 326–335. [Google Scholar] [CrossRef]
- Cheng, L.; Zhang, N.; Yuan, M.; Xiao, J.; Qin, Y.; Deng, Y.; Tu, Q.; Xue, K.; Van Nostrand, J.D.; Wu, L. Warming enhances old organic carbon decomposition through altering functional microbial communities. ISME J. 2017, 11, 1825–1835. [Google Scholar] [CrossRef]
- Melillo, J.M.; Butler, S.; Johnson, J.; Mohan, J.; Steudler, P.; Lux, H.; Burrows, E.; Bowles, F.; Smith, R.; Scott, L. Soil warming, carbon–nitrogen interactions, and forest carbon budgets. Proc. Natl. Acad. Sci. USA 2011, 108, 9508–9512. [Google Scholar] [CrossRef]
- Nottingham, A.T.; Bååth, E.; Reischke, S.; Salinas, N.; Meir, P. Adaptation of soil microbial growth to temperature: Using a tropical elevation gradient to predict future changes. Glob. Chang. Biol. 2019, 25, 827–838. [Google Scholar] [CrossRef]
- Frey, S.D.; Lee, J.; Melillo, J.M.; Six, J. The temperature response of soil microbial efficiency and its feedback to climate. Nat. Clim. Chang. 2013, 3, 395–398. [Google Scholar] [CrossRef]
- Li, Y.; Qing, Y.; Lyu, M.; Chen, S.; Yang, Z.; Lin, C.; Yang, Y. Effects of artificial warming on different soil organic carbon and nitrogen pools in a subtropical plantation. Soil Biol. Biochem. 2018, 124, 161–167. [Google Scholar] [CrossRef]
- Su, T.; Chapin, S.J.; Bryant, D.M.; Shewan, A.M.; Young, K.; Mostov, K.E. Reduced immunoglobulin A transcytosis associated with immunoglobulin A nephropathy and nasopharyngeal carcinoma. J. Biol. Chem. 2011, 286, 44921–44925. [Google Scholar] [CrossRef]
- Ge, W.Y.; Deng, L.Q.; Wang, F.; Han, J.Q. Quantifying the contributions of human activities and climate change to vegetation net primary productivity dynamics in China from 2001 to 2016. Sci. Total Environ. 2021, 773, 145648. [Google Scholar] [CrossRef]
- Messier, C.; Bauhus, J.; Sousa-Silva, R.; Auge, H.; Baeten, L.; Barsoum, N.; Bruelheide, H.; Caldwell, B.; Cavender-Bares, J.; Dhiedt, E.; et al. For the sake of resilience and multifunctionality, let’s diversify planted forests! Conserv. Lett. 2022, 15, e12829. [Google Scholar] [CrossRef]
- Li, X.; Aguila, L.C.R.; Wu, D.H.; Lie, Z.Y.; Xu, W.F.; Tang, X.L.; Liu, J.X. Carbon sequestration and storage capacity of Chinese fir at different stand ages. Sci. Total Environ. 2023, 904, 166962. [Google Scholar] [CrossRef] [PubMed]
- Zhang, J.K. Tourism and carbon emissions: Global perspectives and regional comparisons. Geogr. Res. 2022, 41, 3088–3104. [Google Scholar]

Disclaimer/Publisher’s Note: The statements, opinions and data contained in all publications are solely those of the individual author(s) and contributor(s) and not of MDPI and/or the editor(s). MDPI and/or the editor(s) disclaim responsibility for any injury to people or property resulting from any ideas, methods, instructions or products referred to in the content. |
© 2024 by the authors. Licensee MDPI, Basel, Switzerland. This article is an open access article distributed under the terms and conditions of the Creative Commons Attribution (CC BY) license (https://creativecommons.org/licenses/by/4.0/).