
Seismic Performance Analysis of the Internal Joint in the New Demountable Fabricated Concrete Frame with Prestressed Mortise–Tenon Connections

Abstract
:1. Introduction
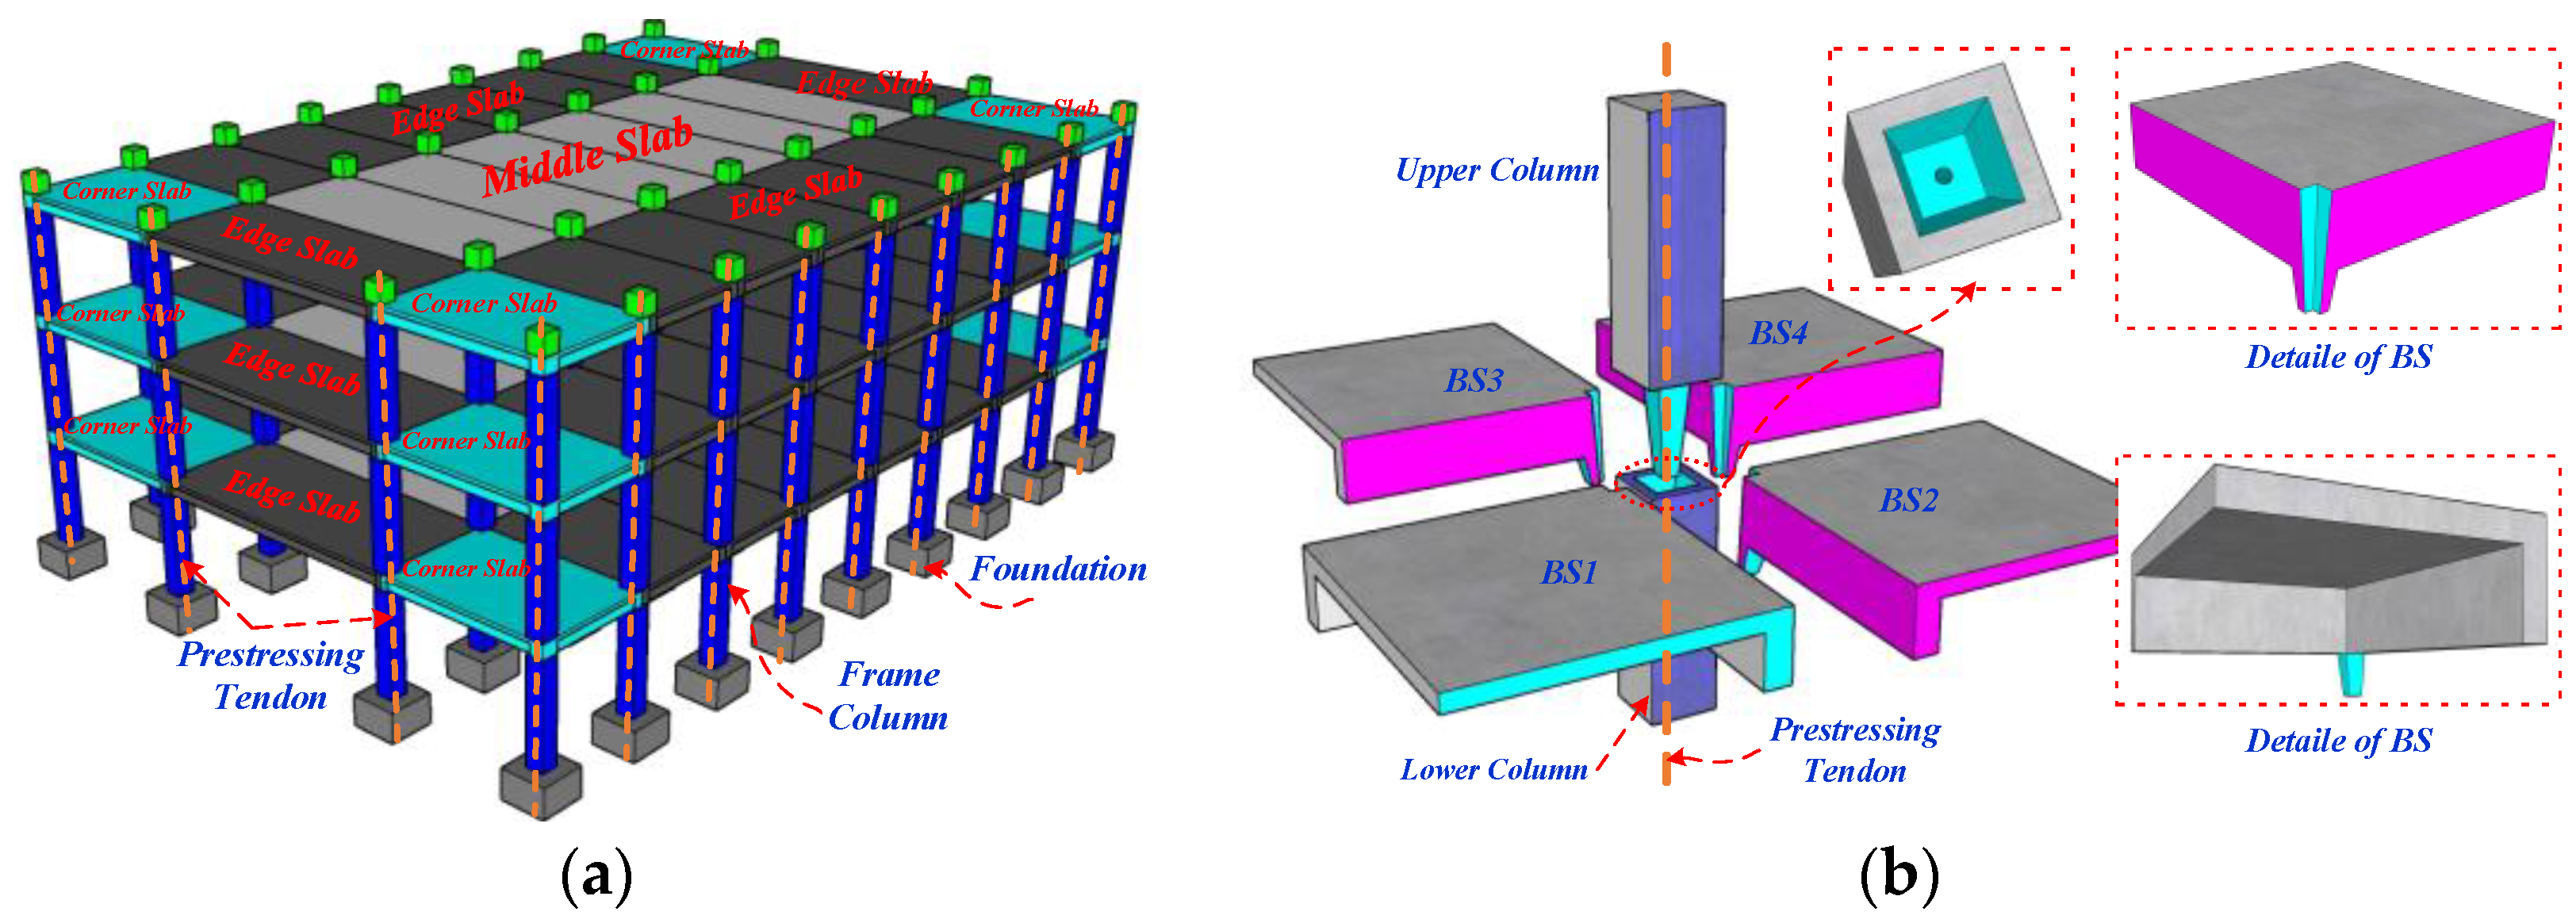
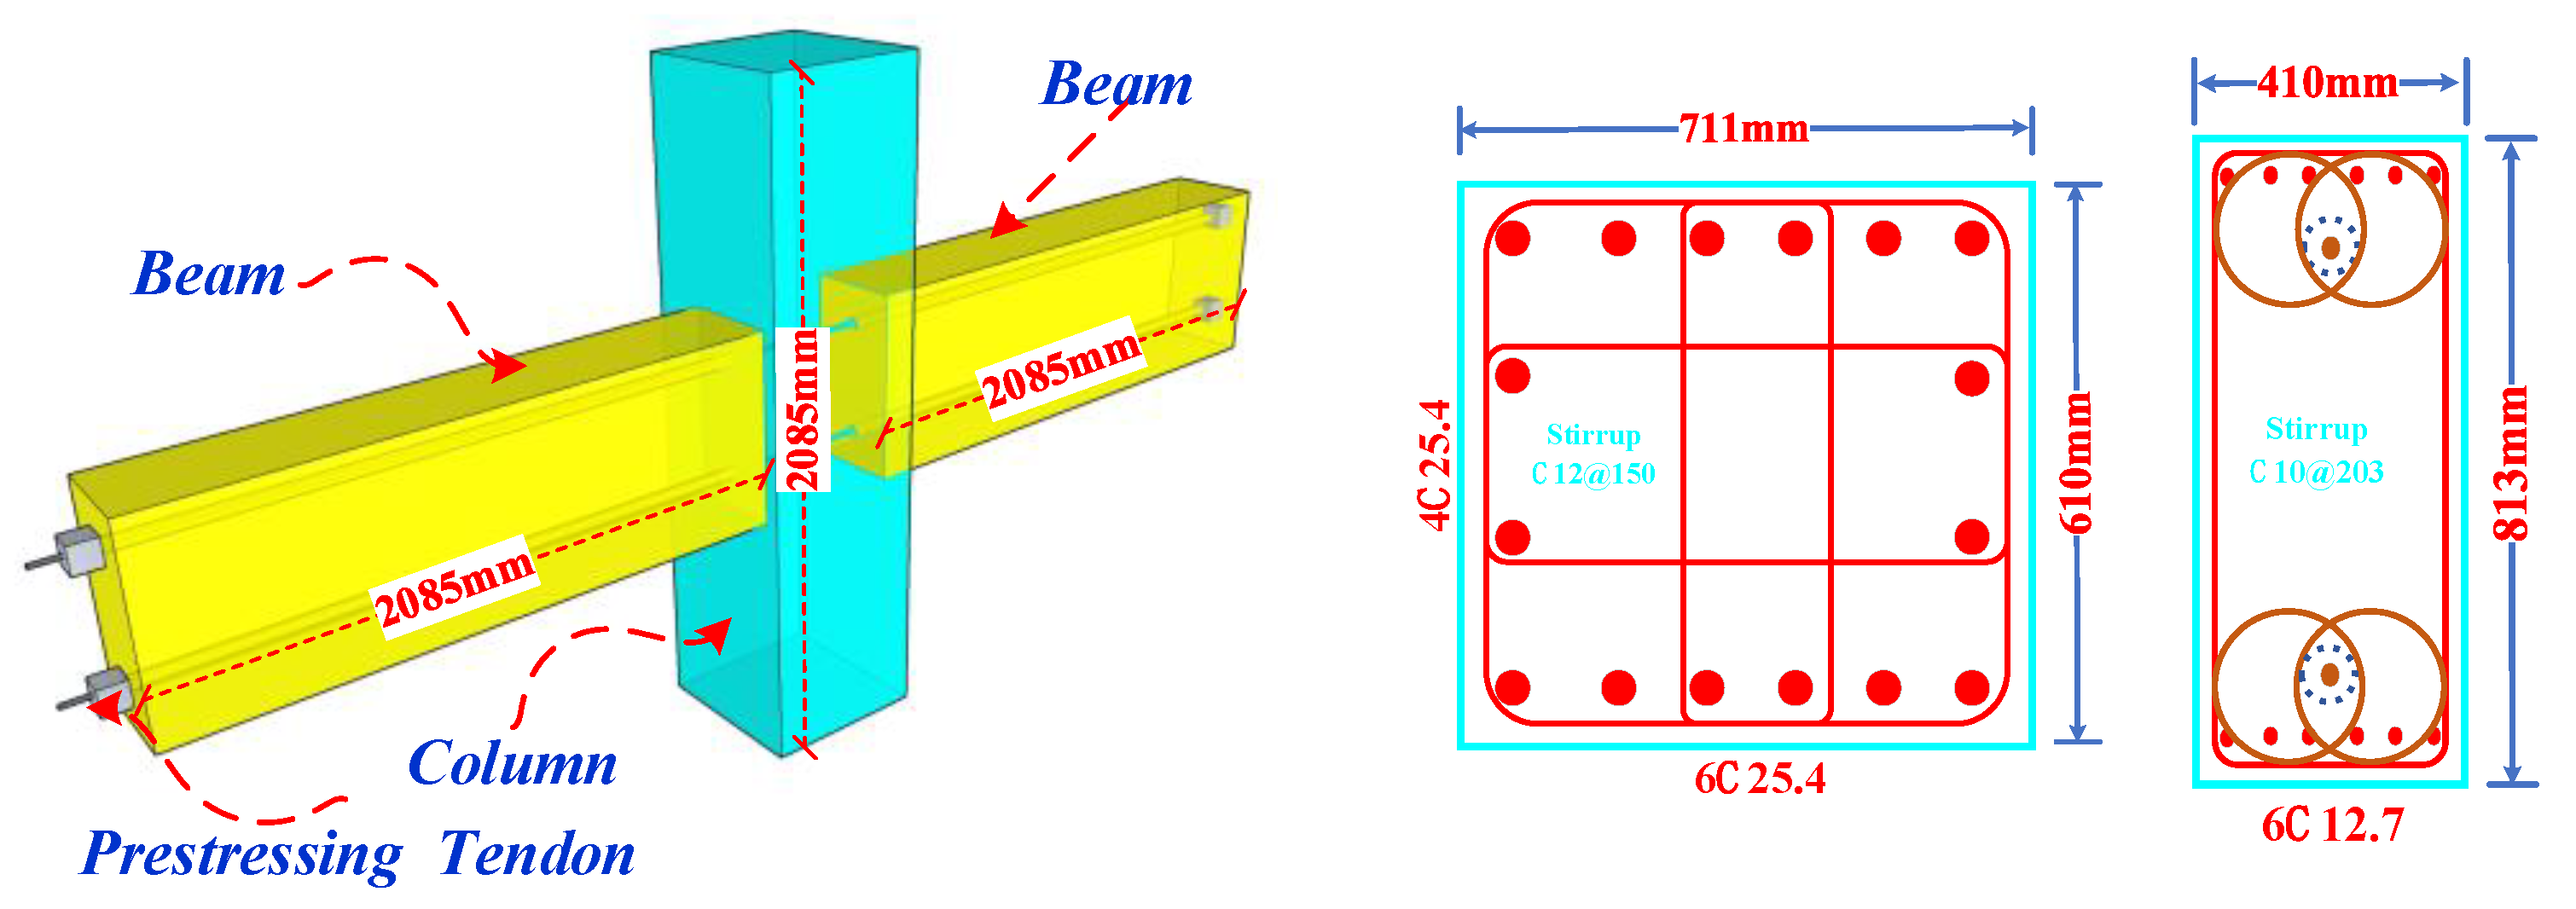
2. Proposal of the New Joint
3. Foundation and Validation of FEM
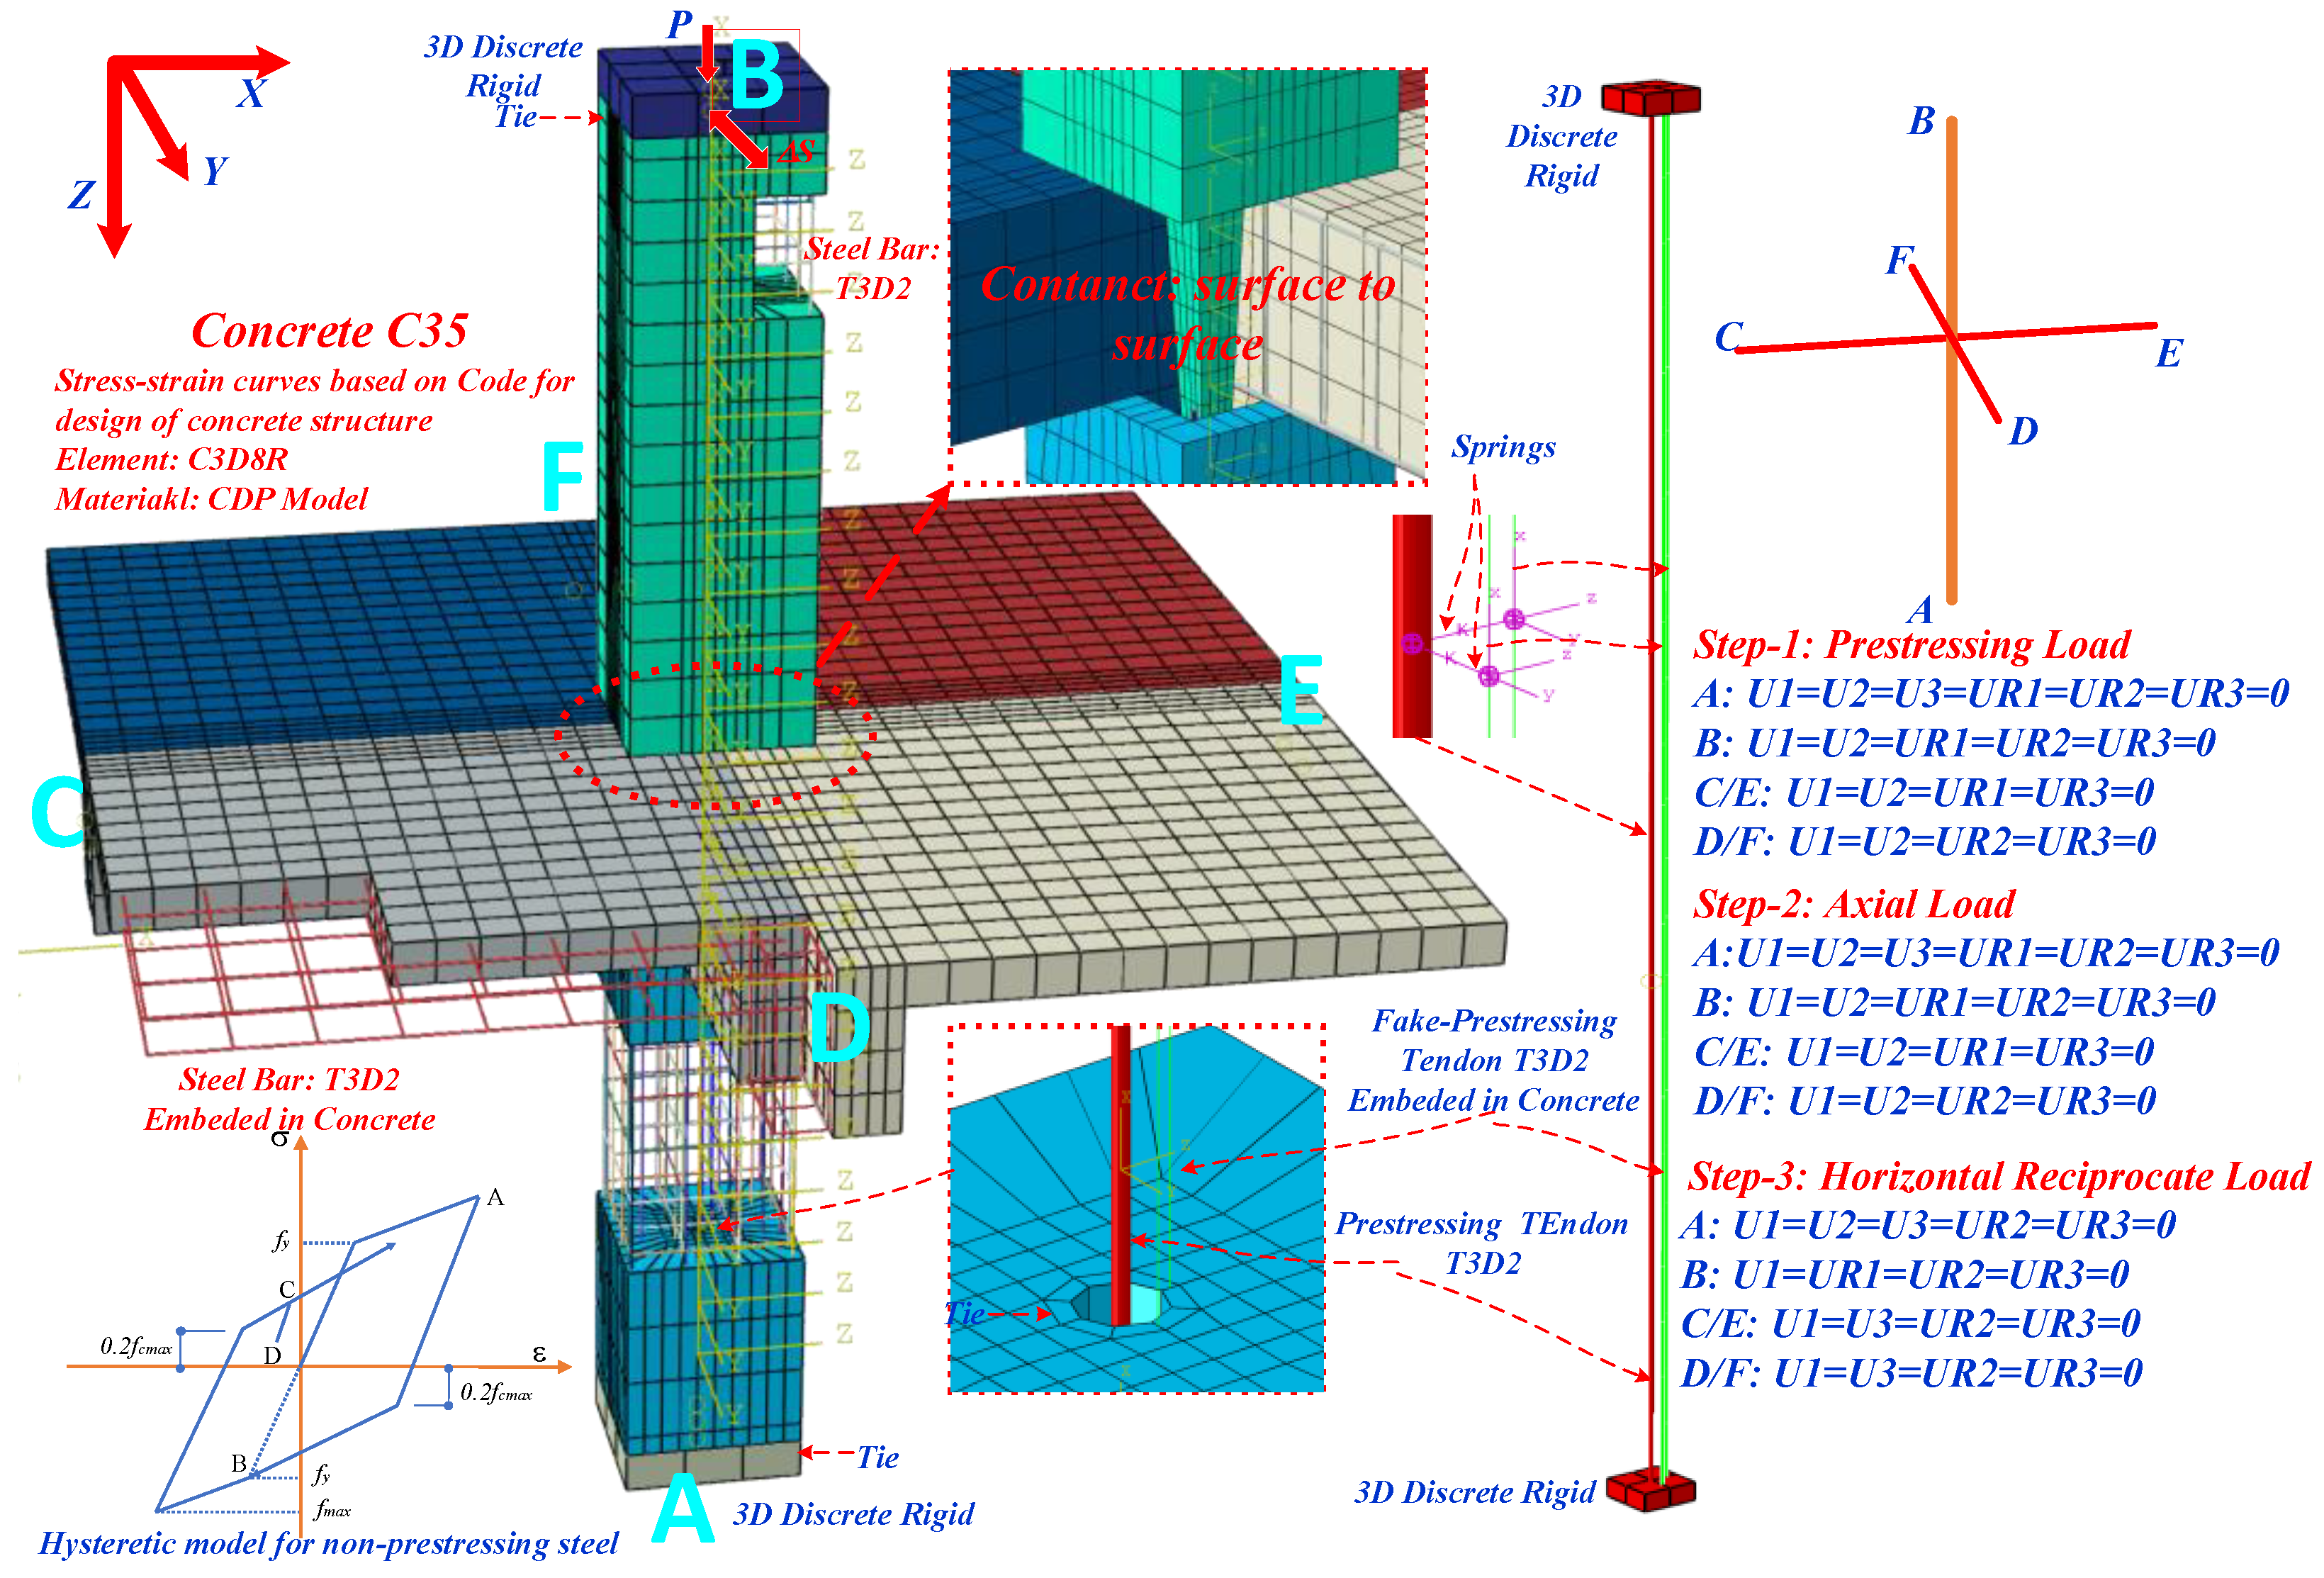
3.1. Foundation of FEM
3.1.1. Material Constitutive Model
3.1.2. Element
3.1.3. Boundary and Load
3.1.4. Interaction and Connections
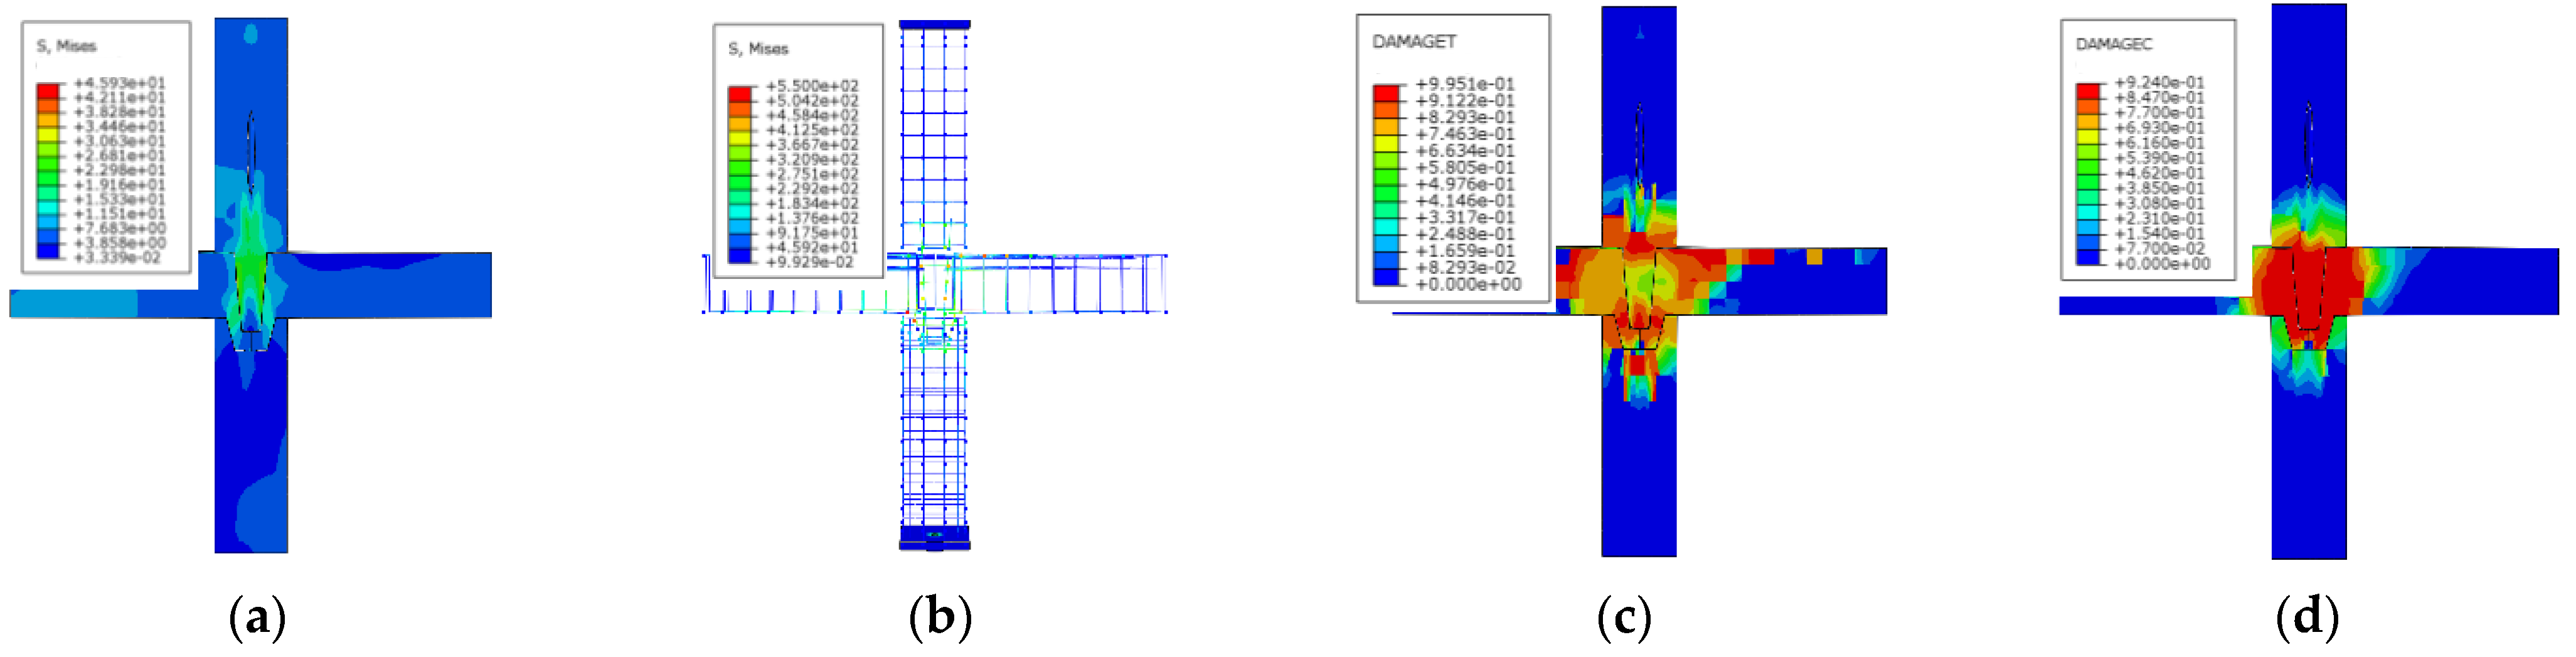
3.2. Validation of FEM
4. Analysis of Results
4.1. Failure Process and Failure Type
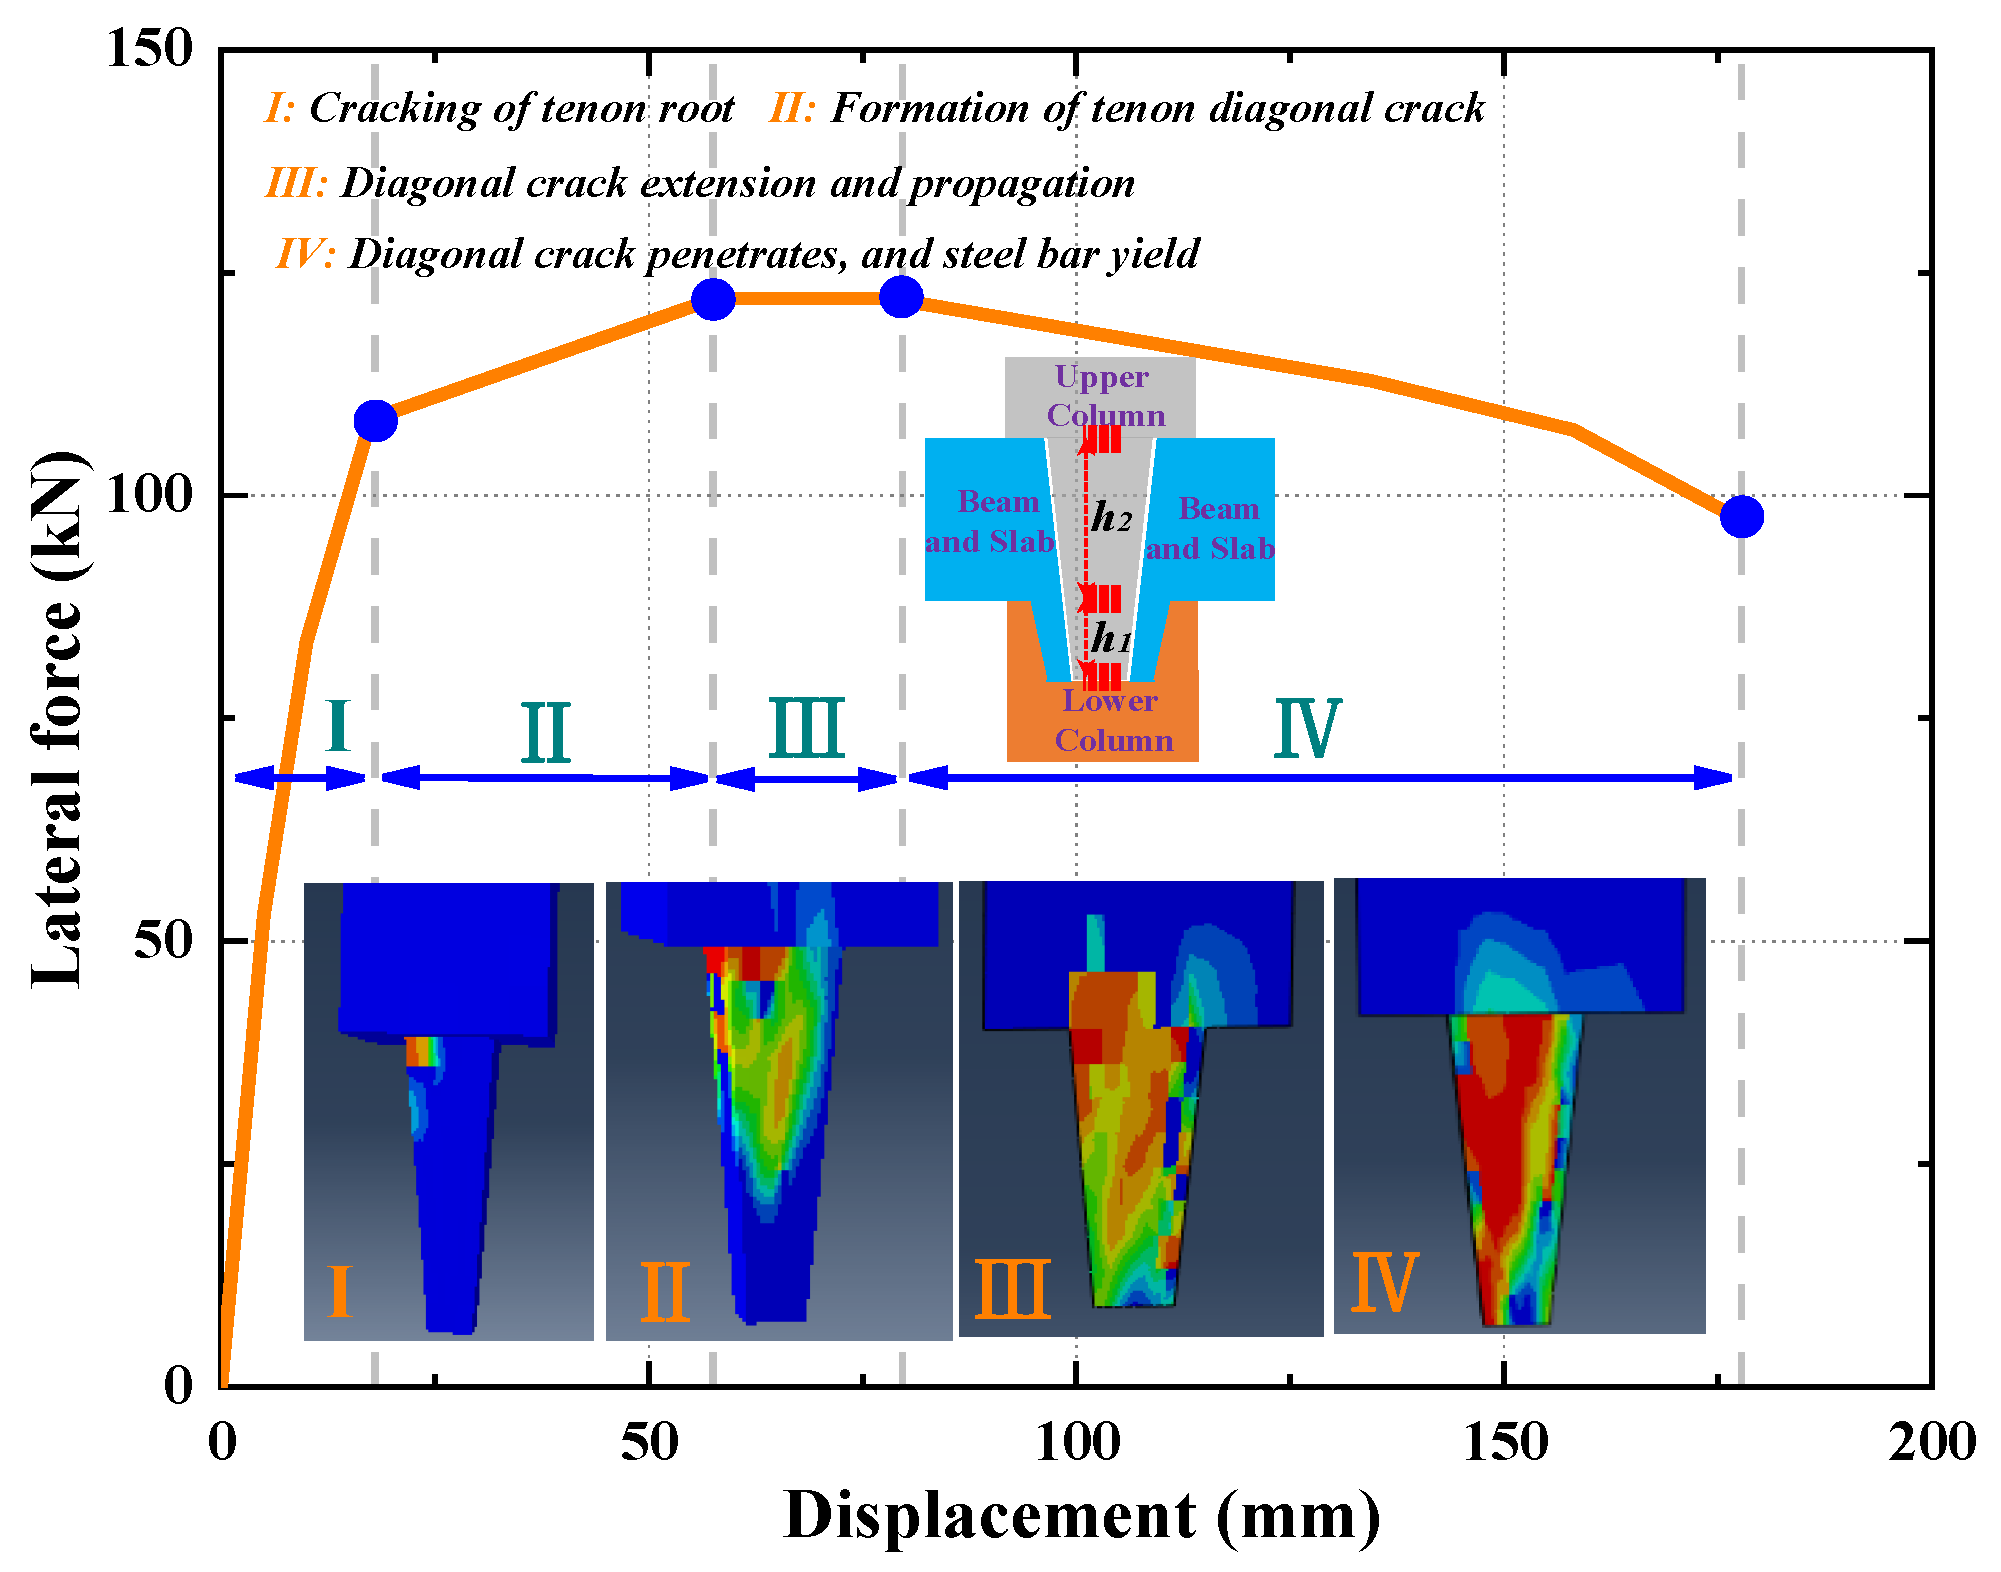
4.1.1. The Tenon of the Upper Column
4.1.2. Connection Region of the One-Piece Beam–Slabs
4.1.3. Lower Frame Column Cups
4.2. Hysteretic Behavior
5. Parameter Study
5.1. Axial Compression Ratio n
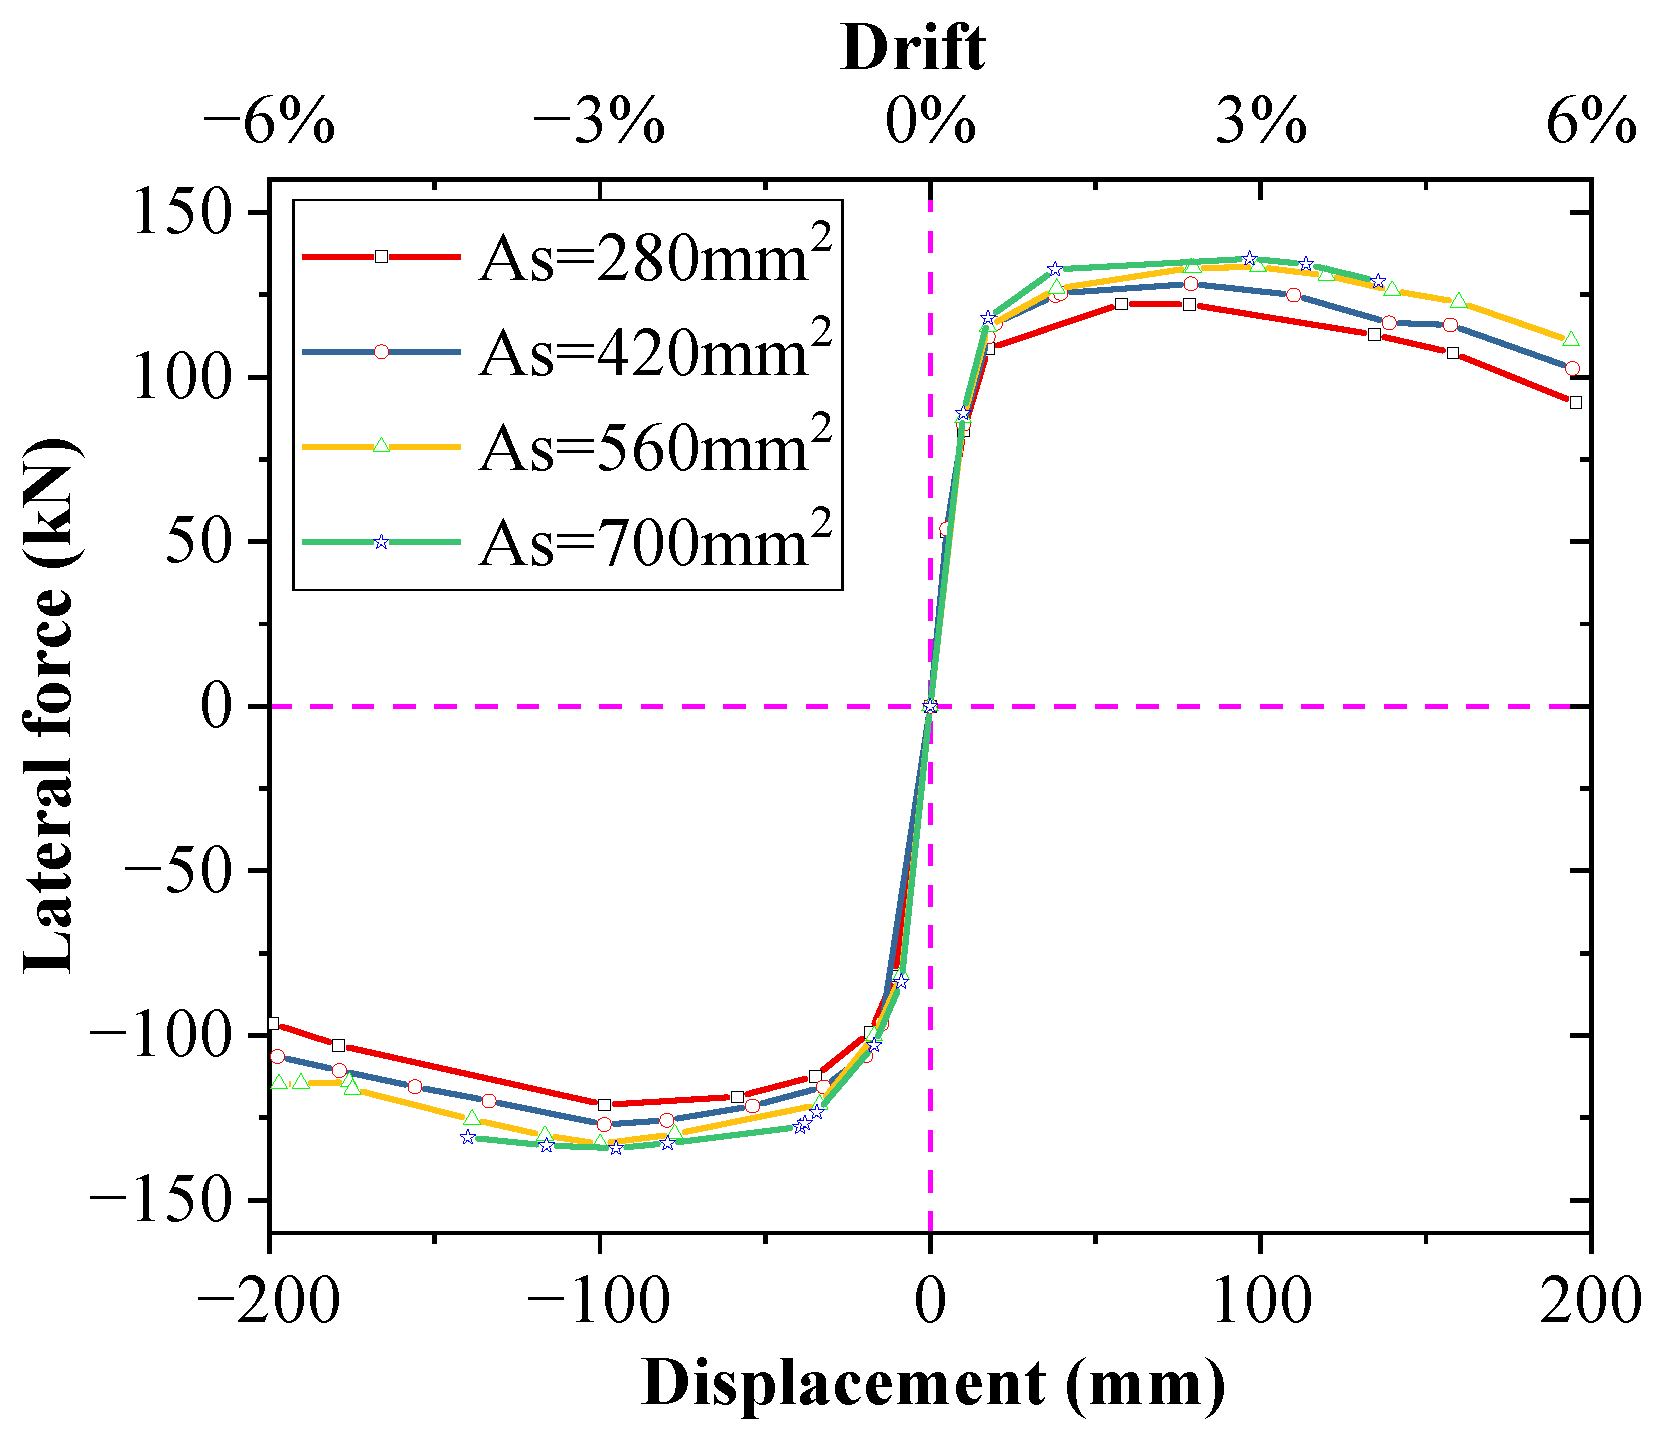
5.2. Area of Unbonded Prestressed Reinforcement As
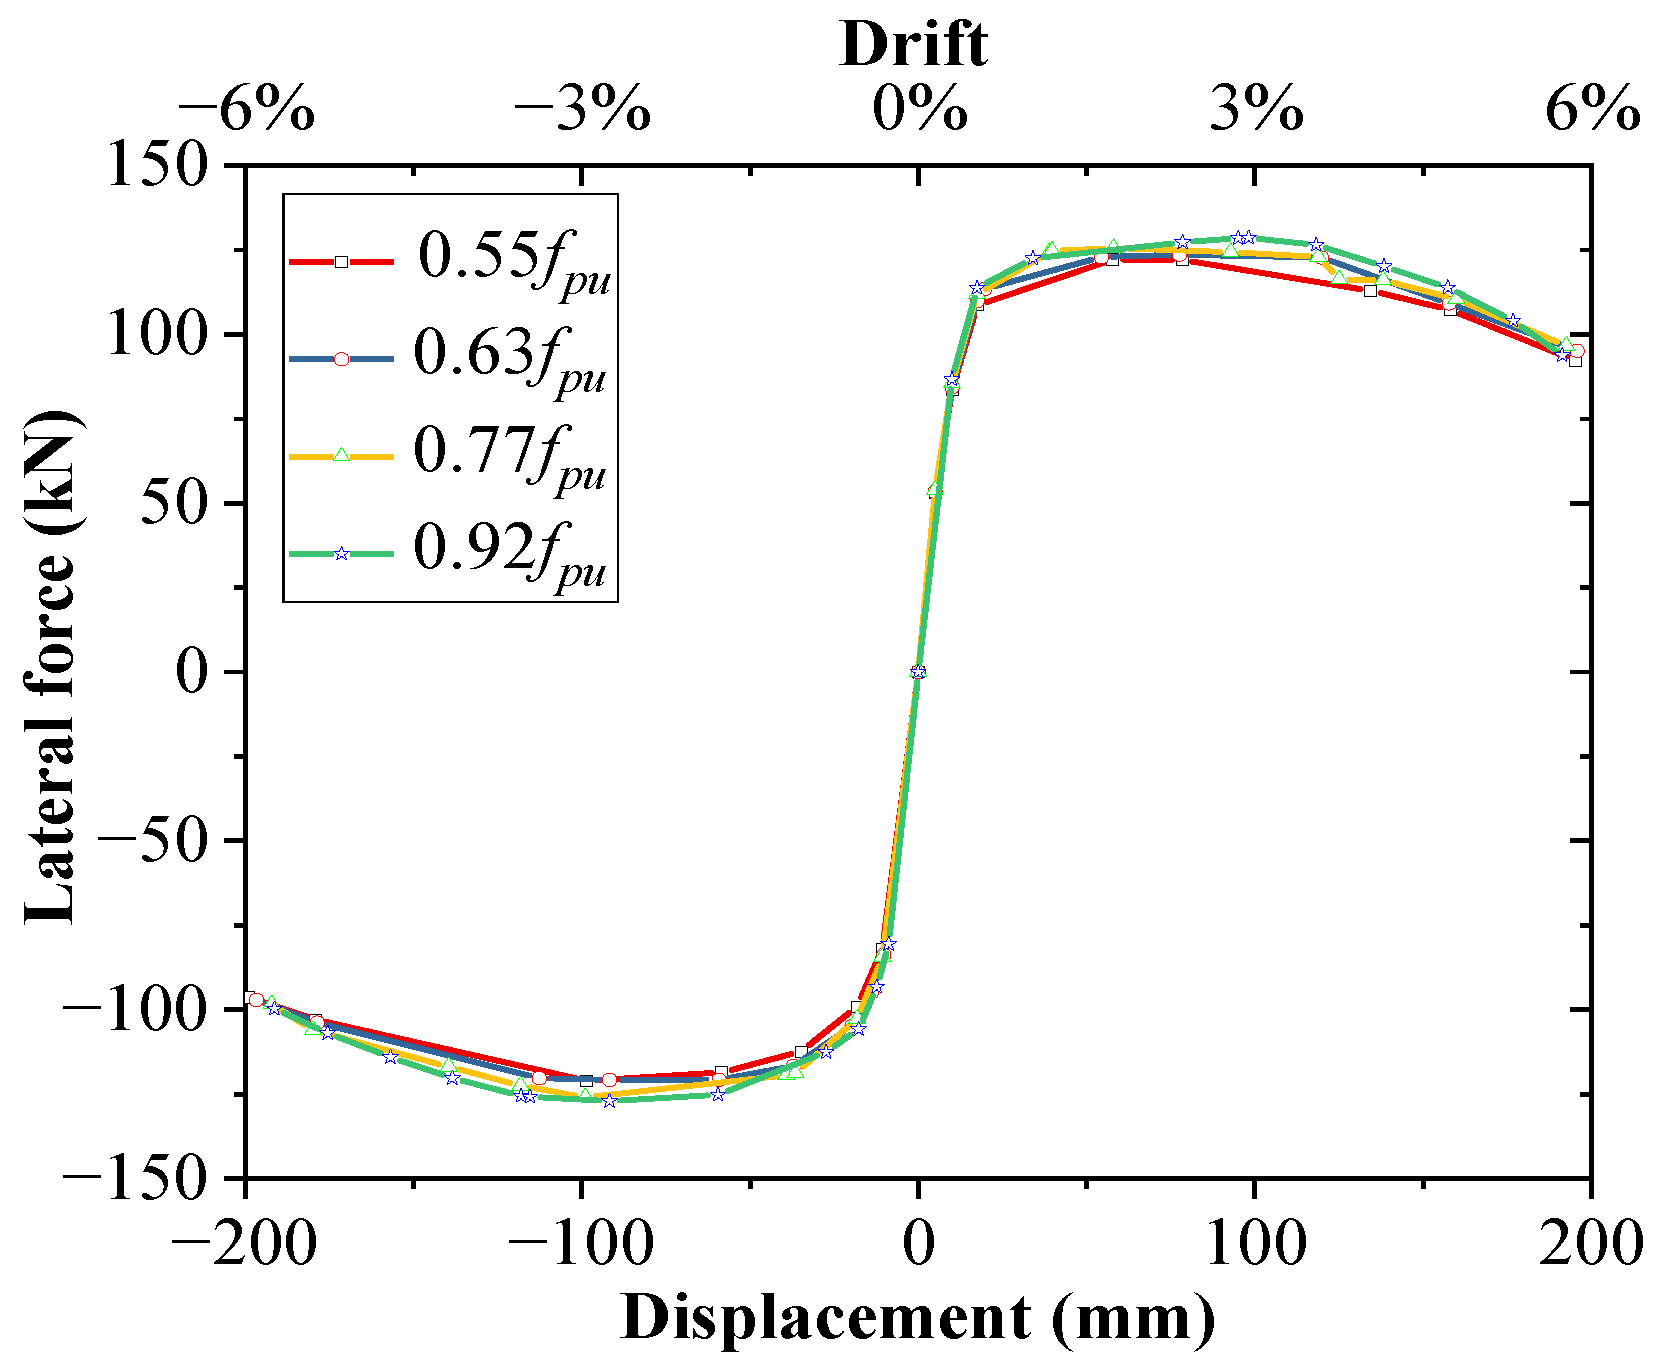
5.3. Initial Effective Stress of Prestressed Reinforcement fpu
5.4. Reinforcement Ratio of the Joint in Core Region ρsv
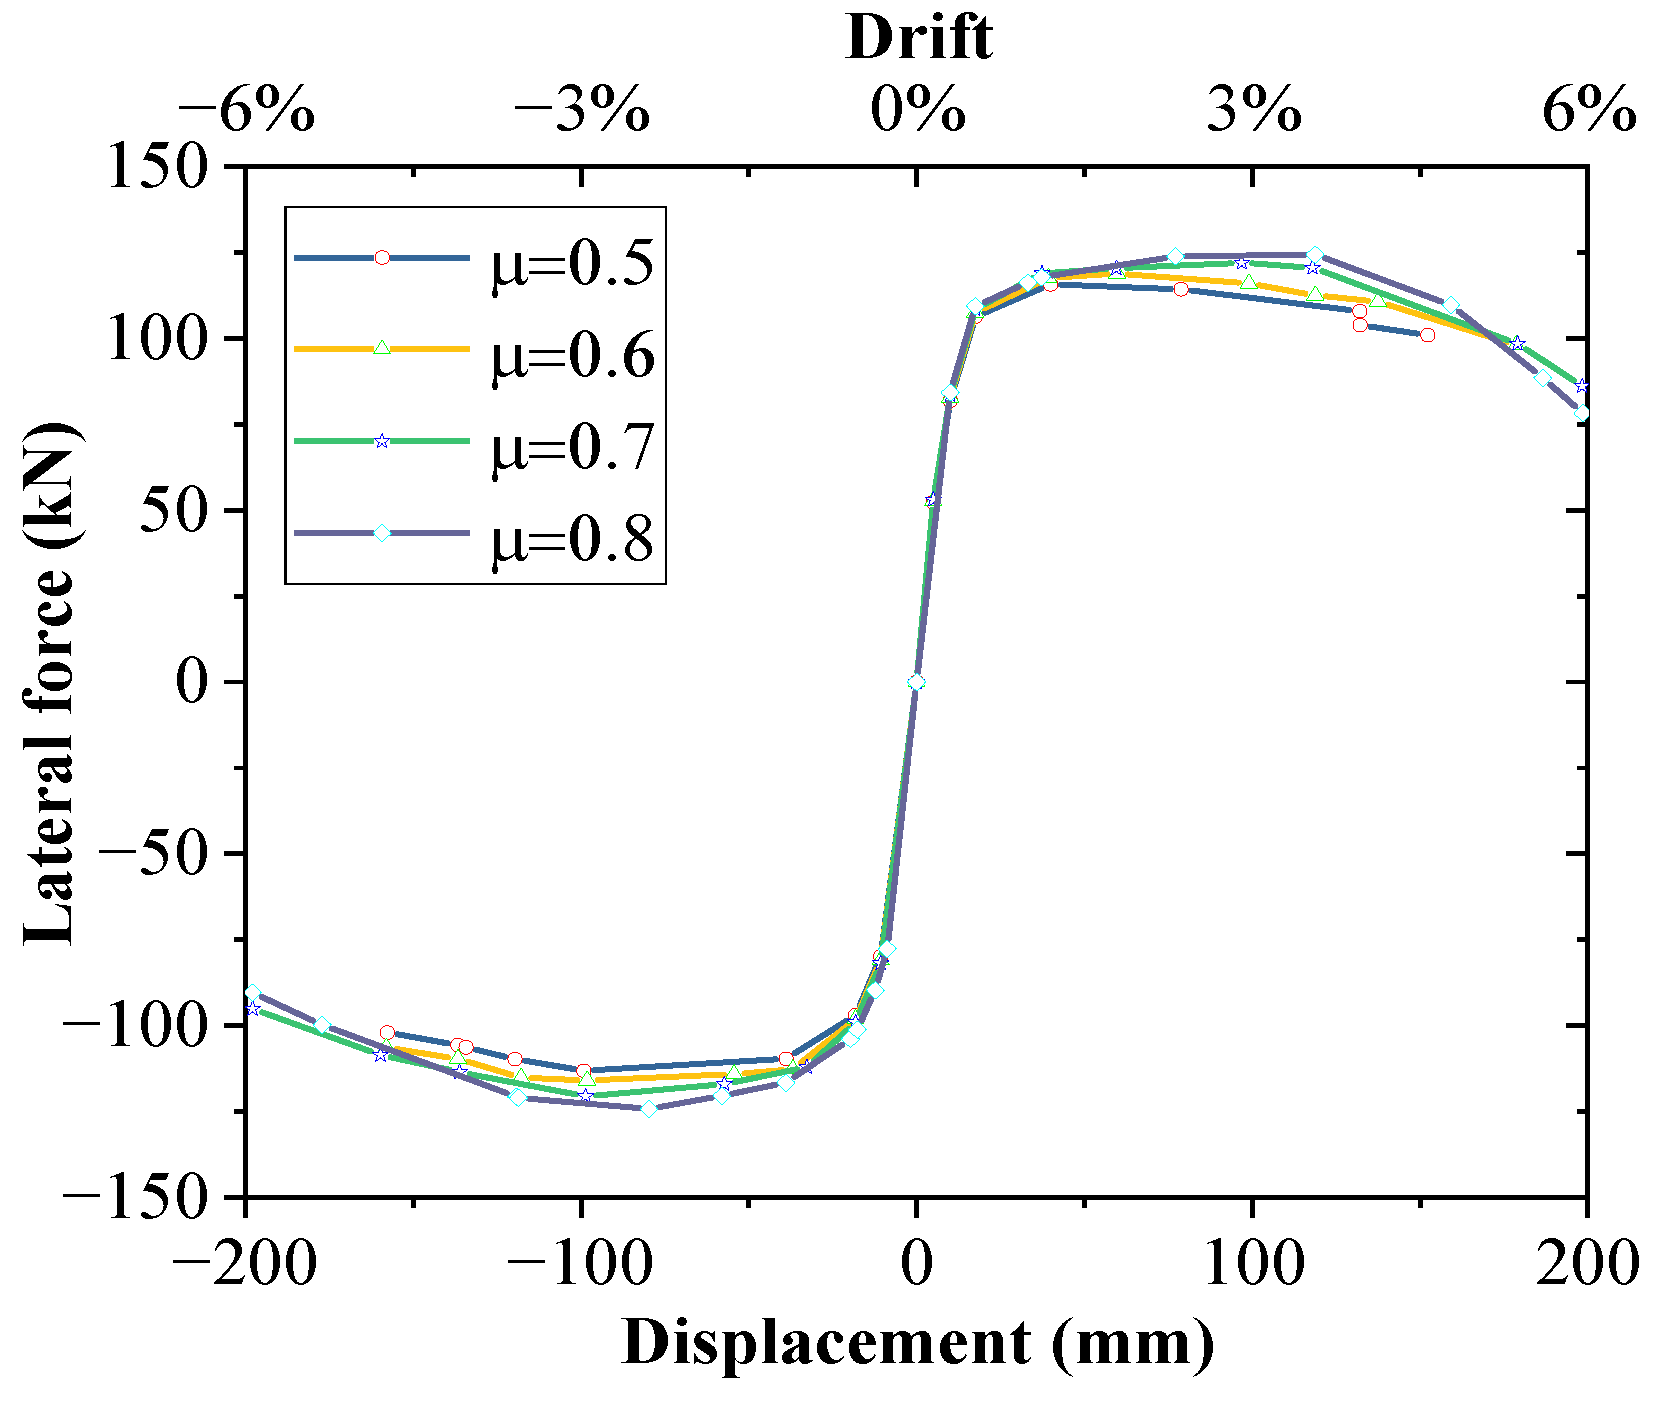
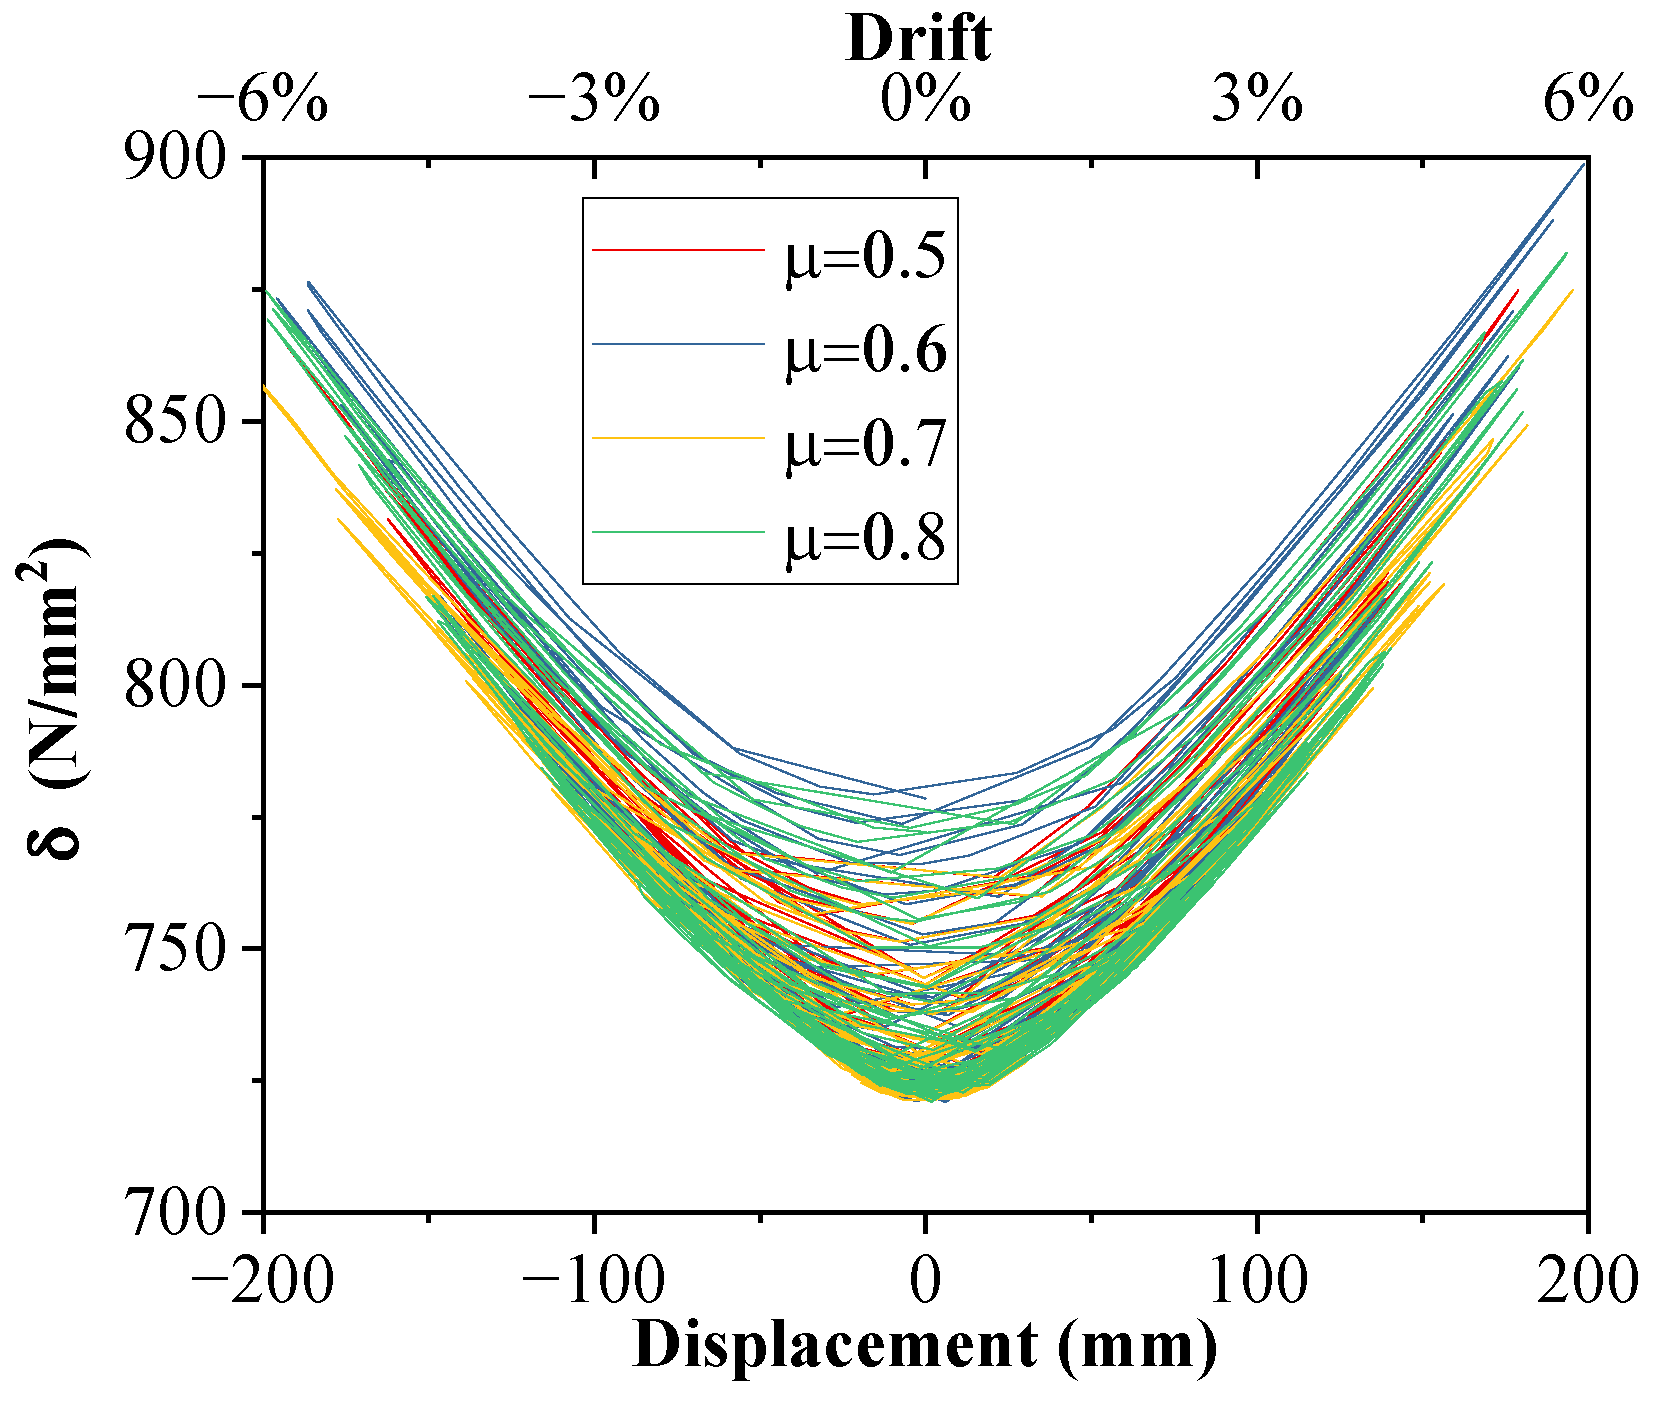
5.5. Friction Coefficient μ
6. Conclusions
- (1)
- The novel joint combines the advantages of mortise-tenon and the UPS, resulting in the internal joint exhibits excellent energy dissipation potential under the horizontal cyclic loads. The damage process of the joint under the horizontal loading can be divided into four stages: elasticity, yielding, plastic deformation extension, and failure stage. The deformation in the core zone of the internal joint involves the local damage and plastic deformation, as well as the relative slip deformation.
- (2)
- The damage mode of the tenon in the upper column is bend-shear damage, while the damage mode of the cup in the lower column is crushing damage. The damage mode of the tenon in the one-piece beam-slabs is bending and shear damage, while the other parts in the connection region is localized crushing damage.
- (3)
- Increasing the axial compression ratio enhances the shear bearing capacity of the joint but diminishes its ductility. The effective initial stress of the UPS and the concrete friction coefficient exhibit a minor influence on the seismic performance of the joint. Appropriately increasing the area and the effective initial stress of the UPS, the local reinforcement ratio of the core region, and the friction coefficient can improve the peak capacity, but they may accelerate the local damage of the core zone. This paper suggests that the value of the axial compression ratio should not exceed 0.3, the area of the UPS is between Asn=0.02 and Asn=0.1, the effective initial stress of the UPS is lower than 0.75fpu, and the friction coefficient of concrete interface is between 0.6 to 0.7.
- (4)
- This paper primarily investigates the internal joint using the refined finite element modeling. The findings require further validation through subsequent experimental research. Additionally, the overall performance of this new frame structure needs to be assessed in future work.
7. The Limitations and Challenges of the Study
Author Contributions
Funding
Institutional Review Board Statement
Informed Consent Statement
Data Availability Statement
Conflicts of Interest
Appendix A
| Region Part | Station | I | II | III | IV |
| Tenon of the upper column | Stress |  | |||
| Compression damage |  | ||||
| Tensile damage |  | ||||
| Tenon of the one-piece beam–slab | Stress |  | |||
| Compression damage |  | ||||
| Tensile damage |  | ||||
| p of the lower column | Stress | 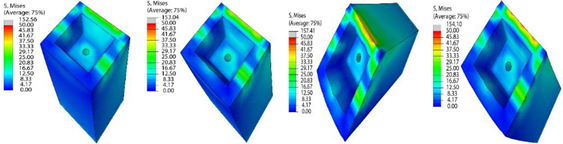 | |||
| Compression damage |  | ||||
| Tensile damage | 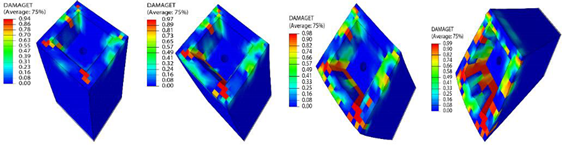 | ||||
References
- Xu, G.; Guo, T.; Li, A.Q. Review on self-centering damper for seismic resilient building structures. Structures 2023, 54, 58–77. [Google Scholar] [CrossRef]
- Li, J.; Wang, Y.; Lu, Z.; Xia, B. Shaking table test and numerical simulation of a superimposed reinforced concrete shear wall structure. Struct. Des. Tall Spec. Build. 2018, 27, e1412. [Google Scholar] [CrossRef]
- Li, J.; Fan, Q.; Lu, Z.; Wang, Y. Experimental study on seismic performance of T-shaped partly precast reinforced concrete shear wall with grouting sleeves. Struct. Des. Tall Spec. Build. 2019, 28, e1632. [Google Scholar] [CrossRef]
- Aninthaneni, P.K.; Dhakal, R.P.; Marshall, J.; Bothara, J. Nonlinear cyclic behavior of precast concrete frame sub-assemblies with dry end plate connection. Structures 2018, 14, 124–136. [Google Scholar] [CrossRef]
- Qing, Y.; Li, X.; Wang, C.L.; Zeng, B.; Meng, S. Experimental study on a dry-assembled precast concrete frame with buckling-restrained braces. Eng. Struct. 2023, 276, 115371. [Google Scholar] [CrossRef]
- Kurama, Y.C.; Sritharan, S.; Fleischman, R.B.; Restrepo, J.I.; Henry, R.S.; Cleland, N.M.; Ghosh, S.K.; Bonelli, P. Seismic-resistant precast concrete structures: State of the art. J. Struct. Eng. 2018, 144, 03118001. [Google Scholar] [CrossRef]
- Mohammed, K.; Jameel, M.; Ibrahim, Z.; Tan, C.G. Performance of a ductile hybrid post-tensioned beam-to-column connection for precast concrete frames under seismic loads: A review. Appl. Sci. 2021, 11, 7497. [Google Scholar] [CrossRef]
- Ghayeb, H.H.; Sulong, N.R.; Razak, H.A.; Mo, K.H.; Ismail, Z.; Hashim, H.; Gordan, M. A review of the seismic performance behavior of hybrid precast beam-to-column connections. Arch. Civ. Mech. Eng. 2023, 23, 35. [Google Scholar] [CrossRef]
- Ghayeb, H.H.; Razak, H.A.; Ramli Sulong, N.H. Performance of dowel beam-to-column connections for precast concrete systems under seismic loads: A review. Constr. Build. Mater. 2020, 237, 117582. [Google Scholar] [CrossRef]
- Priestley, M.J.N.; Macrae, G.A. Seismic tests of precast beam-to-column joint sub-assemblages with unbonded tendons. PCI J. 1996, 41, 64–81. [Google Scholar] [CrossRef]
- Hu, X.; Xue, W.; Qi, D. Experimental studies on precast post-tensioned concrete connections with composite beams and multi-storey columns. Mag. Concr. Res. 2020, 72, 1260–1275. [Google Scholar] [CrossRef]
- Xue, W.; Cheng, B.; Zheng, R. Seismic performance of non-prestressed and prestressed HPC frames under low reversed cyclic loading. J. Struct. Eng. 2011, 137, 1254–1262. [Google Scholar] [CrossRef]
- Song, M.; He, J.; Liu, Y.; Zhang, H.; Ge, C.; Jin, Y.; Liu, B.; Huang, S.; Liu, Y. Seismic behavior of three-story prestressed fabricated concrete frame under dynamic and low reversed cyclic loading. Adv. Civ. Eng. 2018, 2018, 7876908. [Google Scholar] [CrossRef]
- ACI 550.3-13; Design Specification for Unbonded Post-Tensioned Precast Concrete Special Moment Frames Satisfying ACI 374.1[S] (ACI 550.3-13) and Commentary. ACI-ASCE Committee: Montreal, QC, Canada, 2016.
- NZS 3101: 2006; Concrete Structures Standard. Standards New Zealand: Wellington, New Zealand, 2006.
- JGJ 224-2010; Technical Specification for Framed Structures Comprised of Precast Prestressed Concrete Components. China Ministry of Construction: Beijing, China, 2010. (In Chinese)
- JGJ/T 140-2019; Standard for Seismic Design of Prestressed Concrete Structure. China Ministry of Construction: Beijing, China, 2019. (In Chinese)
- T/CECS 992-2022; Technical Specification for Application of Prestressed Precast Concrete Frame. China Association for Engineering Construction Standardization: Beijing, China, 2022. (In Chinese)
- Huang, L.; Zhou, Z.; Patricia, M. Experimental investigation of friction-damped self-centering prestressed concrete beam-column connections with hidden corbels. J. Struct. Eng. 2019, 146, 04019228. [Google Scholar] [CrossRef]
- Wu, H.; Geng, F.; Cai, X.; Zhang, Y. Experimental investigation and seismic response behavior of a self-centering precast concrete frame with hysteretic dampers. Eng. Struct. 2021, 40, 112391. [Google Scholar]
- Mokhtarnejad, N.; Garmeh, V.; Shariatmadar, H. Numerical study of a novel SMA-based self-centering beam-to-column connection. Structures 2023, 47, 1033–1049. [Google Scholar] [CrossRef]
- Huang, L.; Zeng, B.; Zhou, Z.; Zhang, W.; Wei, Y.; Li, C. Seismic behavior and reliability of variable friction damped self-centering prestressed concrete frames considering bolt bearing. Soil Dyn. Earthq. Eng. 2023, 164, 107643. [Google Scholar] [CrossRef]
- Zhang, Y.; Zhu, P.; Shi, J. Flexural behavior of precast UHPC beam with prestressed bolted hybrid joint. Eng. Struct. 2020, 206, 110100. [Google Scholar] [CrossRef]
- Ngo, T.T.; Pham, T.M.; Hao, H. Effects of steel fibers and prestress levels on newly proposed exterior joints using SFRC and CFRP bolts. Eng. Struct. 2019, 205, 110083. [Google Scholar] [CrossRef]
- Wu, W.; Yang, L.; Li, L. Seismic behavior comparison of the post-tensioned unbonded prefabricated retaining blocks for highway bridges. Soil Dyn. Earthq. Eng. 2022, 162, 107424. [Google Scholar] [CrossRef]
- Xiong, X.; Xie, Y.; Yao, G.; Liu, J.; Yan, L.; He, L. Experimental Study on seismic performance of precast pretensioned prestressed concrete beam-column interior joints using UHPC for connection. Materials 2022, 15, 5791. [Google Scholar] [CrossRef] [PubMed]
- Koshikawa, T. Moment and energy dissipation capacities of post-tensioned precast concrete connections employing a friction device. Eng. Struct. 2017, 138, 170–180. [Google Scholar] [CrossRef]
- Rodgers, G.W.; Solberg, K.M.; Chase, J.G.; Mander, J.B.; Bradley, B.A.; Dhakal, R.P.; Li, L. Performance of a damage-protected beam-column subassembly utilizing external HF2V energy dissipation devices. Earthq. Eng. Struct. Dyn. 2008, 37, 1549–1564. [Google Scholar] [CrossRef]
- Yu, P.; Yang, Q.S.; Law, S.S. Lateral performances of traditional wooden frame with loose penetrated mortise-tenon connection and column foot models. J. Build. Eng. 2022, 47, 103739. [Google Scholar] [CrossRef]
- Zhang, B.; Xie, Q.; Li, S.; Zhang, L.; Wu, Y. Effects of gaps on the rotational performance of traditional straight mortise-tenon joints. Eng. Struct. 2022, 260, 114231. [Google Scholar] [CrossRef]
- Ya, J.; Lei, W.; He, S. Effect of shear force on the rotational performance of straight mortise-tenon joints. Structures 2022, 41, 501–510. [Google Scholar]
- Sun, Z.; Xiang, P.; Jia, L. Seismic response and kinematic mechanisms of single-story pavilion-type timber frame based on shaking table test. Structures 2022, 45, 1701–1716. [Google Scholar] [CrossRef]
- Lu, W.; Qiu, H.; Lu, Y. Theoretical model for the analysis of rotational behavior of penetrated mortise-tenon joints in traditional timber structures. Int. J. Archit. Herit. 2023, 18, 709–724. [Google Scholar] [CrossRef]
- Lin, Y.; Chun, Q.; Zhang, C. Research on seismic performance of traditional Chinese hall-style timber buildings in the Song and Yuan dynasties (960-1368 AD): A case study of the main hall of Baoguo Temple. J. Wood Sci. 2022, 68, 1–25. [Google Scholar] [CrossRef]
- Panoutsopoulou, L.; Mouzakis, C. Experimental investigation of the behavior of traditional timber mortise-tenon T-joints under monotonic and cyclic loading. Constr. Build. Mater. 2022, 348, 128655. [Google Scholar] [CrossRef]
- Zhang, B.; Xie, Q.; Liu, Y. Effects of gaps on the seismic performance of traditional timber frames with straight mortise-tenon joint: Experimental tests, energy dissipation mechanism and hysteretic model. J. Build. Eng. 2022, 58, 105019. [Google Scholar] [CrossRef]
- Ding, T.; Xiao, J.; Chen, E.; Khan, A.U.R. Experimental Study of the Seismic Performance of Concrete Beam-Column Frame Joints with DFD Connections. J. Struct. Eng. 2020, 146, 04020036. [Google Scholar] [CrossRef]
- Liu, X.; Feng, K.; He, C.; Zhao, L. Prototype test of the mechanical behavior and failure mechanism of segment structure with distributed mortises and tenons. Struct. Concr. 2022, 23, 2837–2851. [Google Scholar] [CrossRef]
- Cabaleiro, M.; Conde, B.; González-Gaya, C.; Barros, B. Removable, Reconfigurable, and Sustainable Steel Structures: A State-of-the-Art Review of Clamp-Based Steel Connections. Sustainability 2023, 15, 7808. [Google Scholar] [CrossRef]
- Ferreira Silva, M.; Jayasinghe, L.B.; Waldmann, D.; Hertweck, F. Recyclable Architecture: Prefabricated and Recyclable Typologies. Sustainability 2020, 12, 1342. [Google Scholar] [CrossRef]
- Cai, G.; Xiong, F.; Xu, Y.; Si Larbi, A.; Lu, Y.; Yoshizawa, M. A Demountable Connection for Low-Rise Precast Concrete Structures with DfD for Construction Sustainability-A Preliminary Test under Cyclic Loads. Sustainability 2019, 11, 3696. [Google Scholar] [CrossRef]
- Li, C.; Zhuo, W.; Lin, K. Experimental study on flexural behavior of segmental precast large-cantilevered prestressed concrete cap beam. Structures 2023, 57, 105166. [Google Scholar] [CrossRef]
- Wang, J.; Zhou, W. Experimental and numerical response of unbonded post-tensioned rocking wall under lateral cyclic loading. J. Build. Eng. 2023, 66, 105827. [Google Scholar] [CrossRef]
- Zhang, C.; Li, H.; Gao, W. Development of a novel friction damped joint for damage-plasticity control of precast concrete walls. Eng. Struct. 2020, 219, 110850. [Google Scholar] [CrossRef]
- CECS 43-2021; Technical Specification for Joints and Connections of Precast Concrete Frame. China Association for Engineering Construction Standardization: Beijing, China, 2021. (In Chinese)
- Yu, J.; Zhang, W.; Tang, Z.; Guo, X.; Pospíšil, S. Seismic behavior of precast concrete beam-column joints with steel strand inserts under cyclic loading. Eng. Struct. 2020, 216, 110766. [Google Scholar] [CrossRef]
- Lubliner, J.; Oliver, J.; Oller, S. A plastic-damage model for concrete. Int. J. Solids Struct. 1989, 25, 299–326. [Google Scholar] [CrossRef]
- GB 50010-2010; Code for Design of Concrete Structures. China Academy of Building Research: Beijing, China, 2015.
- McKenna, F. Object Oriented Finite Element Programming: Frameworks for Analysis, Algorithms and Parallel. Ph.D. Thesis, Computing University of California, Berkeley, CA, USA, 1997. [Google Scholar]
- Clough, R.W. Effect of stiffness degradation on earthquake ductility requirements. In Proceedings of the Japan Earthquake Engineering Symposium, Tokyo, Japan, October 1966. [Google Scholar]
- Yang, C.; Xie, L.; Li, A. A dry-connected rotational friction dissipative beam-to-column joint for precast concrete frame: Full-scale experimental and numerical investigations. J. Build. Eng. 2022, 54, 104685. [Google Scholar] [CrossRef]
- Abaqus Analysis User Guide, Version 6.14. Available online: https://ceae-server.colorado.edu/v2016/books/usb/default.htm (accessed on 1 September 2024).
- JGJ/T101-2015; Specification for Seismic Test of Buildings. China Ministry of Construction: Beijing, China, 2016. (In Chinese)
- Ding, T.; Xiao, J.; Zhang, Q.; Akbarnezhad, A. Experimental and numerical studies on design for deconstruction concrete connections: An overview. Adv. Struct. Eng. 2018, 21, 2198–2214. [Google Scholar] [CrossRef]
- Brenkus, N.R.; Tatar, J.; Hamilton, H.R.; Consolazio, G.R. Simplified finite element modeling of post-tensioned concrete members with mixed bonded and unbonded tendons. Eng. Struct. 2019, 179, 387–397. [Google Scholar] [CrossRef]
- Jones, C.A.; Dameron, R.; Sircar, M. Improving the state of the art in FEM analysis of PCCVs with bonded and unbonded prestress tendons. Nucl. Eng. Des. 2015, 295, 782–788. [Google Scholar] [CrossRef]
- Liang, X.W.; Wang, Y.J.; Tao, Y.; Deng, M.K. Seismic performance of fiber-reinforced concrete interior beam-column joints. Eng. Struct. 2016, 126, 432–445. [Google Scholar] [CrossRef]
- Zhang, Y.; Li, B.; Li, Z.; Ma, G.; Liu, Y. Seismic performance of interior beam-column joints in reinforced glazed hollow bead insulation concrete frames. Eng. Struct. 2020, 228, 111494. [Google Scholar] [CrossRef]
- JGJ 369-2016; Code for Design of Prestressed Concrete Structure. China Ministry of Construction: Beijing, China, 2016. (In Chinese)


| Dilation Angle | Eccentricity | fbo/fco | k | Viscosity Parameter |
| 38 | 0.1 | 1.16 | 0.6667 | 0.0005 |
Disclaimer/Publisher’s Note: The statements, opinions and data contained in all publications are solely those of the individual author(s) and contributor(s) and not of MDPI and/or the editor(s). MDPI and/or the editor(s) disclaim responsibility for any injury to people or property resulting from any ideas, methods, instructions or products referred to in the content. |
© 2024 by the authors. Licensee MDPI, Basel, Switzerland. This article is an open access article distributed under the terms and conditions of the Creative Commons Attribution (CC BY) license (https://creativecommons.org/licenses/by/4.0/).
Share and Cite
Wang, J.; Zhang, C.; Zhang, W. Seismic Performance Analysis of the Internal Joint in the New Demountable Fabricated Concrete Frame with Prestressed Mortise–Tenon Connections. Sustainability 2024, 16, 7898. https://doi.org/10.3390/su16187898
Wang J, Zhang C, Zhang W. Seismic Performance Analysis of the Internal Joint in the New Demountable Fabricated Concrete Frame with Prestressed Mortise–Tenon Connections. Sustainability. 2024; 16(18):7898. https://doi.org/10.3390/su16187898
Chicago/Turabian StyleWang, Junwei, Cheng Zhang, and Wenxue Zhang. 2024. "Seismic Performance Analysis of the Internal Joint in the New Demountable Fabricated Concrete Frame with Prestressed Mortise–Tenon Connections" Sustainability 16, no. 18: 7898. https://doi.org/10.3390/su16187898