Abstract
Carbon farming has become increasingly popular as it integrates agriculture, forestry, and diverse land use practices, all crucial for implementing European strategies aimed at capturing 310 million tons of carbon dioxide from the atmosphere. These farming methods were proven to reliably increase the amount of carbon stored in the soil. However, there is a lack of discussion and consensus regarding the standards used to report these values and their implications. This article analyzes carbon sequestration rates, calculation methodologies, and communication procedures, as well as potential co-benefits and best practices. The average carbon sequestration rates in major staple crops range from very low values (0–0.5 Mg/ha/yr) to medium values (1–5 Mg/ha/yr). Scientific agricultural experiments in key global staple crops demonstrate positive rates of 4.96 Mg C ha−1 yr−1 in wheat–maize rotations and 0.52–0.69 Mg C ha−1 yr−1 in rice–wheat rotations. In agriculture, carbon sequestration rates are reported using different terms that are not consistent and pose communication challenges. This assessment involves a systematic review of the scientific literature, including articles, reviews, book chapters, and conference papers indexed in Scopus from 2001 to 2022. Specifically, this review focuses on long-term experiments, meta-analyses, and reviews that report an increase in soil carbon stock. The research trends observed, through a VOSviewer 1.6.18 analysis, show a steadily increasing interest in the field of carbon sequestration.
1. Introduction
Attaining net-zero CO2 emissions is essential to keep global warming within 1.5 °C or 2 °C limits [1]. In recent years, atmospheric CO2 levels have reached a record high of 421 parts per million (ppm), representing a 50% increase since the beginning of the industrial revolution [2]. It is estimated that for every 1000 Gt of CO2 emitted by human activity, the global surface temperature rises by approximately 0.45 °C [3]. Mitigation strategies proposed in CO2 reduction scenarios aim to decrease emissions and enhance carbon dioxide removal (CDR) strategies [4].
In agriculture, CDR strategies aim to increase carbon storage in long-lasting reserves, such as the soil, through the use of plant residues or the accumulation of organic materials [5]. Soils are one of the two main carbon reservoirs on Earth, holding more carbon than the atmosphere and terrestrial vegetation combined [6]. Soils represent intricate ecosystems where the equilibrium of soil organic matter (SOM) and living organisms is crucial for decomposing organic substances, recycling minerals, assimilating plant debris, and facilitating plant development [7]. Nevertheless, SOM loss in agricultural land has resulted in a 50 to 66% reduction in soil fertility compared to past levels, with a decline of 42 to 78 gigatons of carbon, according to historical data [8].
Protecting SOM in agricultural soils is necessary to increase soil carbon stocks and decrease climate change effects in croplands [9]. The Global Assessment of Soil Degradation (GLASOD) evaluated thirteen types of degradation, emphasizing wind erosion, water erosion, and physical compaction, as the most impacting in agricultural soils [10]. These events are worsened by intensive agriculture practices, such as overuse of fertilizers, or the use of intensive tillage [11]. Rattan Lal [12] highlighted the connection between climate change, agriculture, and soil health and proposed carbon farming as a solution to these critical issues, promoting carbon sequestration (CS), crop resiliency, and soil fertility [13].
CS in the Agriculture, Forestry, and Other Land Use (AFOLU) sector can play a significant role in reaching net-zero emissions sooner across multiple global socio-economic trajectories while enhancing existing systems. To achieve this goal, it is crucial to speed up the adoption of carbon sequestration practices in major crops, especially in staple cereals like maize, wheat, and rice—which cover 714 million hectares and represent 32% of the world’s primary crop production, according to FAO [14]. Increasing CS in these cereal crops can bring multiple co-benefits, in particular for the Sustainable Development Goals (SDGs) [15]. Lal [8] states that increasing one ton of soil carbon stock in degraded cropland soils may increase crop yield by 20 to 40 kg per hectare (kg/ha) for wheat and 10 to 20 kg/ha for maize.
The carbon content of agricultural lands is usually determined by taking soil samples at a specific depth (e.g., 0–30 cm depth). The samples are then typically analyzed using a dry combustion method, which provides the soil carbon stock for the precise sample location. SOM holds between 55 and 60% of carbon by mass [16]. FAO [17] proposes a method (Equation 1) to find the soil organic carbon (SOC) stock of a sample based on physical measured properties:
where
- = soil organic carbon stock (in Mg C ) of the depth increment i.
- = organic carbon content (mg C g ) of the fine soil fraction (<2 mm) in the depth increment i.
- BD = the mass of the fine earth per volume of fine earth of the depth increment i, (g fine earth fine earth = dry soil mass [g] − coarse mineral fragment mass [g])/(soil sample volume [] − coarse mineral fragment volume []).
- = the volumetric coarse fragment content of the depth increment i.
- = thickness (depth, in cm) of the depth increment i.
- 0.1 = conversion factor for Mg C to Mg C .
In recent years, advancements in elemental analyzers paired with statistical methods brought a decrease to uncertainties associated with SOC sampling, streamlining the process for scientists and farmers by reducing the time and costs of lab work, which is documented across various crop models [18].
However, knowing the carbon content of a field is fundamental for assessing CS rates. CS practices include improving crop varieties, improving irrigation strategies, conserving soil moisture, diversifying farming practices, and promoting agroforestry and sustainably sourced agricultural inputs, in contrast with more greenhouse gas-intensive alternatives [19,20]. But comprehending and forecasting the potential for carbon sequestration associated with different practices remains a work in progress due to the complexities found within agricultural systems. SOC content shows high spatial and temporal variability. The decomposition process of labile-C and resistant-C converts a fraction of the carbon into the light-C pool, and later, a fraction of the decomposed light-C turns into the heavy-C pool. Eventually, the decomposition of the heavy-C pool produces CO2, reducing sequestration and increasing by several years the time to process it [21,22].
The objective of this systematic review is to provide readers with an updated overview of CS rates for carbon farming practices in maize, wheat, and rice. For this aim, the authors propose a comprehensive analysis of the existing scientific literature and description of the methods, gaps, and trends in practices employed to declare and quantify CS rates. The goal is to encourage further research in the field and promote standardized reporting to ease comparison and data sharing for future experiments, enabling more informed decision-making.
2. Materials and Methods
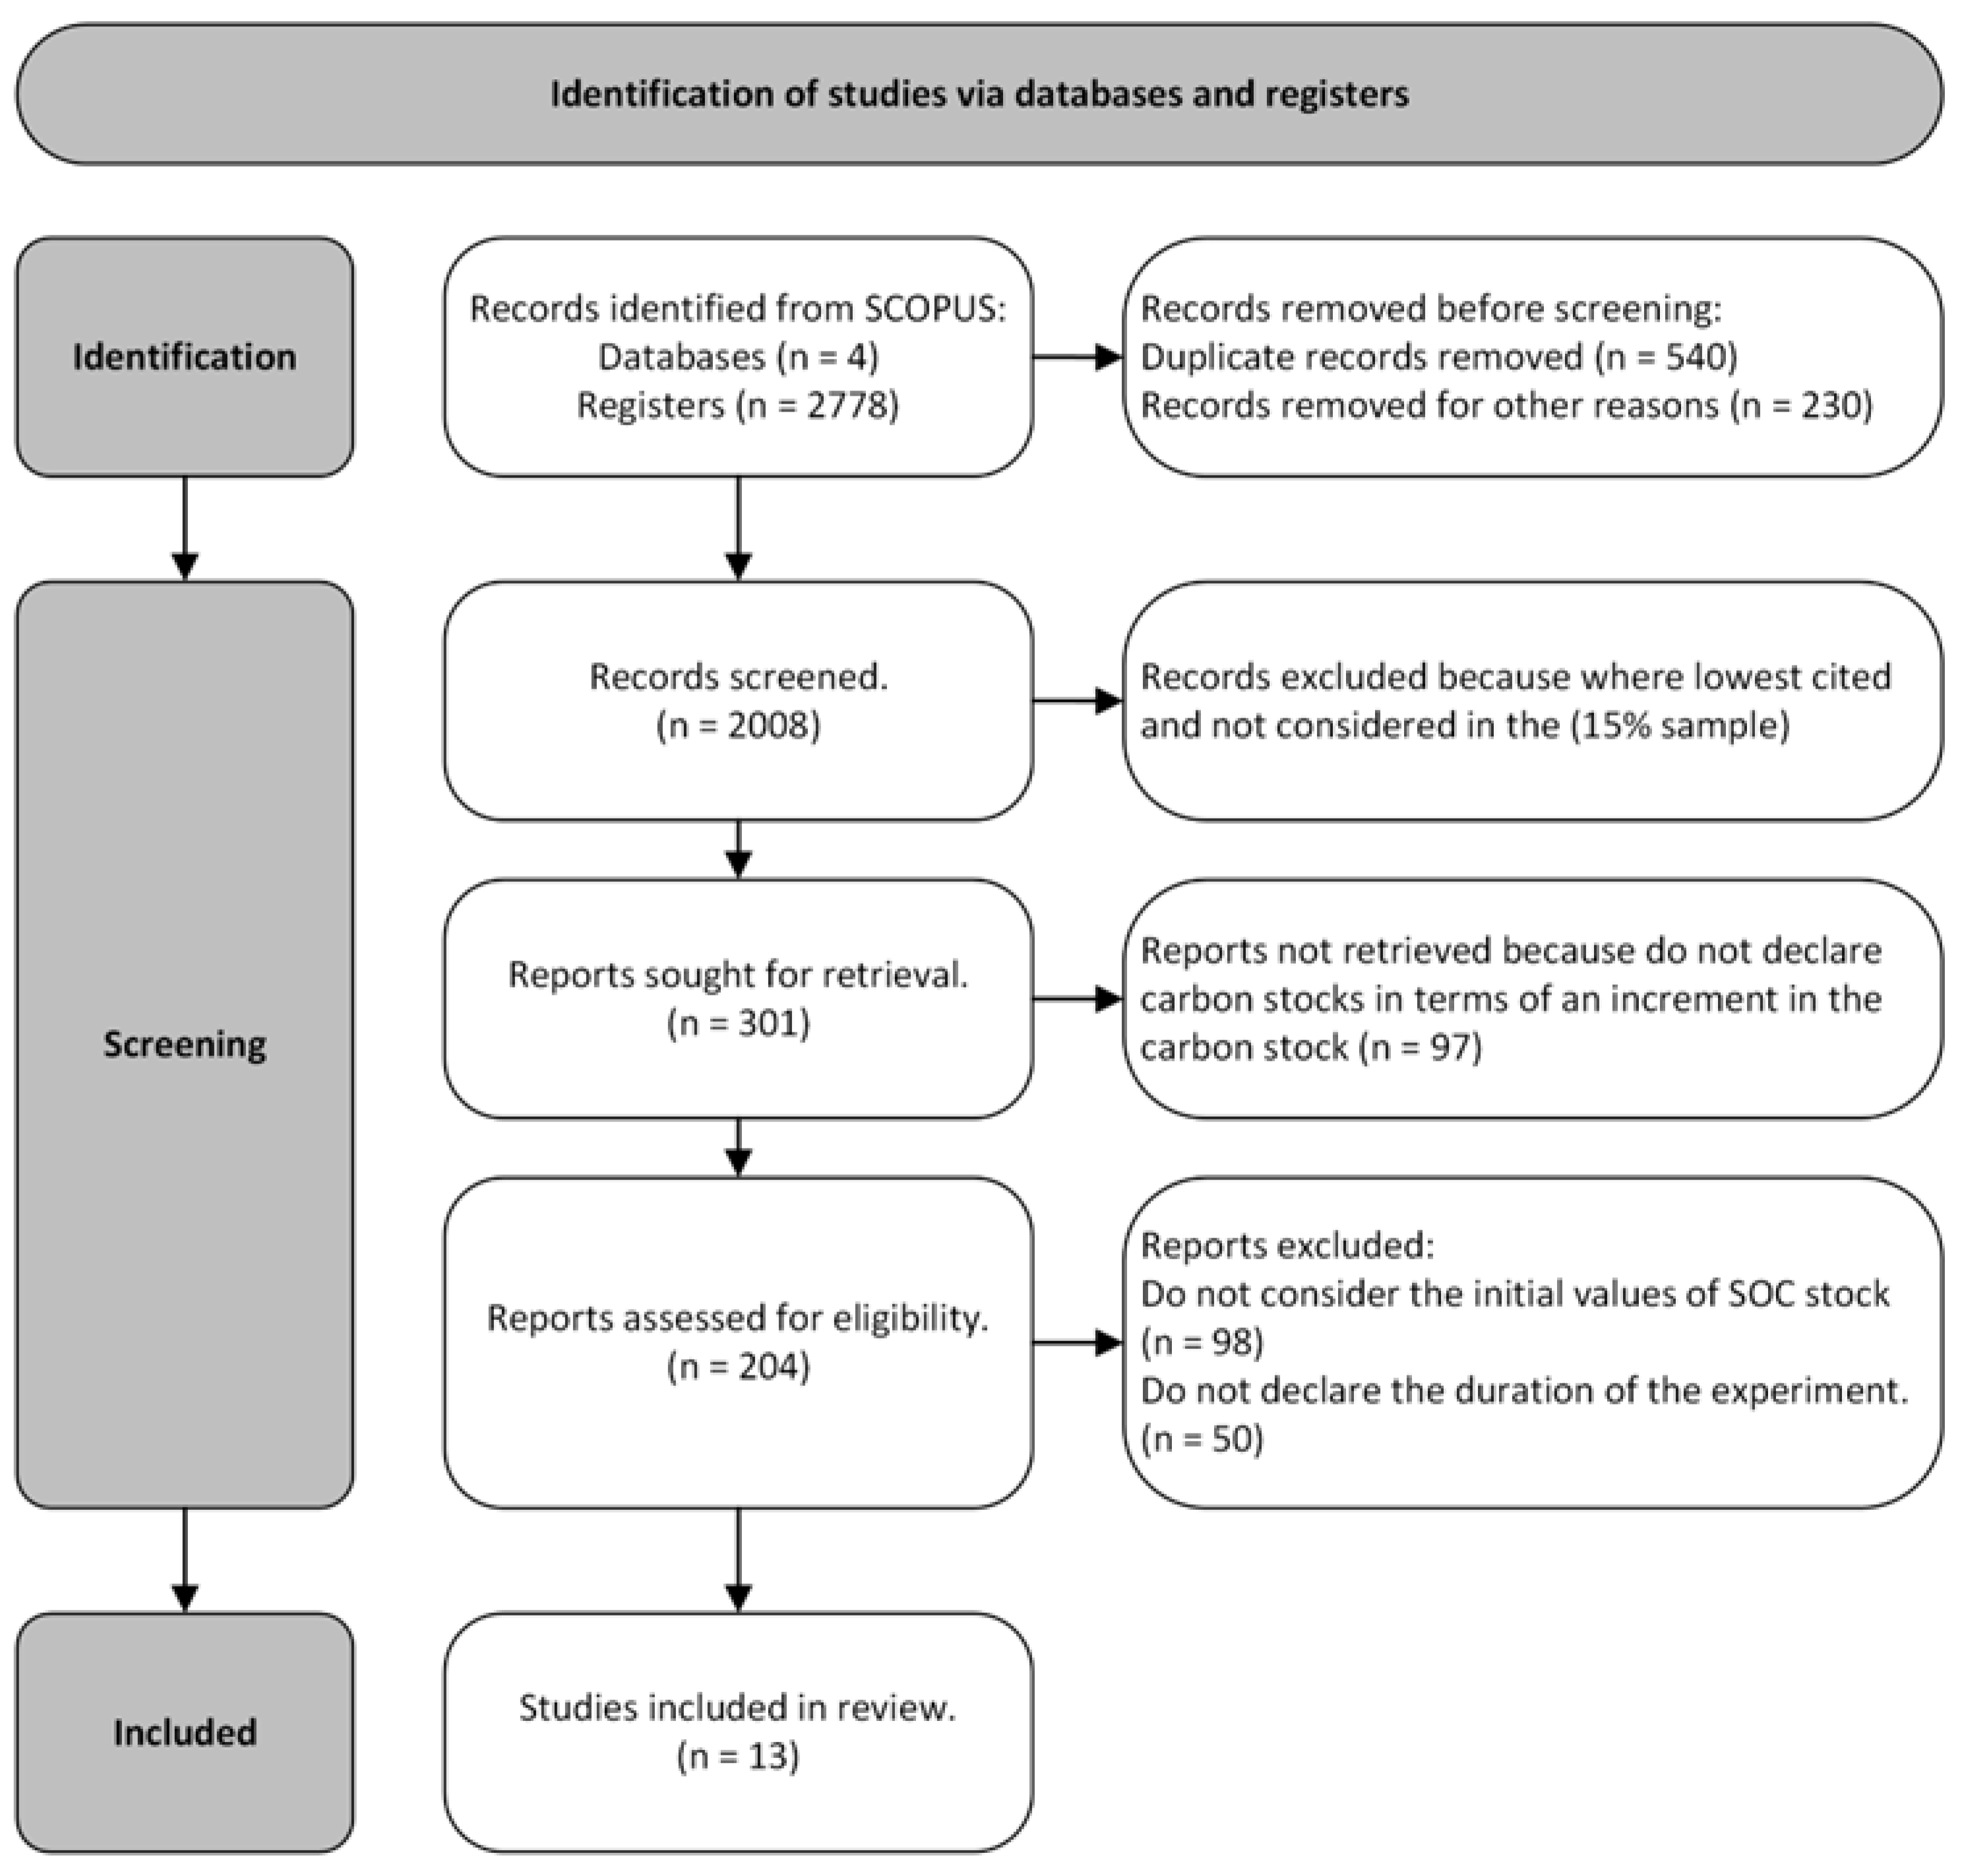
In the first step, a systematic review was conducted based on the PRISMA methodology (Figure 1), using a collection of scientific documents on carbon farming studies in the aforementioned cereal staple crops (maize, wheat, and rice) [23]. The documents considered in the analysis (including articles, reviews, book chapters, and conference papers) were published in the Scopus database from 2001 to 2022.

Figure 1.
Database process of selection based on PRISMA methodology [23].
In the document analysis, a four-criteria database search was performed, using the conditions listed below in the queries:
In all queries, the keywords “agriculture” or “carbon sequestration” or “carbon storage” or “C sequestration” or “C storage” were included.
For the first query, the keywords added were “crops” and “soil”.
For the second query, the keyword added was “maize”.
For the third query, the keyword added was “wheat”.
For the fourth query, the keyword added was “rice”.
A total of 1660 documents were found for the keywords “crops and soil”, 412 for maize, 399 for wheat, and 307 for rice. The selection process is summarized in the PRISMA flow diagram (Figure 1).
Once the documents included were identified, they were divided into two categories:
Documents reporting field experiments are commonly based on long-term experiments where CS rates are found through laboratory methods. These methods require soil or biomass samples collected from the field at specific intervals. Variables are shown using analytical machinery or chemical reactions, and samples are taken throughout the experiment [24].
Documents reporting modelling experiments typically involve mathematical–statistical models applied using software simulating physical relationships. These models can simulate various variables, such as weather conditions or soil carbon stock flows before the cultivation stage. Data on carbon fluxes and informatics tools are required to conduct these experiments [25].
This review describes the carbon sequestration rates, and the methodologies used for estimation. Additionally, for the selected studies, it provides a brief overview of crop management, the soil profile, the duration of the experiment, and its objectives.
In the next step, to clarify and evaluate the potential impact of these results, the values were classified using the classification proposed by Toensmeier (Table 1).

Table 1.
Proposal of ranges to evaluate CS rates in crops by Toensmeier [26].
At the end, to provide an overview of the practices’ trends and co-effects linked to CS practices in the main staple crops listed, a bibliometric analysis was performed using the same databases from Scopus. The co-occurrence bibliometric analysis on all databases listed was conducted using VOSviewer (version 1.6.18). VOSviewer is free software (https://www.vosviewer.com/ (accessed on 15 November 2023)) developed by Van Eck and Waltman, which is useful for analyzing bibliometric networks among published papers. VOSviewer was employed to construct bibliometric maps displaying the research trends of CS in the main staple crops [27].
3. Results
3.1. Carbon Sequestration Rate Analysis
The systematic review of the documents showed that the term “carbon” is used together with other terms and units to report CS rates (Table 2), which are not consistent. This inconsistency poses a challenge when attempting to compare studies and increases uncertainty about the measurement methods used. For instance, in the study by Kumara et al. [28], the reported carbon values lacked specification in terms of SOC stock. Similarly, in the report by Aller et al. [29], the increase in SOC stock was not stated in terms of time, making it difficult to understand the temporal aspects of the increase or the relationship between soil, weather, and crop management. To enable a meaningful comparison of documented rates, only the terms that effectively capture changes in carbon stocks over time were selected as functional units for presenting carbon stock changes (Table 2).
Table 2.
Definitions of the main terms used in the documents reviewed for CS in the case of its feasibility.
The outcomes presented in Table 2 reveal that, in certain instances, the units employed fail to account for the quantity of carbon sequestered through changes in land management options. For example, the use of the term “carbon pool” may stand for the overall carbon content within a pool, leading to discrepancies. Additionally, variations in the selected time periods result in differences in the measured carbon. Terms such as “equivalent soil mass method”, “soil organic carbon”, “STC”, “TCs”, “total carbon”, or “total organic carbon” contribute to these discrepancies. Lastly, the NECB incorporates emissions from soil mineralization, which falls outside the scope of comparison and data collection parameters in this study.
After considering these results, the following statements were formulated to enhance understanding:
The reviewed documents that do not declare the first C stock, final C stock, and evaluation period were not listed in Appendix A, Table A1 and Table A3.
For an improved comparison, the units used to express CS rates were standardized to Megagrams of carbon per hectare of soil per year (Mg C ha−1 yr−1), with all mathematical conversions performed accordingly [17].
The analysis performed in documents reporting field experiments (Appendix A, Table A1) revealed that CS rates were measured by analytical methods, such as SOC sampling in the top layer of soil, followed by processing the samples with dry combustion in automated analyzers or the Walkley–Black method (a wet chemical oxidation method) between two time periods. Analytical methods were predominant, with only a few instances where biomass was considered as an SOC input. The widely used Walkley–Black method consists in heating SOC and potassium dichromate for the reaction [42]. In the Walkley–Black method, the main disadvantage is incomplete oxidation. In the average oxidation, SOC ranges from 27 to 100% depending on the soil characterization, SOM, and heating method [43]. In comparison with elemental analyzers, the sum of SOC and soil inorganic carbon could reduce the uncertainty of the measurement [44].
Measuring and monitoring stored carbon over time are challenging also due to errors in SOC stock assessment caused by depth measurements over time [45]. SOC deposited in topsoil is considered light-C, the youngest and biologically most reactive, with turnover times between a few months and a few years. However, CS requires storing it in long-term secure pools to prevent immediate remission. Nevertheless, light-C must undergo several processes to be transformed into heavy-C forms, which are the most resistant to further degradation and can remain in the soil for hundreds or even thousands of years [22]. For instance, wind erosion can carry away the light-C layers, while rainfall erosion can wash away biological organic matter, which is necessary to accelerate biomass decomposition [46]. Additionally, carbon undergoes aerobic processes that release a percentage of the sequestered carbon in the mineralization of soil [47].
The observation period is another parameter in the estimation of CS rates. Most of the analyzed documents were experiments conducted for periods ranging from 3 to 7 years or even over 15 years. The relevance of time was explained in different soil layers by Yu et al. [22]. Changes in land use and/or land management can significantly affect soil carbon stocks. SOC measurements show high spatial and temporal variability in the decomposition process of labile-C, and resistant-C converts a fraction of the carbon into the light-C pool, and later, a fraction of the decomposed light-C turns into the heavy-C pool. Detecting an increase in soil carbon content can take several years, and different approaches are used to quantify carbon removal in current frameworks for carbon farming certificates, as acknowledged by the European Commission [48].
In contrast, the analysis performed in documents reporting modelling (Appendix A, Table A2) shows that experiments employ a variety of methods, such as a statistical analysis, Duncan’s Multiple Range Test, and agricultural crop models like CENTURY, Daycent, DSSAT-CERES, SALUS, Roth-C, and APSIM, among others [18]. These methods rely on statistical techniques that use climate data, soil properties, and crop data based on their phenology from earlier field experiments to simulate longer periods under different management conditions [49].
The implementation of crop models and laboratory methodologies remains limited due to their intricate nature and challenges in simulating weather conditions and diverse cropping systems, like cover cropping or crop rotation strategies [50,51]. Despite these complexities; long-term experiments have demonstrated the potential of carbon sequestration in staple crops and its advantageous impact [52].
In Table 3, the main differences between field experiments and modelling experiments are listed as a result of the comparison between Table A2 and Table A4 of Appendix A.
Table 3.
Main differences between analytical and statistical and data modeling methods.
Table 4 summarizes the average rate of CS of the documents analyzed in Appendix A, Table A1 and Table A3. It is important to note that some studies in Appendix A, Table A1 and Table A3, did not account for soil mineralization, the effects of soil erosion, and the environmental impacts generated by the management. The tables solely declare the potential for sequestration in the measured pool through stock increments.
Table 4.
Average of CS rates on main staple crops.
3.2. Research Trends in the Field of Carbon Sequestration through VOSviewer
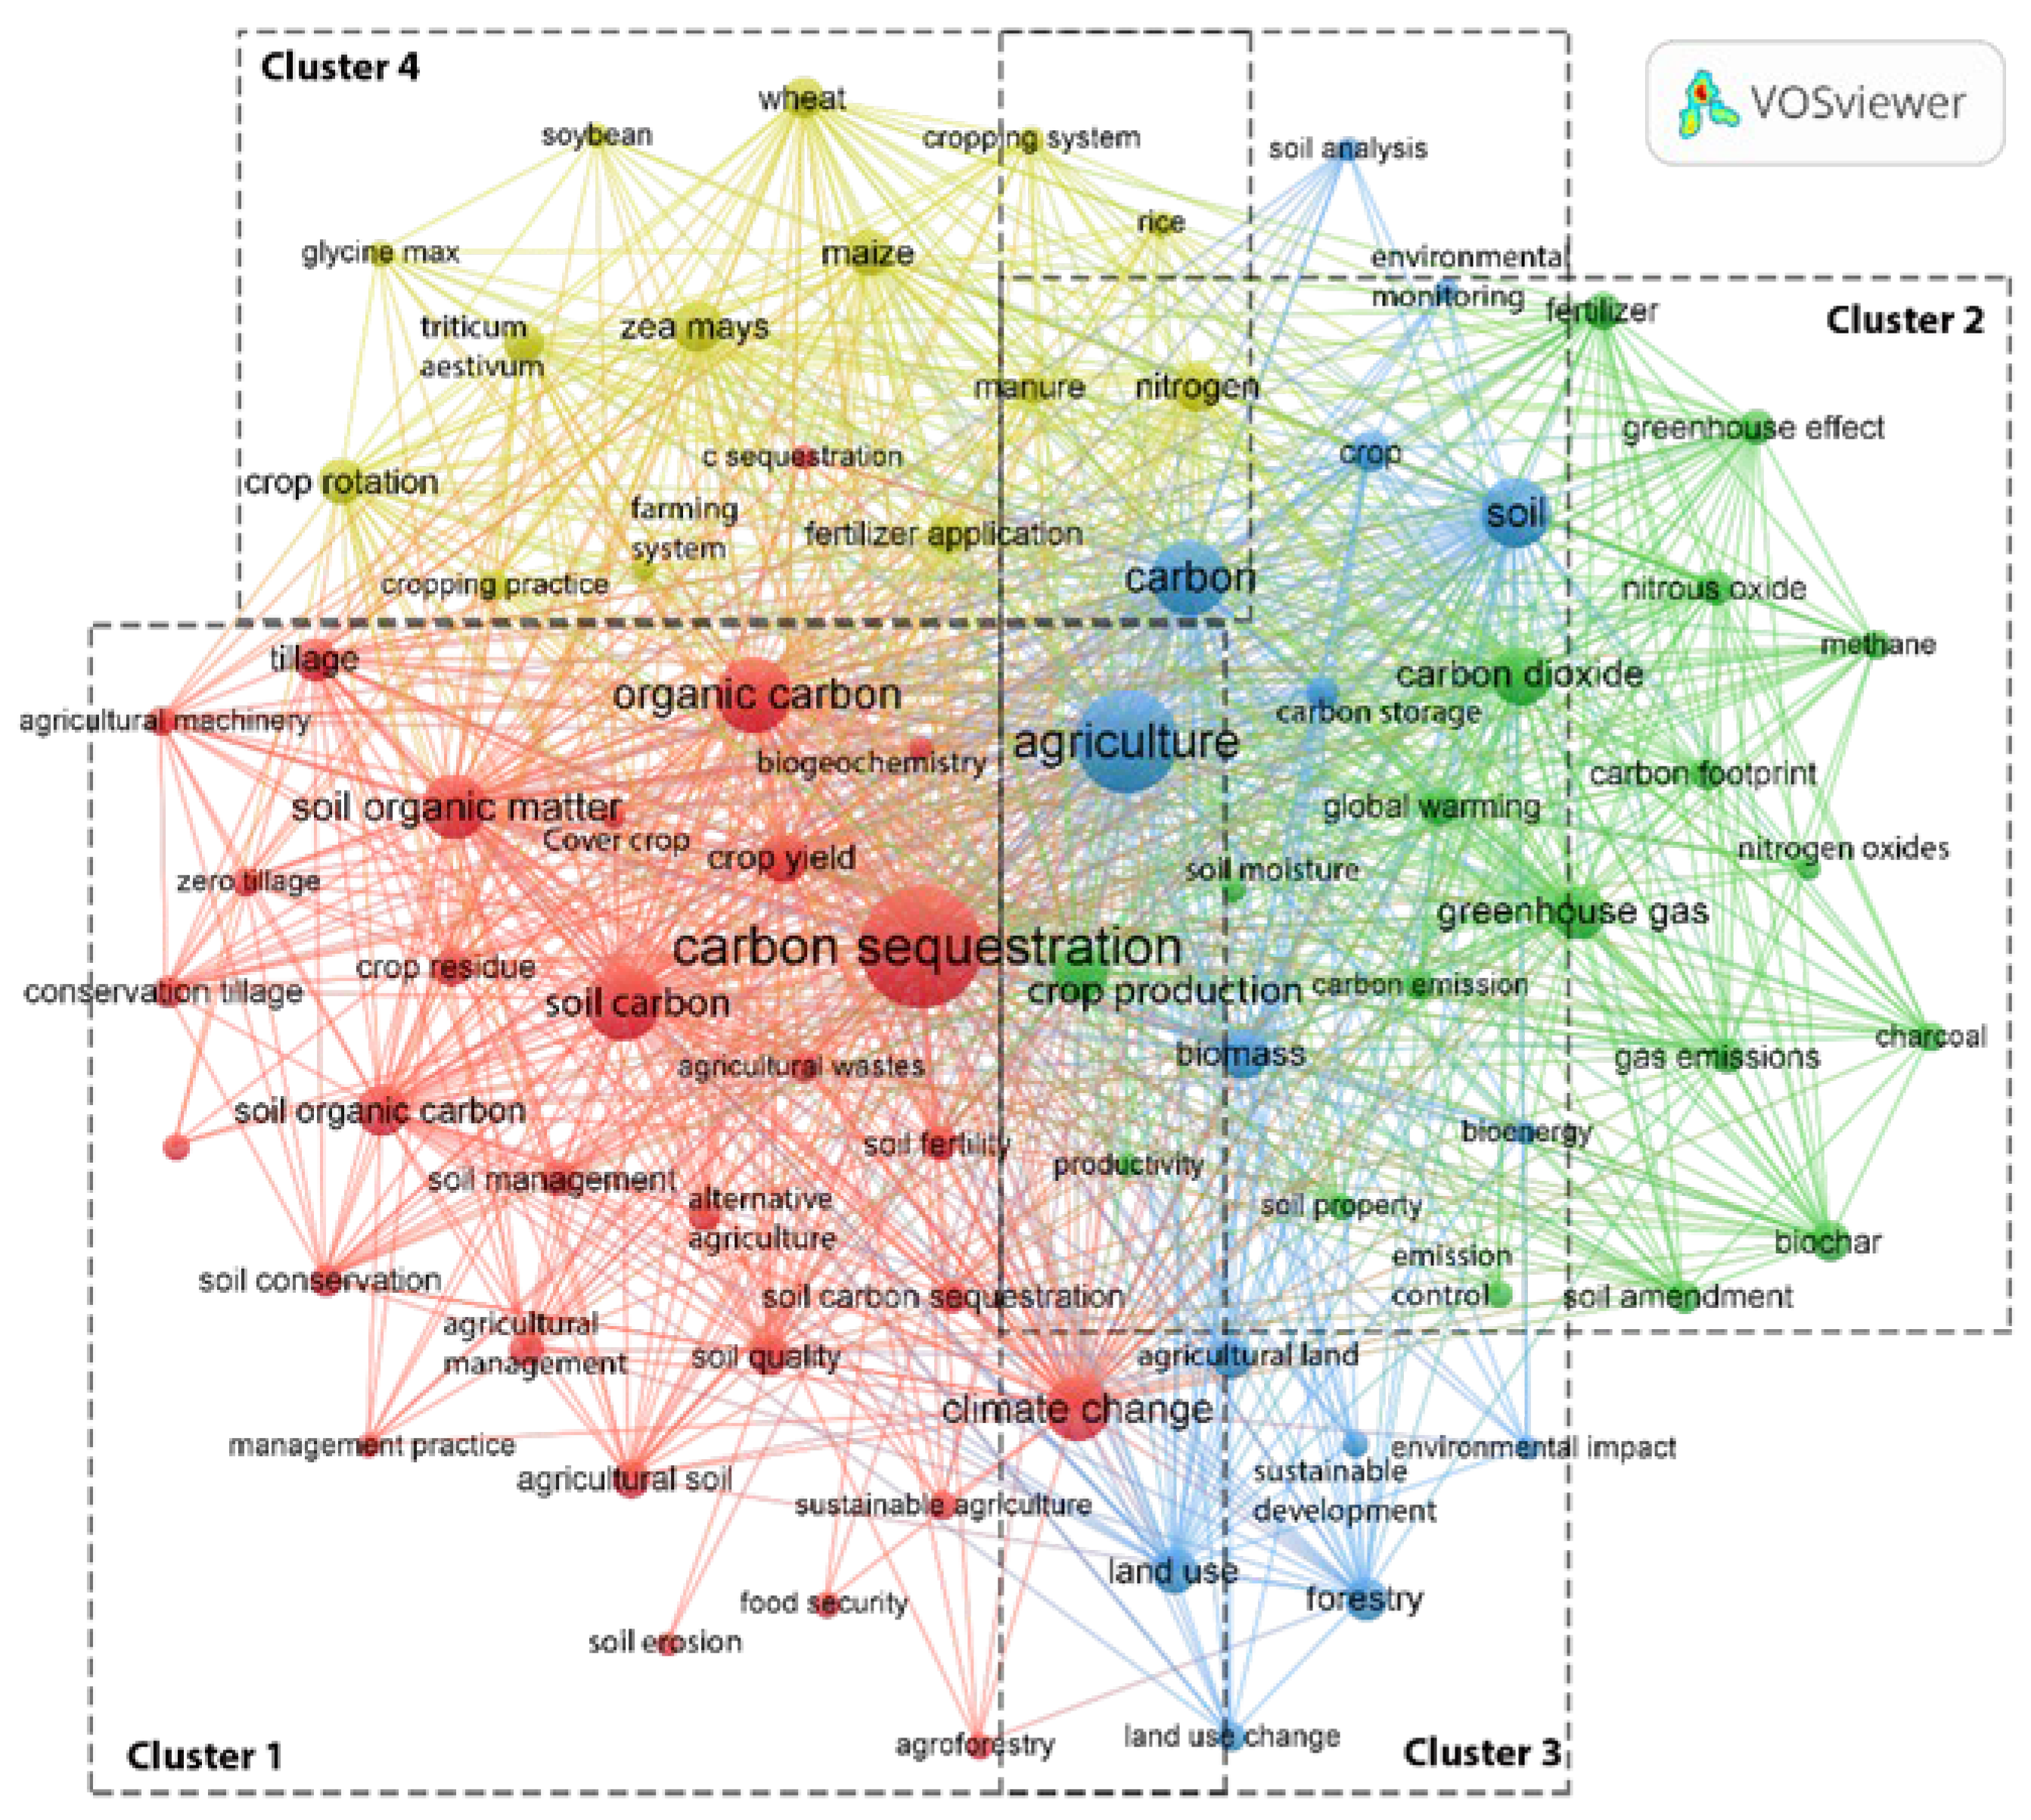
The database used for the co-occurrence through VOSviewer software was the one resulting from the first query and resulted in 1660 documents. A minimum threshold of 65 was set for the 8526 keywords, and only 100 met the threshold. To cut unrelated words, the repetitive words were merged during a cleaning step before visualizing the map. Figure 2 depicts the obtained map from VOSviewer showing the co-occurrence keywords (depicted as circles), which often appeared in the publications related to CS, while the lines stand for the connection among them. The circle size indicates keyword frequency, and line thickness stands for the strength of connections between keywords, highlighting the number of times they appeared together in the same document.
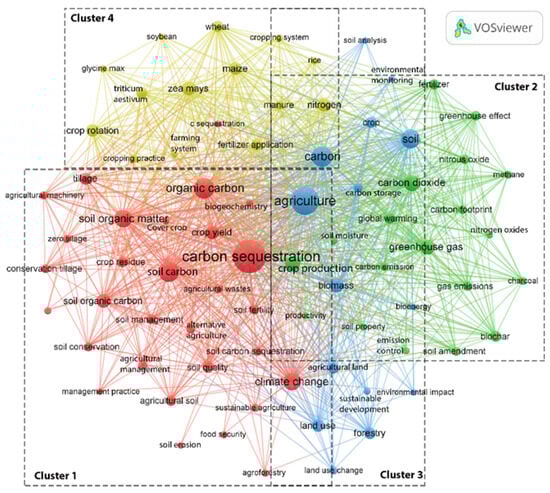
Figure 2.
Co-occurrence keyword map of CS publications from 2001 to 2022.
Figure 2 displays four distinct clusters of keywords. The first cluster, depicted in red, includes keywords related to co-effects of carbon farming practices. Keywords such as “soil organic matter“, “soil organic carbon”, “soil fertility”, and “soil erosion” are prominent variables for assessing optimal carbon farming practices [53]. Changes in CS practices are related to keywords such as “agroforestry” and “tillage”, or changes in “agricultural machinery”. These keywords are one of the two remarkable results of the additional analysis performed in Appendix A, Table A2 and Table A4.
The first remarkable result in Appendix A, Table A2 and Table A4, is tillage reduction, which reduces soil erosion and increases soil microbial activity, which plays a crucial role in converting biomass into SOM [54]. The change from plowing to no tillage is remarkable, as it avoids breaking SOM and exposing topsoil SOC to wind or water erosion [55]. This practice, combined with leaving biomass residues on the soil surface after harvesting, proved to be efficient in reducing the need for irrigation, preserving soil moisture, and increasing the amount of organic matter [56]. Consequently, soil with more organic matter can process more carbon effectively [57].
In the second cluster, in green, Figure 2 shows the main impacts of intensive agriculture such as air and soil emissions, as indicated by keywords like “greenhouse gases”, “methane”, “carbon dioxide”, “global warming”, and “nitrogen oxides” [58].
The third cluster in Figure 2, represented in blue, holds main carbon pools in ALOFU, “soil”, “biomass”, and “forestry” and then its relationship with “land use change”, and “agriculture”, involving the “carbon” and “soil analysis”.
The fourth cluster in Figure 2 shows in yellow the key staple crops of this study, “maize (Zea mays)”, “wheat (Triticum aestivum)”, and “rice”, related to the “cropping system”, as intercropping o crop rotations, between them or with other crops such as “Soybean (glycine max)”. Intercropping o crop rotations included in the cluster conclude another of the two remarkable results of the additional analysis performed in Appendix A, Table A2 and Table A4.
Crop rotation or intercropping are typically planned with a focus on efficiency and economic returns, aiming to increase the yield and reduce the inputs [59]. Crop rotation combinations, such as maize–wheat and wheat–rice, proved their effectiveness in increasing SOC stock, as described in detail by Clay et al. [60]. These rotation systems present a promising approach to enhance CS while keeping agricultural productivity [61]. Intercropping and crop rotation, where two or more crops are grown in the same field area, are typically designed to complement each other in terms of their growth habits and nutrient requirements [62]. Intercropping helps reduce the external inputs of fertilizer and pesticides and promotes the growth of deep-rooted crops, and, as a consequence, the biomass belowground [63].
Other words in the cluster such as “manure”, “fertilizer application”, or “farming system” are also found in the extra analysis performed in Appendix A, Table A2 and Table A4.
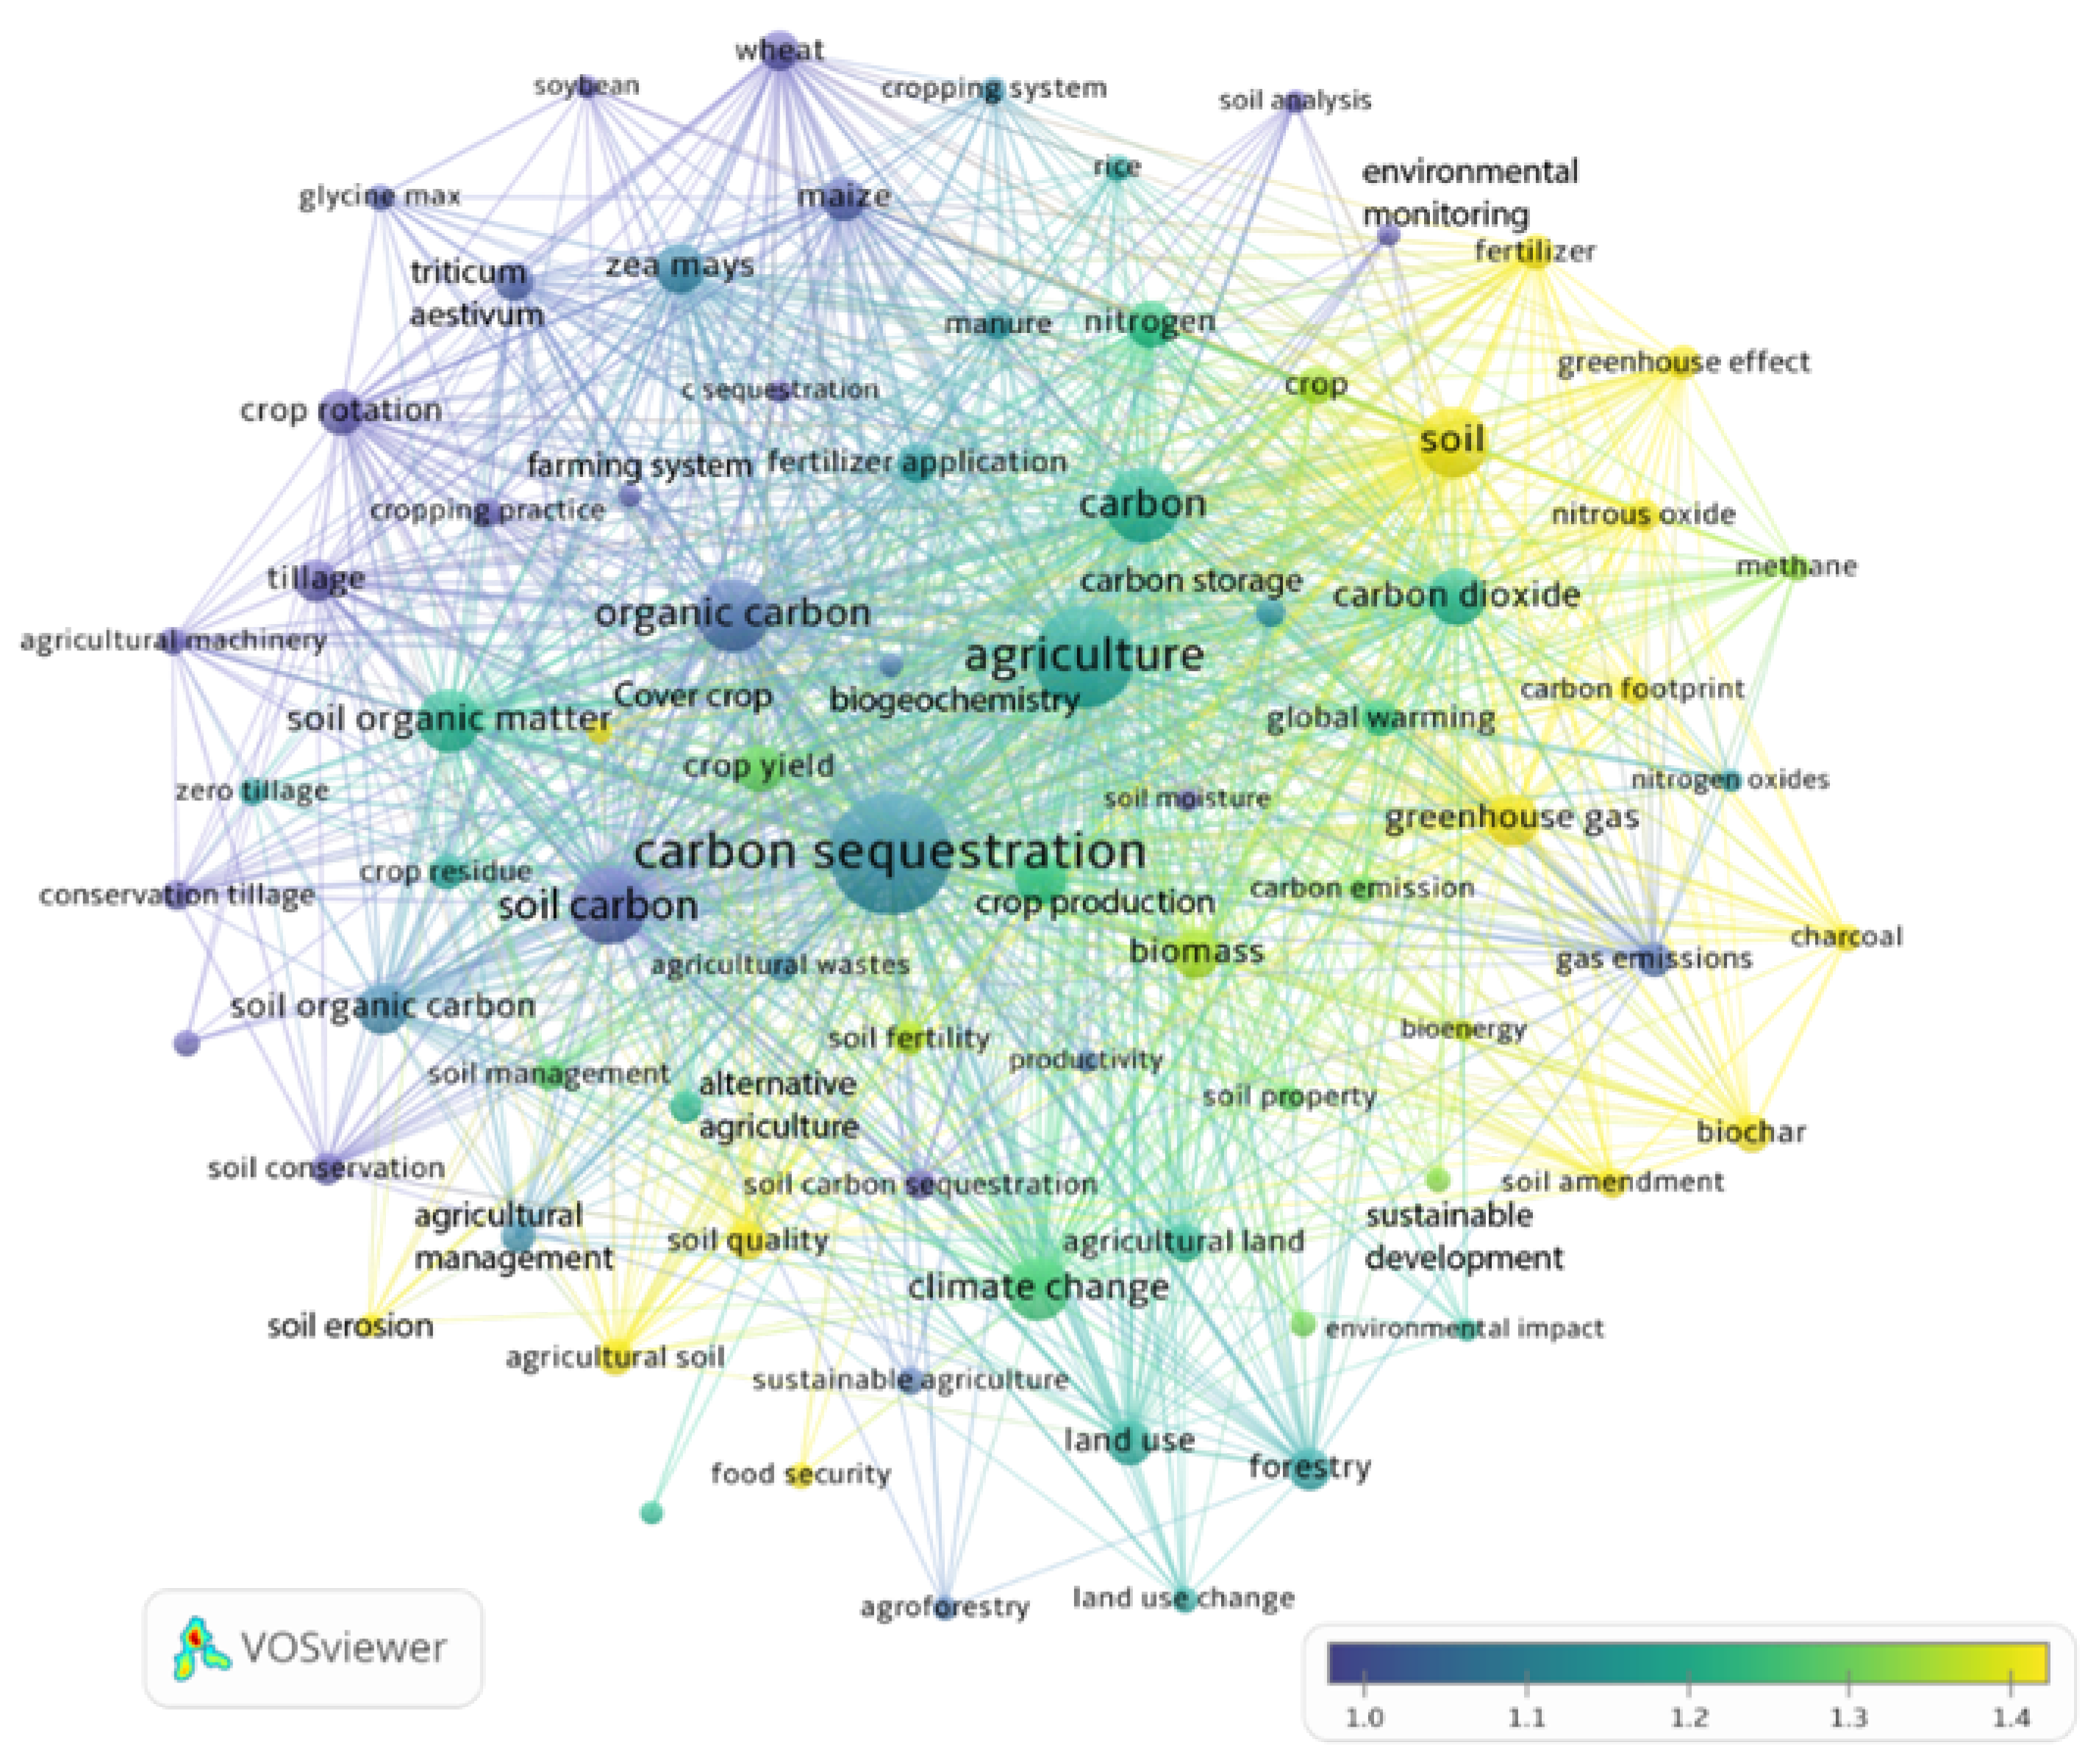
Figure 3 was created using VOSviewer and highlights the global attention on CS and storage in these main staple crops. The highest link strength is represented in yellow and is based on the same co-occurrence analysis mentioned earlier, considering the occurrences and total link strength of the most frequent keywords.

Figure 3.
Average of citation of bibliometric analysis map of CS publications from 2001–2022.
Figure 3 clearly emphasizes the significance of “carbon sequestration” (1033 occurrences and total link strength of 11,190), “crops” (384 occurrences and total link strength of 5276), “agriculture” (770 occurrences and total link strength of 1821), and “soil” (497 occurrences and total link strength of 6754), to increase “soil carbon” (411 occurrences and total link strength of 3339) stock, and then addressing key environmental issues such as “climate change” (352 occurrences and total link strength of 3920), and “global warming” (139 occurrences and total link strength of 1309).
It also highlights the importance of CS, in social strategies like “agricultural wastes” (100 occurrences and total link strength of 1459), “food security” (82 occurrences and total link strength of 798), and “Emissions Control” (77 occurrences and total link strength of 999). Additionally, the figure highlights the significance of the main staple crops in CS, as they are the top three crops found in the figure: maize with 192 occurrences and total link strength of 2897, wheat with 162 occurrences and total link strength of 2486, and rice with 86 occurrences and total link strength of 1384.
4. Discussion
The results presented earlier demonstrate the potential to achieve a positive carbon balance, despite the rates being categorized as low to medium. This study provides managers with a threshold for selecting best management practices to reduce emissions and offers policymakers valuable insights for regulation. It underscores the challenges growers face in determining carbon sequestration rates through analytical and modeling methods, highlighting the significant role of economic factors. Additionally, it emphasizes the need to increase the application of data-sharing standards or other cost-effective alternatives.
This study stresses the importance of including co-benefits in sequestration rates to maximize the impact of each tonne of carbon sequestered. Ignoring the values achieved by major staple crops, economic factors, and regulatory policies may escalate the radicality and complexity of its application. This concern aligns with current issues such as soil fertility loss, increased global emissions, reduced sequestration rates, heightened inputs, and the persistent demand for land to sustain the global population. The lack of standardized methods complicates the comparison between practices and hinders progress in the field.
The research needs outlined by this review in this field are as follows:
Developing mechanisms to predict CS potential, it is crucial for growers to make informed decisions. This can be achieved by simplifying the complexity of the process using soil dynamics and software, and applying models aligned with international standards for measuring or calculating CS. Doing so can help to reduce uncertainty, ease verification, and allow for the evolution of the models.
Establishing standards for declaring the CS potential using standardized functional units, soil factors, and boundaries for SOCSR declarations would help the comparison between studies and the evaluation of CS potential among different carbon farming practices.
Perform systemic studies, necessary for better understanding of the importance of carbon farming in main staple crops for achieving food security, and soil health benefits, as well as for reaching the SDGs and other social strategies associated with soil health. Consider economic incentives and potential negative consequences, such as the accumulation of land by companies or the conversion of food crops to lumber crops, to avoid widening the gap in interpretations.
Create a data quality database to calibrate the actual models in the market, to reduce the time of acceptance and the prices of implementation.
In this systematic review, articles, reviews, book chapters, and conference papers indexed in Scopus from 2001 to 2022 were considered. Specifically, the analysis was limited to long-term experiments, meta-analyses, and reviews reporting an increment in soil carbon stock. The research primarily focused on the CS rates in main staple crops without questioning the methodology used for the estimation but was limited to reporting the estimated values. Also, different practices were analyzed and discussed but without giving a general recommendation of the most effective practice to be chosen but rather giving references for a more informed choice.
5. Conclusions
CS rates in main staple food crops range from very low values to medium values but still show potential to achieve positive carbon balances. This review, performed through an analysis made in VOSviewer, shows that research trends in the field of carbon sequestration are steadily increasing attention and interest. This is mainly due to the topic of climate mitigation potential. CS practices in staple food crops offer significant benefits, including reducing emissions, improving agricultural resilience, and enhancing soil health and food security. However, challenges such as the complexity of CS calculations, the need for standardized methodologies, and the importance of considering cultural and economic factors in crop choices must be addressed. Comprehensive efforts to mitigate and adapt to global warming are essential but must balance practical and cultural agricultural realities to maximize benefits and minimize drawbacks.
Author Contributions
Conceptualization, data curation, investigation, writing—original draft, D.A.A.V.; Methodology, supervision, writing—review and editing, E.G.; Conceptualization, formal analysis, methodology, supervision, A.D.B.; Writing—review and editing, V.T.; Writing—review and editing, data curation, supervision, S.S.; Funding acquisition, supervision, project administration, validation, writing—review and editing, M.G. All authors have read and agreed to the published version of the manuscript.
Funding
This research was partially funded by the project Control Carbon (Contabilizzazione delle emissioni nette delle colture orticole/frutticole per elaborare proposte di metodologie per la generazione di crediti di carbonio), PSR Emilia-Romagna 2014–2020, Italy (Tipo di operazione 16.2.01, CUP E69H22000010007).
Institutional Review Board Statement
Not applicable.
Informed Consent Statement
Not applicable.
Data Availability Statement
The data utilized in this investigation are publicly accessible on the Scopus website at https://www.scopus.com/ (accessed on 10 January 2023). Requests for data should be directed to the corresponding author via email.
Acknowledgments
This paper and related research have been conducted during and with the support of the Italian inter-university PhD course in sustainable development and climate change (link: www.phd-sdc.it (accessed on 3 October 2023)) (D. Arellano, S. Spotorno). The authors gratefully acknowledge Conserve Italia Soc. Coop. Agricola (Italy).
Conflicts of Interest
The authors declare that they have no known competing commercial interests or personal relationships that could have appeared to influence the work reported in this paper.
Appendix A
Table A1.
CS rates of maize, wheat, and rice, reported in experimental studies based on analytical methods.
Table A1.
CS rates of maize, wheat, and rice, reported in experimental studies based on analytical methods.
| No. | Main Crop of Study | Methodology Used to Declare the Carbon Stock | Time of Experiment (Years) | Method Used to Calculate the Carbon Sequestration | CS Rates, Mini and Maximum Values | References |
|---|---|---|---|---|---|---|
| 1 | Maize (Zea mays L.) | Soil samples were taken in April 2012 (before sowing) and 2015 (after harvest) and processed using an elemental analyzer. | 4 | SOCSR = (Cstock1 − Cstock2)/Obs. period | min: −0.61 ± 0.38 | [64] |
| Soil sample depth (m): 0.2 | max: 1.02 ± 0.44 | |||||
| SOC initial = 9.0 g kg−1 | SOCSR units = (Mg C ha−1 yr−1) | |||||
| SOC stock initial = in Mg ha−1 | ||||||
| 2 | Maize (Zea mays L.) and wheat (Triticum aestivum) | Soil samples were taken before sowing in 2003 and July 2010, then processed using an elemental analyzer and isotope ratio spectrometer. | 7 | SOCSR = (Cstock1 − Cstock2)/Obs. period | min: not declared | [65] |
| Soil sample depth (m): 0.2 in 2003 and 1 in 2010. | SOCSR units = (Mg C ha−1 yr−1) | max: 0.184 ± 86 | ||||
| SOC initial = 11.4 g kg−1 | ||||||
| SOC stock initial = in Mg ha−1 | ||||||
| 3 | Rice (Oryza sativa L.), wheat (Triticum aestivum L.) | Soil samples were taken every year after crops were harvested and before soil plowing, then processed using potassium dichromate and an external heating method. | 33 | CSR = (Cstock1 − Cstock2)/Obs. period | min: 0.12 | [66] |
| Soil sample depth (m): 0.2 | CSR units = (Mg C ha−1 yr−1) | max: 0.2 | ||||
| SOC initial = 15.9 g kg−1 | ||||||
| SOC stock initial = 38 Mg ha−1 | ||||||
| 4 | Wheat (Triticum aestivum L.) | Soil samples were taken in June 2009 and processed by Walkley–Black method. | 17 | Annual SOC sequestered = (Cstock1 − Cstock2)/Obs. period | min: 0.05 | [30] |
| Soil sample depth (m): 0–0.5, 0.5–0.10, 0.10–0.20, 0.20–0.30, 0.30–0.40, 40–50, and 50–60. | max: 0.3 | |||||
| SOC initial = in g kg−1 | Annual SOC sequestered units: (Mg C ha−1 yr−1) | |||||
| SOC stock initial: CT = 45.1 Mg ha−1, NT = 45.4 Mg ha−1 | ||||||
| 5 | Maize (Zea mays L.) and wheat (Triticum aestivum) | Soil samples were taken in June 2021 and processed by Walkley–Black method. | 6 | SOC sequestration = (aboveground straw residues + belowground straw residues) | min: 2.583 | [67] |
| Soil sample depth (m): 0.2 | max: 3.801 | |||||
| SOC initial = 9.52 g kg−1 | SOC sequestration units: (Mg C ha−1 yr−1) | |||||
| SOC stock initial = in Mg ha−1 | ||||||
| 6 | Rice and wheat | Soil samples were taken every year after rice harvest and processed using vitriol acid–potassium dichromate oxidation. | 10 | min: −0.25 | [68] | |
| Soil sample depth (m): 0.2 | max: 0.52 | |||||
| SOC initial = 9.05 g kg−1 | ||||||
| SOC stock initial = in Mg ha−1 | ||||||
| 7 | Rice and wheat | Soil samples were taken every year after the rice harvest and processed afterward by vitriol acid–potassium dichromate oxidation. | 34 | Annual SOC sequestered = Cstock1 − Cstock2/Obs. period | min: 0.04 | |
| Soil sample depth (m): 0.2 | max: 0.64 | |||||
| SOC initial = 9.52 g kg−1 | Unit of measure: (Mg C ha−1 yr−1) | |||||
| SOC stock initial = in Mg ha−1 | ||||||
| 8 | Rice (Oryza sativa L.) and wheat (Triticum aestivum L.) | Soil samples were taken after the harvesting of wheat in 2008 and processed by Walkley–Black method. | 9 | Annual SOC sequestered = Cstock1 − Cstock2/Obs. period | min: 0.33 | [69] |
| Soil sample depth (m): 0–0.15, 0.15–0.30, 0.30–0.45, and 0.45–0.60. | max: 0.69 | |||||
| SOC initial = 2.1 g kg−1 | Unit of measure: (Mg C ha−1 yr−1) | |||||
| SOC stock initial = 5.9 Mg ha−1 | ||||||
| 9 | Wheat and maize | Soil samples were taken after the harvesting of wheat in 1997 and 2009 and processed by potassium dichromate and external heating method followed by titration with ferrous ammonium sulfate. | 25 | Annual SOC sequestered = Cstock1 − Cstock2/Obs. period | min: −7.18 | [70] |
| Soil sample depth (m): 0–0.2, 0.2–0.4, 0.4–0.6, and 0.66–1. | max: 4.96 | |||||
| SOC initial = for min values, 13.94 g kg−1; for max, 15.6 | Unit of measure: (Mg C ha−1 yr−1) | |||||
| SOC stock initial = for min values, 39.3; for max values, 44.5 Mg ha−1 |
Table A2.
CS reported conditions in experimental studies based on analytical methods.
Table A2.
CS reported conditions in experimental studies based on analytical methods.
| No. | Main Crop of Study | Cropping System and Irrigation | Carbon Farming Practices to Evaluate (Tillage Reduction, Cover Cropping, Alternative Fertilizing) | Soil Profile at the Beginning and Pedoclimatic Conditions | Carbon Losses, Carbon Emissions, or Other Emissions Considered | References |
|---|---|---|---|---|---|---|
| 1 | Maize (Zea mays L.) | Crop rotation: No | Reduce the inorganic fertilizer: Evaluate the combination of animal manure (AM) with inorganic fertilizer. | Type of soil: Luvisol (FAO classification) | N2O emissions | [64] |
| Tillage: Conventional | Mean annual temperature (MAT): 7.5 ° | |||||
| Irrigation: No | Annual precipitation (AP): 680 mm | |||||
| 2 | Maize (Zea mays L.) and wheat (Triticum aestivum) | Crop rotation: Wheat–maize, wheat–fava bean (Vicia faba), maize–fava bean | Enhancing the crop system: A comparison between intercropping and crop rotation. | Type of soil: Sandy loam | Not reported or considered | [65] |
| Intercropping: Maize–wheat, wheat–fava bean, maize–fava bean | MAT: 8.9 °C | |||||
| Tillage: Conventional | AP: 168 ± 8 mm | |||||
| Irrigation: Yes | ||||||
| 3 | Rice (Oryza sativa L.), wheat (Triticum aestivum L.) | Crop rotation: Rice–wheat | Reduce the inorganic fertilizer: Comparison of long-term organic manure or manure combined with inorganic fertilizers versus long-term application of inorganic fertilizer. | Type of soil: Albic Luvisol | Estimated carbon loss of 0.46 Mg C ha−1 yr−1 | [66] |
| Tillage: Conventional | MAT: 13 °C | |||||
| Irrigation: No | AP: 1300 mm | |||||
| 4 | Wheat (Triticum aestivum L.) | Crop rotation: No | Reduce tillage: Conventional tillage (CT) versus no tillage (NT) with crop residue incorporation. | Type of soil: Silt loam under the USDA texture class | Not reported | [30] |
| Tillage: Conventional and no tillage | MAT: 10.7 °C | |||||
| Irrigation: No | AP: 555 mm | |||||
| 5 | Maize (Zea mays L.) and wheat (Triticum aestivum) | Crop rotation: Maize–wheat–soybean–wheat, soybean–wheat, and maize–wheat | Reduce tillage: Reduced tillage with crop residue incorporation (CT) versus no tillage (NT) with crop residue incorporation. | Type of soil: Silt loam under the USDA texture class | Loss pool from mineralization (47.2–51.5%) in comparison with annual biomass input reported | [67] |
| Tillage: Reduce tillage and no tillage | MAT: 13.1 °C | |||||
| Irrigation: Yes | Enhancing the crop system: Comparison of different crop rotations. | AP: 555 mm | ||||
| 6 | Rice and wheat | Crop rotation: Rice–wheat–rice–rape | Reduce the inorganic fertilizer: Comparison of long-term organic manure or manure combined with inorganic fertilizers versus long-term application of inorganic fertilizer. | Type of soil: Acid purple soil | SOC decomposition rates of 0.20 Mg C ha−1 yr−1 | [68] |
| Tillage: Reduce tillage | MAT: 17.5 °C | |||||
| Irrigation: Yes | AP: 1290 mm | |||||
| 7 | Rice and wheat | Crop rotation: Rice–wheat | Reduce the inorganic fertilizer: Comparison of long-term organic manure or manure combined with inorganic fertilizers versus long-term application of inorganic fertilizer. | Type of soil: Calcareous purple soil | SOC accumulation rates of 0.0055 Mg C ha−1 yr−1 | |
| Tillage: Reduce tillage | MAT: 17.4 °C | |||||
| Irrigation: Yes | AP: 930 mm | |||||
| 8 | Rice (Oryza sativa L.) and wheat (Triticum aestivum L.) | Crop rotation: Rice–wheat | Reduce the inorganic fertilizer: Comparison of twelve combinations of organic and inorganic fertilizers, as well as residue integration. | Type of soil: Loamy sand soil | Losses not reported | [69] |
| Tillage: Not specified | MAT: Not specified | |||||
| Irrigation: Yes | AP: Not specified | |||||
| 9 | Wheat and maize | Crop rotation: For the min values, maize–wheat; for the max values, sugar beet–winter wheat–maize–spring barley | Enhancing the crop system: Assess the changes in SOC stock in relation to the carbon input from nine wheat-based cropping systems and untilled grassland. | Type of soil: Clay loam-textured | SOC content depletion rate of 0.245 Mg C ha−1 yr−1. This was compared with annual biomass input reported | [70] |
| Tillage: For the min values, conventional tillage; for the max values, no tillage | MAT: 12.3 °C | |||||
| Irrigation: Yes | AP: 625 mm |
Table A3.
CS rates of maize, wheat, and rice, reported in experimental studies based on modeling methods.
Table A3.
CS rates of maize, wheat, and rice, reported in experimental studies based on modeling methods.
| No. | Main Crop of Study | Model Used, Type of Data Used for Modeling and its Source | Time of Experiment (Years) | Method Used to Calculate the Carbon Sequestration | CS Rates, Mini and Maximum Values | References |
|---|---|---|---|---|---|---|
| 10 | Maize (Zea mays L.) | Model: ARMOSA | 21 | SOCSR = (Cstock1 − Cstock2)/Obs. period | min: −0.317 | [71] |
| Data required: SOC, daily maximum and minimum temperature, precipitation, and global solar radiation | SOCSR units = (Mg C ha−1 yr−1) | max: 0.027 | ||||
| Source of data: Previous collected experiments | ||||||
| 11 | Maize (Zea mays L.) | Model: Not named | 6 | δSOCSR/δt = (SOC × Ksoc) + (NHC × Knhc) | min: 0.069 | [60] |
| Data required: SOC, bulk density, and yield | δSOCSR units = (Mg C ha−1 yr−1) | max: 0.454 | ||||
| Source of data: NASS, STATSGO2 database, long-term studies conducted in Iowa, and other scientific studies | ||||||
| 12 | Wheat and Rice | Model: MetaWin 2.1 software | More than 3 | ΔDSOC = (Dsoct − Dsoc0) − (D’soct − D’soc0)/t | min: 0.003 | [72] |
| Data required: SOC, bulk density, and management data | δSOCSR units = (Mg ha−1 yr−1) | max: 0.53 | ||||
| Source of data: twenty-six scientific articles listed in the document. Non-linear equations for bulk density | ||||||
| 13 | Rice and Wheat | Model: Monte Carlo approach | 20 | ΔCi = ((Cit − Ci(t − 20))/20) × LAi | min: 0.182 | [9] |
| Data required: SOC, and management data | ΔCi units = (Mg ha−1 yr−1) | max: 0.433 | ||||
| Source of data: World Soils Reference database scientific experiment |
Table A4.
CS reported conditions in experimental studies based on modeling methods.
Table A4.
CS reported conditions in experimental studies based on modeling methods.
| No. | Main Crop of Study | Cropping System and Irrigation | Carbon Farming Practices to Evaluate (Tillage Reduction, Cover Cropping, Alternative Fertilizing) | Soil Profile at the Beginning and Pedoclimatic Conditions | Carbon Losses, Carbon Emissions, or Other Emissions Considered | References |
|---|---|---|---|---|---|---|
| 10 | Maize (Zea mays L.) | Crop rotation: Maize monocropping and maize–winter wheat–soybean | Reduce tillage: Conventional tillage (CT) versus no tillage (NT). Enhancing the crop system: Comparison of different crop rotations | Type of soil: Sandy loam | Soil mineralization coefficient | [71] |
| Tillage: No tillage, ploughing, and vertical tillage | Mean annual temperature (MAT): 12.9 °C | |||||
| Irrigation: Yes | Annual precipitation (AP): From 185.2 mm | |||||
| 11 | Maize (Zea mays L.) | Crop rotation: Maize monocropping | Reduce tillage: Conventional tillage (CT) versus no tillage (NT) | Type of soil: Brandt silty clay loam | Soil mineralization | [60] |
| Tillage: No tillage, and conventional tillage | Mean annual temperature (MAT): Not declared | |||||
| Irrigation: Yes | Annual precipitation (AP): From 772 mm | |||||
| 12 | Wheat and Rice | Crop rotation: Wheat–rice–rice or wheat–rice | Residue incorporation: Crop residue recycling Reduce tillage: Conventional tillage (CT) versus no tillage (NT) Reduce the inorganic fertilizer: Animal manure applications | Type of soil: Paddy soil, fluvo-aquic soil, and coastal solonchaks | Not considered | [72] |
| Tillage: No tillage, and conventional tillage | Mean annual temperature (MAT): 15 °C | |||||
| Irrigation: No | Annual precipitation (AP): From 1250 mm | |||||
| 13 | Rice and Wheat | Crop rotation: Rice–Wheat | Reduce tillage: Conventional tillage (CT) versus no tillage (NT). Reduce the inorganic fertilizer: Input reduction | Type of soil: Sandy loams to silty clay loam | Global warming potential | [9] |
| Tillage: No tillage, and conventional tillage | Mean annual temperature (MAT): Variable | |||||
| Irrigation: Yes | Annual precipitation (AP): Variable |
Appendix B
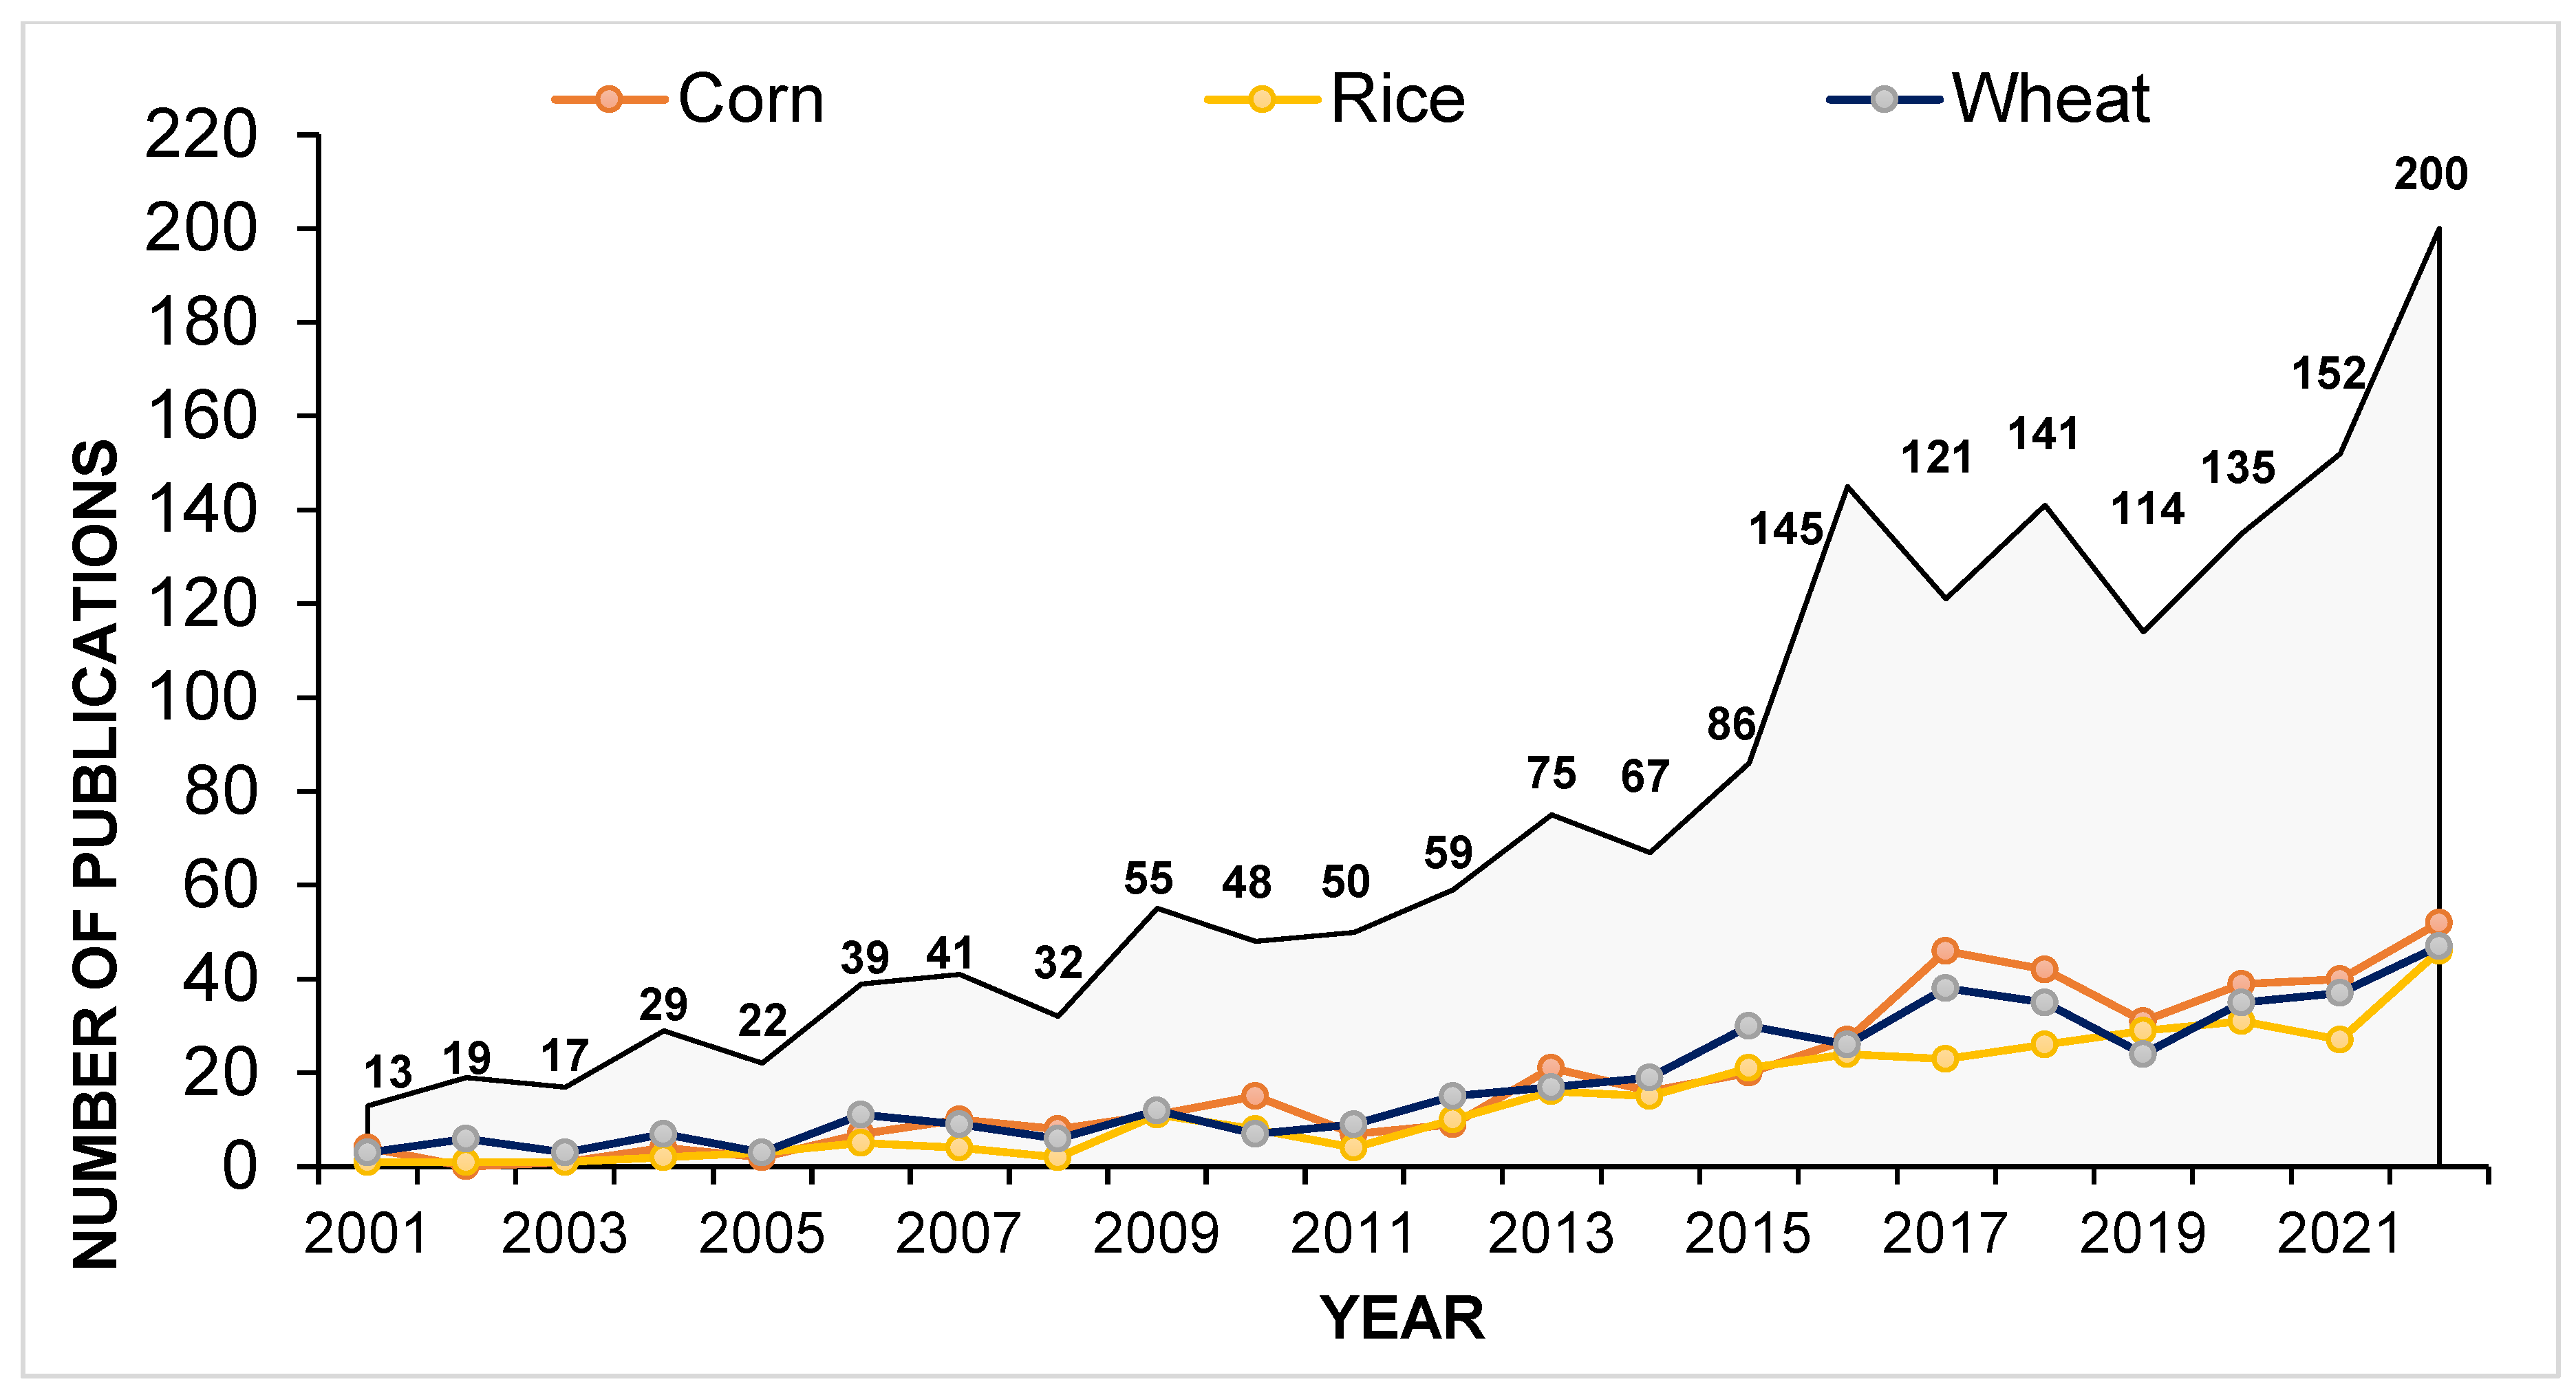
Appendix B, Figure A1, displays the trend of crop-related publications by year, with a steady increase from thirteen publications in 2001 to 200 publications in 2022. There was a notable increase from 86 to 145 documents published (more than 40% more) between 2014 and 2015. Then, every year between 2015 and 2018 showed significant increases, with 121 documents in 2016, 141 documents in 2017, and 211 documents in 2018. Notable events may have influenced the incremental tendency such as the Paris Agreement signatures and the formal adoption of the SDGs. Notably, since the Paris Agreement was signed and the SDGs were adopted in 2015, the number of publications for sequestration and storage has increased by 230%, maize by 260%, wheat by 156%, and rice by 219%.
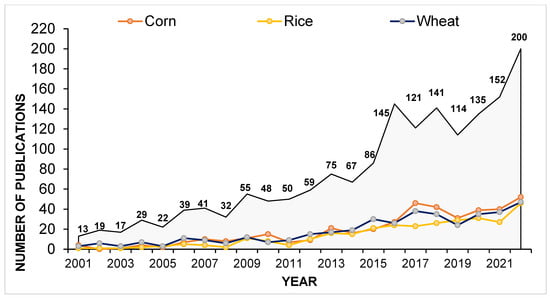
Figure A1.
Number of publications about carbon sequestration in 2001–2022 period.
Figure A1.
Number of publications about carbon sequestration in 2001–2022 period.
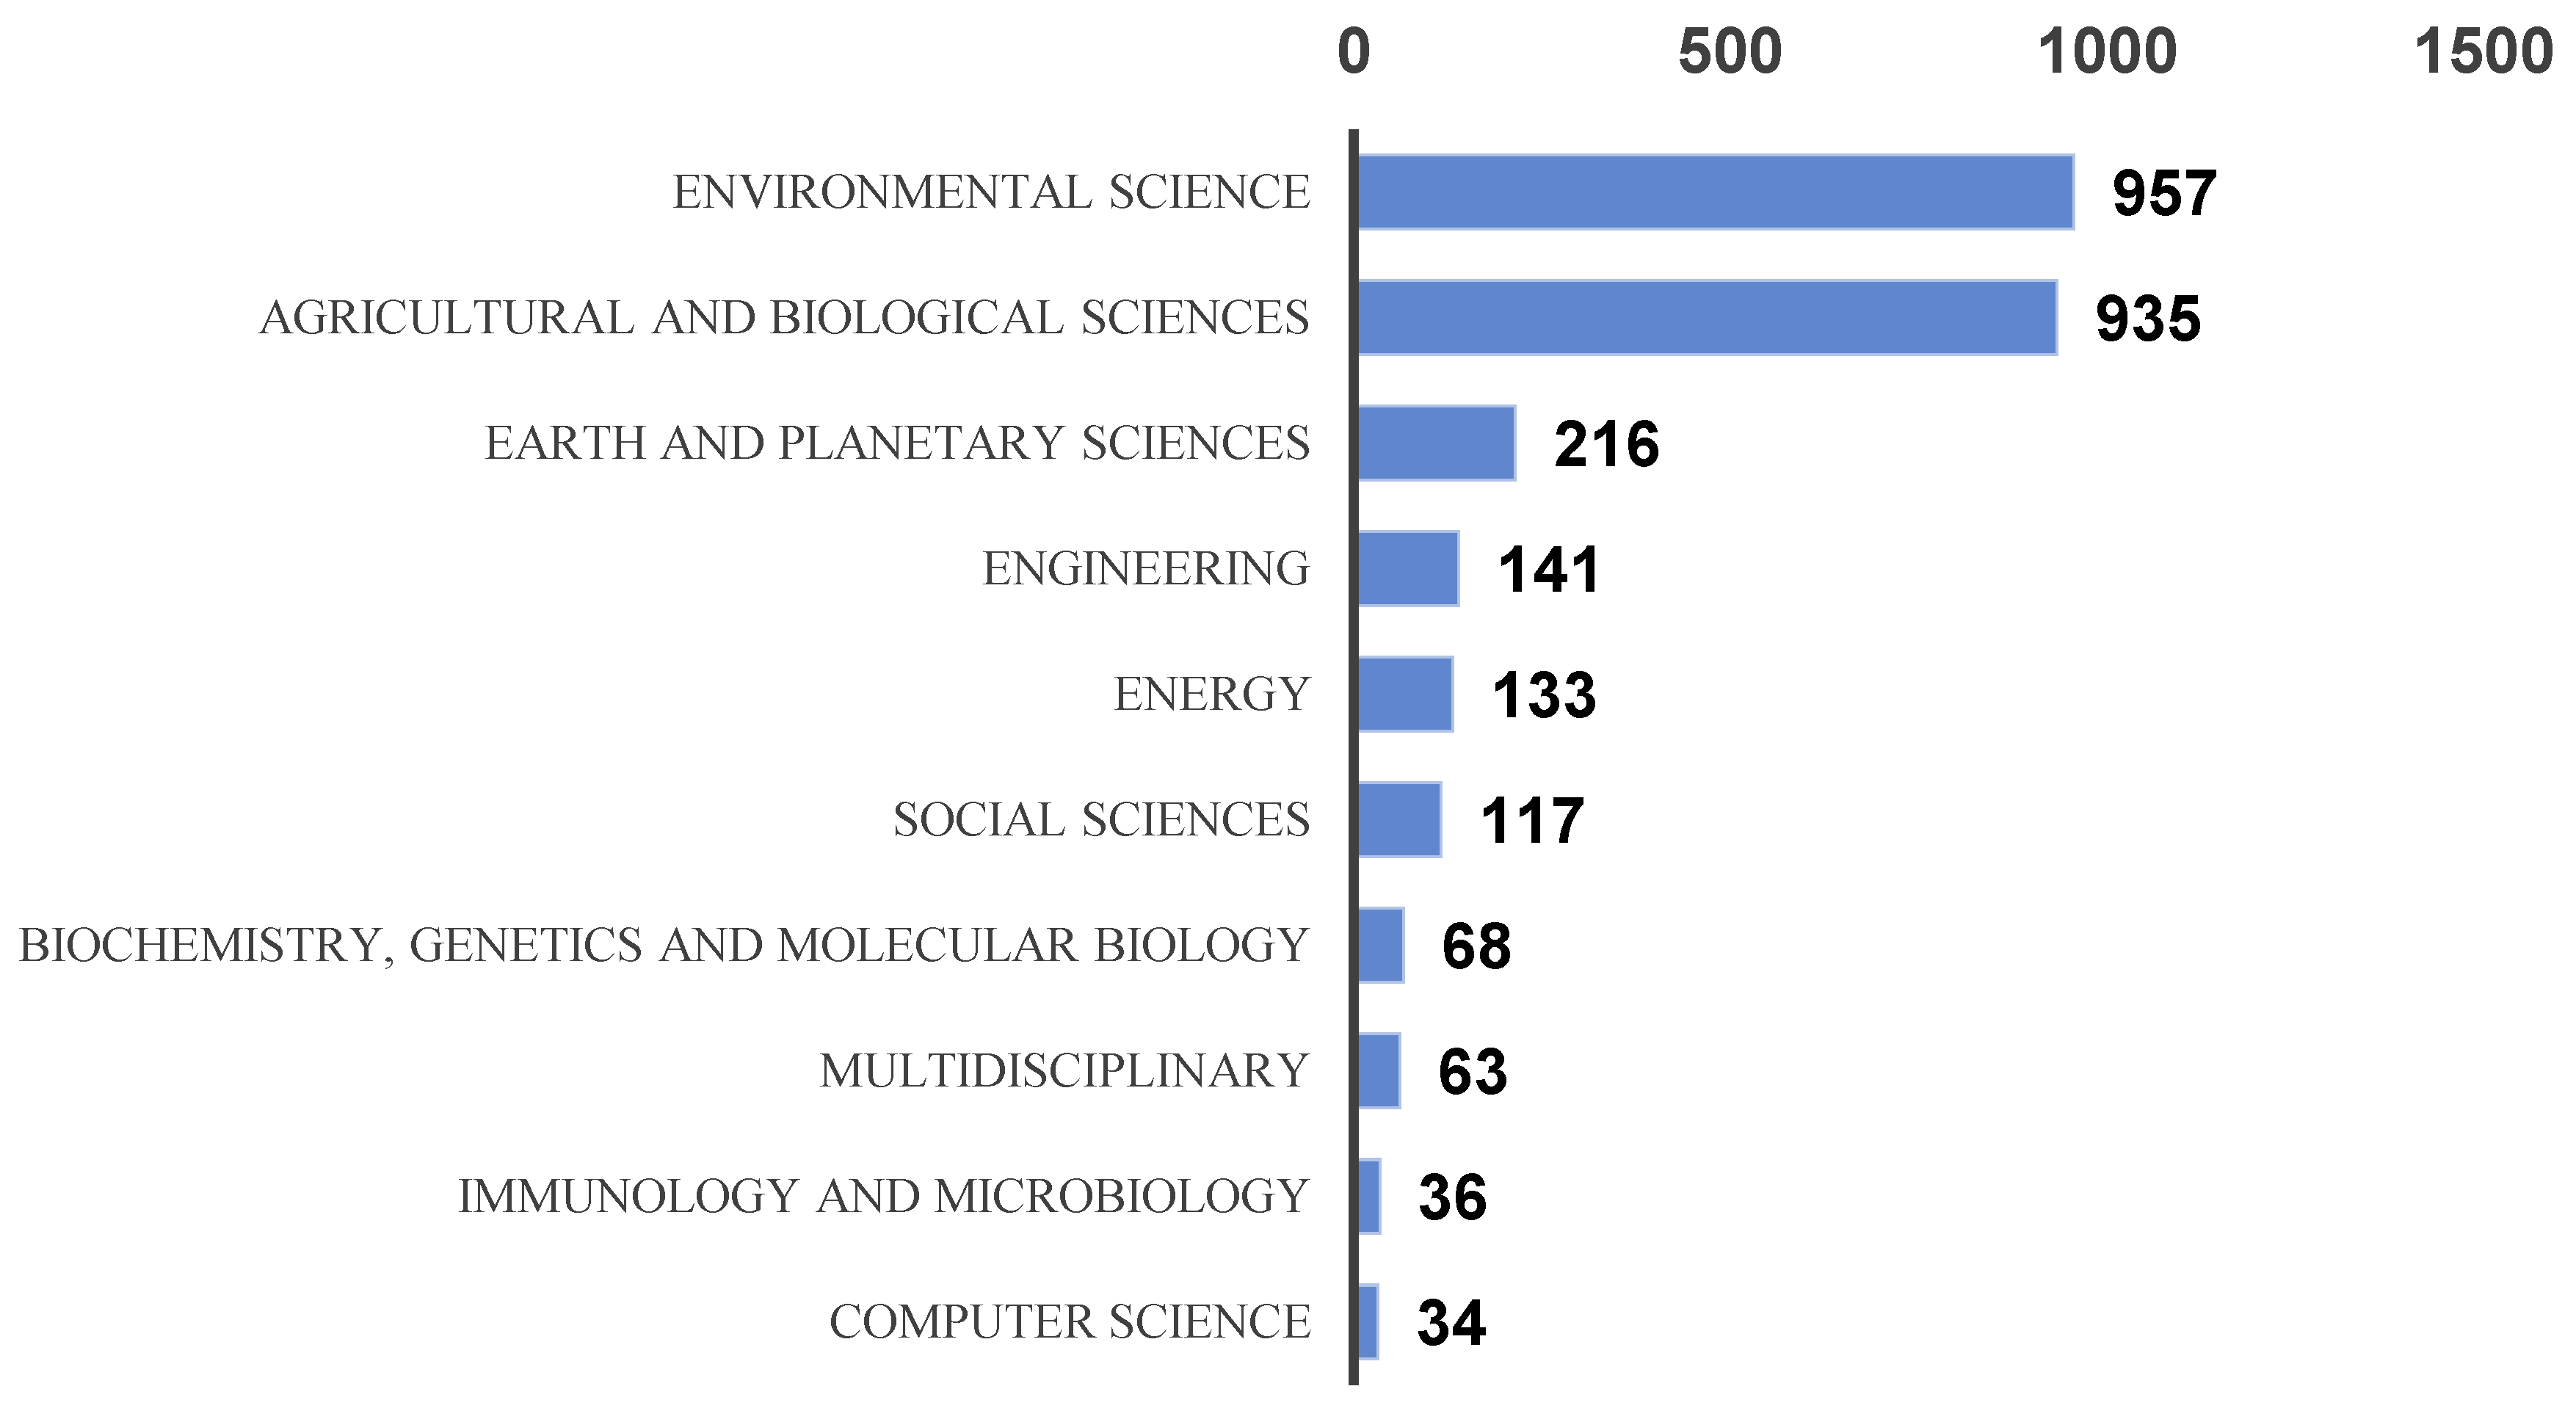
Appendix B, Figure A2, displays the top ten subject areas, where environmental science and agricultural/biological areas account for ~66% of all documents published in carbon farming. Business management and accounting also rank among the top ten areas of interest in the database of individual crops of interest, because CS by main staple crops is viewed not only as an environmental solution, but also as a business opportunity in the broader economics, econometrics, and finance areas [73].
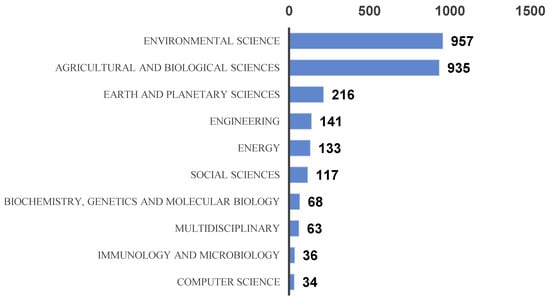
Figure A2.
Top ten subject interest areas for carbon sequestration publications (2001–2022).
Figure A2.
Top ten subject interest areas for carbon sequestration publications (2001–2022).
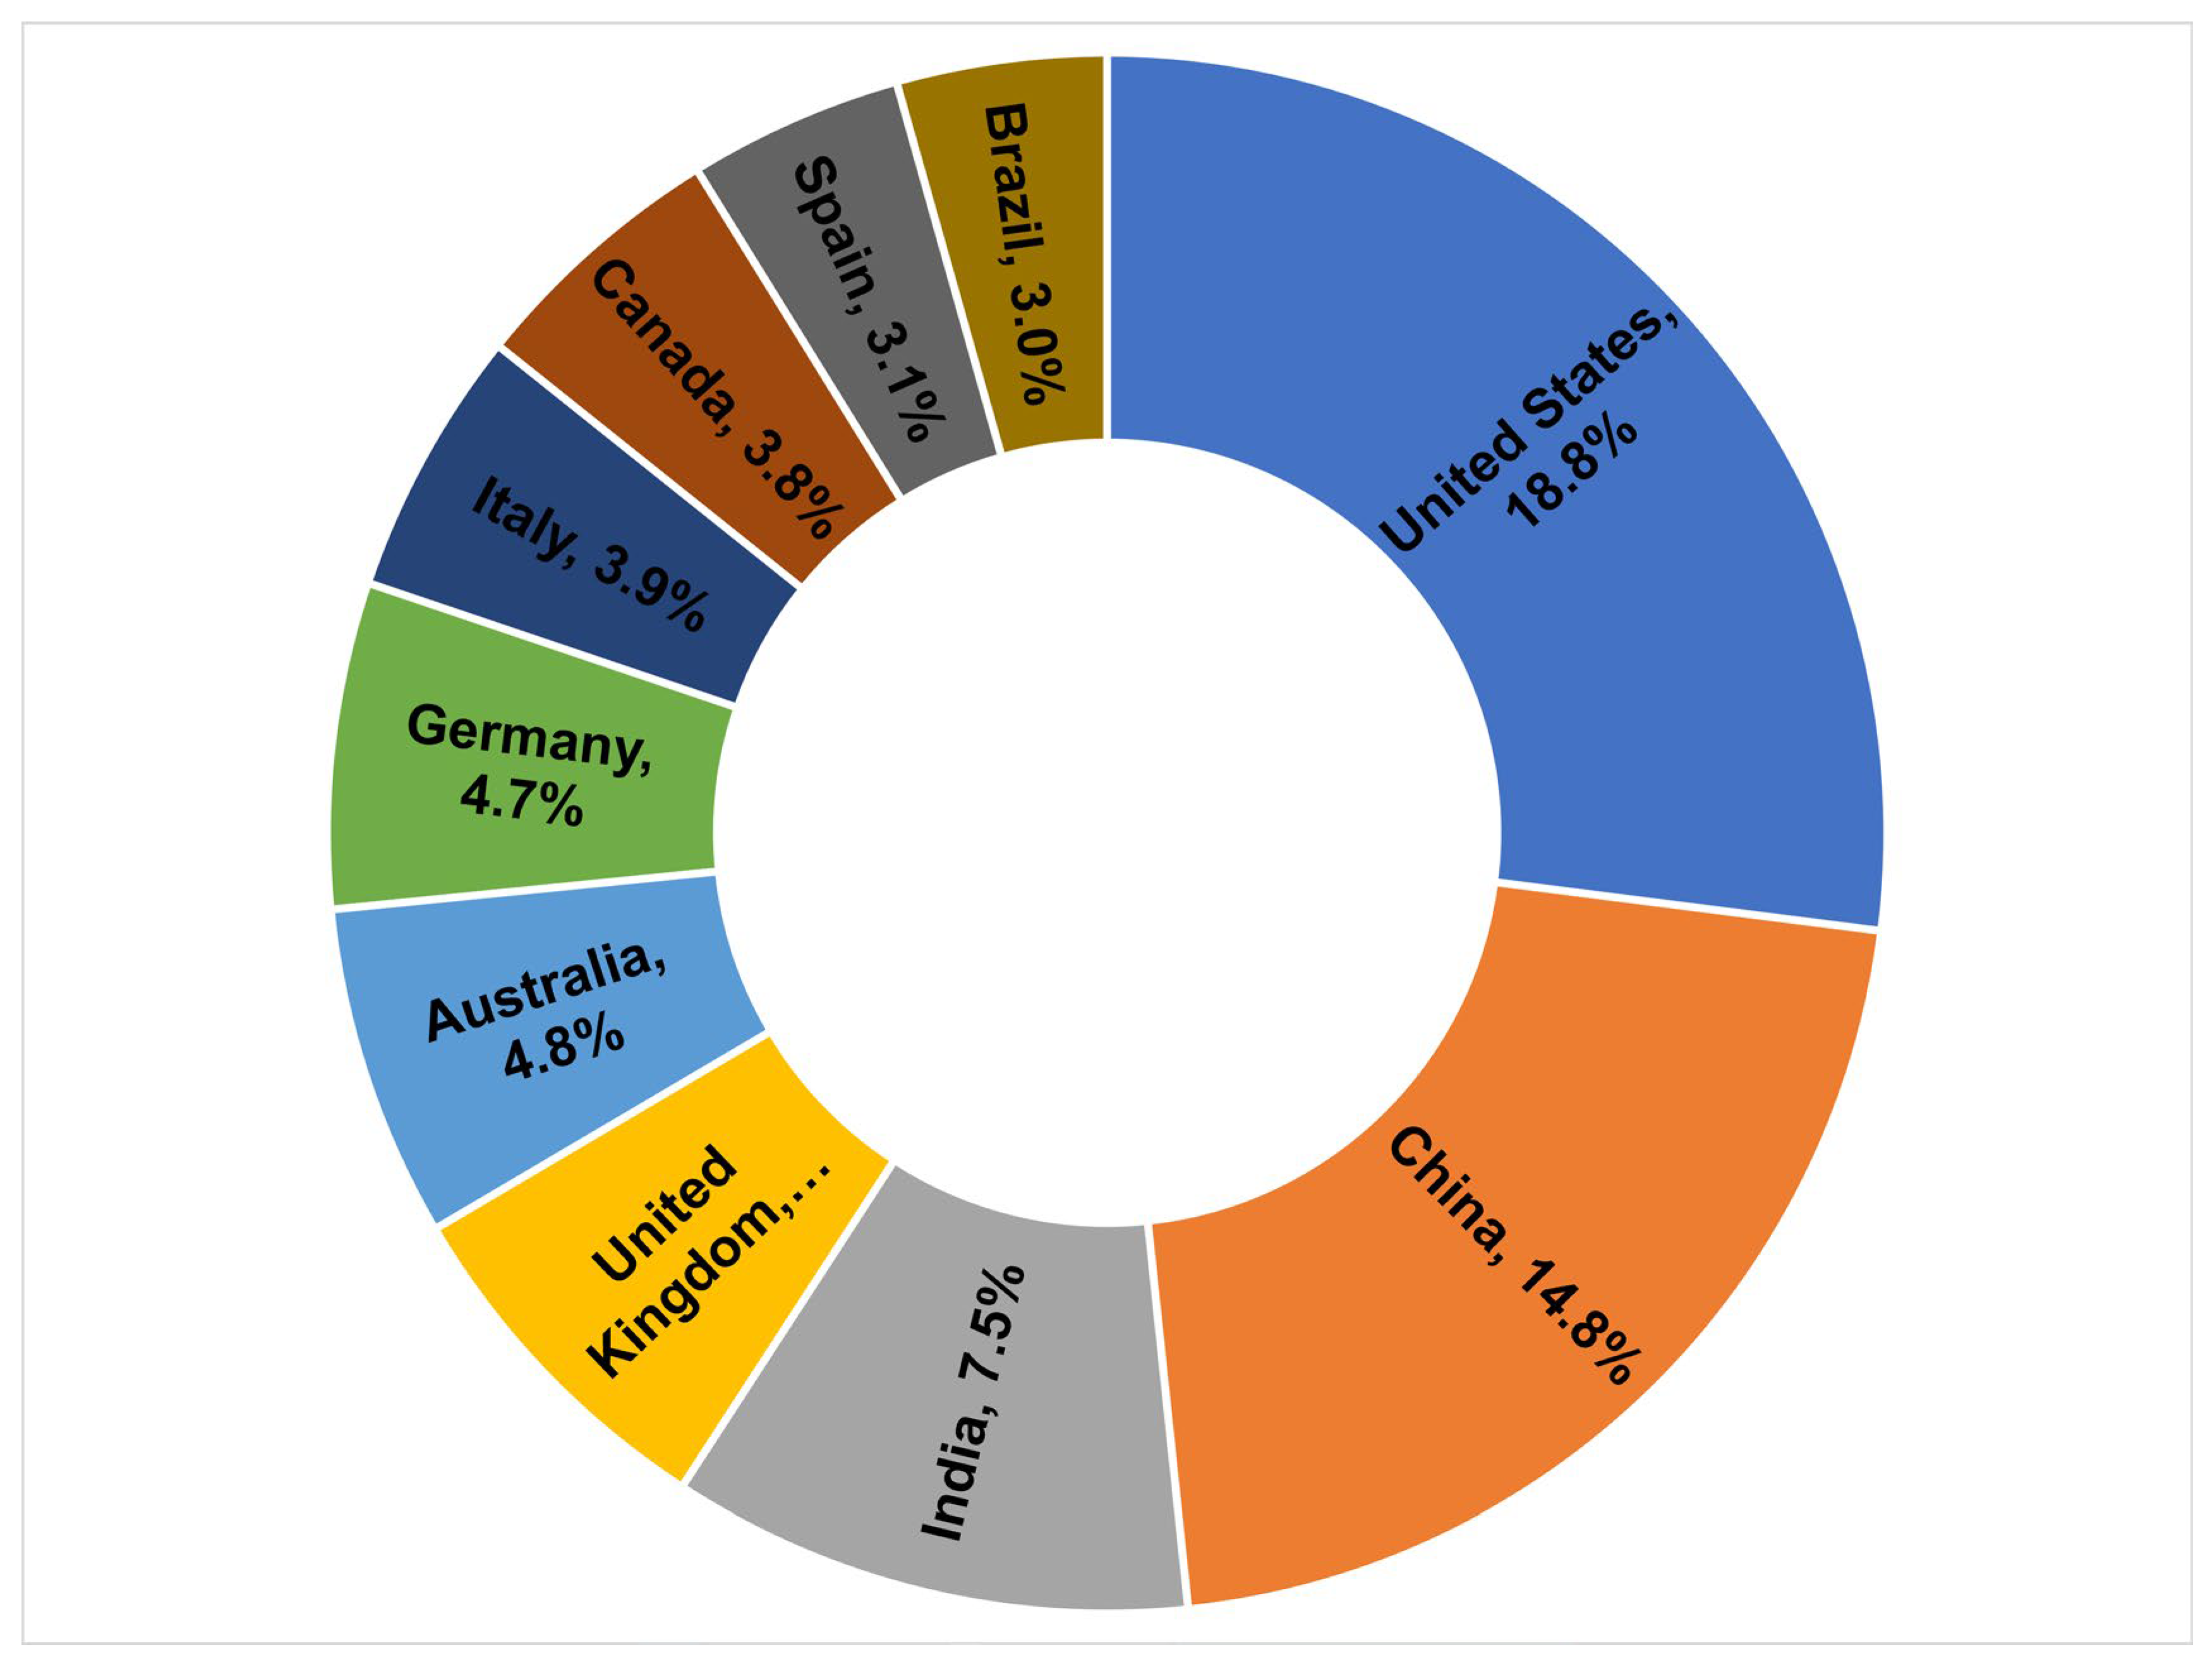
The USA, Brazil, Canada, and India are among the top ten countries in scientific production, accounting for 33.1% of the total documents published, Appendix B, Figure A2, but also being among the top three main staple crop exporters in Appendix B, Table A5. China and Japan are among the top three staple crop importers but are also included in the list of the top ten in scientific document production, Appendix B, Figure A3. China, as one of the main importers of rice, is the main contributor to documents published on carbon farming related to rice, accounting for 28.4%. Contrarily, Japan, as one of the primary importers of maize, contributes with only 1% of documents published on carbon farming.
Table A5.
World main traders of cereal staple crops [74].
Table A5.
World main traders of cereal staple crops [74].
| Maize | Wheat | Rice | |
|---|---|---|---|
| Main exporters | Brazil, United States of America, and Argentina | Russian Federation, United States of America, Canada | India, Thailand, and Vietnam |
| Main importers | Japan, Mexico, and Vietnam | Indonesia, Egypt, and Turkey | Philippines, China, and Benin |
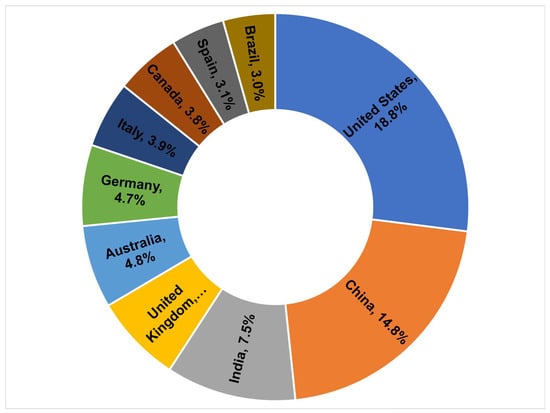
Figure A3.
Top ten countries with carbon sequestration publications from 2001 to 2022.
Figure A3.
Top ten countries with carbon sequestration publications from 2001 to 2022.
References
- Santos, F.D.; Ferreira, P.L.; Pedersen, J.S.T. The Climate Change Challenge: A Review of the Barriers and Solutions to Deliver a Paris Solution. Climate 2022, 10, 75. [Google Scholar] [CrossRef]
- NOAA. Carbon Dioxide Now More than 50% Higher than Pre-Industrial Levels. 2022. Available online: https://www.noaa.gov/news-release/carbon-dioxide-now-more-than-50-higher-than-pre-industrial-levels (accessed on 13 September 2023).
- Romero, J.; Lee, H. Summary for Policymakers. In Climate Change 2023: Synthesis Report. A Report of the Intergovernmental Panel on Climate Change. Contribution of Working Groups I, II and III to the Sixth Assessment Report of the Intergovernmental Panel on Climate Change; IPCC: Geneva, Switzerland, 2023; pp. 1–34. [Google Scholar] [CrossRef]
- Lobus, N.V.; Knyazeva, M.A.; Popova, A.F.; Kulikovskiy, M.S. Carbon Footprint Reduction and Climate Change Mitigation: A Review of the Approaches, Technologies, and Implementation Challenges. Carbon 2023, 9, 120. [Google Scholar] [CrossRef]
- Sanaullah, M.; Afzal, T.; Shahzad, T.; Wakeel, A. Carbon Sequestration for Sustainable Agriculture. In Innovations in Sustainable Agriculture; Farooq, M., Pisante, M., Eds.; Springer International Publishing: Berlin/Heidelberg, Germany, 2019; pp. 469–500. [Google Scholar]
- Rodrigues, C.I.D.; Brito, L.M.; Nunes, L.J.R. Soil Carbon Sequestration in the Context of Climate Change Mitigation: A Review. Soil Syst. 2023, 7, 64. [Google Scholar] [CrossRef]
- Tian, F.; Zhou, Z.; Wang, X.; Zhang, K.; Han, S. Changes in Soil Microbial Community along a Chronosequence of Perennial Mugwort Cropping in Northern China Plain. Agronomy 2022, 12, 1568. [Google Scholar] [CrossRef]
- Lal, R. Soil Carbon Sequestration Impacts on Global Climate Change and Food Security. Science 2004, 304, 1623–1627. [Google Scholar] [CrossRef]
- Grace, P.R.; Antle, J.; Aggarwal, P.K.; Ogle, S.; Paustian, K.; Basso, B. Soil Carbon Sequestration and Associated Economic Costs for Farming Systems of the Indo-Gangetic Plain: A Meta-Analysis. Agric. Ecosyst. Environ. 2012, 146, 137–146. [Google Scholar] [CrossRef]
- Carating, R.B.; Galanta, R.G.; Bacatio, C.D. Soil Issues and Challenges. In Soils of the Philippines; Springer: Dordrecht, The Netherlands, 2014; pp. 273–304. [Google Scholar]
- Tziolas, N.; Tsakiridis, N.; Chabrillat, S.; Demattê, J.A.M.; Ben-Dor, E.; Gholizadeh, A.; Zalidis, G.; Wesemael, B. van Earth Observation Data-Driven Cropland Soil Monitoring: A Review. Remote Sens. 2021, 13, 4439. [Google Scholar] [CrossRef]
- Lal, R.L.R. Potential and Challenges of Conservation Agriculture in Sequestration of Atmospheric CO2 for Enhancing Climate-Resilience and Improving Productivity of Soil of Small Landholder Farms. CABI Rev. 2016, 2016, 1–16. [Google Scholar] [CrossRef]
- Sharma, M.; Kaushal, R.; Kaushik, P.; Ramakrishna, S. Carbon Farming: Prospects and Challenges. Sustainability 2021, 13, 11122. [Google Scholar] [CrossRef]
- FAO. World Food and Agriculture—Statistical Yearbook 2022; FAO: Rome, Italy, 2022; ISBN 978-92-5-136930-2. [Google Scholar]
- Bachmann, N.; Tripathi, S.; Brunner, M.; Jodlbauer, H. The Contribution of Data-Driven Technologies in Achieving the Sustainable Development Goals. Sustainability 2022, 14, 2497. [Google Scholar] [CrossRef]
- FAO. Soil Organic Carbon: The Hidden Potential; FAO: Rome, Italy, 2017. [Google Scholar]
- FAO. Measuring and Modelling Soil Carbon Stocks and Stock Changes in Livestock Production Systems: Guide-Lines for Assessment (Version 1); Livestock Environmental Assessment and Performance (LEAP) Partnership; Licence: CC BY-NC-SA 3.0 IGO; FAO: Rome, Italy, 2019; p. 170. [Google Scholar]
- Nicoloso, R.S.; Amado, T.J.C.; Rice, C.W. Assessing Strategies to Enhance Soil Carbon Sequestration with the DSSAT-CENTURY Model. Eur. J. Soil Sci. 2020, 71, 1034–1049. [Google Scholar] [CrossRef]
- Jayaraman, S.; Sahu, M.; Sinha, N.K.; Mohanty, M.; Chaudhary, R.S.; Yadav, B.; Srivastava, L.K.; Hati, K.M.; Patra, A.K.; Dalal, R.C. Conservation Agricultural Practices Impact on Soil Organic Carbon, Soil Aggregation and Greenhouse Gas Emission in a Vertisol. Agriculture 2022, 12, 1004. [Google Scholar] [CrossRef]
- Almaraz, M.; Wong, M.Y.; Geoghegan, E.K.; Houlton, B.Z. A Review of Carbon Farming Impacts on Nitrogen Cycling, Retention, and Loss. Ann. N. Y. Acad. Sci. 2021, 1505, 102–117. [Google Scholar] [CrossRef]
- Appunn, K. Carbon Farming Explained: The Pros, the Cons and the EU’s Plans 2022. Available online: https://www.cleanenergywire.org/factsheets/carbon-farming-explained-pros-cons-and-eus-plans (accessed on 5 August 2024).
- Yu, Y.; Huang, Y.; Zhang, W. Modeling Soil Organic Carbon Change in Croplands of China, 1980–2009. Glob. Planet. Chang. 2012, 82–83, 115–128. [Google Scholar] [CrossRef]
- Page, M.J.; Moher, D.; Bossuyt, P.M.; Boutron, I.; Hoffmann, T.C.; Mulrow, C.D.; Shamseer, L.; Tetzlaff, J.M.; Akl, E.A.; Brennan, S.E.; et al. PRISMA 2020 Explanation and Elaboration: Updated Guidance and Exemplars for Reporting Systematic Reviews. BMJ 2021, 372, n160. [Google Scholar] [CrossRef]
- Tirol-Padre, A.; Rai, M.; Kumar, V.; Gathala, M.; Sharma, P.C.; Sharma, S.; Nagar, R.K.; Deshwal, S.; Singh, L.K.; Jat, H.S.; et al. Quantifying Changes to the Global Warming Potential of Rice Wheat Systems with the Adoption of Conservation Agriculture in Northwestern India. Agric. Ecosyst. Environ. 2016, 219, 125–137. [Google Scholar] [CrossRef]
- Kwon, H.; Ugarte, C.M.; Ogle, S.M.; Williams, S.A.; Wander, M.M. Use of Inverse Modeling to Evaluate CENTURY-Predictions for Soil Carbon Sequestration in US Rain-Fed Corn Production Systems. PLoS ONE 2017, 12, e0172861. [Google Scholar] [CrossRef]
- Toensmeier, E. The Carbon Farming Solution: A Global Toolkit of Perennial Crops and Regenerative Agriculture Practices for Climate Change Mitigation and Food Security; Chelsea Green Publishing: Chelsea, VT, USA, 2016; ISBN 978-1-60358-571-2. [Google Scholar]
- Eck, N.J.V.; Waltman, L. VOSviewer, a Computer Program for Bibliometric Mapping. Scientometrics 2010, 84, 523–538. [Google Scholar] [PubMed]
- Kumara, T.M.K.; Kandpal, A.; Pal, S. A Meta-Analysis of Economic and Environmental Benefits of Conservation Agriculture in South Asia. J. Environ. Manag. 2020, 269, 110773. [Google Scholar] [CrossRef]
- Aller, D.M.; Archontoulis, S.V.; Zhang, W.; Sawadgo, W.; Laird, D.A.; Moore, K. Long Term Biochar Effects on Corn Yield, Soil Quality and Profitability in the US Midwest. Field Crops Res. 2018, 227, 30–40. [Google Scholar] [CrossRef]
- Liu, E.; Teclemariam, S.G.; Yan, C.; Yu, J.; Gu, R.; Liu, S.; He, W.; Liu, Q. Long-Term Effects of No-Tillage Management Practice on Soil Organic Carbon and Its Fractions in the Northern China. Geoderma 2014, 213, 379–384. [Google Scholar] [CrossRef]
- Civeira, G. Estimation of Carbon Inputs to Soils from Wheat in the Pampas Region, Argentina. Czech J. Genet. Plant Breed. 2011, 47, S39–S42. [Google Scholar] [CrossRef]
- IPCC Climate Change and Land: An IPCC Special Report on Climate Change, Desertification, Land Degradation, Sustainable Land Management, Food Security, and Greenhouse Gas Fluxes in Terrestrial Ecosystems. 2019. Available online: https://policycommons.net/artifacts/9774155/climate-change-and-land/10669611/ (accessed on 12 April 2023).
- Saljnikov, E.; Koković, N.; Grujić, T.; Životić, L.; Tošić Jojević, S.; Lazović, V.; Jačimović, G. Carbon Stocks, Sequestration Rate and Efficiency over 50 Years of Increasing Mineral N Fertilization. Biol. Life Sci. Forum 2023, 27, 7. [Google Scholar] [CrossRef]
- European Commission. New EU Forest Strategy for 2030; European Commission: Luxembourg, 2021. [Google Scholar]
- Song, C.; Wang, G.; Hu, Z.; Zhang, T.; Huang, K.; Chen, X.; Li, Y. Net Ecosystem Carbon Budget of a Grassland Ecosystem in Central Qinghai-Tibet Plateau: Integrating Terrestrial and Aquatic Carbon Fluxes at Catchment Scale. Agric. For. Meteorol. 2020, 290, 108021. [Google Scholar] [CrossRef]
- Xiang, Y.; Cheng, M.; Wen, Y.; Darboux, F. Soil Organic Carbon Sequestration under Long-Term Chemical and Ma-nure Fertilization in a Cinnamon Soil, Northern China. Sustainability 2022, 14, 5109. [Google Scholar] [CrossRef]
- Aquino, A.L.; Cruz, P.C.S.; Zamora, O.B.; Aguilar, E. Carbon Sequestration in Organic and Conventional Corn Production System. 2017. Available online: https://www.researchgate.net/publication/342690843_Carbon_Sequestration_in_Organic_and_Conventional_Corn_Production_System (accessed on 6 August 2024).
- López-Fando, C.; Pardo, M.T. Soil Carbon Storage and Stratification under Different Tillage Systems in a Semi-Arid Region. Soil Tillage Res. 2011, 111, 224–230. [Google Scholar] [CrossRef]
- Olorunfemi, I.E.; Fasinmirin, J.T.; Olufayo, A.A.; Komolafe, A.A. Total Carbon and Nitrogen Stocks under Different Land Use/Land Cover Types in the Southwestern Region of Nigeria. Geoderma Reg. 2020, 22, e00320. [Google Scholar] [CrossRef]
- Weber, J.; Mielnik, L.; Leinweber, P.; Hewelke, E.; Kocowicz, A.; Jamroz, E.; Podlasiński, M. The Influence of Different, Long-Term Fertilizations on the Chemical and Spectroscopic Properties of Soil Organic Matter. Agronomy 2024, 14, 837. [Google Scholar] [CrossRef]
- Benbi, D.K.; Brar, K.; Toor, A.S.; Singh, P. Total and Labile Pools of Soil Organic Carbon in Cultivated and Undisturbed Soils in Northern India. Geoderma 2015, 237–238, 149–158. [Google Scholar] [CrossRef]
- Walkley, A.; Black, I.A. An Examination of the Degtjareff Method for Determining Soil Organic Matter, and a Proposed Modification of the Chromic Acid Titration Method. Soil Sci. 1934, 37, 29–38. [Google Scholar] [CrossRef]
- Shamrikova, E.V.; Kondratenok, B.M.; Tumanova, E.A.; Vanchikova, E.V.; Lapteva, E.M.; Zonova, T.V.; Lu-Lyan-Min, E.I.; Davydova, A.P.; Libohova, Z.; Suvannang, N. Transferability between Soil Organic Matter Measurement Methods for Database Harmonization. Geoderma 2022, 412, 115547. [Google Scholar] [CrossRef]
- Shamrikova, E.V.; Vanchikova, E.V.; Lu-Lyan-Min, E.I.; Kubik, O.S.; Zhangurov, E.V. Which Method to Choose for Measurement of Oranic and Inorganic Carbon Content in Carbonate-Rich Soils? Advantages and Disadvantages of Dry and Wet Chemistry. Catena 2023, 228, 107151. [Google Scholar] [CrossRef]
- Fowler, A.F.; Basso, B.; Millar, N.; Brinton, W.F. A Simple Soil Mass Correction for a More Accurate Determination of Soil Carbon Stock Changes. Sci. Rep. 2023, 13, 2242. [Google Scholar] [CrossRef]
- Martín-Lammerding, D.; Tenorio, J.L.; Albarrán, M.M.; Zambrana, E.; Walter, I. Influence of Tillage Practices on Soil Biologically Active Organic Matter Content over a Growing Season under Semiarid Mediterranean Climate. Span. J. Agric. Res. 2013, 11, 232. [Google Scholar] [CrossRef]
- Ramachandra, T.V.; Bharath, S. Global Warming Mitigation Through Carbon Sequestrations in the Central Western Ghats. Remote Sens. Earth Syst. Sci. 2019, 2, 39–63. [Google Scholar] [CrossRef]
- Bahri, H.; Annabi, M.; M’Hamed, H.C.; Frija, A. Assessing the Long-Term Impact of Conservation Agriculture on Wheat-Based Systems in Tunisia Using APSIM Simulations under a Climate Change Context. Sci. Total Environ. 2019, 692, 1223–1233. [Google Scholar] [CrossRef]
- Spotorno, S.; Gobin, A.; Vanongeval, F.; Del Borghi, A.; Gallo, M. Carbon Farming Practices Assessment: Modelling Spatial Changes of Soil Organic Carbon in Flanders, Belgium. Sci. Total Environ. 2024, 922, 171267. [Google Scholar] [CrossRef]
- Sapino, F.; Pérez-Blanco, C.D.; Gutiérrez-Martín, C.; Frontuto, V. An Ensemble Experiment of Mathematical Programming Models to Assess Socio-Economic Effects of Agricultural Water Pricing Reform in the Piedmont Region, Italy. J. Environ. Manag. 2020, 267, 110645. [Google Scholar] [CrossRef]
- Le, K.N.; Jha, M.K.; Reyes, M.R.; Jeong, J.; Doro, L.; Gassman, P.W.; Hok, L.; Sá, J.C.D.M.; Boulakia, S. Evaluating Carbon Sequestration for Conservation Agriculture and Tillage Systems in Cambodia Using the EPIC Model. Agric. Ecosyst. Environ. 2018, 251, 37–47. [Google Scholar] [CrossRef]
- Tong, X.; Xu, M.; Wang, X.; Bhattacharyya, R.; Zhang, W.; Cong, R. Long-Term Fertilization Effects on Organic Carbon Fractions in a Red Soil of China. Catena 2014, 113, 251–259. [Google Scholar] [CrossRef]
- Baiamonte, G.; Gristina, L.; Orlando, S.; Palermo, S.S.; Minacapilli, M. No-Till Soil Organic Carbon Sequestration Patterns as Affected by Climate and Soil Erosion in the Arable Land of Mediterranean Europe. Remote Sens. 2022, 14, 4064. [Google Scholar] [CrossRef]
- Kirkegaard, J.; Kirkby, C.; Oates, A.; van der Rijt, V.; Poile, G.; Conyers, M. Strategic Tillage of a Long-Term, No-till Soil Has Little Impact on Soil Characteristics or Crop Growth over Five Years. Crop Pasture Sci. 2020, 71, 945. [Google Scholar] [CrossRef]
- Adhikari, K.R.; Dahal, K.R.; Chen, Z.-S.; Tan, Y.-C.; Lai, J.-S. Rice–Wheat Cropping System: Tillage, Mulch, and Nitrogen Effects on Soil Carbon Sequestration and Crop Productivity. Paddy Water Environ. 2017, 15, 699–710. [Google Scholar] [CrossRef]
- Tadiello, T.; Potenza, E.; Marino, P.; Perego, A.; Torre, D.D.; Michelon, L.; Bechini, L. Growth, Weed Control, and Nitrogen Uptake of Winter-Killed Cover Crops, and Their Effects on Maize in Conservation Agriculture. Agron. Sustain. Dev. 2022, 42, 18. [Google Scholar] [CrossRef]
- Eddy, W.C.; Yang, W.H. Improvements in Soil Health and Soil Carbon Sequestration by an Agroforestry for Food Production System. Agric. Ecosyst. Environ. 2022, 333, 107945. [Google Scholar] [CrossRef]
- Zhang, G.; Wang, X.; Zhang, L.; Xiong, K.; Zheng, C.; Lu, F.; Zhao, H.; Zheng, H.; Ouyang, Z. Carbon and Water Footprints of Major Cereal Crops Production in China. J. Clean. Prod. 2018, 194, 613–623. [Google Scholar] [CrossRef]
- Woźniak, A. Production Efficiency of Different Crop Rotations and Tillage Systems. Span. J. Agric. Res. 2021, 19, e0907. [Google Scholar] [CrossRef]
- Clay, D.E.; Chang, J.; Clay, S.A.; Stone, J.; Gelderman, R.H.; Carlson, G.C.; Reitsma, K.; Jones, M.; Janssen, L.; Schumacher, T. Corn Yields and No-Tillage Affects Carbon Sequestration and Carbon Footprints. Agron. J. 2012, 104, 763–770. [Google Scholar] [CrossRef]
- Stern, A.J.; Doraiswamy, P.C.; Hunt, E.R. Changes of Crop Rotation in Iowa Determined from the United States Department of Agriculture, National Agricultural Statistics Service Cropland Data Layer Product. J. Appl. Remote Sens. 2012, 6, 063590. [Google Scholar] [CrossRef]
- Liu, Z.; Gao, T.; Liu, W.; Sun, K.; Xin, Y.; Liu, H.; Wang, S.; Li, G.; Han, H.; Li, Z.; et al. Effects of Part and Whole Straw Returning on Soil Carbon Sequestration in C3–C4 Rotation Cropland. J. Plant Nutr. Soil Sci. 2019, 182, 429–440. [Google Scholar] [CrossRef]
- Detheridge, A.P.; Brand, G.; Fychan, R.; Crotty, F.V.; Sanderson, R.; Griffith, G.W.; Marley, C.L. The Legacy Effect of Cover Crops on Soil Fungal Populations in a Cereal Rotation. Agric. Ecosyst. Environ. 2016, 228, 49–61. [Google Scholar] [CrossRef]
- Dong, D.; Yang, W.; Sun, H.; Kong, S.; Xu, H. Effects of Animal Manure and Nitrification Inhibitor on N2O Emissions and Soil Carbon Stocks of a Maize Cropping System in Northeast China. Sci. Rep. 2022, 12, 15202. [Google Scholar] [CrossRef] [PubMed]
- Cong, W.-F.; Hoffland, E.; Li, L.; Six, J.; Sun, J.-H.; Bao, X.-G.; Zhang, F.-S.; Werf, W.V.D. Intercropping Enhances Soil Carbon and Nitrogen. Glob. Chang. Biol. 2015, 21, 1715–1726. [Google Scholar] [CrossRef]
- Hu, C.; Xia, X.; Han, X.; Chen, Y.; Qiao, Y.; Liu, D.; Li, S. Soil Organic Carbon Sequestration as Influenced by Long-Term Manuring and Fertilization in the Rice-Wheat Cropping System. Carbon Manag. 2018, 9, 619–629. [Google Scholar] [CrossRef]
- Liu, W.-X.; Wei, Y.-X.; Li, R.-C.; Chen, Z.; Wang, H.-D.; Virk, A.L.; Lal, R.; Zhao, X.; Zhang, H.-L. Improving Soil Aggregates Stability and Soil Organic Carbon Sequestration by No-till and Legume-Based Crop Rotations in the North China Plain. Sci. Total Environ. 2022, 847, 157518. [Google Scholar] [CrossRef]
- Fan, H.; Chen, Q.; Qin, Y.; Chen, K.; Tu, S.; Xu, M.; Zhang, W. Soil Carbon Sequestration under Long-Term Rice-Based Cropping Systems of Purple Soil in Southwest China. J. Integr. Agric. 2015, 14, 2417–2425. [Google Scholar] [CrossRef]
- Brar, B.S.; Singh, K.; Dheri, G.S. Balwinder-Kumar Carbon Sequestration and Soil Carbon Pools in a Rice-Wheat Cropping System: Effect of Long-Term Use of Inorganic Fertilizers and Organic Manure. Soil Tillage Res. 2013, 128, 30–36. [Google Scholar] [CrossRef]
- Seremesic, S.; Ćirić, V.; Milošev, D.; Vasin, J.; Djalovic, I. Changes in Soil Carbon Stock under the Wheat-Based Cropping Systems at Vojvodina Province of Serbia. Arch. Agron. Soil Sci. 2017, 63, 388–402. [Google Scholar] [CrossRef]
- Valkama, E.; Kunypiyaeva, G.; Zhapayev, R.; Karabayev, M.; Zhusupbekov, E.; Perego, A.; Schillaci, C.; Sacco, D.; Moretti, B.; Grignani, C.; et al. Can Conservation Agriculture Increase Soil Carbon Sequestration? A Modelling Approach. Geoderma 2020, 369, 114298. [Google Scholar] [CrossRef]
- Rui, W.; Zhang, W. Effect Size and Duration of Recommended Management Practices on Carbon Sequestration in Paddy Field in Yangtze Delta Plain of China: A Meta-Analysis. Agric. Ecosyst. Environ. 2010, 135, 199–205. [Google Scholar] [CrossRef]
- Xia, L.; Lam, S.K.; Wolf, B.; Kiese, R.; Chen, D.; Butterbach-Bahl, K. Trade-Offs between Soil Carbon Sequestration and Reactive Nitrogen Losses under Straw Return in Global Agroecosystems. Glob. Chang. Biol. 2018, 24, 5919–5932. [Google Scholar] [CrossRef] [PubMed]
- FAO. Statistical Yearbook World Food and Agriculture 2021; FAO: Rome, Italy, 2021. [Google Scholar]
Disclaimer/Publisher’s Note: The statements, opinions and data contained in all publications are solely those of the individual author(s) and contributor(s) and not of MDPI and/or the editor(s). MDPI and/or the editor(s) disclaim responsibility for any injury to people or property resulting from any ideas, methods, instructions or products referred to in the content. |
© 2024 by the authors. Licensee MDPI, Basel, Switzerland. This article is an open access article distributed under the terms and conditions of the Creative Commons Attribution (CC BY) license (https://creativecommons.org/licenses/by/4.0/).