Article

Implementation of Sustainable Development Goal 3: Good Health and Well-Being in European Union Countries in the Context of the COVID-19 Pandemic

Department of Economics and Economic Policy, Institute of Economics and Finance, Warsaw University of Life Sciences, 02-787 Warsaw, Poland
*
Author to whom correspondence should be addressed.
Sustainability 2024, 16(18), 7921; https://doi.org/10.3390/su16187921
Submission received: 24 July 2024 / Revised: 9 September 2024 / Accepted: 9 September 2024 / Published: 11 September 2024
(This article belongs to the Special Issue Economic and Social Consequences of the COVID-19 Pandemic)

Abstract

:
The COVID-19 pandemic has significantly disrupted many countries’ economic, social, and political systems. The health and well-being sector has been particularly affected, necessitating unprecedented measures from governments globally. These measures were designed to safeguard societies from the virus and ensure the availability of healthcare services for those in need. This article assesses the implementation of the third Sustainable Development Goal (SDG)—good health and well-being—in European Union (EU-26) countries before and during the pandemic. The analysis aimed to answer two basic questions: (1) To what extent has the level of implementation of SDG 3 changed in individual EU-26 member states during the study period? and (2) During the analyzed period, has there been a reduction or deepening of disparities in the implementation of SDG 3 between the EU-26 countries? The study covers the years from 2019 to 2021, spanning the pre-pandemic period and its subsequent duration. The evaluation of the goal’s implementation was based on indicators monitored by Eurostat and employed the dynamic linear ordering method. The analysis revealed significant variations in SDG 3 implementation among the EU-26 countries. Over the analyzed years, The Netherlands and Sweden consistently occupied the top positions in the rankings, while Lithuania, Latvia, and Romania lagged. The pandemic adversely impacted the achievement of SDG 3, with a decline in the synthetic indicator value observed in 16 of the 26 EU countries. Comparing the first and second years of the pandemic, it was noted that negative changes were especially pronounced in 2021, with the synthetic variable value decreasing in 19 countries relative to 2020. The most significant declines in the synthetic variable value in 2021, compared to 2019, were recorded in Slovakia, Latvia, and Lithuania. In contrast, the greatest increases in the synthetic variable value, indicating notable progress in achieving SDG 3 despite the pandemic, were observed in Cyprus, Luxembourg, and Finland.

1. Introduction

The issue of sustainable development has attracted significant scholarly interest and sparked widespread public debate. The concept has been defined in various ways, generally aiming to meet the needs of the present generation without compromising the ability of future generations to meet their own needs [1]. It encompasses economic, social, and environmental dimensions. The 2030 Agenda includes 17 Sustainable Development Goals (SDGs), which guide efforts toward a more sustainable and equitable world [2]. These goals build upon and extend the Millennium Development Goals (MDGs), which were in effect until 2015 [3]. Achieving the Sustainable Development Goals is critically important but is accompanied by numerous challenges. The varied economic, social, and environmental conditions across UN member states imply that the goals cannot be achieved simultaneously or at the same rate. In practice, some goals may appear particularly challenging, if not impossible, to accomplish by the 2030 deadline. Moreover, destabilizing factors significantly affect the implementation of the SDGs, potentially hindering progress and introducing additional difficulties in reaching the intended objectives [4].
The COVID-19 pandemic, caused by the SARS-CoV-2 virus, has had an unprecedented impact on lifestyles, social structures, and human health, resulting in extensive and long-lasting effects. The pandemic has exposed deep global inequalities and disrupted policy-making and the establishment of social norms, further emphasizing the urgent need for systemic changes toward a more sustainable economy that benefits both people and the planet.
SDG 3 plays a fundamental role in the sustainable development strategy, as the population’s health directly impacts social, political, and economic development. Healthy citizens are more productive, enabling them to fully participate in social life and contribute more significantly to their countries’ economies. Consequently, reducing morbidity and mortality promotes increased work efficiency and economic growth, leading to long-term development. Investments in health also contribute to an improved quality of life, forming the foundation for sustainable development.
Monitoring is a critical element in implementing the objectives of the 2030 Agenda, both globally and within the European Union. It enables the systematic assessment and visualization of progress in implementing the 17 Sustainable Development Goals. The EU is a community of diverse countries, yet they are equally aware of their challenges. Therefore, monitoring the achievements in implementing the Sustainable Development Goals is crucial. This not only allows for an assessment of the progress of individual EU countries in achieving the SDGs but also provides essential data to evaluate the effectiveness of actions taken and to formulate recommendations for the future [5].
Health and well-being were among the most significantly impacted areas of social life during the COVID-19 pandemic. Goal 3 of the 2030 Agenda—good health and well-being—aims to ensure healthy lives and promote well-being for all individuals of all ages [2]. Progress or setbacks in achieving SDG 3 notably affect the attainment of other SDGs, either advancing or delaying their realization [6,7]. Goal 3 is intricately linked with other SDGs, such as Goal 5 (gender equality), Goal 1 (no poverty), and Goal 6 (clean water and sanitation) [8]. On one hand, achieving the Sustainable Development Goal of good health and well-being facilitates progress in other areas. Research indicates strong or moderate positive correlations between SDG 3 and other SDGs related to economic development, including human capital development, infrastructure, and social justice [9,10,11]. A healthy population is a crucial human capital component and essential for sustainable development [12]. Conversely, in many countries, particularly those with lower income levels, improvements in economic-related SDGs (SDG 8) do not necessarily lead to advancements in health and well-being [13].
The World Health Organization (WHO) defines health as a state of complete physical, mental, and social well-being, enabling individuals to lead productive, meaningful, and creative lives within social and economic spheres [14,15]. The global phenomenon of an aging population presents both challenges and opportunities, particularly in the health domain. On the one hand, it is possible to increase the participation of older adults in social life by promoting their health; on the other hand, many older individuals face health issues that challenge their ability to maintain independence [16]. Despite improvements in the health of the EU population in the 21st century, significant variation in health issues persists across EU countries and globally [17,18].
The management of healthcare systems and the provision of health services in the EU fall under the jurisdiction of individual countries; however, many issues affecting daily life and collective well-being require actions at the EU level [19]. Before the pandemic, it was widely recognized that the world was inadequately prepared for such an event. Nevertheless, EU countries were considered well-prepared with some of the best-performing healthcare systems and scientific institutions globally. Most Western European countries ranked highest on the Epidemic Preparedness Index [20]. Additionally, several EU countries were rated by the Global Health Security Index as having the highest health security levels for responding to infectious disease outbreaks (The Netherlands, Sweden, Denmark, Finland, France, Germany, and Spain) [21]. The pandemic impacted all EU member states, and the limited competencies of the European Commission in public health led to significant disruptions in coordinating collective actions [22]. This resulted in varied effects across member states concerning health and quality of life. These effects were assessed based on indicators of the third Sustainable Development Goal, i.e., good health and well-being.
The COVID-19 pandemic has exacerbated the challenges associated with achieving most of the SDGs planned for 2030 [23]. Literature analyses of the pandemic’s impact on SDGs indicate that the issues span all dimensions: economic [24,25], social [26,27,28,29], and environmental [30,31]. Publications from 2020 primarily focused on the impact of the initial wave of the pandemic on the Sustainable Development Goals. Later studies typically encompassed a longer time frame, utilized a broader range of data, and provided a more comprehensive perspective on the pandemic’s effects on sustainable development than earlier research.
In contrast to these studies, Mestdagh et al. [32] observed positive changes in SDG 1 and SDG 3. They found that the pandemic and its consequences heightened interest in citizen health and healthcare systems, potentially accelerating the achievement of SDG 3 by local governments.
In the social domain, SDG 3 was among the most directly impacted by the COVID-19 pandemic, necessitating immediate action [33]. The 2023 UN report on progress toward the Sustainable Development Goals highlighted troublingly slow progress and, in many cases, regression in achieving SDG 3 globally [34]. Mortality rates have surged, healthcare systems have been severely strained, and the pandemic has adversely affected mental health [35]. Van Kersen et al. [36] argued that, beyond the direct health effects of viral infection, the COVID-19 pandemic has led to various indirect effects, such as fear of infection, stigmatization, anxiety, and depression. Similarly, Santini and Koyanagi [37] found that approximately 30% of individuals over 50 in Europe experienced mental health issues during the pandemic. Additionally, McCracken et al. [38] and Armbruster and Klotzbücher [39] confirmed an increased demand for psychological support, reflecting an intensification of the mental health crisis during the pandemic. Yeasmin et al. [26] highlighted the particular challenges faced by children during isolation, emphasizing the long-term consequences for their mental health. Rossi et al. [40] demonstrated that isolation measures were associated with increases in post-traumatic stress disorder (PTSD), anxiety, insomnia, depression, and elevated stress levels, with women and younger individuals being the most affected. Similarly, Adams-Prassl et al. [41] noted that the impact of isolation on mental health was particularly pronounced among women. Furthermore, the extent of the pandemic’s impact on perceived mental health varied based on factors such as coexisting physical illnesses [42], age [43], and educational level [44,45].
The COVID-19 pandemic has exposed significant weaknesses in healthcare systems worldwide. It disrupted healthcare services, led to the cancellation of scheduled procedures, and redirected resources toward combating the pandemic [46]. Studies by Lin et al. [47] indicated that, both before and during the COVID-19 pandemic, social determinants of health—such as healthcare availability and quality, housing conditions, social environment, and economic stability—fundamentally impact health inequalities. Lack of health insurance, overcrowded housing, and limited access to high-quality healthcare are associated with a higher risk of mortality from COVID-19 during the pandemic [47,48]. Research by Pinto et al. [49] and Malmusi et al. [50] revealed that population density and socioeconomic inequality, measured by the Gini index, correlate with a faster, exponential increase in new cases and deaths during the COVID-19 pandemic.
The isolation regulations during the pandemic necessitated a shift to remote work, which presented numerous challenges. These included not only organizational changes, technical capabilities, and digital competencies but also impacts on employee health. Workers had to rapidly transition their professional, social, and private lives to the digital realm, with insufficient time to adapt to these changes.
In this study, two research questions were posed:
  • To what extent has the level of implementation of SDG 3 changed in individual EU-26 member states during the study period?
  • During the analyzed period, has there been a reduction or deepening of disparities in the implementation of SDG 3 between the EU-26 countries?
The article formulates a single research hypothesis that directly addresses the research question of whether the COVID-19 pandemic has contributed to increasing variation in SDG 3 implementation across EU member states.
This article makes a significant contribution to research on sustainable development by introducing a new perspective for assessing the implementation of SDG 3 by applying a synthetic indicator developed using the linear ordering method in a dynamic approach. Using such an integrated dynamic indicator not only simplifies interpretation by reducing the complexity that arises from analyzing numerous diverse indicators but also enables more precise country comparisons and monitoring changes over time. This dramatically enhances the assessment of progress in achieving the Sustainable Development Goals. To the authors’ knowledge, no such study assessing progress in the implementation of SDG 3 has been conducted to date.

2. Materials and Methods

The research focused on changes in the level of attainment of the third Sustainable Development Goal—good health and well-being—in EU member states during 2019, 2020, and 2021. This period includes both the year preceding the COVID-19 pandemic and the years during the pandemic. The assessment of the attainment of this goal was based on indicators monitored by Eurostat.
The program “Transforming Our World: The 2030 Agenda for Sustainable Development”, adopted in 2015 by 193 United Nations (UN) member states, established a framework for global sustainable development. The agenda consists of 17 Sustainable Development Goals and 169 associated targets. Achieving these goals necessitates that countries not only set development objectives at the national level but also ensure the monitoring of progress towards their attainment.
EU institutions collaborate closely to develop the EU’s program and to initiate and adopt EU regulations, including those related to the SDGs. Member states hold primary responsibility for ensuring sustainable development at national, regional, and local levels. This responsibility entails integrating the SDGs into national policies and allocating resources to support their achievement.
In the literature on the subject, attempts can be found to operationalize the level of sustainable development in various countries or regions worldwide. The challenges in measuring sustainable development arise from definitional diversity and the range of factors that determine this development. A lack of consensus among researchers on the importance of different dimensions shaping sustainable development results in multiple methods for measuring this phenomenon [51].
The 2030 Agenda for Sustainable Development, adopted at the UN level in 2015, includes 17 goals and 304 indicators to monitor and analyze specific activities. These indicators were developed by the Inter-Agency and Expert Group on SDG Indicators and approved by the UN Statistical Commission [52]. They have a global character, applying to the entire world.
The European Union is a group of countries that have advanced in implementing the sustainable development paradigm. Therefore, monitoring changes in these countries using specially selected indicators is crucial. A separate set of indicators was adopted to track progress in achieving the Sustainable Development Goals in the EU. These indicators aim to transparently show progress in achieving the Sustainable Development Goals within the EU context [53,54]. The set includes about 100 indicators linked to EU policy initiatives. It undergoes annual reviews to incorporate indicators from new data sources and reflect new goals aligned with EU priorities, such as the European Green Deal and other initiatives [55].
Eurostat plays a crucial role in monitoring progress towards the SDGs within the EU context. It coordinates the development and updating of the EU SDG indicator set and publishes regular monitoring reports on progress. The EU SDG indicator set comprises 100 indicators organized according to the 17 SDGs. These indicators are grouped into sub-themes to emphasize interconnections and various aspects of each SDG. The EU SDG indicators are closely linked to EU policy initiatives. Monitoring progress emphasizes aspects of the SDGs relevant from an EU perspective rather than focusing on the 169 targets of the 2030 Agenda. All pertinent information and the set of monitoring indicators are available in the Eurostat SDG database [56].
A pre-existing set of indicators developed and published by Eurostat was selected for this study. These indicators assess the level of achievement of SDG 3 and are measured in each member country, allowing for comparison of progress among member states. Progress toward achieving Goal 3 of sustainable development is monitored using 12 indicators.
Although the indicators used to assess the achievement of SDG 3 are essential, they have several limitations that may affect the accuracy and comprehensiveness of the analysis. Primarily, they omit vital areas such as mental health, access to modern therapies, management of chronic diseases, and disparities in healthcare access across different regions, which may limit the complete picture of population health and well-being. Furthermore, the indicators themselves also have certain limitations. Indicator x1—“Share of people with good or very good perceived health” is a subjective measure, with one of its main limitations being the difficulty in interpretation across different age groups and cultural contexts. While there are weaknesses in self-reported health assessments, most studies suggest that this indicator is particularly significant in assessing population health. It is also becoming increasingly predictive of objective health and mortality due to the widespread availability of health information in developed countries [57]. Indicators based on this concept can be used to assess health status, health inequalities, or healthcare needs [58].
The value of variable x2—“Self-reported unmet needs for medical care” is derived from data reported by respondents, making it somewhat dependent on respondents’ subjective perceptions and their social and cultural background. Another factor is the varying organization of healthcare services, whether at the national or local level. All these factors must be considered when analyzing data and interpreting results.
Despite these limitations, the prepared set of indicators provides the opportunity to compare progress in achieving SDG 3 among EU member states.
A primary and widely used method for assessing the effectiveness of SDG achievement involves evaluating the degree of attainment of individual goals and creating rankings. The linear ordering method is commonly employed in research when dealing with numerous variables. This method generates a synthetic variable that allows for the ranking of entities based on the value of the studied phenomenon. The analysis can be conducted statically or dynamically [59]. A static approach allows for the construction of rankings of entities for individual years. Still, it does not facilitate the assessment of changes in the level of the studied phenomenon, which is possible with a dynamic approach [60]. This study utilized a dynamic approach (Figure 1) to determine changes in the level of achievement of the third SDG during the COVID-19 pandemic.
The application of multidimensional analysis necessitates several stages of research. The initial stage involves selecting variables that describe the phenomenon under investigation. In this study, we used a set of predefined indicators provided by Eurostat to measure the achievement level of the chosen goal. These indicators were evaluated for their informational value, considering two criteria: discriminatory power and the capacity of the variables (i.e., their degree of correlation with other characteristics). A critical value for the coefficient of variation (V) was set at V = 10% to eliminate quasi-constant variables. Strong correlations between the analyzed variables could lead to the duplication of informational content, thereby amplifying their influence on the synthetic variable. Consequently, it is necessary to establish a threshold for the correlation coefficient above which one of the variables is to be eliminated. This threshold should be neither too high to avoid redundant information nor too low, which may lead to significant information loss. Variables with a correlation coefficient of at least 0.75 were therefore excluded.
In the subsequent stage of the study, normalization was performed using the zero-unit normalization method to standardize the magnitudes of the variables. As discussed by Sompolska-Rzechuła and Kurdyś-Kujawska [61] and Sompolska-Rzechuła [62], based on the work of Kukuła [63,64], this method satisfies all the requirements of standardization procedures, which include:
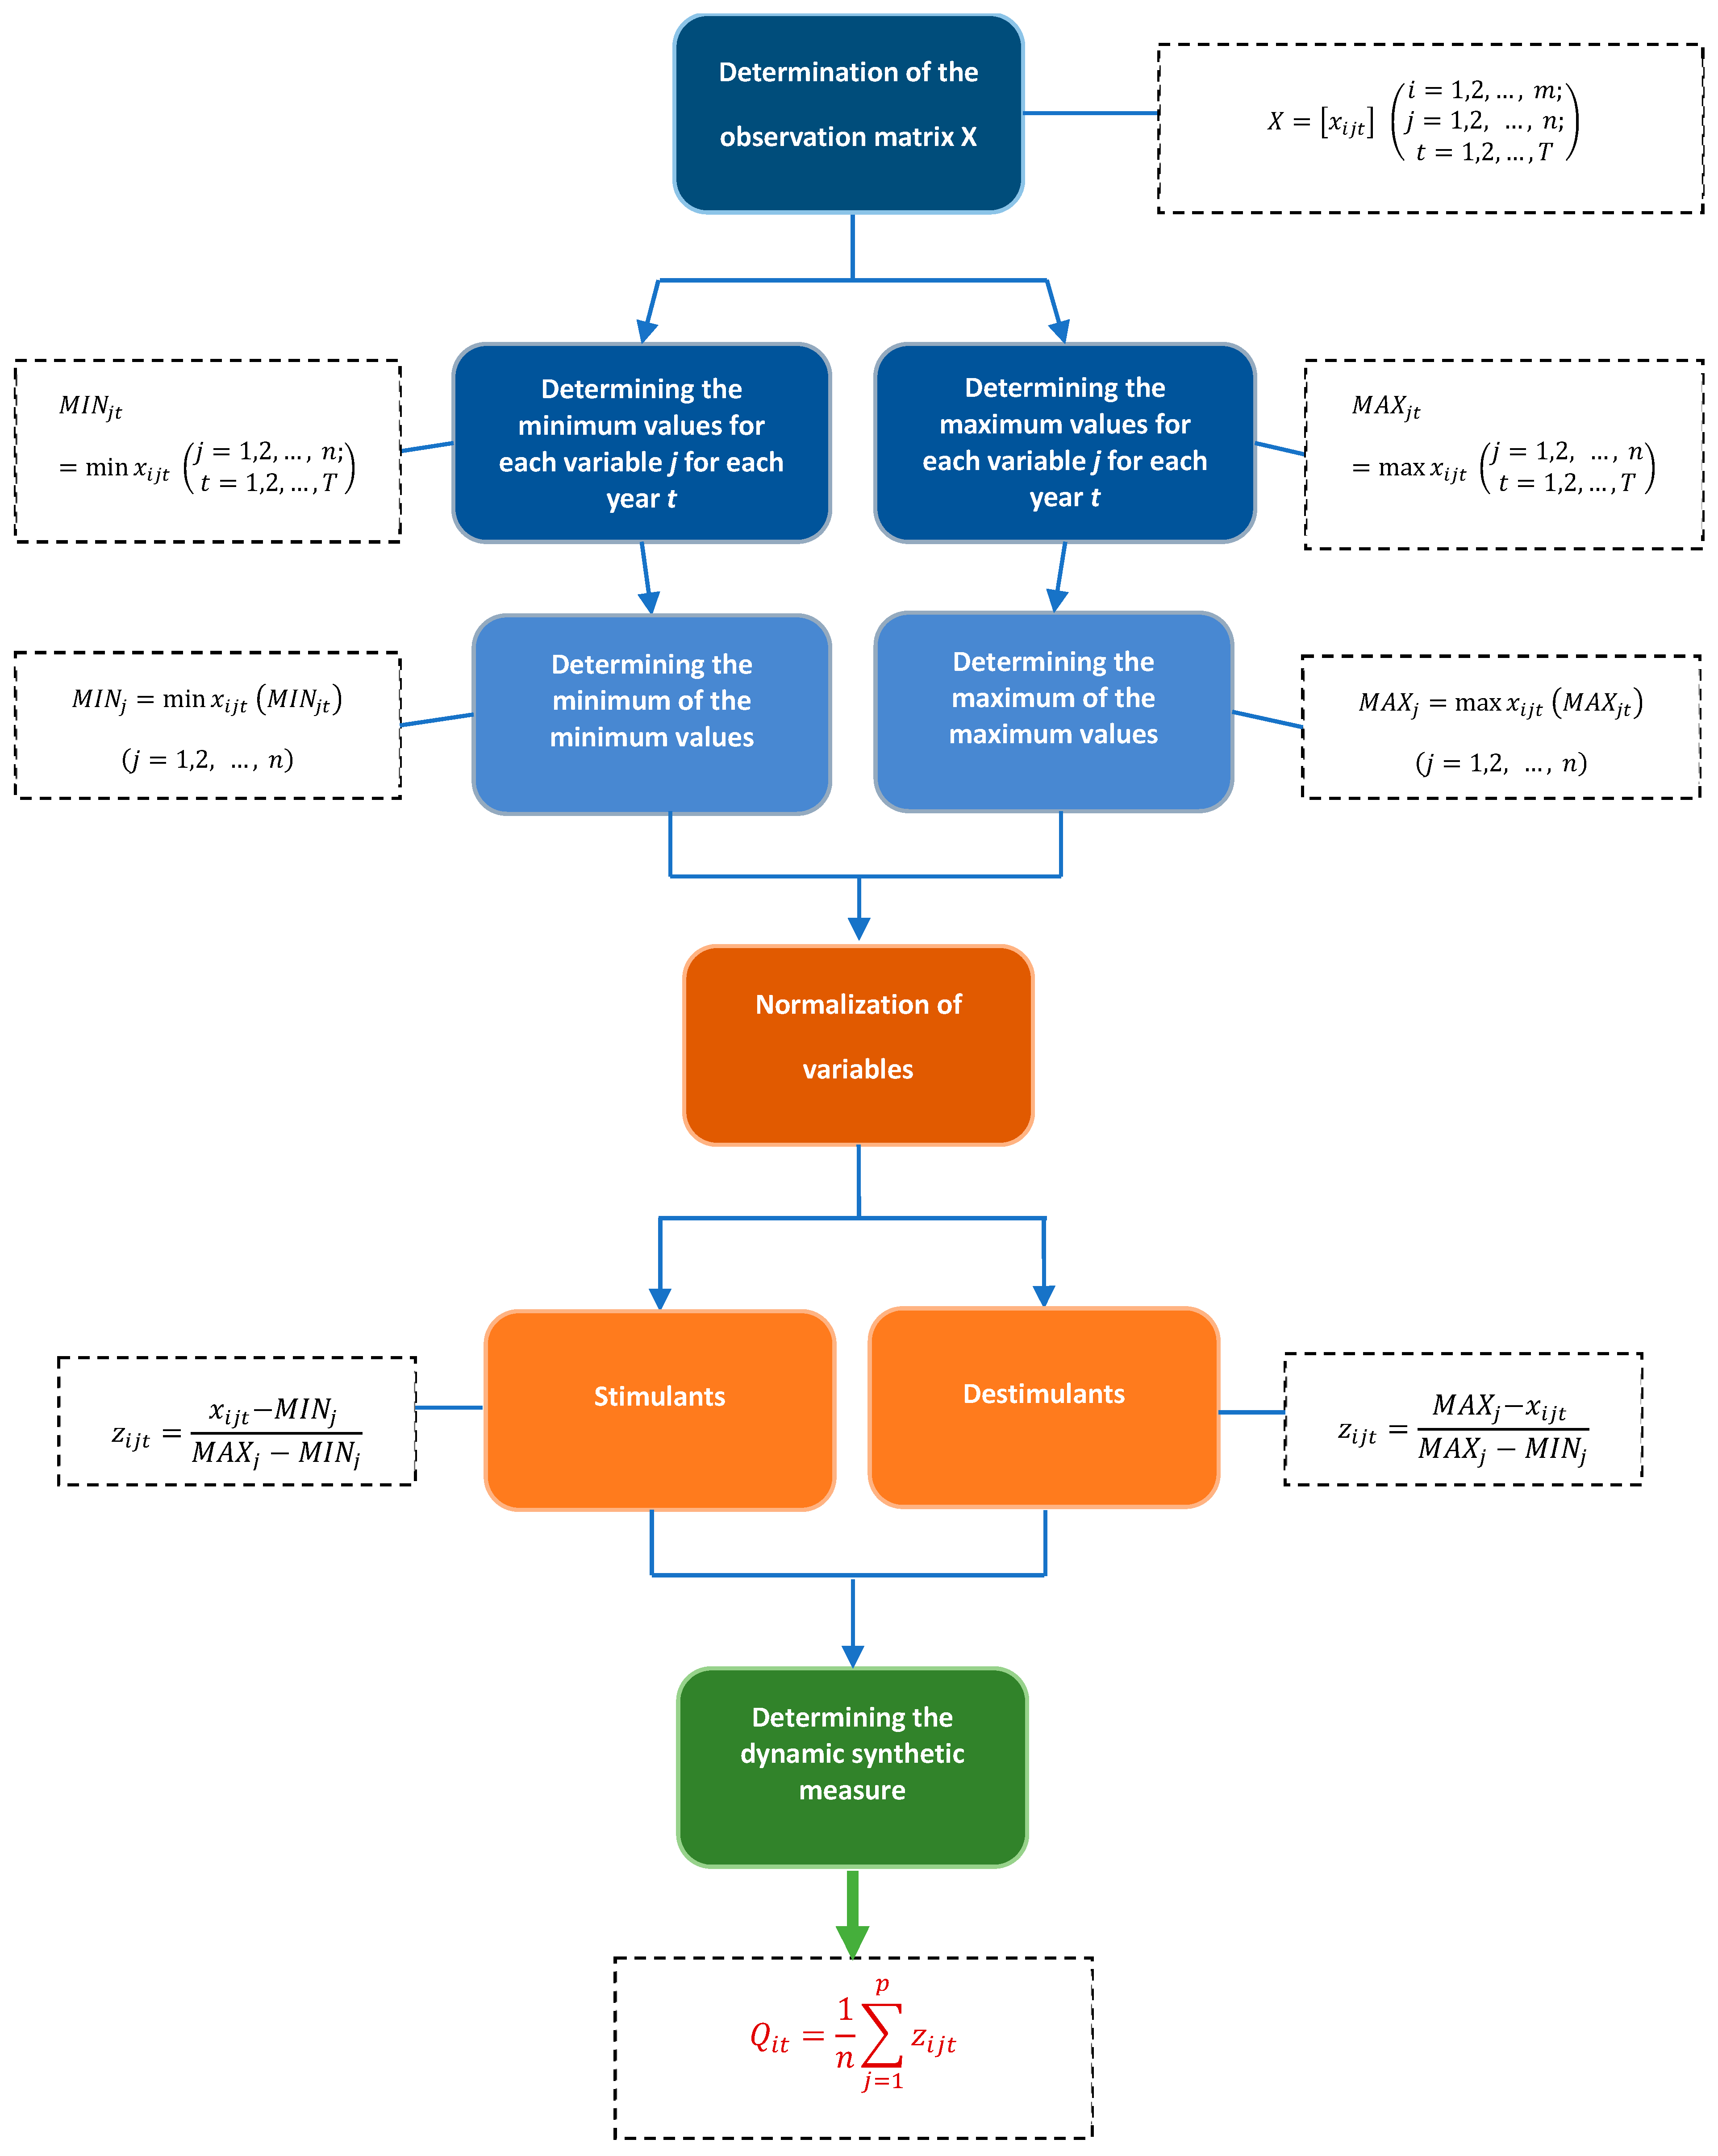
  • Elimination of units of measurement for the diagnostic features;
  • Reduction of the magnitude order of diagnostic variables to a comparable state, meaning equalizing the ranges of the variability of features and, consequently, enabling their aggregation;
  • Equality in the range of variability of all standardized features (constant range) and uniformity in the lower and upper limits of their variability range, specifically within the interval [0, 1];
  • Capability to normalize diagnostic features with positive, negative, or exclusively negative values;
  • Capability to normalize features that assume a value of zero;
  • Non-negative values for standardized features;
  • Existence of straightforward formulas within the normalization procedure that standardize the characteristics of the variables.
Other commonly used normalization methods, such as standardization, ratio transformation, or ranking methods, only meet some of the mentioned requirements, and not always fully. Therefore, it can be concluded that only the zero unitarization method, which takes all the abovementioned postulates into account, ensures a universal normalization of features, regardless of their nature, magnitude, or sign [65].
Normalization is executed as follows:
  • for stimulating factors:
    z i j t = x i j t M I N j M A X j M I N j ,
  • for destimulant factors:
    z i j t = M A X j x i j t M A X j M I N j ,
    where zijt is the normalized value of xijt, xijt denotes the value of the j-th feature for the i-th object in year t, MINj is the minimum value that the j-th variable attains in the studied years, and MAXj is the maximum value that the j-th variable attains in the studied years.
It was assumed that all selected diagnostic features are equally important; therefore, no differentiating weights were introduced.
The synthetic indicator was calculated based on the following formula:
Q i t = 1 n j = 1 p z i j t
where Qit is the synthetic value for the i-th object in year t, and n is the number of features.
The synthetic variable takes values in the range [0, 1]. A higher numerical level of the synthetic measure indicates a higher rank and higher level of achievement of SDG 3. Comparing the value of this indicator for the same object in years t1 and t2 allows for the assessment of the direction and magnitude of changes that occurred in this object from t1 to t2 [60].

3. Results

Progress towards achieving Sustainable Development Goal 3 is monitored using 12 indicators, six of which are listed in Table 1. Six indicators not used in the study include the tobacco smoking rate, obesity rate, healthy life years at birth, road traffic deaths, consumption of antibiotics in the community and hospital sectors, and the population living in households that consider themselves affected by noise. Definitions of these indicators are available on the Eurostat website but were excluded from this analysis.
The exclusion of four indicators was due to various reasons. Notably, some indicators are not measured annually. The tobacco smoking rate is updated every three years, and the obesity rate is updated biennially. Consequently, these indicators were omitted from further analysis. Additionally, during the study period, data on the percentage of the population reporting noise disturbance in households were unavailable for 2021, and data on antibiotic consumption in the community and hospital sectors were incomplete for all EU countries. These factors led to their exclusion from further research. The coefficient of variation for the remaining indicators was calculated, revealing insufficient variation for the healthy life years at birth indicator. Pearson’s linear correlation coefficients were then computed for each pair of the remaining indicators for each year separately, leading to the elimination of the road traffic fatality rate indicator. As a result, six indicators were selected to assess progress towards achieving SDG 3:
  • Share of people with good or very good perceived health (x1);
  • Self-reported unmet needs for medical care (x2);
  • Standardized death rate due to tuberculosis, HIV, and hepatitis (x3);
  • Preventable and treatable mortality rate (x4);
  • Fatal accidents at work per 100,000 workers (x5);
  • Premature deaths due to exposure to fine particulate matter PM2.5 (x6).
Descriptions of these indicators are presented in Table 1.
One of the primary objectives of European health policy is to extend healthy life expectancy. This goal not only enhances individual well-being but also reduces public healthcare expenditures. The self-assessed health status indicator can predict future healthcare utilization and mortality, while the unmet healthcare needs indicator evaluates the accessibility of medical care. According to the European Pillar of Social Rights, everyone has the right to access sexual and reproductive health services and to safe, affordable, and effective medicines and vaccines for all. The age-standardized mortality rates used in these indicators account for the fact that countries with a higher proportion of older residents also have higher mortality rates. Other indicators address health risk factors, such as working conditions that should meet certain standards and environmental pollution. EU climate and environmental policy also aim to improve health and well-being, recognizing noise pollution as a significant environmental problem impacting human health and well-being, similar to air pollution [66].
The variable x1 was considered a stimulant, while the others were deemed deterrents to achieving SDG 3. The study encompassed 26 EU member countries, excluding Italy, due to missing data for 2020 for two indicators, x1 and x2.
Atypical data points within a dataset can influence the accurate interpretation of analysis results. These data points, called outliers, are often labeled as noise, error, exception, anomaly, or imperfection [67]. Outliers can significantly affect the results of an analysis. However, the occurrence of remote observations is not always detrimental. Many researchers address the issue of outliers and present various methods for managing them [68]. Remote observations may arise from measurement errors or may represent true, albeit rare and unusual, behavior of the phenomenon under study. In the latter case, such observations should not be discarded, as they typically contain significant informational value [69]. The optimal approach is to identify the cause of the outliers and take steps to improve data quality. A particularly useful tool for identifying outliers is the box plot, which effectively highlights the presence of such values and is based on the quantile criterion [70]. In this context, a data point is considered an outlier if it falls outside the range [71]:
Q 1 1.5 × Q ;   Q 3 + 1.5 × Q ,
where Q1 and Q3—are the first and third quartiles of the j-th variable and Q—is the interquartile range of the j-th variable.
To address this issue, a winsorization approach was used for the values of each variable that fell outside the specified range. Winsorization involves treating outliers by assigning them a value equal to a specified quantile [72]. In this study, after identifying the outliers, a univariate approach based on the quartile criterion was employed to correct them. Specifically, 10-percentile and 90-percentile winsorization were adopted. Winsorization at the 10th and 90th percentiles involves replacing values below the 10th percentile with the value of the 10th percentile and values above the 90th percentile with the value of the 90th percentile.
Kendall’s tau correlation coefficients [73] were determined to assess the consistency of the obtained rankings. Kendall’s tau coefficient ranges from [−1, 1], with a value of 1 indicating complete agreement of orderings and a value of −1 indicating complete opposition.
The diagnostic variables used for the analysis exhibited strong asymmetry and the presence of outliers. For example, the variable “self-reported unmet needs for medical care” distribution showed very strong asymmetry, with outliers observed in countries such as Estonia and Greece. Similarly, the distribution of the variable “standardized mortality rate due to tuberculosis, HIV, and hepatitis” had outliers in Latvia and Romania, and the indicator “premature deaths due to exposure to fine particulate matter PM2.5” had outliers in Bulgaria, Poland, and Romania. Winsorization was applied to mitigate the impact of asymmetry in the distribution of variables. The results obtained based on winsorized data are presented in Table 2 of the subsequent section of the article. Table 2 characterizes the distributions of variables after replacing outliers with constant values.
The least variation among EU countries was observed for variable x1, while the greatest variation was found for variables x2 and x3.
During the analyzed period, divergent changes were observed in the values of the analyzed features. A positive change is considered to be the increase in both the mean and median share of people perceiving their health as good or very good in the first year of the pandemic. Although 2021 saw a slight decline in these values, they remained higher than in the pre-pandemic year. However, nine EU countries experienced a decrease in the indicator in 2021 compared to 2019. In seven of these countries, despite the decline, the indicator remained above the median (Ireland, Greece, Spain, Cyprus, Malta, The Netherlands, and Sweden). A decline below the median was observed for the remaining two countries, Denmark and Germany. The first year of the COVID-19 pandemic saw a decline in the percentage of people rating their health as good or very good in six EU countries. The lowest values of the indicator, i.e., the lowest percentage of people rating their health as good or very good, were observed in Lithuania across all analyzed years. In contrast, the highest values were observed in Ireland.
A decidedly negative change observed in 2021 compared to 2019 was the increase in the mean and median self-assessment of unmet medical care needs. The indicator’s values remained the highest throughout the analyzed period in Estonia and Greece, and the lowest in Malta. It is noteworthy that in the first year of the pandemic, the indicator’s values increased in nine EU countries, while the second year of the pandemic saw an increase in the indicator in 14 countries. The value of the standardized mortality rate due to tuberculosis, HIV, and hepatitis decreased. The decline in 2021 compared to 2019 occurred in all countries except the Czech Republic, Estonia, Ireland, Luxembourg, Slovakia, and Slovenia. The highest values of the variable throughout the analyzed period were observed in Latvia and Romania, where a decline in the rate was noted.
A decidedly negative change observed in 2020 and 2021 was the increase in the mean and median standardized preventable and treatable mortality rates. The year 2021, compared to 2019, saw an increase in the rate in all EU countries except Denmark.
Positive changes, i.e., a decrease in the mean value, were observed for the indicator of fatal accidents at work per 100,000 workers. However, an analysis of this indicator revealed that the first year of the pandemic resulted in a deterioration in achieving goal 3 in this area. In 2020, an increase in the indicator’s value was observed in 13 EU countries, which, due to the scale of the increases, also led to an increase in the mean analyzed value. The second year of the pandemic saw a rise in the indicator’s value in 12 EU countries, but the scale of the increase was smaller. Ultimately, both the mean value of the indicator and the median in 2021 were lower than in 2019, although in nine analyzed EU countries these values were higher in the last year of analysis than in 2019.
In the first year of the pandemic, the mean and median rates of premature deaths due to exposure to fine particulate matter (PM2.5) decreased. The lockdowns implemented in many countries during this period positively impacted the environment and air quality. However, the second year of the pandemic saw an increase in these rates, surpassing pre-pandemic levels.
Based on the discussed indicators, a synthetic measure of the achievement of SDG 3 in EU countries for the years 2019–2021 was calculated (Table 3).
In 2019, the three countries best achieving SDG 3 were Sweden, The Netherlands, and Ireland, while the three countries with the lowest levels of achievement were Lithuania, Romania, and Latvia. In 2020, the three countries with the highest levels of achievement remained the same, with Sweden and The Netherlands showing progress in achieving SDG 3. This progress was due to a decrease in the rate of fatal accidents at work and a reduction in the number of premature deaths caused by exposure to fine particulate matter, as well as an increase in the percentage of people perceiving their health as good or very good. Additionally, Sweden observed a reduction in the standardized mortality rate due to tuberculosis, HIV, and hepatitis.
The high ranking of the Netherlands over the three years can be attributed to various factors. One significant factor may be that healthcare spending per capita in The Netherlands is among the highest in the EU [74]. In 2020, healthcare spending increased by 6.5% in real terms, driven by a 9.3% rise in public funding to address the COVID-19 emergency. In 2021, healthcare spending in The Netherlands saw another significant increase of 4.6%. The high level of SDG 3 achievement in The Netherlands is likely influenced by three key factors: efficiency, accessibility, and resilience of the healthcare system. Indicators of mortality from preventable and treatable causes illustrate the system’s efficiency. In The Netherlands, these rates were 21% and 36% lower than the EU average in 2020. Over the past decade, treatable mortality rates have declined much faster than the EU average, mainly due to a reduction in deaths from ischemic heart disease and breast cancer. The high level of accessibility is demonstrated by the fact that only 0.2% of the Dutch population reported unmet medical needs during the entire analyzed period—one of the lowest rates in the EU and the same as before the pandemic. Resilience is reflected in changes in public health spending. In the years leading up to the pandemic, such spending in The Netherlands increased with GDP. The pandemic temporarily reversed this trend, as public health spending rose by more than 9% compared to a nearly 4% decline in GDP in 2020. In 2021, public health spending continued to rise more moderately, primarily driven by COVID-19-related costs [74].
Sweden’s healthcare system also demonstrates high efficiency. Low rates of preventable deaths from causes such as lung cancer, alcohol-related deaths, and traffic accidents are linked to vital public health policies. Sweden has a long-standing tradition of public health policy aimed at reducing risk factors. Low mortality rates from treatable causes indicate an effective healthcare system in avoiding deaths from potentially fatal conditions. Healthcare access is generally good, and unmet medical needs are typically low. However, access issues in remote regions have persisted, and waiting times for elective procedures have increased following the pandemic. In 2020, Sweden had a higher-than-average number of doctors and nurses per 1000 inhabitants compared to the EU, with 4.3 doctors (compared to the EU average of 4.1) and 10.7 nurses (compared to the EU average of 8.5).
Public healthcare spending rose by more than 3% in 2020 and more than 5% in 2021 in response to the pandemic. Sweden’s Recovery and Resilience Plan allocated EUR 452 million to address shortcomings in the long-term care sector revealed to the public during the pandemic [75]. In Ireland, the value of the synthetic variable decreased, indicating a deterioration in the level of SDG 3 achievement. However, this deterioration was not significant enough for Ireland to drop in the EU ranking. This decline was due to an increase in the mortality rate due to tuberculosis, HIV, and hepatitis, the preventable and treatable mortality rate, and the fatal accidents at work rate.
Conversely, the second year of the pandemic saw a decline in SDG 3 achievement in Sweden and The Netherlands, mainly due to a decrease in the percentage of people perceiving their health as good or very good, as well as an increase in the rate of fatal occupational accidents and premature deaths due to exposure to fine particulate matter (Sweden) and the preventable and treatable mortality rate (The Netherlands).
The value of the synthetic variable increased in Luxembourg, which ranked third in terms of SDG 3 achievement. This improvement was due to an increase in the percentage of people perceiving their health as good or very good and a reduction in the standardized mortality rate due to tuberculosis, HIV, and hepatitis, as well as the preventable and treatable mortality rate.
The variation in healthcare system responses stands out among the causes of the observed differences between European Union countries. These differences are mainly determined by factors such as infrastructure, the quality of public policies, culture, legislation, and human resources. Research by Lupu and Tiganasu [76] revealed that, particularly during the initial phase of the pandemic, the efficiency of healthcare systems was significantly limited, especially in Western countries such as Italy, Belgium, and Spain. During the subsequent lull and the second wave of the pandemic, Western countries that were severely affected at the onset began to implement appropriate measures and actions to improve their healthcare systems’ efficiency. In contrast, Eastern European countries, such as Bulgaria, Greece, Hungary, and Romania, continued to need help with significant issues related to the inefficiency of their healthcare systems.
Romania, Lithuania, and Latvia continued to struggle the most with achieving SDG 3 during the two years of the pandemic. In Romania, this was due to the highest rates of mortality from tuberculosis, HIV, hepatitis, and the preventable and treatable mortality rate among the analyzed countries, as well as one of the highest rates of premature deaths due to exposure to fine particulate matter. Latvia exhibited very high values for most indicators considered deterrents to achieving SDG 3 and had one of the lowest percentages of people perceiving their health as good or very good. In Lithuania, the percentage of people perceiving their health as good or very good was the lowest among the analyzed countries in both 2020 and 2021, while the standardized mortality rates due to tuberculosis, HIV, and hepatitis were among the highest.
The significant decrease in the value of the synthetic variable in Slovakia in 2021 compared to 2019 was mainly caused by a substantial increase in preventable and treatable mortality rates in the EU. The level of this indicator became one of the highest in the EU. Therefore, there is a need to implement effective public health policies to reduce the number of premature deaths. While prevention and health promotion are on the political agenda, more funding is needed. During the analyzed period, premature deaths were significantly increased due to exposure to fine particulate matter PM2.5. This may be related to a considerable rise in the excess mortality rate in Slovakia during the analyzed period. Excess mortality is the proportion of deaths from all causes above the average for the five years preceding the pandemic (2015–2019). Reported deaths due to COVID-19 accounted for more than 60% of excess deaths in Slovakia in the years 2020–2022. The higher level of excess mortality compared to COVID-19 deaths suggests either some underreporting of COVID-19 deaths or a more significant number of deaths from other causes, where COVID-19 may have been a contributing factor [77].
Similar reasons for the decrease in the value of the synthetic variable in 2021 compared to 2019 were observed in Lithuania and Latvia, where both the preventable and treatable mortality rates and premature deaths due to exposure to fine particulate matter PM2.5 increased significantly. Additionally, Lithuania and Latvia saw an increase in the fatal accidents at work indicator. In Lithuania, there was also a rise in the self-reported unmet needs for medical care indicators.
Spain experienced the largest drop in the EU country ranking in 2021 compared to 2019, falling by six positions, followed by Malta, which fell by five positions. In Spain, the most significant decline was observed in the percentage of people perceiving their health as good or very good, as well as a relatively significant increase in the percentage of people with unmet medical care needs. In Malta, there was also a decline in variable x1 and an increase in the rates of preventable and treatable mortality and fatal occupational accidents. Conversely, Cyprus recorded the largest rise in the ranking, climbing five positions, primarily due to a decrease in the rate of unmet medical care needs, the mortality rate due to tuberculosis, HIV, and hepatitis, and the rate of fatal occupational accidents. Poland also advanced by three positions, mainly due to an increase in the percentage of people perceiving their health as good or very good and a reduction in the percentage of people with unmet medical care needs.
The dynamic development level indicator enables not only ranking but also analyzing the dynamics of the studied phenomenon, allowing for an assessment of the direction and magnitude of changes. For this purpose, the development level indicators S i   t 1 ; t 2 D were calculated (Table 4).
Considering the value of the synthetic variable in a dynamic context, it can be stated that the COVID-19 pandemic caused a regression in achieving SDG 3. Lower indicator values were observed in 16 out of the 26 analyzed countries. Taking into account the first and second years of the pandemic, negative changes primarily occurred in the second year, with 19 countries showing a decrease in the value of the synthetic variable in 2021 compared to 2020. The largest decline in the value of the synthetic variable in 2021 compared to 2019 was observed in Slovakia, Latvia, and Lithuania. Conversely, the largest increase in the value of the synthetic variable, indicating the greatest progress in achieving SDG 3 despite the pandemic, occurred in Cyprus, Luxembourg, and Finland.
It is also worth noting that the variability of the synthetic variable’s values increased over the analyzed years, especially in the last year. The range of the synthetic variable widened, and the coefficient of variation increased with each subsequent year of analysis. This indicates growing disparities in achieving SDG 3 among the analyzed EU countries.
The consistency of the linear rankings of EU countries (EU-26) presented in Table 3 was evaluated using Kendall’s tau coefficient (Table 5). A significance level of p < 0.05 was adopted.
The analysis of the results confirms a statistically significant, strong correlation between countries’ positions in the presented rankings. The examination of Kendall’s tau correlation coefficients indicates a high consistency in the ordering of countries across the examined years, with the highest consistency observed between 2019 and 2020.

4. Discussion and Conclusions

Good health and well-being are crucial for every individual, government, and institution worldwide, constituting a fundamental element in pursuing the United Nations Sustainable Development Goals. This article presents changes in the level of achievement of the third SDG—good health and well-being—in the EU-26 member countries before and during the pandemic. The method of linear ordering in a dynamic context was applied using Eurostat data.
The conducted research revealed significant differences in the level of achievement of SDG 3 among EU countries. The Netherlands and Sweden consistently occupied the top two positions in the ranking across all analyzed years, while Lithuania, Latvia, and Romania performed the worst. The results of our study align with the findings of Gavurova and Megyesiova [28], who analyzed the status and development of EU member states in the context of their successes and failures in achieving SDG 3. Their study applied the TOPSIS method and ranking methods, analyzing data from two periods: 2010–2014 and 2015–2019. The results indicated that older EU member states were rated higher in terms of the adopted criteria compared to newer, mainly post-communist countries. The top-rated countries in the first period, according to the TOPSIS method, were Sweden, Denmark, and The Netherlands. In contrast, the ranking method rated Sweden, The Netherlands, and Ireland the highest. In the same period, Lithuania, Romania, and Latvia occupied the lowest positions regardless of the method used. It can therefore be concluded that the pandemic did not have a significant impact on the ranking of countries according to the degree of implementation of SDG 3, as evidenced by the high value of the Kendall’s tau correlation coefficients, however, the diversification in the degree of implementation of the discussed goal increased, which allowed us to confirm the hypothesis. The range of the synthetic variable widened, and the coefficient of variation increased with each subsequent year of analysis. The research indicated that older EU countries achieved higher levels of SDG 3 compared to new member states, a trend confirmed by our study. Our findings suggest that the COVID-19 pandemic worsened the achievement of SDG 3 in the EU. This may be due to the long-term consequences for a significant portion of COVID-19 patients post-recovery, which may have resulted in a lower percentage of people perceiving their health as good or very good. Special attention should be given to the impairment of multiple organs, particularly persistent lung function impairment and heart inflammation, as well as mental health and neurological sequelae, including post-viral fatigue syndrome [78]. There is also evidence of a noticeable decline in physical activity during the pandemic, associated with higher levels of stress and anxiety [79]. Additionally, the stress caused by isolation may have adversely affected mental health perception during the pandemic [80], with greater health concerns reported among individuals with comorbidities [81]. Furthermore, some studies have shown that during the COVID-19 pandemic, individuals with diabetes perceived a higher risk of infection, smoked, and consumed alcohol more frequently, leading to a deterioration in self-assessed health status [82]. Regardless of the amount of alcohol consumed, it can weaken the immune system [83]. Other studies indicated that as the pandemic progressed, reported risk perceptions and protective behaviors increased, and the relationship between the perceived risk of COVID-19 infection and most protective behaviors became stronger [84]. Thus, it can be inferred that the perception of infection risk can influence human behavior in various ways. Several factors can affect this perception [85], including gender, age, education, and even social media exposure or frequent exposure to news/information concerning COVID-19, which can increase anxiety symptoms [86,87].
It can be assumed that the deterioration in SDG 3 achievement during the COVID-19 pandemic may also be attributed to disruptions in access to and provision of routine and non-urgent medical care. Delays or avoidance of medical care can increase morbidity and mortality risks associated with treatable and preventable conditions and contribute to reported excess deaths directly or indirectly related to COVID-19. The increased level of unmet healthcare needs was most evident in the UK for hospital and outpatient care but less so for other healthcare services (e.g., consultations with general practitioners, purchase of over-the-counter medications, and use of prescription medications). Studies showed that unmet healthcare needs in the UK peaked during the first wave of the pandemic and then declined as the pandemic’s impact became less severe and lockdown measures were relaxed [88]. Concurrently, numerous studies have shown an increased risk of mortality from COVID-19 among individuals with comorbidities [89,90,91,92], which may have contributed to the deterioration in SDG 3 achievement.
Our findings indicate that one factor contributing to the deterioration in SDG 3 achievement during the COVID-19 pandemic in EU countries was the rise in fatal occupational accidents. Research on the pandemic’s impact on occupational safety is limited, and the available results are mixed [93]. A study conducted in Austria [94] noted a decrease in occupational accidents during the pandemic.
In the context of country ranking analysis, environmental pollution with fine particulate matter (PM2.5) also proved to be an important predictor. The relationship between air pollution and viral infections was documented as early as the 1918 Spanish flu pandemic [95] and the 2002 SARS epidemic in Southeast Asia [96]. Contemporary studies (e.g., [97,98,99]) provided evidence of a correlation between particulate pollution levels (PM2.5 or PM10) and COVID-19 symptoms and mortality rates. Renard et al. [100] found that the increased COVID-19 mortality in Western Europe associated with PM2.5 air pollution decreased as pandemic management improved both medically and socially. Nevertheless, the impact of PM2.5 pollution remained significant even after vaccination programs were implemented.
The long-term effects of the observed changes in the implementation of SDG 3 in the European Union may significantly impact future public health actions and sustainable development. In recent years, progress has been made regarding increased life expectancy, improved access to healthcare, and the fight against infectious diseases. These changes may improve the quality of life for EU citizens and strengthen socioeconomic cohesion among member states.
However, in the context of an ageing population in EU countries, there is a risk of a significant increase in healthcare and social care costs. Additionally, inequalities in access to healthcare across EU regions may hinder further progress in achieving SDG 3. Southern and Eastern EU countries often have less access to modern therapies and medical infrastructure than Western and Northern countries, which may contribute to rising health inequalities [101].
To address these challenges, several vital actions are necessary. Firstly, investment in the modernization and expansion of medical infrastructure in less-developed EU countries should be increased. Secondly, it is essential to ensure the equitable distribution of funds for research and development to equalize access to modern therapies. Furthermore, health policies to reduce healthcare access inequalities need to be introduced. Developing and implementing strategies that enhance equal access to healthcare and providing support for countries with lower levels of development in terms of access to innovative therapies and technologies are crucial for continued progress. Increased international and regional cooperation also plays an important role. Promoting joint health projects within the EU, such as research initiatives and medical staff exchange programs, can help better manage healthcare costs and improve access to modern therapies [102].
Developing effective crisis management strategies and enhancing healthcare system resilience to future health crises should be prioritized in light of growing global health challenges. The COVID-19 pandemic exposed significant gaps in the preparedness and responses of healthcare systems, underscoring the urgent need to implement comprehensive emergency management mechanisms aligned with the principles of sustainable development.
The variation in the level of implementation of SDG 3 in EU member states during the COVID-19 pandemic can be attributed to several factors. The first issue pertains to differences in responses to the threat. Containment and mitigation policies aimed at limiting the spread of the virus were implemented to varying degrees and at different times across EU member states in response to different waves of infections. Simultaneously, efforts were made to enhance the capacity of healthcare systems to cope with the surge in severe COVID-19 cases by increasing the number of hospital beds, particularly intensive care unit capacity, mobilizing healthcare workers, and expanding laboratory capabilities. Significant investments were made in information systems and digital health solutions to better track and monitor infections and improve the timeliness and granularity of health data. However, in many member states, early responses to the pandemic did not occur with the speed and scale required to address such an unprecedented crisis. In subsequent phases of the pandemic, crisis management generally improved. Nevertheless, structural weaknesses in emergency preparedness and the healthcare system’s response capacity were revealed. The main shortcomings identified included the lack of decisive action to implement an aggressive virus containment strategy, the absence of coordinated global leadership, and slow funding for the response [103,104]. Differences in the evolution of new infections and deaths due to COVID-19 across countries reflected differences in containment and mitigation strategies and their implementation timelines, as well as differences in healthcare systems’ capacity to treat COVID-19 patients and adapt to ongoing challenges. The introduction of COVID-19 vaccines in 2021 was a turning point in global efforts to control the pandemic [105]. Progress in vaccination varied significantly across countries [106]. Additionally, factors beyond the direct control of policymakers, such as geographical characteristics, population demographics, and the prevalence of certain risk factors like obesity, made some countries more susceptible to high infection and mortality rates than others [107,108,109,110]. The speed of vaccine rollout can be influenced by various factors, including regulatory approval processes, vaccine procurement and distribution strategies, and the infrastructure and capacity of medical personnel. Vaccine hesitancy and resistance among certain population groups also slowed vaccination progress in some countries. The literature provides evidence on the impact of various socioeconomic and demographic factors on key COVID-19-related variables, such as infections, hospitalizations, and mortality. The analyzed factors included income [111,112,113,114], gender and education level [115], nationality [114,116], and age [113,117].
Identifying significant factors differentiating the implementation of SDG 3 in EU countries requires in-depth analysis and goes beyond the scope of this study.
In sustainable development, it is crucial to ensure that crisis management strategies address immediate needs and incorporate long-term objectives, such as equitable access to healthcare, efficient resource utilization, and environmental protection.
Achieving sustainable development effectiveness requires a supportive policy environment in economies, including environmental regulation policies and human capital development. Local policies should be coordinated with global challenges, and it is essential to integrate scientific knowledge into policy planning and development strategies.
In summary, the results of our study can provide valuable insights into the spatial dynamics of sustainable development progress in EU countries. They can also serve as an essential knowledge base for decision-making processes and support the development of targeted interventions in areas requiring special attention. Analyzing differences in progress between countries allows for tailoring policies to specific needs and challenges, contributing to more effective achievement of sustainable development goals.
Delays in achieving the targets of SDG 3 may result in the development gap for this and other goals not narrowing over the long term, particularly as economic impacts in EU countries may lead to a reduction in financial resources allocated to healthcare systems. Therefore, monitoring the implementation of the SDGs is crucial to making timely and informed decisions. Tracking individual countries’ progress toward achieving the goals is also critical from the perspective of fulfilling all the objectives of the 2030 Agenda and setting standard development directions.
The research findings have long-term implications for achieving SDG 3, providing an overall picture of the situation regarding the issue under study. Countries with a lower level of SDG 3 achievement can benefit from the experiences of those leading the rankings. Preliminary conclusions can also be drawn regarding SDG 3 implementation, enabling the preparation of possible changes necessary for further practical actions. Authorities and policymakers can identify which areas need improvement for EU countries to fully achieve SDG 3 by 2030.
The research provides a preliminary statistical assessment of SDG 3 implementation by EU countries using the dynamic linear ordering method. In future studies on the disparities among EU countries in SDG 3 implementation, other methodological approaches should be considered to enrich the research methodology and compare the results obtained. The findings serve as a basis for expanding knowledge in this area, preparing and applying more advanced research frameworks, or broadening the scope of research conclusions. Future studies should also delve deeper into the causes of better or worse SDG 3 performance during the pandemic and include an analysis of the long-term effects of the pandemic.
When interpreting the results of this study, certain limitations must be considered. The authors acknowledge that the choice of variables used in the study does not fully reflect the comprehensive area of health and well-being in EU countries. The study utilized only the indicators for the third SDG, monitored and published by Eurostat, to assess the level of inequality. Additionally, the final ranking of objects within the linear ordering methods depends on the choice of variables and the normalization method adopted by the researchers.
The research area is vast. There are plans to further extend the analysis using linear ranking methods to other research objects, including all European countries. Future research goals using linear ranking methods will encompass other normalization algorithms and variable weighting. An equally interesting direction for future research would be to include in the analysis changes in the implementation of SDG 3 in the post-COVID-19 period and their impact on healthcare systems, as well as a deeper analysis of differences in healthcare systems, governments’ response to the pandemic, and changes in the economic situation of individual EU member states.

Author Contributions

Conceptualization, A.M.; methodology, A.M.; software, A.M. and M.R.; validation, M.U.; formal analysis, A.M.; investigation, A.M.; resources, A.M., M.R. and M.U.; data curation, A.M.; writing—original draft, A.M., M.R. and M.U.; writing—review and editing, A.M., M.R. and M.U.; visualization, M.R.; supervision, A.M.; project administration, A.M.; funding acquisition, A.M., M.R. and M.U. All authors have read and agreed to the published version of the manuscript.

Funding

This research received no external funding.

Institutional Review Board Statement

Not applicable.

Informed Consent Statement

Not applicable.

Data Availability Statement

The data analyzed in this study can be found on Eurostat https://ec.europa.eu/eurostat/web/sdi/database (accessed on 10 July 2024).

Conflicts of Interest

The authors declare no conflict of interest.

References

  1. Keeble, B.R. The Brundtland Report: ‘Our Common Future’. Med. War 1988, 4, 17–25. [Google Scholar] [CrossRef]
  2. Transforming Our World: The 2030 Agenda for Sustainable Development|Department of Economic and Social Affairs. Available online: https://sdgs.un.org/2030agenda (accessed on 30 June 2021).
  3. United Nations Millennium Declaration. Available online: https://www.ohchr.org/en/instruments-mechanisms/instruments/united-nations-millennium-declaration (accessed on 15 July 2024).
  4. Brzyska, J.; Szamrej-Baran, I. The COVID-19 Pandemic and the Implementation of Sustainable Development Goals: The EU Perspective. Sustainability 2023, 15, 13503. [Google Scholar] [CrossRef]
  5. European Union. Sustainable Development in the European Union—Monitoring Report on Progress towards the SDGs in an EU Context, 2023rd ed.; European Union: Brussels, Belgium, 2023; ISBN 978-92-68-00374-9. [Google Scholar]
  6. Acharya, S.; Lin, V.; Dhingra, N. The Role of Health in Achieving the Sustainable Development Goals. Bull. World Health Organ. 2018, 96, 591. [Google Scholar] [CrossRef] [PubMed]
  7. Egbende, L.; Helldén, D.; Mbunga, B.; Schedwin, M.; Kazenza, B.; Viberg, N.; Wanyenze, R.; Ali, M.M.; Alfvén, T. Interactions between Health and the Sustainable Development Goals: The Case of the Democratic Republic of Congo. Sustainability 2023, 15, 1259. [Google Scholar] [CrossRef]
  8. Venkatesh, G. A Brief Analysis of SDG 3—Good Health and Well-Being—And Its Synergies and Trade-Offs with the Other Sustainable Development Goals. Probl. Ekorozwoju 2022, 17, 140–147. [Google Scholar] [CrossRef]
  9. Howden-Chapman, P.; Siri, J.; Chisholm, E.; Chapman, R.; Doll, C.N.; Capon, A. SDG 3: Ensure Healthy Lives and Promote Wellbeing for All at All Ages. In A Guide to SDG Interactions: From Science to Implementation; International Council for Science: Paris, France, 2017; pp. 81–126. [Google Scholar]
  10. De Neve, J.-E.; Sachs, J.D. Sustainable Development and Human Well-Being. In World Happiness Report; Sustainable Development Solutions Network: New York, NY, USA, 2020; pp. 112–127. [Google Scholar]
  11. Pakkan, S.; Sudhakar, C.; Tripathi, S.; Rao, M. A Correlation Study of Sustainable Development Goal (SDG) Interactions. Qual. Quant. 2023, 57, 1937–1956. [Google Scholar] [CrossRef]
  12. Nunes, A.R.; Lee, K.; O’Riordan, T. The Importance of an Integrating Framework for Achieving the Sustainable Development Goals: The Example of Health and Well-Being. BMJ Glob. Health 2016, 1, e000068. [Google Scholar] [CrossRef]
  13. Meurs, M.; Seidelmann, L.; Koutsoumpa, M. How Healthy Is a ‘Healthy Economy’? Incompatibility between Current Pathways towards SDG3 and SDG8. Glob. Health 2019, 15, 83. [Google Scholar] [CrossRef]
  14. Głąbicka, K. Ochrona Zdrowia w Unii Europejskiej. Stud. Med. 2012, 26, 93–106. [Google Scholar]
  15. World Health Organization Constitution of the World Health Organization. Available online: https://apps.who.int/gb/bd/PDF/bd47/EN/constitution-en.pdf?ua=1 (accessed on 3 July 2024).
  16. World Health Organization. Good Health Adds Life to Years: Global Brief for World Health Day 2012; World Health Organization: Geneva, Switzerland, 2012. [Google Scholar]
  17. Blas, E.; Kurup, A.S. Equity, Social Determinants and Public Health Programmes; World Health Organization: Geneva, Switzerland, 2010. [Google Scholar]
  18. Strange, T.; Bayley, A. OECD Insights Sustainable Development Linking Economy, Society, Environment: Linking Economy, Society, Environment; OECD Publishing: Paris, France, 2008; ISBN 978-92-64-05574-2. [Google Scholar]
  19. Tsoukalis, L. What Kind of Europe? Oxford University Press: Oxford, NY, USA, 2003; ISBN 978-0-19-926666-1. [Google Scholar]
  20. Oppenheim, B.; Gallivan, M.; Madhav, N.K.; Brown, N.; Serhiyenko, V.; Wolfe, N.D.; Ayscue, P. Assessing Global Preparedness for the next Pandemic: Development and Application of an Epidemic Preparedness Index. BMJ Glob. Health 2019, 4, e001157. [Google Scholar] [CrossRef]
  21. GHS Index 2019. Available online: https://ghsindex.org/archive/ (accessed on 15 July 2024).
  22. Renda, A.; Castro, R. Towards Stronger EU Governance of Health Threats after the COVID-19 Pandemic. Eur. J. Risk Regul. 2020, 11, 273–282. [Google Scholar] [CrossRef]
  23. Hörisch, J. The Relation of COVID-19 to the UN Sustainable Development Goals: Implications for Sustainability Accounting, Management and Policy Research. Sustain. Account. Manag. Policy J. 2021, 12, 877–888. [Google Scholar] [CrossRef]
  24. Amankwah-Amoah, J. Stepping up and Stepping out of COVID-19: New Challenges for Environmental Sustainability Policies in the Global Airline Industry. J. Clean. Prod. 2020, 271, 123000. [Google Scholar] [CrossRef] [PubMed]
  25. Galvani, A.; Lew, A.A.; Perez, M.S. COVID-19 Is Expanding Global Consciousness and the Sustainability of Travel and Tourism. In Global Tourism and COVID-19; Routledge: London, UK, 2021; pp. 567–576. ISBN 978-1-00-322325-2. [Google Scholar]
  26. Yeasmin, S.; Banik, R.; Hossain, S.; Hossain, M.N.; Mahumud, R.; Salma, N.; Hossain, M.M. Impact of COVID-19 Pandemic on the Mental Health of Children in Bangladesh: A Cross-Sectional Study. Child. Youth Serv. Rev. 2020, 117, 105277. [Google Scholar] [CrossRef] [PubMed]
  27. Ilyas, S.; Srivastava, R.R.; Kim, H. Disinfection Technology and Strategies for COVID-19 Hospital and Bio-Medical Waste Management. Sci. Total Environ. 2020, 749, 141652. [Google Scholar] [CrossRef]
  28. Gavurova, B.; Megyesiova, S. Sustainable Health and Wellbeing in the European Union. Front. Public Health 2022, 10, 851061. [Google Scholar] [CrossRef] [PubMed]
  29. Khetrapal, S.; Bhatia, R. Impact of COVID-19 Pandemic on Health System & Sustainable Development Goal 3. Indian J. Med. Res. 2020, 151, 395. [Google Scholar] [CrossRef]
  30. Zambrano-Monserrate, M.A.; Ruano, M.A.; Sanchez-Alcalde, L. Indirect Effects of COVID-19 on the Environment. Sci. Total Environ. 2020, 728, 138813. [Google Scholar] [CrossRef]
  31. Coccia, M. Factors Determining the Diffusion of COVID-19 and Suggested Strategy to Prevent Future Accelerated Viral Infectivity Similar to COVID. Sci. Total Environ. 2020, 729, 138474. [Google Scholar] [CrossRef]
  32. Mestdagh, B.; Sempiga, O.; Van Liedekerke, L. The Impact of External Shocks on the Sustainable Development Goals (SDGs): Linking the COVID-19 Pandemic to SDG Implementation at the Local Government Level. Sustainability 2023, 15, 6234. [Google Scholar] [CrossRef]
  33. Leal Filho, W.; Brandli, L.L.; Lange Salvia, A.; Rayman-Bacchus, L.; Platje, J. COVID-19 and the UN Sustainable Development Goals: Threat to Solidarity or an Opportunity? Sustainability 2020, 12, 5343. [Google Scholar] [CrossRef]
  34. The Sustainable Development Goals Report 2023: Special Edition|DESA Publications. Available online: https://desapublications.un.org/publications/sustainable-development-goals-report-2023-special-edition (accessed on 15 July 2024).
  35. Sachs, J.; Schmidt-Traub, G.; Kroll, C.; Lafortune, G.; Fuller, G.; Woelm, F. Sustainable Development Report 2020: The Sustainable Development Goals and COVID-19 Includes the SDG Index and Dashboards; Cambridge University Press: Cambridge, UK, 2021; ISBN 978-1-108-83420-9. [Google Scholar]
  36. van Kersen, W.; de Rooij, M.M.; Portengen, L.; Diez, N.S.; Pieterson, I.; Tewis, M.; Boer, J.M.; Koppelman, G.; Vonk, J.M.; Vermeulen, R. Impact of COVID-19 Containment Measures on Perceived Health and Health-Protective Behavior: A Longitudinal Study. Sci. Rep. 2024, 14, 419. [Google Scholar] [CrossRef]
  37. Santini, Z.I.; Koyanagi, A. Loneliness and Its Association with Depressed Mood, Anxiety Symptoms, and Sleep Problems in Europe during the COVID-19 Pandemic. Acta Neuropsychiatr. 2021, 33, 160–163. [Google Scholar] [CrossRef] [PubMed]
  38. McCracken, L.M.; Badinlou, F.; Buhrman, M.; Brocki, K.C. Psychological Impact of COVID-19 in the Swedish Population: Depression, Anxiety, and Insomnia and Their Associations to Risk and Vulnerability Factors. Eur. Psychiatry 2020, 63, e81. [Google Scholar] [CrossRef] [PubMed]
  39. Armbruster, S.; Klotzbücher, V. Lost in Lockdown? COVID-19, Social Distancing, and Mental Health in Germany; Diskussionsbeiträge, 2020; Available online: https://www.econstor.eu/handle/10419/218885 (accessed on 16 July 2024).
  40. Rossi, R.; Socci, V.; Talevi, D.; Mensi, S.; Niolu, C.; Pacitti, F.; Di Marco, A.; Rossi, A.; Siracusano, A.; Di Lorenzo, G. COVID-19 Pandemic and Lockdown Measures Impact on Mental Health Among the General Population in Italy. Front. Psychiatry 2020, 11, 790. [Google Scholar] [CrossRef]
  41. Adams-Prassl, A.; Boneva, T.; Golin, M.; Rauh, C. The Impact of the Coronavirus Lockdown on Mental Health: Evidence from the United States. Econ. Policy 2022, 37, 139–155. [Google Scholar] [CrossRef]
  42. Fisher, C.B.; Tao, X.; Liu, T.; Giorgi, S.; Curtis, B. COVID-Related Victimization, Racial Bias and Employment and Housing Disruption Increase Mental Health Risk Among U.S. Asian, Black and Latinx Adults. Front. Public Health 2021, 9, 772236. [Google Scholar] [CrossRef]
  43. Gama, A.; Rocha, J.V.; Marques, M.J.; Azeredo-Lopes, S.; Pedro, A.R.; Dias, S. How Did the COVID-19 Pandemic Affect Migrant Populations in Lisbon, Portugal? A Study on Perceived Effects on Health and Economic Condition. Int. J. Environ. Res. Public Health 2022, 19, 1786. [Google Scholar] [CrossRef] [PubMed]
  44. Gama, A.; Alves, J.; Costa, D.; Laires, P.A.; Soares, P.; Pedro, A.R.; Moniz, M.; Solinho, L.; Nunes, C.; Dias, S. Double Jeopardy from the COVID-19 Pandemic: Risk of Exposure and Income Loss in Portugal. Int. J. Equity Health 2021, 20, 231. [Google Scholar] [CrossRef]
  45. Marmet, S.; Wicki, M.; Gmel, G.; Gachoud, C.; Daeppen, J.-B.; Bertholet, N.; Studer, J. The Psychological Impact of the COVID-19 Crisis Is Higher among Young Swiss Men with a Lower Socioeconomic Status: Evidence from a Cohort Study. PLoS ONE 2021, 16, e0255050. [Google Scholar] [CrossRef]
  46. Rathnayake, D.; Clarke, M.; Jayasinghe, V.I. Health System Performance and Health System Preparedness for the Post-Pandemic Impact of COVID-19: A Review. Int. J. Healthc. Manag. 2021, 14, 250–254. [Google Scholar] [CrossRef]
  47. Lin, Q.; Paykin, S.; Halpern, D.; Martinez-Cardoso, A.; Kolak, M. Assessment of Structural Barriers and Racial Group Disparities of COVID-19 Mortality with Spatial Analysis. JAMA Netw. Open 2022, 5, e220984. [Google Scholar] [CrossRef] [PubMed]
  48. Vandentorren, S.; Smaïli, S.; Chatignoux, E.; Maurel, M.; Alleaume, C.; Neufcourt, L.; Kelly-Irving, M.; Delpierre, C. The Effect of Social Deprivation on the Dynamic of SARS-CoV-2 Infection in France: A Population-Based Analysis. Lancet Public Health 2022, 7, e240–e249. [Google Scholar] [CrossRef]
  49. Pinto, A.d.S.; Rodrigues, C.A.; Nascimento, C.L.; Cruz, L.A.D.; Santos, E.G.D.; Nunes, P.C.; Costa, M.G.R.; Rocha, M.O.D.C. COVID-19 Epidemic Curve in Brazil: A Sum of Multiple Epidemics, Whose Inequality and Population Density in the States Are Correlated with Growth Rate and Daily Acceleration. An Ecological Study. Rev. Da Soc. Bras. De Med. Trop. 2022, 55, e0118. [Google Scholar] [CrossRef] [PubMed]
  50. Malmusi, D.; Pasarín, M.I.; Marí-Dell’Olmo, M.; Artazcoz, L.; Diez, E.; Tolosa, S.; Rodríguez-Sanz, M.; Pérez, G.; Peña-Gallardo, C.; Borrell, C. Multi-Level Policy Responses to Tackle Socioeconomic Inequalities in the Incidence of COVID-19 in a European Urban Area. Int. J. Equity Health 2022, 21, 28. [Google Scholar] [CrossRef] [PubMed]
  51. Grzebyk, M.; Stec, M.; Hejdukova, P. Implementation of Sustainable Development Goal 8 in European Union Countries–A Measurement Concept and a Multivariate Comparative Analysis. Sustain. Dev. 2023, 31, 2758–2769. [Google Scholar] [CrossRef]
  52. Kiselakova, D.; Stec, M.; Grzebyk, M.; Sofrankova, B. A Multidimensional Evaluation of the Sustainable Development of European Union Countries—An Empirical Study. J. Compet. 2020, 12, 56–73. [Google Scholar] [CrossRef]
  53. Fura, B.; Wang, Q. The Level of Socioeconomic Development of EU Countries and the State of ISO 14001 Certification. Qual. Quant. 2017, 51, 103–119. [Google Scholar] [CrossRef]
  54. Momete, D.C. Rational Development as a Sustainable Progress Welfare Vector: A Cross-Country Analysis. Sustain. Dev. 2017, 25, 189–199. [Google Scholar] [CrossRef]
  55. Information on Data—Eurostat. Available online: https://ec.europa.eu/eurostat/web/sdi/information-data (accessed on 27 August 2024).
  56. Eurostat Database. Selected Dataset. Sustainable Development Indicators. Available online: https://ec.europa.eu/eurostat/web/sdi/database (accessed on 10 June 2024).
  57. Bonner, W.I.A.; Weiler, R.; Orisatoki, R.; Lu, X.; Andkhoie, M.; Ramsay, D.; Yaghoubi, M.; Steeves, M.; Szafron, M.; Farag, M. Determinants of Self-Perceived Health for Canadians Aged 40 and Older and Policy Implications. Int. J. Equity Health 2017, 16, 94. [Google Scholar] [CrossRef] [PubMed]
  58. Glossary: Self-Perceived Health. Available online: https://ec.europa.eu/eurostat/statistics-explained/index.php?title=Glossary:Self-perceived_health (accessed on 27 August 2024).
  59. Grabiński, T. Wybrane problemy dynamicznej wielowymiarowej analizy porównawczej. Ruch Praw. Ekon. I Socjol. 1985, 47, 189–206. [Google Scholar]
  60. Bożek, J.; Szewczyk, J.; Badach, E.; Lisek, S. Ocena Poziomu Rozwoju Gospodarczego Województw z Zastosowaniem Metod Porządkowania Liniowego w Ujęciu Dynamicznym. Wiadomości Statystyczne. Pol. Stat. 2022, 67, 39–61. [Google Scholar]
  61. Sompolska-Rzechuła, A.; Kurdyś-Kujawska, A. Generation of Young Adults Living with Their Parents in European Union Countries. Sustainability 2022, 14, 4272. [Google Scholar] [CrossRef]
  62. Sompolska-Rzechuła, A. Selection of the Optimal Way of Linear Ordering of Objects: Case of Sustainable Development in EU Countries. Stat. Stat. Econ. J. 2021, 101, 24–36. [Google Scholar]
  63. Kukuła, K. Metoda Unitaryzacji Zerowanej Na Tle Wybranych Metod Normowania Cech Diagnostycznych (Zero Unitari-Sation Method against Selected Methods of Normalizing Diagnostic Features). Acta Sci. Acad. Ostroviensis 1999, 4, 5–31. [Google Scholar]
  64. Kukuła, K. Metoda Unitaryzacji Zerowanej; PWN: Warszawa, Poland, 2000; ISBN 83-01-13097-0. [Google Scholar]
  65. Kukuła, K. Analiza Własności Metody Unitaryzacji Zerowanej. Zesz. Nauk. SGGW-Ekon. I Organ. Gospod. Żywnościowej 2000, 42, 5–17. [Google Scholar] [CrossRef]
  66. Environmental Noise in Europe. 2020. Available online: https://www.eea.europa.eu/publications/environmental-noise-in-europe (accessed on 20 August 2024).
  67. Garmarudi, A.B.; Ghasemi, K.; Mozaffari, F.; Khorani, M.; Khanmohammadi, M. Most Common Techniques of Outlier Detection. Curr. Appl. Chemom. 2015, 12, 253–274. [Google Scholar]
  68. Cousineau, D.; Chartier, S. Outliers Detection and Treatment: A Review. Int. J. Psychol. Res. 2010, 3, 58–67. [Google Scholar] [CrossRef]
  69. Trzęsiok, M. Wybrane metody identyfikacji obserwacji oddalonych. Pr. Nauk. Uniw. Ekon. We Wrocławiu 2014, 327, 157–166. [Google Scholar]
  70. Sompolska-Rzechuła, A.; Kurdyś-Kujawska, A. Assessment of the Development of Poverty in EU Countries. Int. J. Environ. Res. Public Health 2022, 19, 3950. [Google Scholar] [CrossRef]
  71. Tukey, J.W. Exploratory Data Analysis; Reading, Mass.; Addison-Wesley Pub. Co.: Reading, MA, USA, 1977; ISBN 978-0-201-07616-5. [Google Scholar]
  72. Łuczak, A.; Kalinowski, S. Assessing the Level of the Material Deprivation of European Union Countries. PLoS ONE 2020, 15, e0238376. [Google Scholar] [CrossRef] [PubMed]
  73. Kendall, M.G. A New Measure of Rank Correlation. Biometrika 1938, 30, 81–93. [Google Scholar] [CrossRef]
  74. OECD. Netherlands: Country Health Profile 2023; Organisation for Economic Co-operation and Development: Paris, France, 2023. [Google Scholar] [CrossRef]
  75. OECD. Sweden: Country Health Profile 2023; Organisation for Economic Co-operation and Development: Paris, France, 2023. [Google Scholar] [CrossRef]
  76. Lupu, D.; Tiganasu, R. COVID-19 and the Efficiency of Health Systems in Europe. Health Econ. Rev. 2022, 12, 14. [Google Scholar] [CrossRef] [PubMed]
  77. OECD. Slovakia: Country Health Profile 2023; Organisation for Economic Co-operation and Development: Paris, France, 2023. [Google Scholar] [CrossRef]
  78. Willi, S.; Lüthold, R.; Hunt, A.; Hänggi, N.V.; Sejdiu, D.; Scaff, C.; Bender, N.; Staub, K.; Schlagenhauf, P. COVID-19 Sequelae in Adults Aged Less than 50 Years: A Systematic Review. Travel Med. Infect. Dis. 2021, 40, 101995. [Google Scholar] [CrossRef] [PubMed]
  79. Duncan, G.E.; Avery, A.R.; Seto, E.; Tsang, S. Perceived Change in Physical Activity Levels and Mental Health during COVID-19: Findings among Adult Twin Pairs. PLoS ONE 2020, 15, e0237695. [Google Scholar] [CrossRef]
  80. Findlay, L.C.; Arim, R.; Kohen, D. Understanding the Perceived Mental Health of Canadians during the COVTD-19 Pandemic. Health Rep. 2020, 31, 22–27. [Google Scholar] [PubMed]
  81. Ramage-Morin, P.L.; Polsky, J.Y. Health-Related Concerns and Precautions during the COVID-19 Pandemic: A Comparison of Canadians with and without Underlying Health Conditions. Health Rep. 2020, 31, 3–8. [Google Scholar] [PubMed]
  82. Yan, A.F.; Sun, X.; Zheng, J.; Mi, B.; Zuo, H.; Ruan, G.; Hussain, A.; Wang, Y.; Shi, Z. Perceived Risk, Behavior Changes and Health-Related Outcomes during COVID-19 Pandemic: Findings among Adults with and without Diabetes in China. Diabetes Res. Clin. Pract. 2020, 167, 108350. [Google Scholar] [CrossRef]
  83. Sarkar, D.; Jung, M.K.; Wang, H.J. Alcohol and the Immune System. Alcohol Res. Curr. Rev. 2015, 37, 153. [Google Scholar]
  84. De Bruin, W.B.; Bennett, D. Relationships between Initial COVID-19 Risk Perceptions and Protective Health Behaviors: A National Survey. Am. J. Prev. Med. 2020, 59, 157–167. [Google Scholar] [CrossRef]
  85. Xiong, J.; Lipsitz, O.; Nasri, F.; Lui, L.M.; Gill, H.; Phan, L.; Chen-Li, D.; Iacobucci, M.; Ho, R.; Majeed, A. Impact of COVID-19 Pandemic on Mental Health in the General Population: A Systematic Review. J. Affect. Disord. 2020, 277, 55–64. [Google Scholar] [CrossRef]
  86. Gao, J.; Zheng, P.; Jia, Y.; Chen, H.; Mao, Y.; Chen, S.; Wang, Y.; Fu, H.; Dai, J. Mental Health Problems and Social Media Exposure during COVID-19 Outbreak. PLoS ONE 2020, 15, e0231924. [Google Scholar]
  87. Moghanibashi-Mansourieh, A. Assessing the Anxiety Level of Iranian General Population during COVID-19 Outbreak. Asian J. Psychiatry 2020, 51, 102076. [Google Scholar] [CrossRef] [PubMed]
  88. Davillas, A.; Jones, A.M. Unmet Health Care Need and Income-Related Horizontal Equity in Use of Health Care during the COVID-19 Pandemic. Health Econ. 2021, 30, 1711–1716. [Google Scholar] [CrossRef] [PubMed]
  89. Janjani, H.; Aghaei, M.; Yunesian, M. Risk Factors Affecting the Mortality of COVID-19 Patients: Impacts of Modifiable Factors. Iran. J. Health Environ. 2021, 14, 363–378. [Google Scholar]
  90. Vera-Delgado, V.; García-Rosado, D.; Pérez-Hernández, O.; Martín-Ponce, E.; de La Paz-Estrello, A.M.; García-Marichal, C.; Pérez-Fernández, S.; Rodríguez-Morón, V.; Alemán-Valls, R.; González-Reimers, E. Mortality and COVID Infection: Predictors of Mortality 10 Months after Discharge. Diseases 2024, 12, 123. [Google Scholar] [CrossRef] [PubMed]
  91. Lu, L.; Zhong, W.; Bian, Z.; Li, Z.; Zhang, K.; Liang, B.; Zhong, Y.; Hu, M.; Lin, L.; Liu, J. A Comparison of Mortality-Related Risk Factors of COVID-19, SARS, and MERS: A Systematic Review and Meta-Analysis. J. Infect. 2020, 81, e18–e25. [Google Scholar] [CrossRef] [PubMed]
  92. Wang, X.; Fang, X.; Cai, Z.; Wu, X.; Gao, X.; Min, J.; Wang, F. Comorbid Chronic Diseases and Acute Organ Injuries Are Strongly Correlated with Disease Severity and Mortality among COVID-19 Patients: A Systemic Review and Meta-Analysis. Research 2020, 2020, 2402961. [Google Scholar] [CrossRef]
  93. Santurtún, A.; Shaman, J. Work Accidents, Climate Change and COVID-19. Sci. Total Environ. 2023, 871, 162129. [Google Scholar] [CrossRef]
  94. Huber, D.; Frank, R.; Crevenna, R. The Impact of Lockdowns during the COVID-19 Pandemic on Work-Related Accidents in Austria in 2020. Wien. Klin. Wochenschr. 2022, 134, 391–398. [Google Scholar] [CrossRef]
  95. Clay, K.; Lewis, J.; Severnini, E. Pollution, Infectious Disease, and Mortality: Evidence from the 1918 Spanish Influenza Pandemic. J. Econ. Hist. 2018, 78, 1179–1209. [Google Scholar] [CrossRef]
  96. Cui, Y.; Zhang, Z.-F.; Froines, J.; Zhao, J.; Wang, H.; Yu, S.-Z.; Detels, R. Air Pollution and Case Fatality of SARS in the People’s Republic of China: An Ecologic Study. Environ. Health 2003, 2, 15. [Google Scholar] [CrossRef]
  97. Bourdrel, T.; Annesi-Maesano, I.; Alahmad, B.; Maesano, C.N.; Bind, M.-A. The Impact of Outdoor Air Pollution on COVID-19: A Review of Evidence from in Vitro, Animal, and Human Studies. Eur. Respir. Rev. 2021, 30, 200242. [Google Scholar] [CrossRef] [PubMed]
  98. Mehmood, K.; Iqbal, M.; Abrar, M.M. Can Exposure to PM2. 5 Particles Increase the Incidence of Coronavirus Disease 2019 (COVID-19)? Sci. Total Environ. 2020, 741, 140441. [Google Scholar] [CrossRef]
  99. Zoran, M.A.; Savastru, R.S.; Savastru, D.M.; Tautan, M.N. Assessing the Relationship between Surface Levels of PM2. 5 and PM10 Particulate Matter Impact on COVID-19 in Milan, Italy. Sci. Total Environ. 2020, 738, 139825. [Google Scholar] [CrossRef]
  100. Renard, J.-B.; Surcin, J.; Annesi-Maesano, I.; Delaunay, G.; Poincelet, E.; Dixsaut, G. Relation between PM2. 5 Pollution and COVID-19 Mortality in Western Europe for the 2020–2022 Period. Sci. Total Environ. 2022, 848, 157579. [Google Scholar] [CrossRef] [PubMed]
  101. Commission Communication—Solidarity in Health: Reducing Health Inequalities in the EU—European Commission. Available online: https://health.ec.europa.eu/social-determinants/overview/commission-communication-solidarity-health-reducing-health-inequalities-eu_en (accessed on 27 August 2024).
  102. OECD. Health at a Glance 2021: OECD Indicators; Organisation for Economic Co-operation and Development: Paris, France, 2021. [Google Scholar]
  103. Drawing Light from the Pandemic: A New Strategy for Health and Sustainable Development—A Review of the Evidence. Available online: https://www.who.int/europe/publications/i/item/9789289051798 (accessed on 8 September 2024).
  104. A Global Deal for Our Pandemic Age. Available online: https://www.bruegel.org/external-publication/global-deal-our-pandemic-age (accessed on 7 September 2024).
  105. OECD. Access to COVID-19 Vaccines: Global Approaches in a Global Crisis; OECD: Paris, France, 2021. [Google Scholar]
  106. Mathieu, E.; Ritchie, H.; Rodés-Guirao, L.; Appel, C.; Giattino, C.; Hasell, J.; Macdonald, B.; Dattani, S.; Beltekian, D.; Ortiz-Ospina, E.; et al. Coronavirus Pandemic (COVID-19); Our World in Data: Oxford, UK, 2020. [Google Scholar]
  107. Beyond Containment: Health Systems Responses to COVID-19 in the OECD. Available online: https://www.oecd.org/en/publications/2020/04/beyond-containment-health-systems-responses-to-covid-19-in-the-oecd_ed89ef4f.html (accessed on 7 September 2024).
  108. OECD. Strengthening the Frontline: How Primary Health Care Helps Health Systems Adapt during the COVID 19 Pandemic; OECD: Paris, France, 2021. [Google Scholar]
  109. OECD. Health at a Glance: Europe 2020: State of Health in the EU Cycle; Organisation for Economic Co-operation and Development: Paris, France, 2020. [Google Scholar]
  110. OECD. Flattening the COVID-19 Peak: Containment and Mitigation Policies; OECD: Paris, France, 2020. [Google Scholar]
  111. Bourguignon, M.; Joan, D.; Doignon, Y.; Eggerickx, T.; Fontaine, S.; Lusyne, P.; Plavsic, A.; Sanderson, J.-P. Surmortalité Liée à La COVID-19 En Belgique: Variations Spatiales et Socio-Démographiques; HAL: Bangalore, India, 2020. [Google Scholar]
  112. Mateo-Urdiales, A.; Fabiani, M.; Rosano, A.; Vescio, M.F.; Del Manso, M.; Bella, A.; Riccardo, F.; Pezzotti, P.; Regidor, E.; Andrianou, X. Socioeconomic Patterns and COVID-19 Outcomes before, during and after the Lockdown in Italy (2020). Health Place 2021, 71, 102642. [Google Scholar] [CrossRef] [PubMed]
  113. Decoster, A.; Minten, T.; Spinnewijn, J. The Income Gradient in Mortality during the COVID-19 Crisis: Evidence from Belgium. J. Econ. Inequal. 2021, 19, 551–570. [Google Scholar] [CrossRef] [PubMed]
  114. Berchet, C.; Bijlholt, J.; Ando, M. Socio-Economic and Ethnic Health Inequalities in COVID-19 Outcomes across OECD Countries; OECD: Paris, France, 2023. [Google Scholar]
  115. Drefahl, S.; Wallace, M.; Mussino, E.; Aradhya, S.; Kolk, M.; Brandén, M.; Malmberg, B.; Andersson, G. A Population-Based Cohort Study of Socio-Demographic Risk Factors for COVID-19 Deaths in Sweden. Nat. Commun. 2020, 11, 5097. [Google Scholar] [CrossRef]
  116. Une Hausse Des Décès Deux Fois plus Forte Pour Les Personnes Nées à l’étranger Que Pour Celles Nées En France En Mars-Avril 2020—Insee Focus—198. Available online: https://www.insee.fr/fr/statistiques/4627049 (accessed on 7 September 2024).
  117. Hansson, E.; Albin, M.; Rasmussen, M.; Jakobsson, K. Large Differences in Excess Mortality in March-May 2020 by Country of Birth in Sweden. Lakartidningen 2020, 117, 20113. [Google Scholar]
Figure 1. Diagram of the linear ranking method in a dynamic perspective. Source: Own elaboration.
Sustainability 16 07921 g001
Table 1. Indicators of Sustainable Development Goal 3—good health and well-being.
Indicator NameDefinition
Share of people with good or very good perceived health (x1)The indicator is a subjective measure of how people rate their overall health on a scale from “very good” to “very poor.” It is expressed as the percentage of the population aged 16 and over who consider their health to be “good” or “very good”.
Unit of measurement: % of the population aged 16 and over.
Self-reported unmet needs
for medical care (x2)
The indicator measures the proportion of the population aged 16 and over reporting unmet medical care needs for any of the following reasons: “financial reasons”, “waiting list”, and “too far to travel” (all three categories are combined). Unmet needs, as reported by the individual, refer to their assessment of whether they needed medical examinations or treatment (excluding dental care) but did not receive it or did not seek it.
Unit of measurement: % of the population aged 16 and over.
Standardized death rate due to tuberculosis, HIV,
and hepatitis (x3)
The indicator measures the standardized mortality rate due to tuberculosis, HIV, and hepatitis. The rate is calculated by dividing the number of individuals dying from the selected infectious diseases by the total population. The data are presented as standardized mortality rates, meaning they are adjusted to a standard age distribution to measure mortality rates independently of different age structures within populations. Unit of measurement: per 100,000 individuals.
Preventable and treatable mortality rate (x4)This indicator includes both preventable and treatable causes of mortality. Preventable mortality refers to deaths that can be avoided mainly through effective public health interventions and primary prevention (i.e., before the onset of disease/injury to reduce incidence). Treatable mortality can be avoided mainly through timely and effective healthcare interventions, including secondary prevention and treatment (after the onset of disease to reduce mortality). The data are presented as standardized mortality rates, adjusted to a standard age distribution to measure mortality rates independently of different population age structures.
Unit of measurement: number per 100,000 people under the age of 75.
Fatal accidents at work per 100,000 workers (x5)The indicator measures the number of fatal occupational accidents that occur during work and result in the death of the victim within one year of the accident.
Unit of measurement: number per 100,000 workers.
Premature deaths due to
exposure to fine particulate matter PM2.5 (x6)
This indicator estimates the number of premature deaths attributable to long-term exposure to PM2.5 concentrations above 5 µg/m3 (the level recommended by the World Health Organization). PM2.5 refers to particulate matter with a diameter of fewer than 2.5 μm, which can penetrate deep into the lungs, causing inflammation and exacerbating conditions such as heart and lung diseases.
Unit of measurement: number of deaths per 100,000 inhabitants.
Source: Own elaboration based on [56].
Table 2. Basic characteristics of diagnostic variables describing the level of achievement of SDG 3 in EU countries—winsorized data.
VariableYearMeanMedianMinMaxStandard DeviationCoefficient of VariationSkewness
x1201966.9367.9046.2084.309.5314.23−0.61
202067.9669.2044.3084.509.4113.84−0.77
202167.7368.5047.9081.708.5012.55−0.89
x220192.041.400.005.861.7887.110.93
20202.021.550.005.731.8591.650.95
20212.101.700.105.281.6678.840.61
x320191.921.260.425.601.6988.001.27
20201.851.200.435.271.5382.901.41
20211.711.080.385.221.6093.721.48
x42019284.46228.13170.21504.81111.9139.340.81
2020312.81238.96183.26593.20131.8342.140.86
2021353.95248.53177.48694.80177.6850.200.82
x520191.971.900.483.530.8844.510.12
20202.021.820.304.451.0049.590.41
20211.941.790.334.291.0152.020.59
x6201948.4541.003.0094.3029.3560.580.17
202047.6236.001.00105.0033.2169.750.45
202154.1841.503.00112.4036.7467.800.23
Source: Own calculations based on [56].
Table 3. Ranking of European Union (EU-26) countries and values of dynamic indicators describing the level of achievement of SDG 3 for the years 2019, 2020, and 2021.
EU CountryThe Value of the Synthetic VariableRanking PositionThe Value of the Synthetic VariableRanking PositionThe Value of the Synthetic VariableRanking Position
201920202021
The Netherlands0.88820.91310.8881
Sweden0.89410.90320.8792
Luxembourg0.80350.83740.8523
Ireland0.85130.84530.8494
Cyprus0.754100.673130.8055
Belgium0.77480.78880.7936
Denmark0.77290.80950.7917
Germany0.78670.79670.7798
Finland0.742110.737100.7749
Malta0.84440.79860.75710
Spain0.79460.75590.75311
Austria0.702120.736110.72312
France0.685130.696120.65213
Czechia0.682140.666140.64914
Slovenia0.675150.648150.62215
Greece0.609170.619160.61316
Portugal0.553180.536190.57617
Croatia0.513190.507210.52718
Slovakia0.626160.584170.50519
Poland0.502210.541180.47820
Hungary0.509200.533200.46721
Bulgaria0.494220.435230.42422
Estonia0.431230.499220.41723
Lithuania0.341240.321240.24924
Romania0.285250.251260.24025
Latvia0.280260.292250.16626
Max0.894 0.913 0.888
Min0.280 0.251 0.166
Range0.614 0.661 0.722
Average0.646 0.643 0.624
Coefficient of variation27.53947 28.12259 32.5184
Source: Own calculations based on [56].
Table 4. Indicators of the level of development of European Union (EU-26) countries in the achievement of SDG 3 in 2020 and 2021.
EU Country S i   2019 ; 2020 D S i   2020 ; 2021 D S i   2019 ; 2021 D
The Netherlands0.025−0.0240.001
Sweden0.009−0.023−0.015
Luxembourg0.0340.0140.048
Ireland−0.0060.004−0.002
Cyprus−0.0810.1330.052
Belgium0.0140.0050.019
Denmark0.036−0.0180.018
Germany0.010−0.016−0.007
Finland−0.0050.0370.032
Malta−0.046−0.041−0.087
Spain−0.039−0.002−0.041
Austria0.033−0.0120.021
France0.011−0.044−0.033
Czechia−0.016−0.017−0.033
Slovenia−0.027−0.026−0.053
Greece0.010−0.0060.004
Portugal−0.0160.0400.024
Croatia−0.0060.0200.014
Slovakia−0.042−0.079−0.122
Poland0.039−0.063−0.025
Hungary0.024−0.066−0.042
Bulgaria−0.059−0.011−0.069
Estonia0.068−0.082−0.013
Lithuania−0.020−0.072−0.092
Romania−0.033−0.012−0.045
Latvia0.012−0.125−0.114
Source: Own calculations based on [56].
Table 5. Values of Kendall’s tau correlation coefficients based on the dynamic ranking of European Union (EU-26) countries for the years 2019, 2020, and 2021 (p < 0.05).
Year201920202021
20191.000.890.86
20200.891.000.86
20210.860.861.00
Source: Own calculations based on [56].
Disclaimer/Publisher’s Note: The statements, opinions and data contained in all publications are solely those of the individual author(s) and contributor(s) and not of MDPI and/or the editor(s). MDPI and/or the editor(s) disclaim responsibility for any injury to people or property resulting from any ideas, methods, instructions or products referred to in the content.

