Article

Study on the Evolution of SCO Agricultural Trade Network Pattern and Its Influencing Mechanism

by
Abudureyimu Abudukeremu
1,2,
Asiyemu Youliwasi
3,
Buwajian Abula
1,2,*,
Abulaiti Yiming
4 and
Dezhen Wang
5,*
1
College of Economics and Management, Xinjiang Agricultural University, Urumqi 830052, China
2
Center for Central Asian Studies, Xinjiang Agricultural University, Urumqi 830052, China
3
College of Economics and Management, Kashi University, Kashi 844006, China
4
College of Business, Xinjiang Normal University, Urumqi 830017, China
5
Business School, Yulin Normal University, Yulin 537000, China
*
Authors to whom correspondence should be addressed.
Sustainability 2024, 16(18), 7930; https://doi.org/10.3390/su16187930
Submission received: 9 August 2024 / Revised: 2 September 2024 / Accepted: 6 September 2024 / Published: 11 September 2024

Abstract

:
Investigating the evolution of the agricultural trade network pattern of Shanghai Cooperation Organisation (SCO) countries and its influencing mechanism is of vital importance for clarifying each country’s trade position, ensuring China’s food security, and stabilizing the supply of major agricultural products. This paper adopts complex network analysis and the time-indexed random graph model (TERGM) to systematically study the evolution trajectory of the Shanghai Cooperation Organisation (SCO) agricultural trade network and its influencing factors during the period from 2003 to 2022. The results show that the SCO agricultural trade network has undergone significant evolution and development over the past two decades, forming an increasingly close, interconnected, and diversified trade network structure. In particular, China has played a crucial role in the trade network, and the adjustment of its trade strategy and the shift of its role from export orientation to import orientation have had a profound impact on the overall trade network structure. Moreover, over time, the number of core countries in the trade network has gradually increased, and the network structure has gradually developed in a more diversified direction. Through empirical analysis, it is found that the formation of the SCO agricultural trade network is the result of a combination of factors, including intrinsic reciprocity, multiple connectivity, and stability mechanisms, as well as extrinsic geographic, cultural, and economic factors. Among them, China, as the leading country, has played a pivotal role in promoting the development of the trade network.

1. Introduction

In recent years, global hunger and food security challenges have become increasingly severe, especially since 2019, the outbreak of COVID-19, the Russia-Ukraine conflict, climate change, and other multiple factors combined, making the global agricultural food security system face an unprecedented crisis [1]. According to a report by the Food and Agriculture Organization of the United Nations (FAO), between 702 million and 828 million people are expected to face hunger globally by 2021, of whom about 150 million people will be affected by the outbreak of COVID-19. The United Nations 2030 Agenda for Sustainable Development emphasizes that agricultural trade plays a key role in alleviating hunger and achieving the goal of “zero hunger”, which can effectively transfer low-cost food to areas in need. Developing countries, as the main participants in this process, account for one third of the total global trade in food and agriculture [2]. In the context of major global changes, the ongoing impact of the novel coronavirus pandemic, the rise of trade protectionism, and the intensification of geopolitical differences have made the trade environment full of uncertainty and instability. In such an environment, the multilateral trading system represented by the WTO has become increasingly important, and regional integration has become an important bridge for trade between countries, as a powerful supplement to trade globalization [3,4].
Since its establishment in 2001, the Shanghai Cooperation Organisation (SCO) has expanded into a vast collective of 26 participants, including 9 full member states, 3 observer states, and 14 dialogue partners. The organization geographically spans a vast area of about 60% of Eurasia, covers about 40% of the world’s population, and its economy is also sizeable, with a combined GDP of about 20% of the global GDP (SCO official website, 2023). As an important area of cooperation within the organization, trade in agricultural products plays a pivotal role in economic and trade cooperation by virtue of highly complementary agricultural resources and huge trade potential among its member countries. For example, China, as the world’s largest importer of agricultural products, has strong trade links with SCO members such as India (the world’s sixth largest exporter of agricultural products) and Russia (the world’s seventh largest exporter of agricultural products). According to UN data, in 2021, SCO member states accounted for 8.7% and 13.9% of global agricultural exports and imports, respectively (UN Commodity Trade Statistics Database, 2021).
Deepening trade cooperation in agricultural products is not only an important way for SCO member states to achieve stable economic growth and respond to international challenges but also a solid foundation for building an “SCO community of the future” [5]. In the white paper, “Jointly Building the Belt and Road: Important Practice of Building a Community with a Shared Future for Mankind”, the Chinese government has clearly pointed out the important role of the Shanghai Cooperation Organisation in promoting agricultural science and technology cooperation among countries along the Belt and Road. However, the uncertainties faced by the world in recent years, such as the COVID-19 pandemic, food crisis, and geopolitical conflicts, have posed serious challenges to the agricultural supply chain and food security of SCO member states, especially China. For example, the source of China’s imported grain is highly concentrated, among which soybean imports are mainly concentrated in Brazil and the United States, which increases the risk of the supply chain to some extent [6].
As an important link between China and other SCO member states [7], trade in agricultural products not only promotes the supply and demand relationship among countries but also forms a trade network of agricultural products with specific structural characteristics. Therefore, studying the changes in the structure of trade in agricultural products of SCO countries between 2003 and 2022, the position of China and other member states in the network, and the dynamic mechanism of the formation of the network has important theoretical and practical significance for making full use of the SCO mechanism, strengthening cooperation among member states, improving the efficiency of agricultural resource allocation, and reducing supply chain risks.

2. Literature Review

2.1. Research on the Relationship between Trade Relations and Social Networks

In recent years, research on the combination of trade and social networks has attracted much attention in the field of economics [8,9,10,11]. Such research focuses on three core areas:
First, the analysis of trade network structure from the static perspective. Early studies revealed the non-standardization and small-world characteristics of the world trade network and pointed out the existence of core nodes in the network [12,13]. Further studies emphasized the integrity and global nature of the trade network [14,15] and discussed the key nodes in the trade network and their influence [16,17] by using methods such as centrality, cohesive subgroup, and core-edge structure. These studies have not only deepened the understanding of the structure of the trade network but also provide a new perspective for the combination of trade relations and social network analysis.
Secondly, industry and region-specific trade networks are studied. Scholars have studied the trade networks of specific industries [18,19,20], such as wheat [21], weapons [22,23,24], high-tech products [25,26] and waste [27] in East Asia, the European Union, the Belt and Road [18,19,20], and other regions. Other studies, combined with the analysis of global value chains, revealed the status and characteristics of different industries and regions in trade networks [28,29], providing strong support for regional trade cooperation.
Finally, the driving mechanism of dynamic evolution of trade networks is explored. Scholars not only pay attention to the static characteristics of trade networks but also analyze the formation and evolution of trade networks from a dynamic perspective. From the QAP model (Quadratic Assignment Procedure) [30,31] to the ERGM model (Exponential Random Graph Model) [32,33] and then to the TERGM model (Temporal Exponential Random Graph Model) [23,34], these research methods continue to evolve and have gradually revealed the influence of external factors, such as geographical distance and economic development level as well as interdependency within networks, on the formation and evolution of trade networks [35,36,37]. These studies not only broaden the dimensions of trade networks but also provide important references for understanding dynamic changes in trade networks.
To sum up, research on the combination of trade and social networks has achieved fruitful results in the field of economics, providing a powerful tool for in-depth understanding and analysis of global trade patterns.

2.2. Research Status of Agricultural Trade between China and SCO Countries

At present, studies on agricultural trade between China and SCO countries focus on multiple dimensions, including opportunities and challenges encountered, characteristics and competition of trade, as well as various factors affecting trade development and potential growth forces.
At the level of opportunities and challenges, deepening agricultural trade cooperation is regarded as a key means for SCO member states to achieve economic prosperity and respond to international challenges, and it is an important cornerstone for building an SCO community with a shared future. Although the trade of agricultural products between China and SCO countries shows significant complementary advantages, it also faces the problems of limited trade scale, structural imbalance, and low added value [5]. In particular, driven by the “Belt and Road” initiative, China and India, two major agricultural countries, have competitive agricultural trade cooperation, but their complementarity is more prominent, bringing unprecedented development opportunities for both sides [38]. Similarly, agricultural trade between China and Kazakhstan also benefits from the “Belt and Road” initiative. Despite the obstacles such as small scale, single structure, and trade barriers, the overall development momentum is good [39].
In terms of trade characteristics and the competition–cooperation relationship, research reveals the complementarity between China and SCO countries, dominated by inter-industry trade, with frequent trade between the two sides [40]. However, the duration of Chinese agricultural products’ export trade in SCO countries is relatively short, with a “threshold effect” and negative time dependence [41]. In addition, the agricultural trade relationship between China and Central Asian countries is dominated by intra-industry trade, which is highly complementary but weakly competitive [42,43,44].
In terms of influencing factors and development potential, the increase in the import demand of agricultural products from SCO member states is the main driving force for the growth of China’s agricultural exports, while the structural effect and competitiveness effect also play a positive role in promoting growth. However, in recent years, the adaptability of the agricultural export structure has decreased, resulting in weakening of the role of the structural effect [45]. In addition, strengthening agricultural investment and trade cooperation in the region can help to unlock agricultural potential and reduce China’s dependence on traditional markets [46]. Through the stochastic frontier gravity model, the study also found that although the agricultural trade efficiency between China and Central Asian countries is low, it is increasing year by year, and trade agreements, political environment, trade freedom, infrastructure, and other factors have important impacts on improving trade efficiency [47,48].
To sum up, although existing studies have deeply analyzed many aspects of agricultural trade between China and SCO countries, there are relatively few studies on the trade network and its formation mechanism, and few studies pay attention to China’s position in the network and its impact on the formation of the network. Based on data from 2003 to 2022, this paper uses complex network analysis and the TERGM model to explore the evolution of the SCO agricultural trade network and its influencing mechanism, aiming to provide new insight into agricultural trade relations between China and SCO countries from the perspective of trade networks.

3. Analysis of the Evolution Characteristics of the Agricultural Trade Network of SCO Countries

3.1. Research Scope

This paper aims to make an in-depth analysis of the characteristics of agricultural trade in SCO countries by using the export data of agricultural products in chapters 01 to 24 and 50 to 53 of the HS02 edition. In order to enhance the comprehensiveness and foresight of the study, SCO observer states and dialogue partners are included in the research framework to build a more complete and systematic analysis of the SCO agricultural trade network. However, given the significant lack of data in Afghanistan, this region will not be included in the scope of this study. Through the expansion of the research scope, it is expected that more general and practical research conclusions can be drawn, and valuable references can be provided for academic research and practical applications in related fields. The specific classification details are shown in Table 1.

3.2. Research Method

In this paper, a series of network analysis indicators, such as network density, average clustering coefficient, average path length, and reciprocity, are used to analyze the overall characteristics of the SCO agricultural trade network in multiple dimensions. Then, with the help of core-edge analysis framework and visualization tools, we further explore the structural characteristics of the trade network to clearly show the position and influence of countries in the network.

3.2.1. Network Density

Network density is a key index that measures the ratio of the actual number of connections in a trade network to the maximum number of possible connections in theory. Specifically, the size of the network density directly reflects the degree of tightness within SCO countries’ agricultural trade network. A high-density network means frequent and close trade links between member countries, which is conducive to resource sharing and trade facilitation. The study by Xu et al. [49] also confirmed this point, pointing out that the improvement of network density helps to enhance the stability and resilience of the trade network.
D = Q n n 1 ,
In Formula (1), D is the density of the trade network, Q represents the number of trade networks that actually exist, and n represents the number of nodes in the trade network.

3.2.2. Average Clustering Coefficient

The clustering coefficient (C) is an indicator to measure the degree of node clustering in a network, reflecting the trend of forming tight clusters among nodes in a network [50]. Specifically, the clustering coefficient is used to describe the ratio of the number of connections that actually exist between a node’s neighbors to the maximum number of connections that can exist between them. The average clustering coefficient is the average clustering coefficient of all nodes in the network, which is used to describe the clustering degree of the whole network. Its mathematical expression is as follows:
C = e i K i K i 1 ,
C ¯ = 1 n i = 1 n C ,
where C stands for the clustering coefficient; ki stands for the node degree; ei represents the number of edges between ki neighbor nodes of node I; and C ¯ represents the average clustering coefficient.

3.2.3. Average Path Length

The average path length (L) is the average of the shortest path length between any two nodes in the network, reflecting the average efficiency of information transfer or trade in the network. The lower the value, the fewer “steps” needed to conclude trade between two countries, and the higher the efficiency of trade transmission [51]. The average path length is calculated as follows:
L = 1 n n 1 i j d i j ,
where n is the number of nodes in the network (i.e., the number of countries), and dij represents the shortest path length between node i and node j, i.e., the minimum number of sides required to pass between them.

3.2.4. Reciprocity Coefficient

The reciprocity coefficient is an index used to measure the degree of bidirectional connection between nodes in the network, and it reflects the reciprocity and balance of trade relations in the overall network [52]. The reciprocity coefficient is calculated as follows:
θ = m d m ,
where m is the total number of sides in the network (i.e., the total number of trade relations) and d is the number of one-way sides (i.e., trade relations that exist in only one direction). Thus, md is the number of bidirectional edges present. The closer the value of the reciprocity coefficient θ is to 1, the more two-way and balanced the trade relationship in the network.

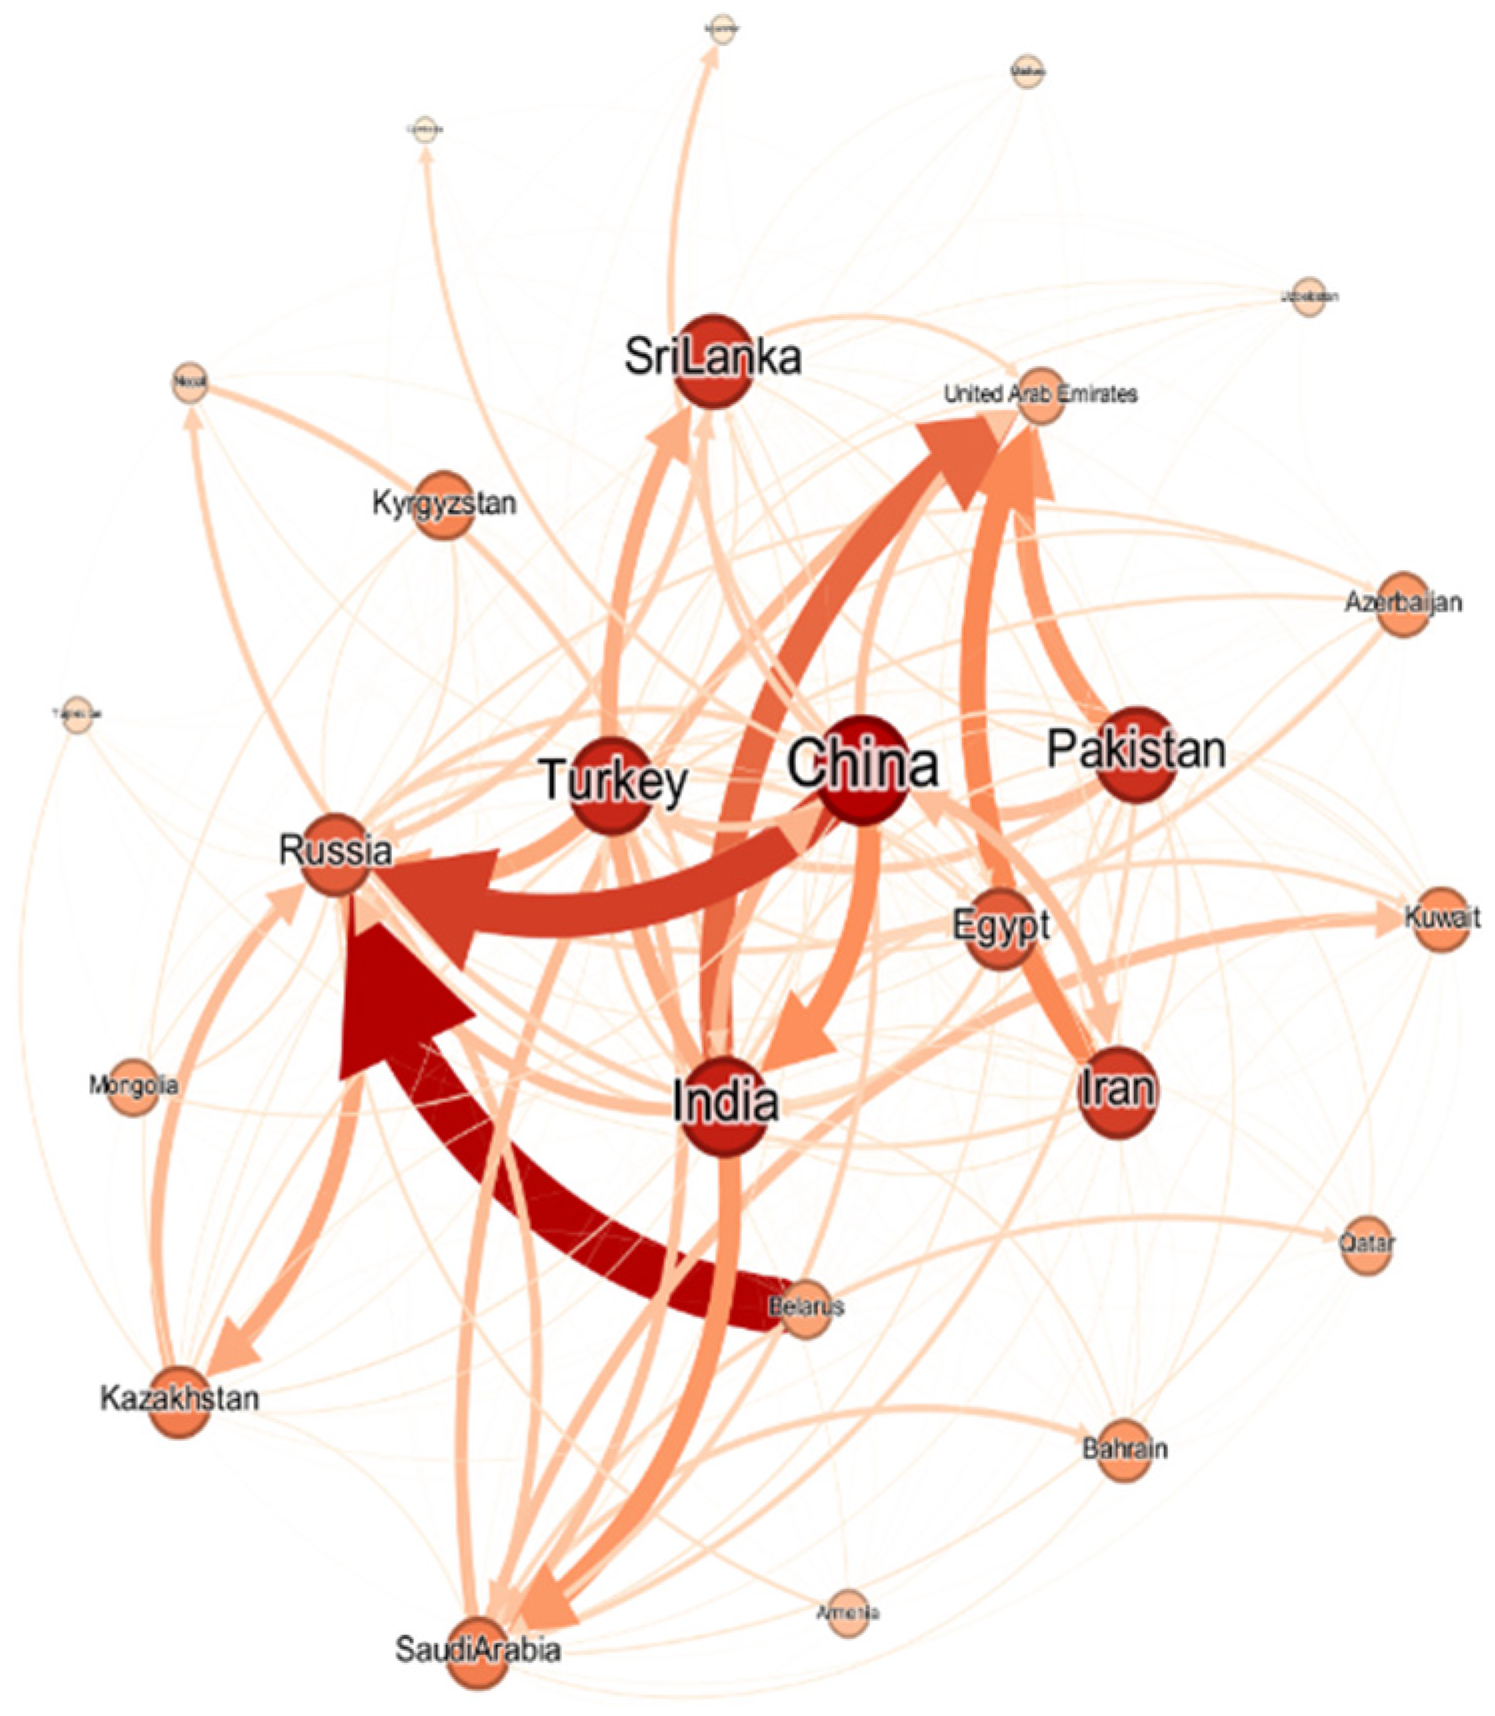
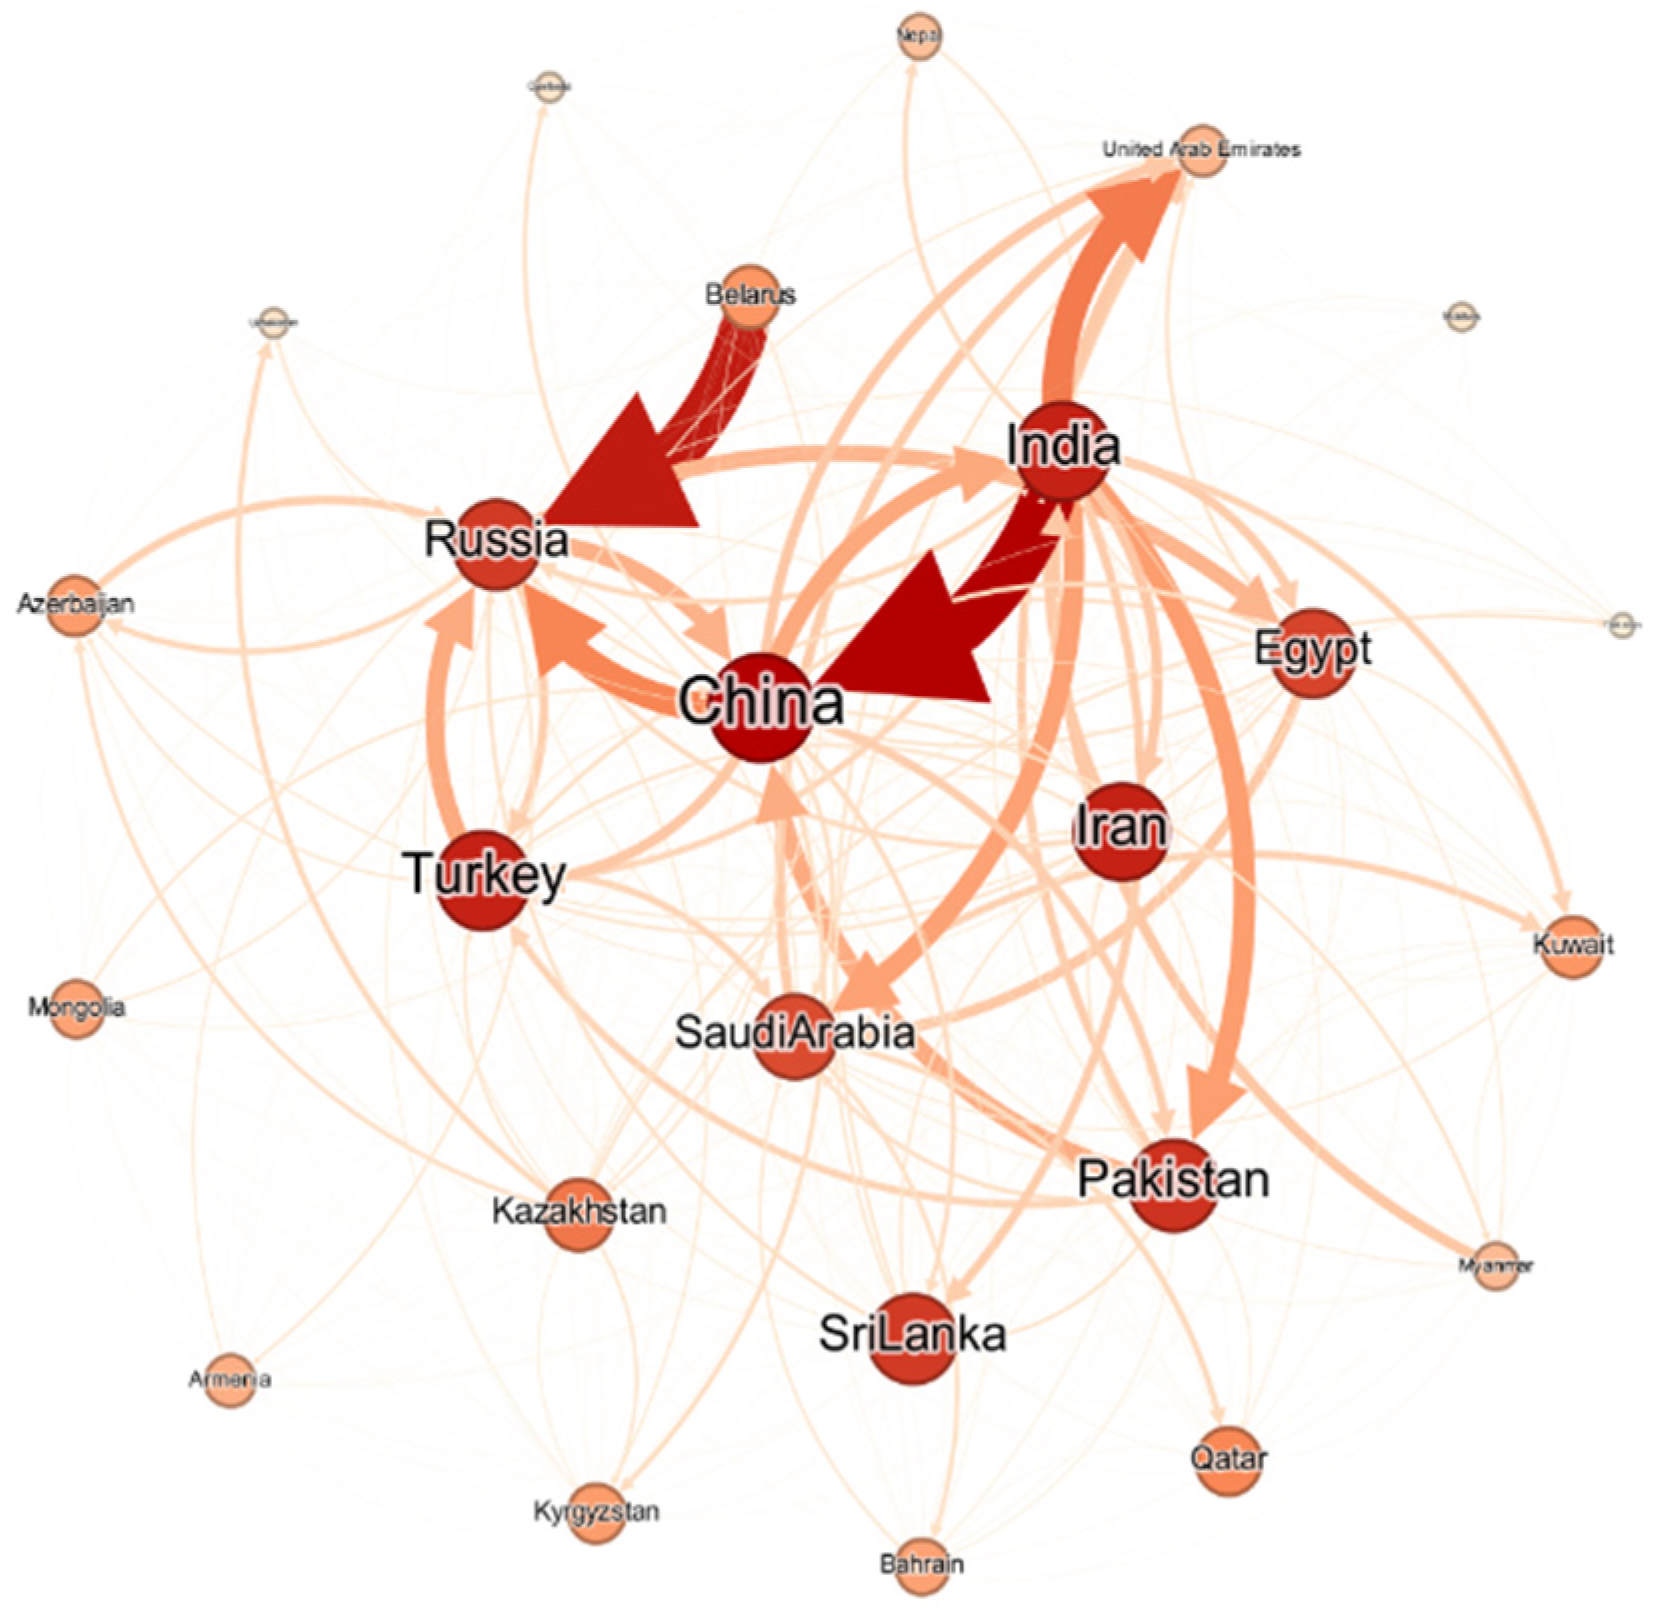
3.3. Evidence of the Evolution of the Overall Network of Agricultural Trade in SCO Countries

In this paper, the overall characteristics of the integrated agricultural trade network are analyzed, as shown in Table 2, using the key indicators such as network density, average clustering coefficient, average path length, and reciprocity. From 2003 to 2022, the growth of the network density of the integrated agricultural products was significantly increased from 0.315 to 0.545, increasing by 0.23 units, according to the research data. This significant increase shows that the number of trade partners in the SCO region continue to increase, and trade links are increasingly interconnected, creating a more tightly connected and interconnected trade network.
In this paper, the structure of the agricultural trade network of the agricultural products in the area is further observed, and the average path length of the average clustering coefficient is found to be the opposite trend. In particular, the average clustering coefficient increased from 0.487 in 2003 to 0.632 in 2022, while the average path length was shortened from 1.715 to 1.439. This trend suggests that although the agricultural trade network in the area of the integrated group has yet to meet the typical “small world” network characteristics standard, it is developing to this side. The shorter average path length and higher average clustering coefficient not only improve the transmission efficiency of agricultural trade but also strengthen the close connection and interdependence between networks.
In terms of reciprocity, the reciprocity coefficient has shown a steady growth trend, rising from 0.4 to 0.5797 m. This increase reflects the increase in trade contact with agricultural products, and that two-way trade between China and Chinese customers is increasing. This shows that the agricultural trade network of the SCO region is gradually being established in mutual trade and cooperation between countries, and that trade relations between countries are increasingly closely balanced.
In general, the average path length and higher average clustering coefficient characteristics are shown in a short average path length and higher average clustering coefficient, which helps to promote the high connectivity and aggregation of the agricultural trade network and thus promotes in-depth development of regional cooperation. This trend provides a broader space and a more solid foundation for cooperation between countries.

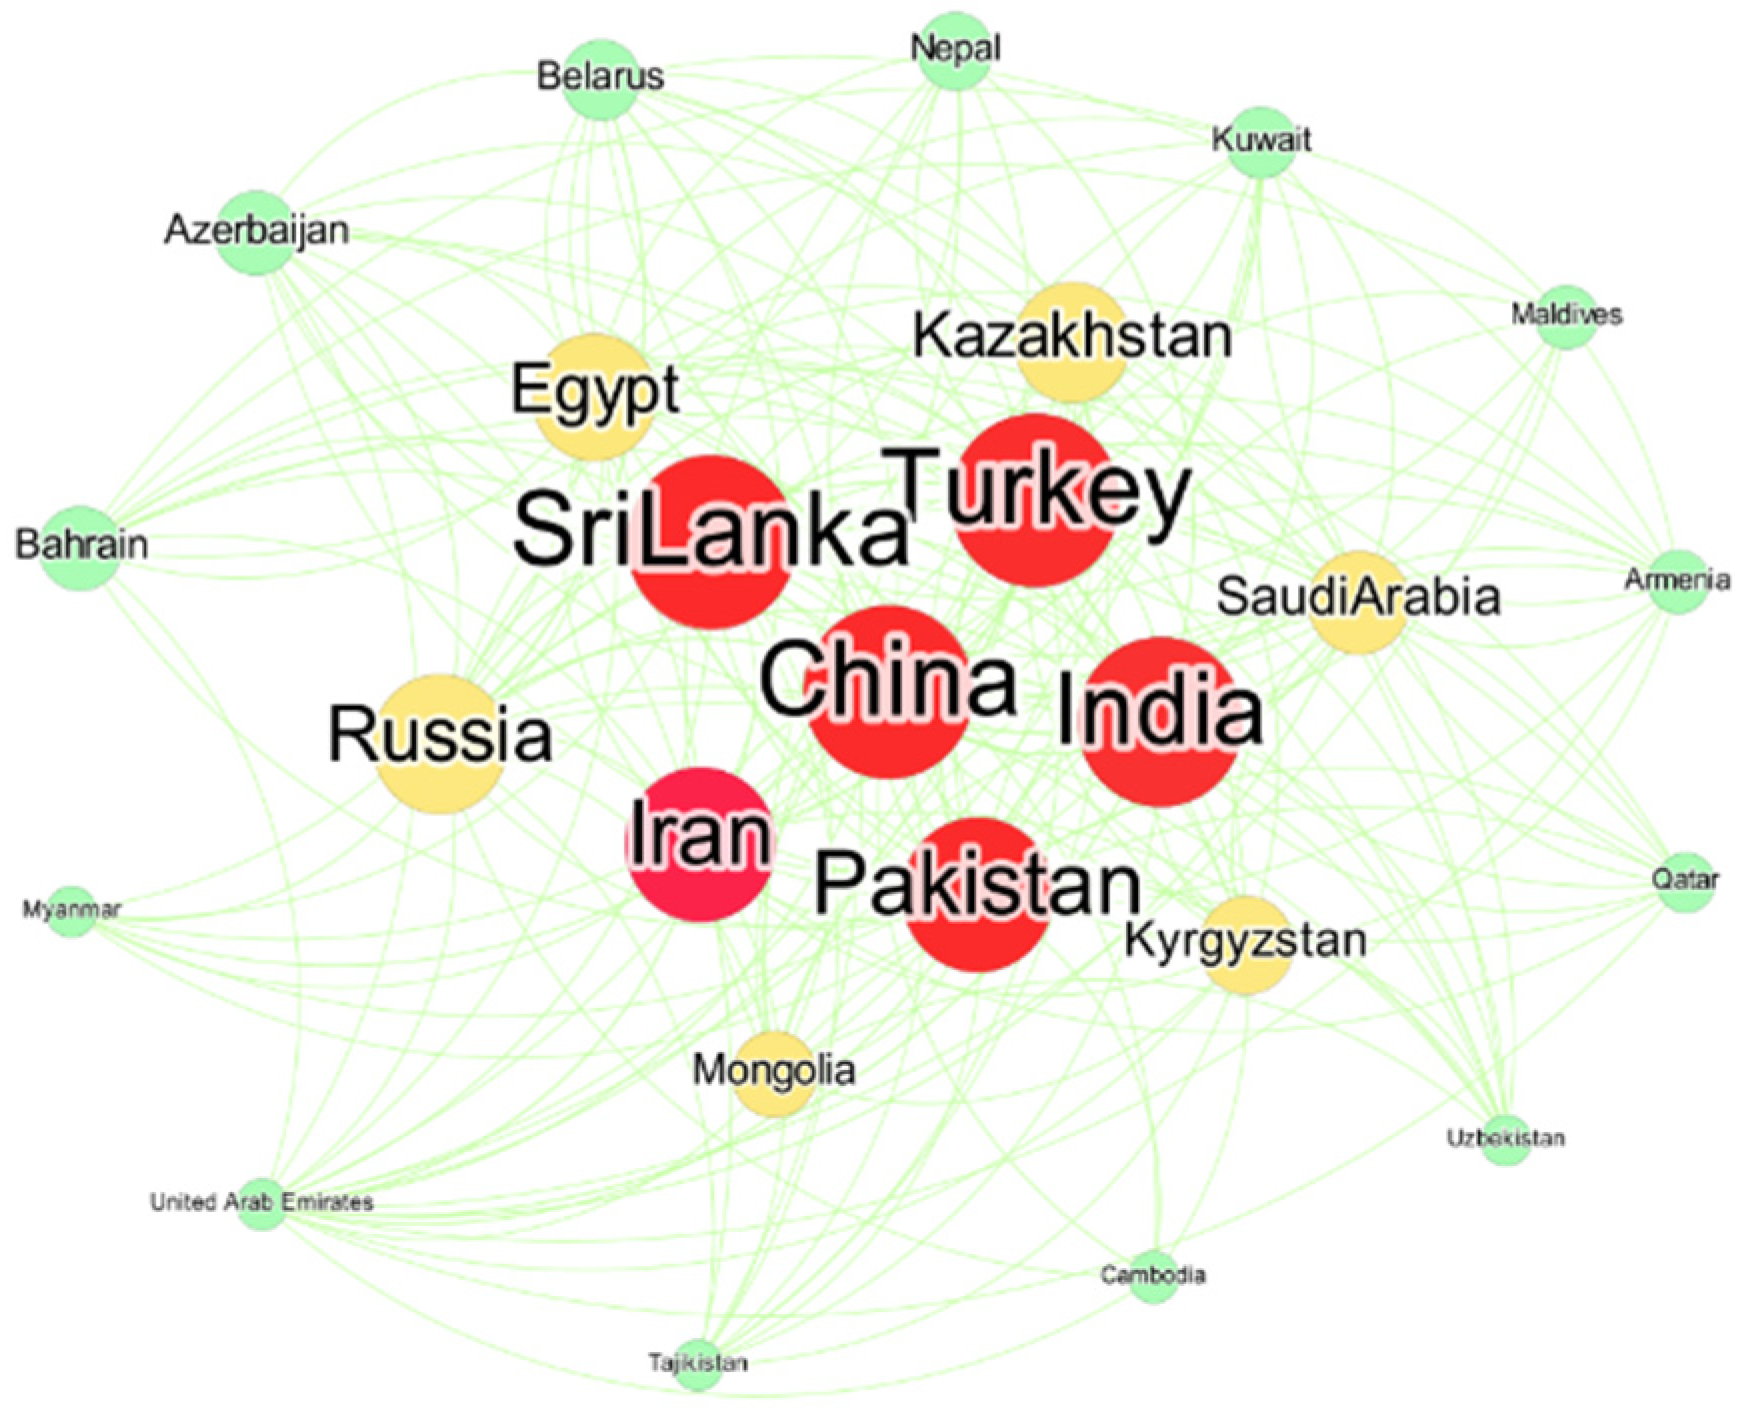
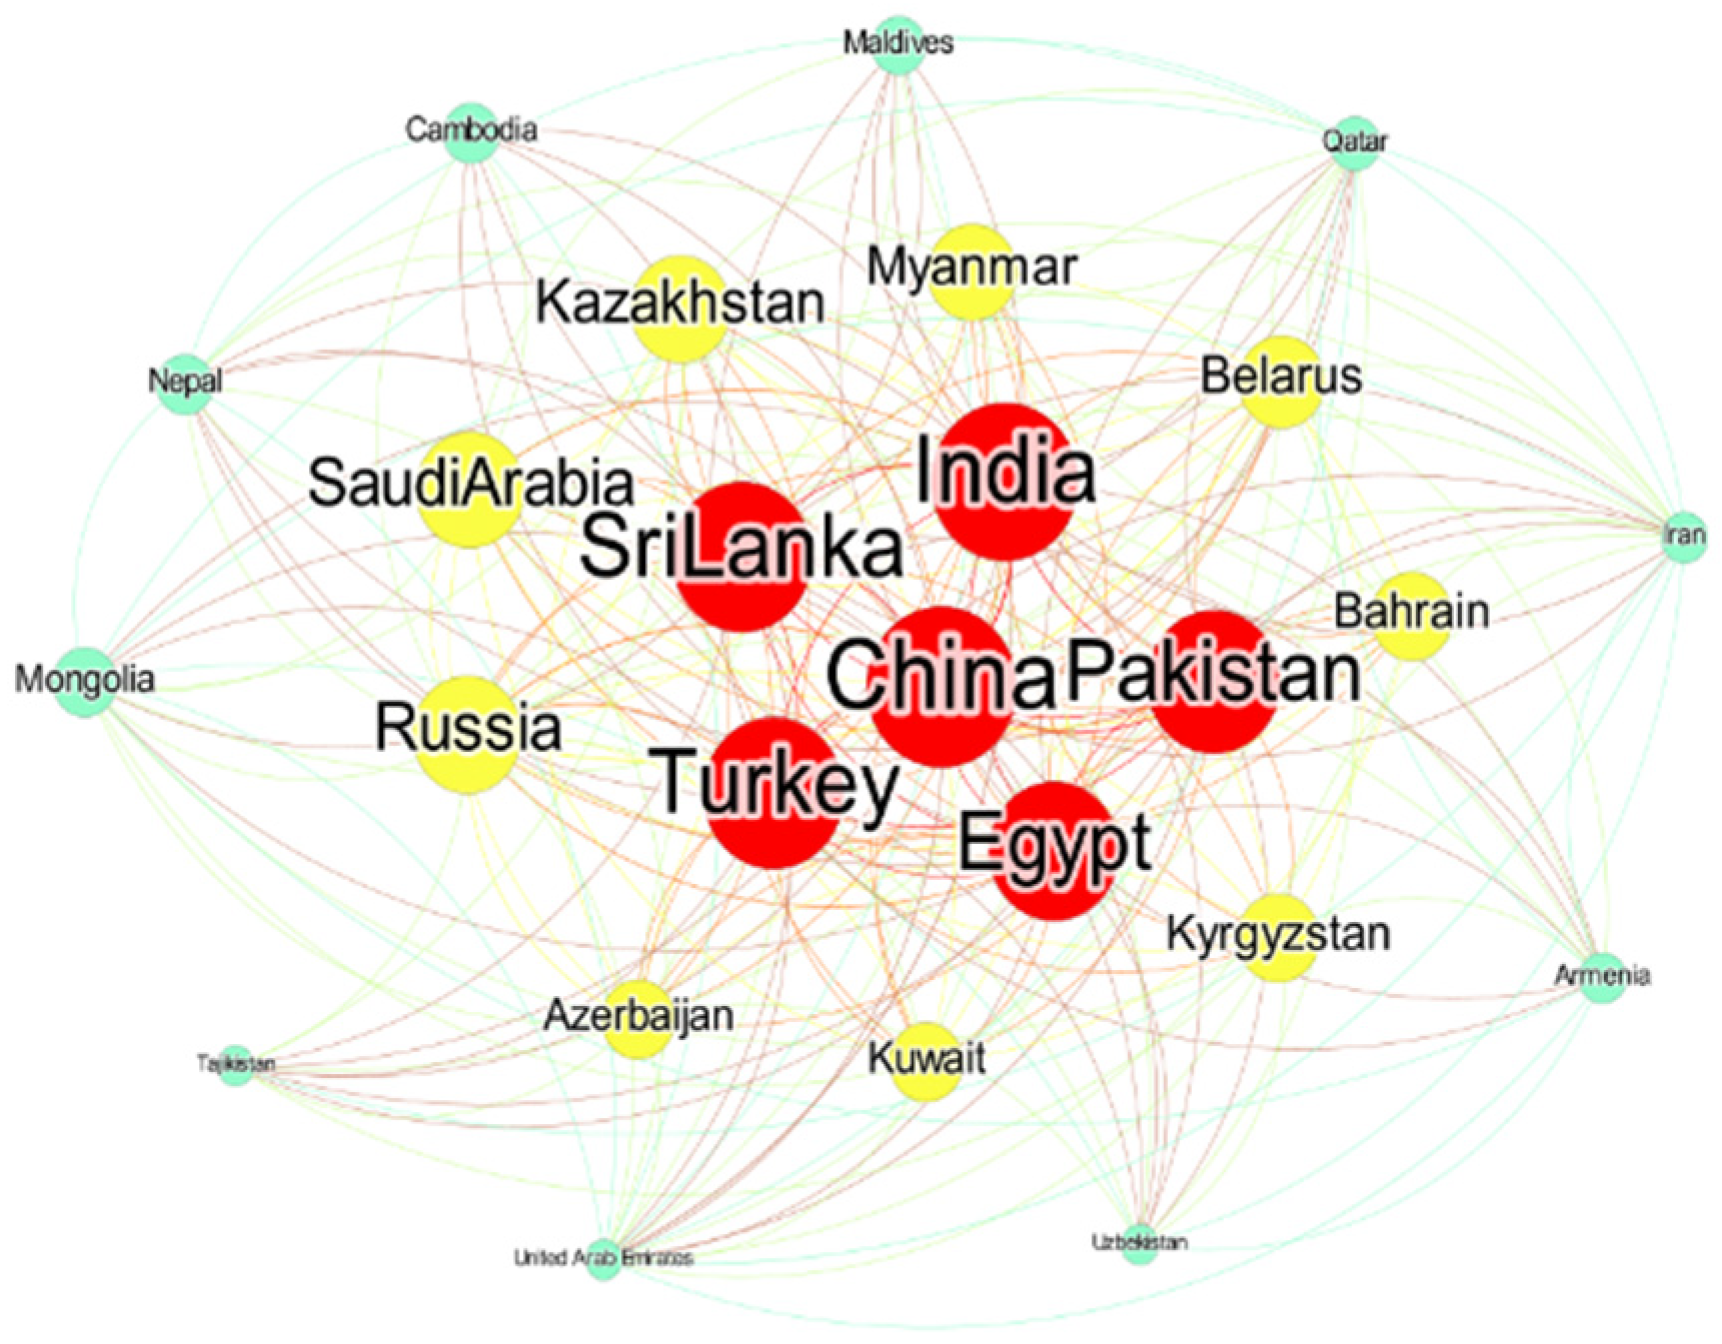
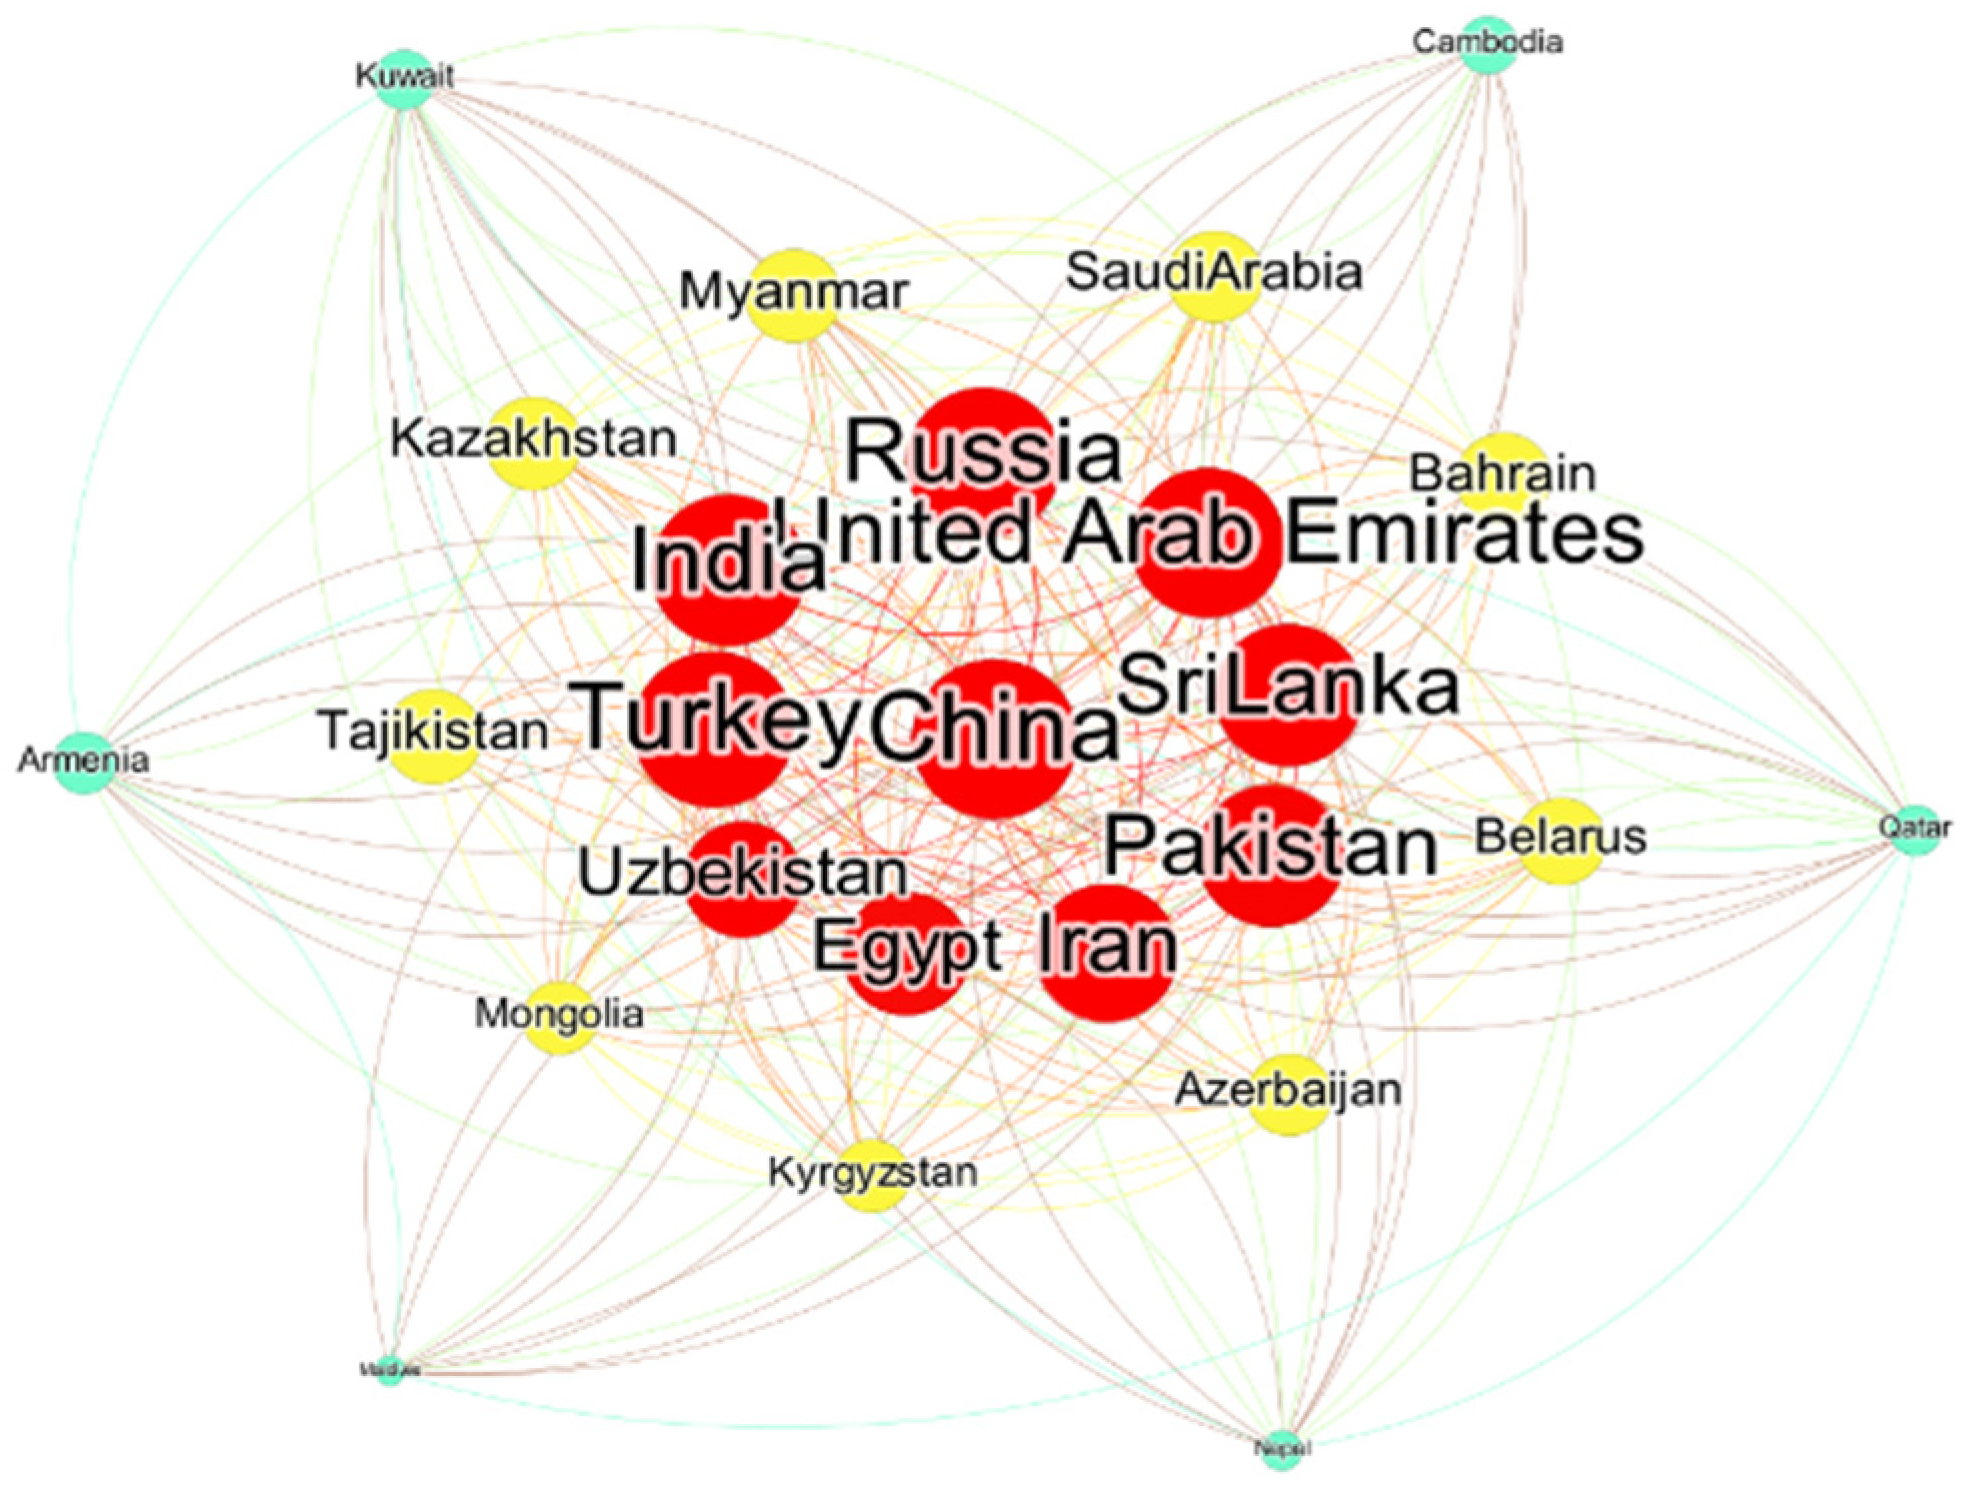
3.4. Characteristics of Individual Network of SCO Agricultural Trade

Using the visualization technology of Gephi software, a weighted network map of SCO agricultural trade in 2003, 2010, 2017, and 2022 was created. These charts clearly show the position and influence of each country in the trade network. In the figure, the nodes represent each trading country, and the size and color of the nodes directly reflect the closeness of the country’s trade network with other countries and the degree of trade activity. The thickness and color of the lines represent the size of the export value, and the arrows clearly indicate the direction of trade.
As can be seen from Figure 1, Figure 2, Figure 3 and Figure 4, in 2003, countries such as China, Pakistan, Turkey, India, Sri Lanka, and Iran were at the center of the network due to their rich agricultural trade relations. Over time, to 2010, 2017, and 2022, the network structure further expanded, and Russia, Saudi Arabia, Egypt, the United Arab Emirates, Uzbekistan, and other countries gradually emerged, and the core nodes in the network showed a diversified trend.
In terms of trade volume, in 2003, the total export volume of agricultural products within the SCO region was USD 11.138 billion, mainly contributed by China, India, Pakistan, Russia, and other countries. By 2022, that amount has grown to USD 94.5 billion, with a wider spread of exporting countries. Similarly, in terms of imports, Russia, China, India, and other countries have maintained a high volume of imports, but over time, the sources of imports have gradually diversified.
It is worth mentioning that China’s role in agricultural trade has changed significantly. In 2003, China’s agricultural exports went to Russia, India, and other countries as the main targets. However, after 2010, China gradually transformed into an import-oriented country, especially with increasingly close trade ties with India. By 2022, the amount of China’s agricultural imports even exceeded the amount of exports, showing China’s important position in the trade network and the adjustment of its trade strategy.
In order to intuitively reveal the evolution of core-edge structure in the SCO agricultural trade network, Ucinet 6.2 software was used to measure the node core degree of the data from 2003, 2010, 2017, and 2022 based on the classification criteria proposed by Tian Gang and Jiang Qingqing [53]. On this basis, the following three levels of state roles are defined: those with a core degree greater than 0.2 are regarded as core countries, those with a core degree between 0.1 and 0.2 (inclusive) are regarded as semi-core countries, and those with a core degree less than or equal to 0.1 are defined as peripheral countries. These data were then imported into Gephi 9.2 software to create a core-edge map of the SCO regional agricultural trade network for the four years (Figure 5, Figure 6, Figure 7 and Figure 8). The red dots represent the core countries, the yellow dots represent the semi-core countries, and the green nodes represent the peripheral countries.
Through the analysis of Figure 5, Figure 6, Figure 7 and Figure 8, it is found that the core-periphery structure of trade in the SCO region has undergone a significant evolution. From 2003 to 2022, the relationship between countries was constantly changing, and the nodes tended to evolve toward the core and semi-core regions. It is worth noting that the number of core countries has been growing, and China has maintained an absolute central position during this period.
Specifically, between 2003 and 2010, the number of core countries remained the same, but Egypt replaced Iran as the core. At the same time, the number of semi-core countries increased from five to nine, while the number of peripheral countries decreased from 13 to 10. This indicates that, during this period, some countries that were originally in the periphery began to emerge and gradually entered the semi-core region. By 2017, the number of core countries had grown significantly from 5 in 2010 to 10. The number of semi-core countries remained stable during this period, while the number of peripheral countries decreased significantly, from 10 to 6. This change reflects the further centralization and centralization of trade networks within the SCO region. By 2022, India had succeeded in becoming an absolute core country, on par with China. The number of core countries increased further, from 10 in 2017 to 12. At the same time, the number of peripheral countries fell again, from six in 2017 to five. This indicates that after a period of rapid growth, the core region of the trade network has gradually stabilized and begun to develop in a more diversified direction.
In summary, the core-periphery structure of the SCO regional agricultural trade network has undergone significant changes over the past two decades. With the increase in the number of core countries and the decrease in the number of peripheral countries, the core region of the trade network has gradually expanded and shown a trend of more diversification and complexity. This change not only reflects the competition and cooperation in the field of trade among the countries of the SCO region but also provides new opportunities and challenges for future trade cooperation.

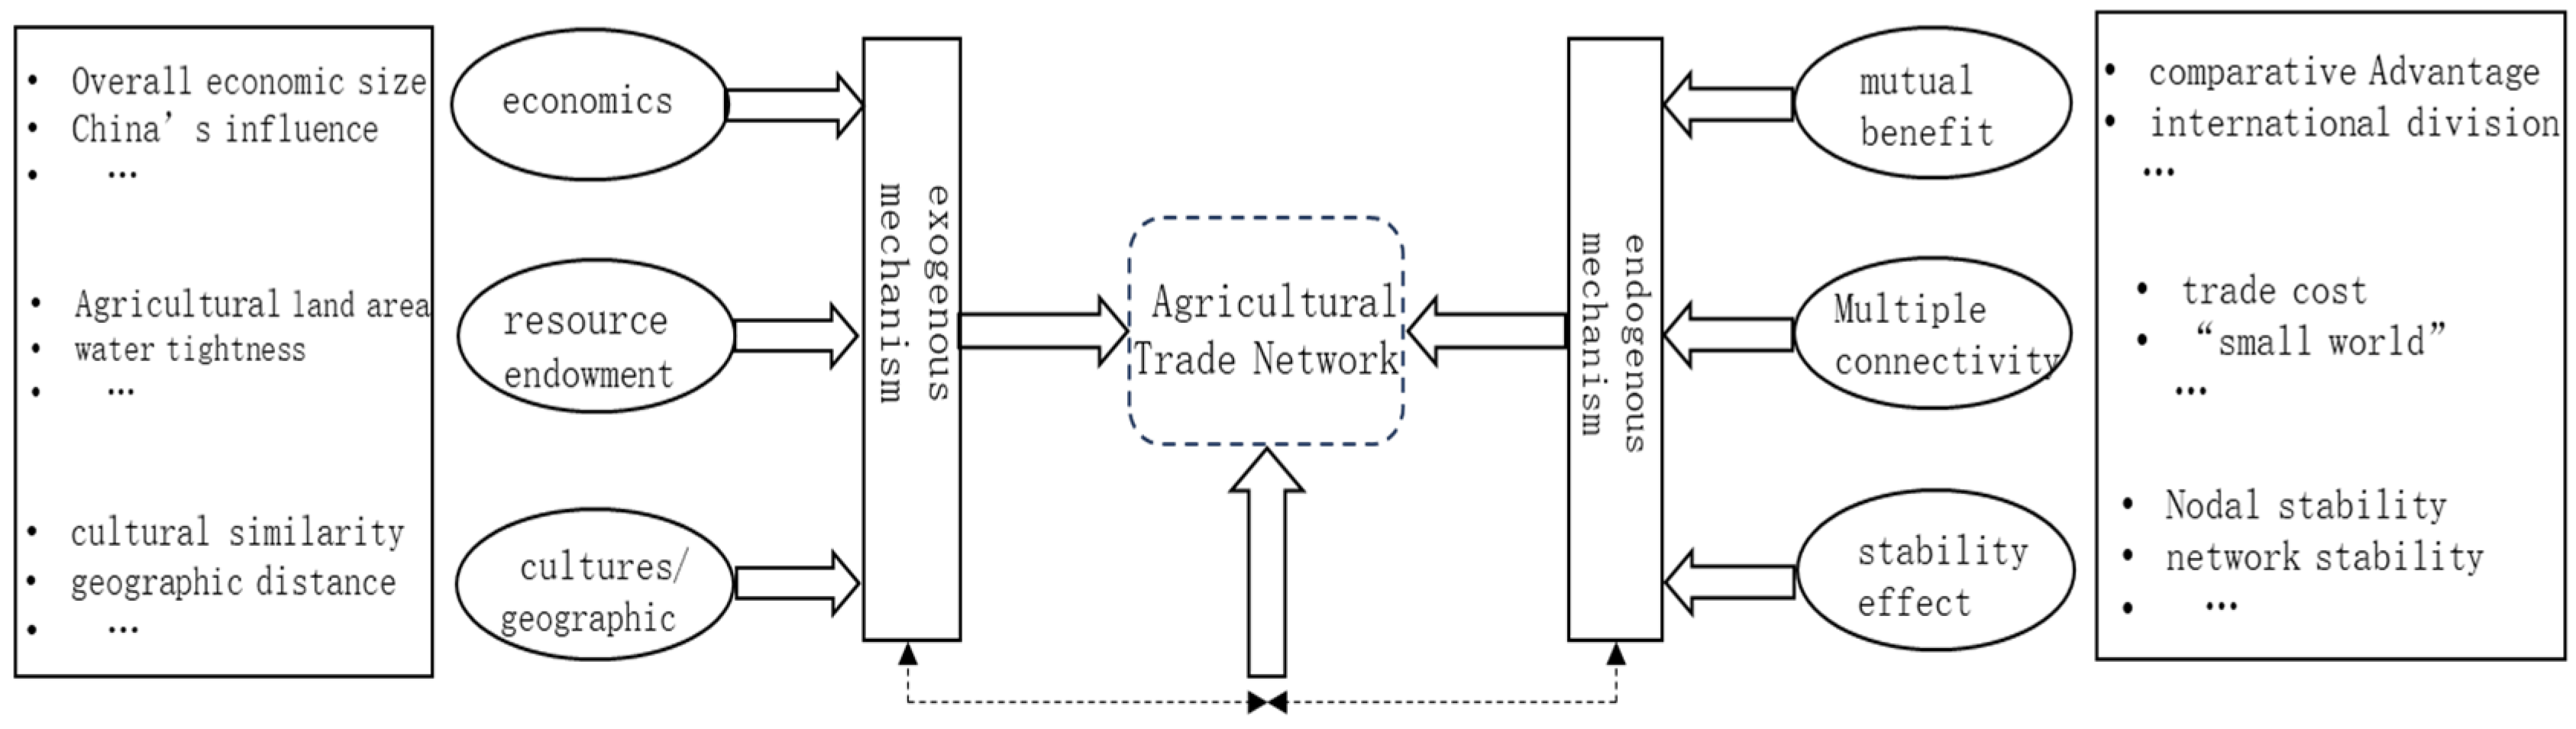
4. Theoretical Analysis of the Formation of the Joint Group of Woven Agricultural Products

This paper analyzes the characteristics of the integrated agricultural trade network and discusses its endogenous and external mechanism. Although previous studies have analyzed the network from overall and individual perspectives, the network has been analyzed, but it has not fully revealed its formation mechanism. In fact, the formation of any trade network is driven by both internal and external factors [54]. The mechanism for the formation of a group of woven agricultural products is shown in Figure 9.

4.1. External Mechanism

The foreign life mechanism of the integrated agricultural trade network is mainly covered by natural resource endowment, economic characteristics, geographical conditions, and the background of the literature, which determines the structure and dynamic of the trade network [55,56,57,58,59]. As an important member of the SCO, China’s huge domestic demand and market influence have played a key role in promoting the formation of agricultural trade networks in the region. Not only does China promote the liquidity of agricultural trade through its own needs, but it also enhances the ability and willingness of regional countries to integrate into the trade network by providing public products and trade preferential policies.
Hypothesis H1. 
By virtue of its core position and influence in the SCO, China has significantly enhanced the ability and willingness of countries in the region to integrate into the agricultural trade network, thus promoting the formation and development of the entire trade network.

4.2. Endogenous Mechanism

Relative to the external mechanism, the endogenous mechanism is more concerned with the interaction and dynamics of the trade network. This paper focuses on the reciprocity effect, the multiple connectivity effect, and the stability effect, revealing the endogenous motivation of the integrated agricultural trade network.

4.2.1. Reciprocity Effect

Reciprocity is an indispensable principle in international trade, and it reflects the vision of mutual benefit through trade [60,61]. And the reciprocal effect explains the important means of the evolution of trade network topology [62]. The effect is particularly striking in the online trading network of integrated agricultural products. Exporting countries have established a relationship of interdependence by providing products with comparative advantages and the need for resources to exchange for the resources of importing countries.
Hypothesis H2. 
The SCO agricultural trade network presents a significant reciprocal effect, which is conducive to the stability and long-term development of the trade network.

4.2.2. Multiple Connectivity Effects

Multiple connectivity effects reveal the multiple connection path of the intermediate node between the nodes in the trade network [63,64]. This effect helps to reduce the uncertainty and information of trade and to improve trade efficiency. In the SCO’s integrated agricultural trade network, countries tend to work with countries that have established relations with their trading partners to obtain more information and opportunities.
Hypothesis H3. 
The SCO agricultural trade network has multiple connectivity effects, which promote the formation and expansion of the trade network.

4.2.3. Stability Effect

The stability of the agricultural trade network stems from the trust relationship between its resource dependence and long-term cooperation. Although some countries will decrease or increase, the overall network structure will not change, with a certain stability [61]. The natural properties of agricultural resources and the mutual understanding of the long-term cooperation between trade parties have made the trading network stable in the face of external shocks.
Hypothesis H4. 
The SCO agricultural trade network shows a high degree of stability, and the countries in the region tend to maintain the existing good trade cooperation.

5. Model Construction and Empirical Analysis

5.1. Variable Selection

5.1.1. Dependent Variable

The core dependent variables of this paper focus on the possibility of the formation of the joint production of agricultural products. In order to accurately measure this variable, the method of processing of the two-value network is adopted [65], and the selected individual data are sorted into a binary network, and the threshold is required based on the research. In view of the study [66,67], the threshold value is $1 million to build a network of online agricultural trade. In particular, when the export volume of agricultural products between two countries exceeds $1 million, the connection to the network is valued as 1, indicating that there is a trade relationship; on the other hand, if the value is 0, there is no direct trade connection.

5.1.2. Endogenous Mechanism Variables

In terms of the endogenous mechanism, the three key factors of reciprocity, multiple connectivity, and stability are mainly considered. Among them, reciprocity concerns whether a country tends to import agricultural products from another country while exporting agricultural products to that country in the trade network, which reflects the degree of interdependence between the two sides of the trade. Multiple connectivity is used to measure whether two countries have established indirect trade cooperation through other third countries in the trade network, which reflects the complexity and connectivity of the trade network. Stability focuses on whether the two parties can maintain the existing cooperative relationship in the future, which is an important indicator to assess the durability of the trade network.

5.1.3. Exogenous Mechanism Variables

In terms of exogenous mechanism variables, a number of external factors that may affect the formation of the SCO agricultural trade network are considered comprehensively, including GDP, China’s influence, the abundance of agricultural land, water stress, geographical distance, cultural differences, and geographical proximity effects. The specific data sources and descriptions of these variables are shown in Table 3, which provides this paper with multiple perspectives to analyze the formation mechanism of the trade network.

5.1.4. Model Construction

TERGM (Temporal Exponential Random Graph Model) is an extension of ERGM (Exponential Random Graph Model), specifically designed for processing and analyzing time-dependent network data. It combines theories from network science and social science and aims to explain relationships in networks and their evolution over time through a generative mechanism. The model is able to capture dynamic changes in the structure of a network, including the formation, disappearance, and alteration of relationships between nodes, and how these changes are affected by other factors in the network (e.g., node attributes, network structural features, etc.).
In order to explore the endogenous and exogenous mechanisms of the formation of the SCO agricultural trade network, the time index random graph model (TERGM) is used in this paper. This model combines the characteristics of the traditional random graph model and considers the time factor, which makes it possible to dynamically analyze the evolution of the network structure and its influencing factors.
Using the data of the export volume of agricultural products of SCO countries from 2003 to 2022 and based on the threshold of USD 1 million, the SCO trade network of agricultural products for the 10 periods of 2003, 2005, 2007, 2009, 2011, 2013, 2015, 2017, 2019, and 2021 was established. Through the TERGM model, the formation mechanism of this network is analyzed, and the following model is constructed:
P ( N t | β t , N t 1 ) = 1 a e x p β 0 e d g e s + β 1 m u t u a l + β 2 g w e s p + β 3 s t a b i l i t y + β i 1 l n g d p + β i 2 l n l a n d + β i 3 l n w a t e r + β i 4 i n f + β j 1 l n g d p + β j 2 l n l a n d + β j 3 l n w a t e r + β i 4 i n f + β i j l a n g + β i j d i s + β i j b o u n d
Among them, Nt and Nt−1 represent the SCO agricultural trade network in the t period and the t1 period, respectively. βt is the set of corresponding parameters; 1/a is a normalized parameter, ensuring that the probability value is between 0 and 1. In the model, i represents the exporting country (sender) and j represents the importing country (receiver). The specific explanations and sources of other variables are shown in Table 3.

5.2. Empirical Analysis

In this paper, by using the MCMC MLE method of TERGM parameter estimation in R language, the endogenous and exogenous mechanisms of the formation of the SCO agricultural trade network are examined, and the regression results of the endogenous mechanisms under different effects are observed using the stepwise regression method. Model 1 is a regression result without an endogenous mechanism, where edges are constant terms and are usually not specifically explained. Model 2 is the regression result under reciprocal effect. Model 3 is the regression result under multiple connectivity effects. Model 4 is the regression result under the stability effect.
From the regression results of endogenous mechanisms, it is found that the estimated parameters of edges are negative in models 1 to 4, which confirms that the SCO agricultural trade network is not formed randomly. Therefore, it is of great significance to further analyze the influencing factors of the formation of various network relationships. From the perspective of the structural variables of the endogenous network, the coefficient of the mutual effect is positive and passes the test at the significance level of 1%, which means that reciprocity actively promotes the formation and maintenance of bilateral trade relations between SCO countries for agricultural products. This indicates that in reciprocal trade, it is easier to establish trade relations due to the high dependence of trade relations. At the same time, it also shows that there is two-way trade among many countries, the dependence between agricultural products trading countries is gradually increasing, and different countries in international agricultural product trade are compatible with each other at the supply and demand level, with the potential to generate new production cooperation relations. This finding not only confirms the above characteristics of the overall compact trade network but also validates hypothesis 1. The coefficient of the multiple connectivity effect (gwesp) is positive at the significance level of 1%, which means that, in the SCO agricultural trade network, there is a strong tendency to rely on third-party countries for agricultural trade, which promotes the formation of the trade network, thus verifying hypothesis 2. The coefficient of the stability effect is positive and passes the test at the significance level of 1%, indicating that the SCO agricultural trade network as a whole had a good stability during the study period, so hypothesis 3 is verified.
According to the results of exogenous mechanism regression, the bound coefficients of geographical factors are all positive and pass the significance test, indicating that countries with common borders are more likely to generate high-intensity agricultural trade. This is because border ports are more likely to exist in neighboring countries, and border ports are the frontier of inter-country trade and play a positive role in agricultural trade. In addition, the distance (dist) coefficient between countries is negative and highly significant, because the longer the distance, the higher the transportation cost and trade risk. Considering the particularity of agricultural products, the higher the requirements on transportation means and time, countries are more inclined to establish trade relations with countries with short distances for agricultural products.
From the perspective of culture, the influence of common language (lang) on agricultural trade remains positive at the significance level of 1% and has a positive relationship with trade. Language and culture represent the internal relations between nations. Nations with a common language usually have commonalities in ideology and values and similar habits of life and consumption. This has a positive effect on trade development and can effectively reduce the time cost of trade negotiations and exchanges, thus reducing trade conflicts and frictions. Therefore, a common language contributes to the formation of trade links in agricultural products among the SCO countries.
GDP passes the significance test in both sender effect (nodeocov.gdp) and receiver effect (nodeicov.gdp), and the coefficient is positive, which indicates that GDP plays an important role in promoting the establishment of agricultural trade relations. The level of economic development of a country is the embodiment of its production capacity and demand level. The higher the level of economic development of two countries, the greater the possibility of actively participating in or accepting trade cooperation relations. In addition, the coefficient of agricultural land is significantly positive under the sender effect (nodeocov.land) and negative under the receiver effect (nodeicov.land) but fails the significance test, which means that countries with higher agricultural resource endowment are more inclined to participate in agricultural trade cooperation. However, the scarcity of agricultural resource endowment inhibits the initiative of participating in agricultural trade cooperation to some extent. Resource endowment theory also points out that resource endowment will affect the price and competitiveness of related products, thus determining the comparative advantage of related products. Therefore, most countries are more inclined to export products with comparative advantages and import products with disadvantages, so agricultural resource endowment is conducive to promoting the formation of agricultural export trade relations. The coefficient of tight water degree was positive under the sender effect (nodeocov.water) and positive and negative under the receiver effect (nodeicov.water), but it did not pass the significance test, indicating that the scarcity of water resources inhibits the formation of agricultural trade cooperation in the SCO.
Under the issuer effect, the coefficient of China’s influence (nodeocov.inf) is significantly positive, which indicates that countries with greater influence from China are more inclined to actively participate in SCO agricultural trade cooperation, division of production, and expand agricultural trade exports in the SCO region. However, in the regression results of the Chinese influence under the reception effect (nodeicov.inf), the regression coefficients are positive and negative in different models, which means that in most cases the inflow of agricultural trade from the SCO region is not related to the size of China’s influence or is uncertain. However, only from the perspective of the flow of agricultural trade to other countries in the region, China, as the participating and leading country of the SCO, with continuous improvement of its influence, favorably increases the probability of countries in the region taking the initiative to establish trade cooperation relations in the SCO agricultural trade network, thus verifying hypothesis H1 (See Table 4 for details.)

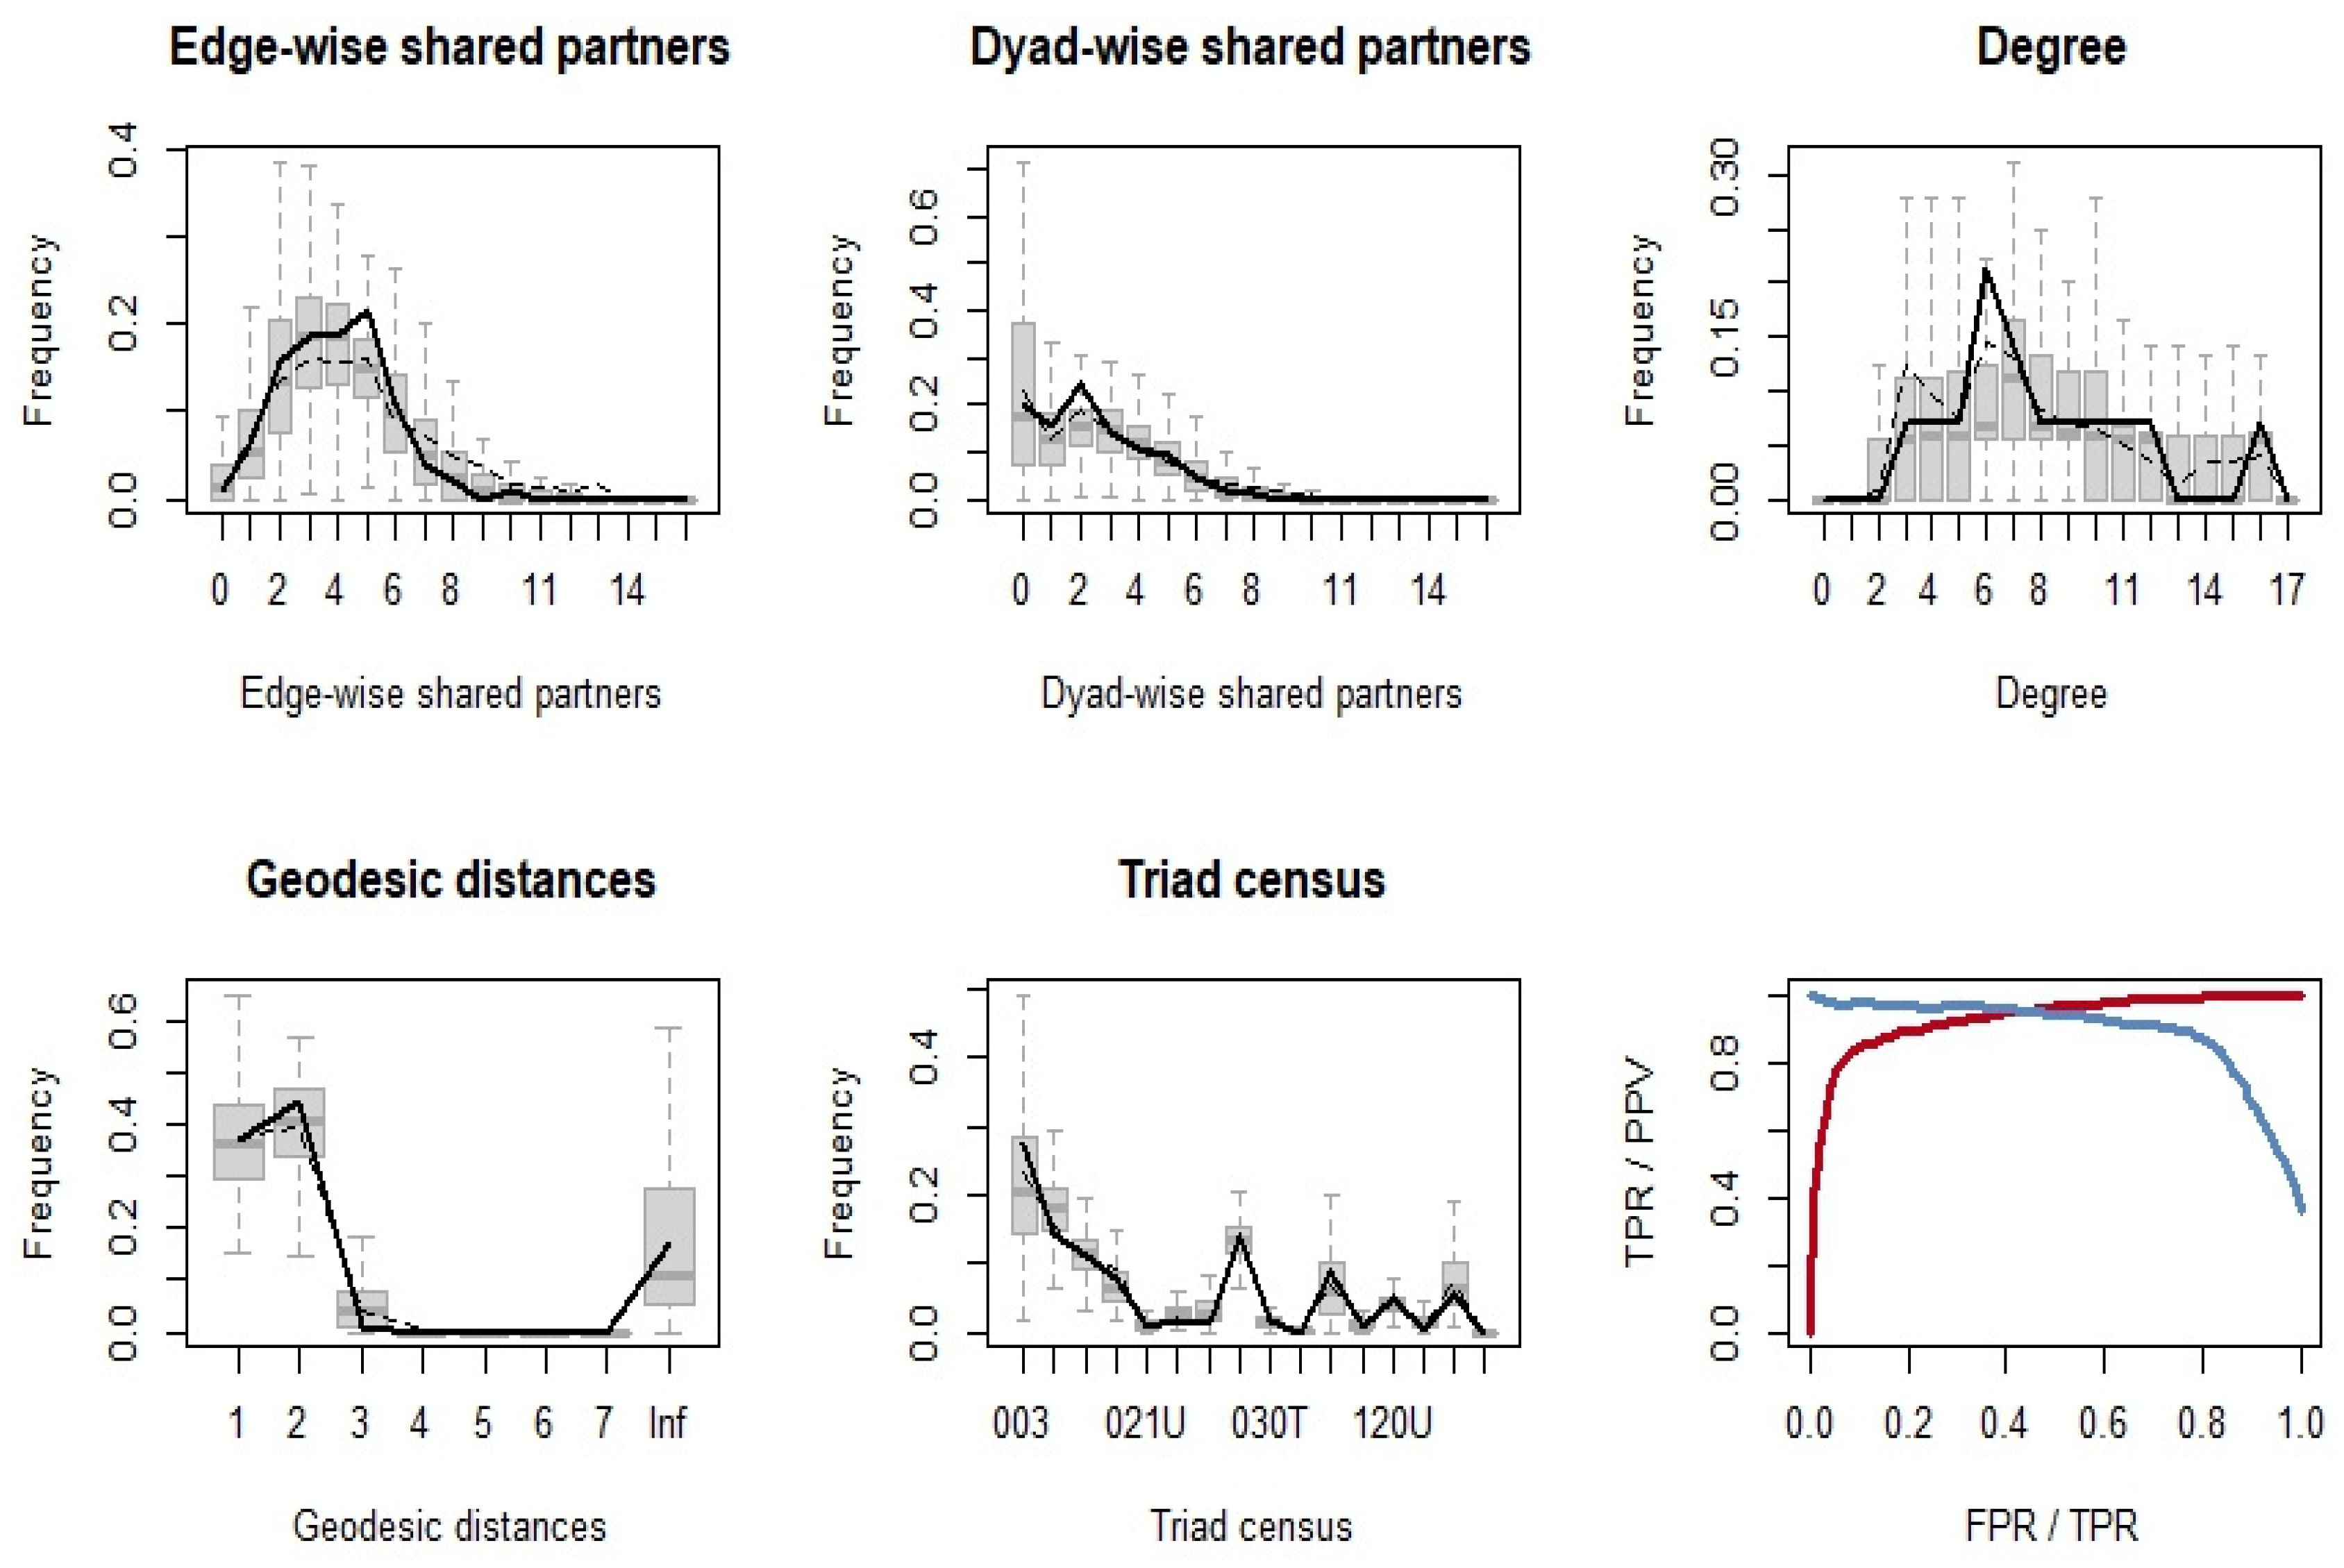
5.3. Goodness of Fit Analysis

In order to evaluate the degree of fit between the model and the data, based on model 4, this paper uses the Goodness of Fit (GOF) method to simulate 1000 random policy networks, and compares the real and simulated networks of SCO agricultural trade with the goodness of fit. In this process, six key statistics were selected: The numbers of edge-wise shared partners, dyad-wise shared partners, geodesic distances, degree, triad census, and FRP/PR to comprehensively measure the subtle differences between real and simulated networks. The results are presented in an intuitive graphical manner, where the black line represents the structural eigenvalues of the real SCO agricultural trade network, while the grey line represents the simulated network structural eigenvalues based on the TERGM model. The closer the black and gray lines are in the chart, the higher the fit between the simulated network and the real network, thus verifying the good fitting effect of the TERGM model [68].
From the measurement results of the six statistics shown in Figure 10, the structural characteristic values of the simulated network are highly consistent with those of the real network, which fully indicates that the simulation based on the TERGM model can accurately reflect the real characteristics of the SCO agricultural trade network. The validity and reliability of the model in simulating and predicting the dynamics of the trade network in this field are proved.

5.4. Robustness Test

In order to enhance the robustness and accuracy of empirical research, this paper adopts the following strategies for verification:
Firstly, ten key time points from 2004 to 2022 (2004, 2006, 2008, 2010, 2012, 2014, 2016, 2018, 2020, 2022) are selected, and systematic empirical analysis is carried out using the TERGM model (models 5 to 8). This approach aims to capture trends in the SCO agricultural trade network across different time periods. Secondly, in order to test the robustness of TERGM model estimation, the original Markov chain Monte Carlo maximum likelihood estimation method (MCMC MLE) is replaced by the autonomous method (MPLE), the data are re-analyzed, and the regression results of model 9 are obtained. This change allows for the comparison of results under different estimation methods to assess the reliability of the model itself. Further, in order to verify the universality of the research conclusions, another network analysis model, the ERGM model (Model 10), is adopted for empirical analysis based on the trade network data of 2022. This step provides an independent and complementary perspective for this paper to verify the validity of previous findings.
Through comprehensive analysis, it can be clearly seen that the variable results obtained by both the TERGM model (model 5 to model 9) and ERGM model (model 10) are highly consistent with the results of previous empirical studies, and there is no obvious difference. This finding strongly supports the reliability of the conclusions of this study and proves that the empirical methods and models adopted are highly effective and robust in analyzing the SCO agricultural trade network (See Table 5 for details).

6. Conclusions and Countermeasures

6.1. Conclusions

This paper uses complex network analysis to study and reveal the changes and development trends of the SCO agricultural trade network during 2003–2022 and further uses the TERGM model to analyze its influence mechanism, drawing the following main conclusions:
First, the SCO agricultural trade network has undergone significant changes and development over the past two decades, forming a closer, more interconnected and diversified trade network. These changes not only increase the efficiency of trade but also strengthen cooperation and dependence among countries within the network. In the future, with further deepening of SCO regional trade cooperation, the trade network is expected to continue to develop and improve.
Second, China has played an important role in the SCO agricultural trade network, and the adjustment of its trade strategy and the change of its role (from export-oriented to import-oriented) have had a significant impact on the structure of the trade network. In addition, the number of core countries in the trade network has grown over time, and the network structure has gradually developed in a more diversified direction.
Thirdly, the formation mechanism of the SCO agricultural trade network is empirically tested, and it is found that the formation of the SCO agricultural trade network is the result of multiple factors, including endogenous reciprocity, connectivity, and stability mechanisms, as well as exogenous geographical, cultural, and economic factors. At the same time, China’s role as the dominant country has played an important role in promoting the development of trade networks.

6.2. Countermeasures and Suggestions

First, deepen cooperation in the SCO agricultural trade network.
Strengthen policy communication and coordination. SCO member states should further strengthen communication and coordination at the policy level to ensure the coherence and consistency of agricultural trade policies and provide a strong guarantee for the sustainable development and improvement of the trade network. To optimize the trade environment, all countries should work together to reduce trade barriers, optimize the trade environment, provide more convenient and efficient services for agricultural trade, and promote the improvement of trade efficiency. Expand diversified trade channels, actively explore new trade channels and models on the basis of existing trade networks, expand diversified trade markets, and enhance the resilience and stability of trade networks.
Second, give play to China’s leading role in the SCO agricultural trade network.
China should continue to deepen its import-oriented strategy and increase its imports of agricultural products from other SCO member states, so as to promote the balanced development of trade and at the same time help to meet diversified domestic consumer demand. To strengthen trade and investment cooperation, China can further increase trade and investment with other SCO member states, promote agricultural cooperation and exchange, and jointly enhance the competitiveness of the agricultural trade network. Give full play to the radiating role of the Chinese market. As one of the world’s largest agricultural markets, China’s market size and consumer demand have an important impact on other member states. China should make full use of this advantage, give full play to the radiating and driving role of the market, and promote the further development of the SCO agricultural trade network.
Third, pay attention to the combination of endogenous mechanisms and exogenous factors.
Strengthen mutually beneficial trade cooperation. Countries should further strengthen mutually beneficial trade cooperation, promote the development of agricultural trade through a mutually beneficial and win–win way, and enhance the stability and sustainability of trade relations. Strengthen infrastructure construction. In view of the geographical factors of distance and border problems, countries should strengthen infrastructure construction, improve logistics efficiency, reduce transportation costs, and provide more convenient conditions for agricultural trade. Promote cultural exchanges and integration. In view of the common language problem as a cultural factor, countries should strengthen cultural exchange and integration, enhance mutual understanding and trust, and create a good cultural environment for the development of agricultural trade. Optimizing resource allocation. In view of the GDP and agricultural resource endowment in economic factors, countries should optimize resource allocation, improve agricultural production efficiency and quality, and enhance the international competitiveness of agricultural products. At the same time, we should also pay attention to the rational use and protection of water resources to reduce the negative impact of water shortage on agricultural trade.
The implementation of the above measures and suggestions will further promote the development and improvement of the SCO agricultural trade network, strengthen cooperation and dependence among member states, and achieve a win–win situation.

Author Contributions

Conceptualization, A.A.; methodology, A.A.; writing—original draft preparation, D.W.; writing—review and editing, A.A., B.A., A.Y. (Asiyemu Youliwasi), A.Y. (Abulaiti Yiming) and D.W. All authors have read and agreed to the published version of the manuscript.

Funding

2023 Key Project of Sichuan Key Laboratory of Philosophy and Social Sciences Sichuan Artificial Intelligence Plan “Excavation and Digitization of Sichuan Oral History”, project number: CR23ZD1. 2023 Sichuan Key Laboratory of Philosophy and Social Sciences Sichuan Key Laboratory of Artificial Intelligence plan general project “Prefabricated food industry Integration Cluster Development Research” project number: CR23Y19. Study on the influence mechanism, effect and improvement path of the evolution of trade network on the resilience of agricultural trade between China and Shanghai Cooperation Organization member states (XJAUGRI2024010), a postgraduate Research and Innovation project of Xinjiang Agricultural University in 2024. Key Project of Education Department of Xinjiang Uygur Autonomous Region (XJEDU2021S1008).

Institutional Review Board Statement

No ethical approval is required for this study.

Informed Consent Statement

The study did not involve humans.

Data Availability Statement

Data are contained within the article.

Conflicts of Interest

The authors declare that there are no conflicts of interest.

References

  1. Zhang, D.; Sun, Z. Comparative advantage of agricultural trade in countries along the belt and road and China and its dynamic evolution characteristics. Foods 2022, 11, 3401. [Google Scholar] [CrossRef] [PubMed]
  2. Food and Agriculture Organization of the United Nations. The State of Agricultural Commodity Markets 2022—The Geography of Food and Agricultural Trade: Policy Approaches for Sustainable Development; Food and Agriculture Organization of the United Nations: Rome, Italy, 2022. [Google Scholar]
  3. Huang, X.Y.; Li, G.X. Study on the evolution of agricultural trade network pattern and its influencing mechanism of RCEP countries: Based on the perspective of complex network. Explor. Int. Econ. Trade 2023, 39, 22–41. [Google Scholar]
  4. Chen, X.; Yuan, L.; Song, C. Investigating merchandise trade structure in the RCEP region from the perspective of regional integration. J. Geogr. Sci. 2023, 33, 1185–1204. [Google Scholar] [CrossRef]
  5. Zheng, G.F. Opportunities and Challenges for the development of agricultural trade cooperation between China and SCO members under the Belt and Road Initiative. Agric. Econ. 2019, 6, 132–134. [Google Scholar]
  6. Han, D.; Li, G.S. Evolution and influence mechanism of grain trade pattern between China and countries along the “Belt and Road”—Based on the perspective of social network. Issues Agric. Econ. 2020, 8, 24–40. [Google Scholar]
  7. Li, J.; Zhang, R.; Jiang, B. Economic integration, institutional quality and agricultural trade in the Shanghai Cooperation Organization. J. China Univ. Pet. Ed. Soc. Sci. 2023, 39, 95–104. [Google Scholar]
  8. Gutiérrez-Moya, E.; Lozano, S.; Adenso-Díaz, B. Analyzing the structure of the global wheat trade network: An ERGM approach. Agronomy 2020, 10, 1967. [Google Scholar] [CrossRef]
  9. Peer, R.A.; Chini, C.M. An integrated assessment of the global virtual water trade network of energy. Environ. Res. Lett. 2020, 15, 114015. [Google Scholar] [CrossRef]
  10. Shirazi, M.A.; Ghasemi, T.; Mohammadi, J. A dynamic network comparison analysis of crude oil trade: Evidence from Eastern Europe and Eurasia. Zagreb Int. Rev. Econ. Bus. 2020, 23, 95–119. [Google Scholar] [CrossRef]
  11. Wang, X.Y.; Chen, B.; Hou, N.; Chi, Z.P. Evolution of structural properties of the global strategic emerging industries’ trade network and its determinants: An TERGM analysis. Ind. Mark. Manag. 2024, 118, 78–92. [Google Scholar] [CrossRef]
  12. Mitra, T.; Hassan, M.K. A weighted planar stochastic lattice with scale-free, small-world and multifractal properties. Chaos Solitons Fractals 2022, 154, 111656. [Google Scholar] [CrossRef]
  13. Ikizler, H. Contagion of network products in small-world networks. J. Econ. Interact. Coord. 2019, 14, 789–809. [Google Scholar] [CrossRef]
  14. Liu, S.G.; Duan, P.L.; Yin, P.; Wang, L. Structural characteristics of agricultural trade network of countries along the Silk Road Economic Belt. Econ. Geogr. 2019, 39, 198–206. [Google Scholar]
  15. Radhika, D. Introduction: International economic governance in a multipolar world. Jpn. Political Econ. 2020, 46, 95–101. [Google Scholar]
  16. Cerina, F.; Zhu, Z.; Chessa, A.; Riccaboni, M. World input-output network. PLoS ONE 2015, 10, e0134025. [Google Scholar] [CrossRef]
  17. Valková, I. Centrality in the network of regional trade agreements: Effects on the strategies of the Arctic claimant states. Int. Area Stud. Rev. 2017, 20, 122–143. [Google Scholar] [CrossRef]
  18. Gaulier, G.; Lemoine, F.; Ünal-Kesenci, D. China’s integration in East Asia: Production sharing, FDI & high-tech trade. Econ. Change Restruct. 2008, 40, 27–63. [Google Scholar]
  19. Loye, J.; Ermann, L.; Shepelyansky, D.L. World impact of kernel European Union 9 countries from Google matrix analysis of the world trade network. Appl. Netw. Sci. 2021, 6, 37. [Google Scholar] [CrossRef]
  20. Chen, W.; Wang, X.R.; Long, Y.; Zhao, X.Q.; Liu, Z.G. Study on the resilience of regional trade networks along the Belt and Road. Econ. Geogr. 2018, 44, 22–31. [Google Scholar]
  21. Wang, D.Z.; Abula, B.W.J.; Lu, Q.; Liu, Y.; Zhou, Y.J. Regional Business Environment, Agricultural Opening-Up and High-Quality Development: Dynamic Empirical Analysis from China’s Agriculture. Agronomy 2022, 12, 974. [Google Scholar] [CrossRef]
  22. Fritz, C.; Lebacher, M.; Kauermann, G. Tempus volat, hora fugit: A survey of tie-oriented dynamic network models in discrete and continuous time. Stat. Neerl. 2020, 74, 275–299. [Google Scholar] [CrossRef]
  23. Pamp, O.; Lebacher, M.; Thurner, P.W. Explaining destinations and volumes of international arms transfers: A novel network Heckman selection model. Eur. J. Political Econ. 2021, 69, 102033. [Google Scholar] [CrossRef]
  24. Wang, X.Y.; Chen, B. World power trends and international relations: Measuring power with an entropy-QAP approach. J. Chin. Political Sci. 2023, 29, 207–231. [Google Scholar] [CrossRef]
  25. Pan, S.; Chong, Z. Effects of FDI on trade among countries along the belt and road: A network perspective. J. Int. Trade Econ. Dev. 2022, 32, 84–103. [Google Scholar] [CrossRef]
  26. Chen, B.; Xu, H.; Feng, L. Structural properties and evolution of global photovoltaic industry trade network. Environ. Sci. Pollut. Res. 2023, 30, 69580–69598. [Google Scholar] [CrossRef] [PubMed]
  27. Wang, C.; Zhang, X.; Hu, X. Evolution of structural characteristics and its determinants of global human hair waste trade network based on temporal exponential random graph model. Resour. Conserv. Recycl. 2024, 200, 107305. [Google Scholar] [CrossRef]
  28. Ma, S.Z.; Ren, W.W.; Wu, G.J. The influence of a country’s agricultural trade network and its impact on the division of the global value chain—Based on social network analysis perspective. J. Manag. World 2016, 3, 60–72. [Google Scholar]
  29. Halit, Y.; Hasan, K.; Abdullah, A. Implications of participation in global value chains for international trade network. Appl. Econ. Lett. 2021, 28, 1169–1173. [Google Scholar]
  30. Byung-Hak, L.; Seong, W.E. Impact of national cultural networks on trade network: QAP analysis. J. Int. Trade Commer. 2021, 17, 11–20. [Google Scholar]
  31. Seok, H.; Nam, Y. A social network analysis of international creative goods flow. Sustainability 2022, 14, 4463. [Google Scholar] [CrossRef]
  32. Yaqub, M.Z.; Srećković, M.; Cliquet, G.; Hendrikse, G.; Windsperger, J. Network innovation versus innovation through networks. Ind. Mark. Manag. 2020, 90, 79–89. [Google Scholar] [CrossRef]
  33. Smith, M.; Sarabi, Y. How does the behaviour of the core differ from the periphery?—An international trade network analysis. Soc. Netw. 2022, 70, 1–5. [Google Scholar] [CrossRef]
  34. Cranmer, S.J.; Heinrich, T.; Desmarais, B.A. Reciprocity and the structural determinants of the international sanctions network. Soc. Netw. 2014, 36, 5–22. [Google Scholar] [CrossRef]
  35. Chen, W.; Meng, Y. Research on China’s embodied carbon transfer network in 2012 from the perspective of provinces and sectors. Environ. Sci. Pollut. Res. Int. 2020, 27, 38701–38714. [Google Scholar] [CrossRef]
  36. He, Y.Y.; Wei, Z.X.; Liu, G.Q. Spatial network analysis of carbon emissions from the electricity sector in China. J. Clean. Prod. 2020, 262, 121193. [Google Scholar] [CrossRef]
  37. Wang, Y.; Yao, J. Complex network analysis of carbon emission transfers under global value chains. Environ. Sci. Pollut. Res. Int. 2022, 29, 47673–47695. [Google Scholar] [CrossRef]
  38. Lin, T.; Huang, Y.D. Analysis of Sino-Indian agricultural trade relations under the background of “One Belt and One Road”. Asia-Pac. Econ. 2020, 3, 45–52+149–150. [Google Scholar]
  39. Hu, Q.J.; Xiang, J.; Yan, H.L. Development characteristics, obstacles and countermeasures of Sino-Kazakh agricultural trade under the Belt and Road Initiative. Price Mon. 2020, 5, 43–47. [Google Scholar]
  40. Wang, X.S.; Li, J.Y. Research on Governance of Regional Trade cooperation between China and the member states of the Shanghai Cooperation Organization (SCO)—On the Construction of Free Trade Zones under the background of the Silk Road Economic Belt. Arid. Land Geogr. 2018, 1, 205–214. [Google Scholar]
  41. Wang, J.; Zhang, Q.P.; Ma, W.X. Study on the impact of Trade Facilitation on the Trade duration of China’s Agricultural Exports to the SCO countries. Chin. J. Agric. Mech. 2019, 44, 257–265. [Google Scholar]
  42. Qi, X.H.; Liu, Y. Intra-industry trade of agricultural products between China and five Central Asian countries and its Influencing factors: Based on Panel data analysis from 2004 to 2013. Int. Bus. J. Univ. Int. Bus. Econ. 2016, 1, 50–59. [Google Scholar]
  43. Xu, G.L.; Meng, T.Q.; Ji, S.L. Research on the development of agricultural trade between China and Central Asian countries under the “Belt and Road” Strategy. Reform Strategy 2017, 33, 154–157. [Google Scholar]
  44. Ding, C.Z.; Xiao, H.F. Analysis on the characteristics of agricultural trade between China and the Central and West Asian Economic Corridor countries: Based on the “Belt and Road” strategy background. Explor. Econ. Issues 2018, 6, 112–122. [Google Scholar]
  45. Guo, Y.J.; Xiao, H.F. Analysis on influencing factors of agricultural trade fluctuation between China and SCO member countries under the background of the Belt and Road Initiative. J. Xinjiang Univ. Philos. Humanit. Soc. Sci. Ed. 2021, 49, 48–57. [Google Scholar]
  46. Zhang, Q.P.; Zhu, J. Agricultural trade and Investment cooperation between China and the SCO countries: An analysis based on the framework of the Belt and Road Initiative. Int. Econ. Coop. 2017, 2, 63–70. [Google Scholar]
  47. Ding, S.H.; He, S.Q. Analysis on efficiency and Influencing factors of China’s agricultural exports to five Central Asian countries. Int. Bus. J. Univ. Int. Bus. Econ. 2019, 5, 13–24. [Google Scholar]
  48. Lu, X.Y.; Sun, Z.L.; Li, X.D. Study on export efficiency and potential of agricultural products between China and five Central Asian countries: Based on stochastic frontier gravity model. World Agric. 2020, 9, 65–73. [Google Scholar]
  49. Xu, J.J.; An, H.; Yang, X.W. Study on the impact of transnational finance of the “Belt and Road” on export trade network: An empirical test based on the Index Random graph model. China Soft Sci. 2022, 6, 146–157. [Google Scholar]
  50. Ding, J.C.; Kong, D.M.; Xiao, C.X.; Hao, L.S. Study on the evolution characteristics of global photovoltaic industry trade pattern from the perspective of industrial chain. World Geogr. Res. 2024, 33, 1–17. [Google Scholar]
  51. Lu, Y.F.; Fang, R.N.; Wang, D. Topological structure characteristics and influencing mechanism of global digital service trade network. J. Quant. Tech. Econ. 2021, 38, 128–147. [Google Scholar]
  52. Wang, J.Y.; Dai, C.; Zhou, M.Z.; Liu, Z.J. Global grain trade network pattern and its influencing factors. J. Nat. Res. 2021, 36, 1545–1556. (In Chinese) [Google Scholar] [CrossRef]
  53. Tian, G.; Jiang, Q.Q. Social network analysis of international log trade pattern from 2005 to 2014. World For. Res. 2016, 29, 87–91. [Google Scholar]
  54. Lusher, D.; Koskinen, J.; Robins, G. Exponential Random Graph Models for Social Networks: Theory, Methods and Applications; Cambridge University Press: Cambridge, MA, USA, 2012. [Google Scholar]
  55. Kilduff, M.; Krackhardt, D. Interpersonal Networks in Organizations: Cognition, Personality, Dynamics, and Culture: Structural Analysis in the Social Sciences; Cambridge University Press: Cambridge, MA, USA, 2008. [Google Scholar]
  56. Shi, B.Z.; Xian, G.M.; Lu, J. How geographical distance reduces trade flow. World Econ. 2012, 7, 22–41. [Google Scholar]
  57. Wang, M.C.; Xu, K.N. Dynamic relationship between bilateral trade and China’s economic growth in “Belt and Road” countries: Based on spatial interaction perspective. World Econ. Res. 2016, 2, 101–110+137. [Google Scholar]
  58. Zhang, W.G.; Sun, T. The economic power of language: The impact of English Proficiency on China’s foreign service trade. Int. Trade Issues 2016, 8, 97–107. [Google Scholar]
  59. Hu, Y.N.; Wang, J.T.; Tian, M.Z. Foreign trade, technological Progress and economic growth: An empirical study based on spatial Panel Equation. Math. Stat. Manag. 2019, 39, 771–787. [Google Scholar]
  60. Xu, H.L.; Sun, T.Y.; Cheng, L.H. Study on the pattern and influencing factors of high-end manufacturing trade in the Belt and Road Initiative: An index random graph analysis based on complex network. Financ. Trade Econ. 2015, 12, 74–88. [Google Scholar]
  61. Liu, L.Q.; Chen, Z.R.; Tian, B.F. How structural dependence affects the Formation and Evolution of trade networks: A case study of the Belt and Road Initiative. World Econ. Res. 2020, 6, 106–120+137. [Google Scholar]
  62. Garlaschelli, D.; Loffredo, M.I. Patterns of Link Reciprocity in Directed Networks. Phys. Rev. Lett. 2004, 93, 268701. [Google Scholar] [CrossRef]
  63. Cranmer, S.J.; Desmarais, B.A.; Menninga, E.J. Complex dependencies in the alliance network. Confl. Manag. Peace Sci. 2012, 29, 279–313. [Google Scholar] [CrossRef]
  64. Giuliani, E. Network Dynamics in Regional Clusters: Evidence from Chile. Res. Policy 2013, 42, 1406–1419. [Google Scholar] [CrossRef]
  65. Desmarais, B.A.; Cranmer, S.J. Statistical Mechanics of Networks: Estimation and Uncertainty. Phys. A Stat. Mech. Its Appl. 2012, 391, 1865–1876. [Google Scholar] [CrossRef]
  66. Li, J.; Chen, N.; Wan, G.H.; Chen, S. Competitive and complementary relations and dynamic changes of goods trade among countries along the Belt and Road: Based on network analysis method. J. Manag. World 2017, 4, 10–19. [Google Scholar]
  67. Luo, C.L.; Fu, Z.P.; Liu, B.; Wang, X. Study on the evolution and dynamic mechanism of international trade network of strategic emerging industries. Issues Int. Trade 2022, 3, 121–139. [Google Scholar]
  68. Leifeld, P.; Cranmer, S.J. A Theoretical and Empirical Comparison of the Temporal Exponential Random Graph Model and the Stochastic Actor-oriented Model. Netw. Sci. 2019, 7, 20–51. [Google Scholar] [CrossRef]
Figure 1. SCO Agricultural Trade Network, 2003.
Sustainability 16 07930 g001
Figure 2. SCO Agricultural Trade Network, 2010.
Sustainability 16 07930 g002
Figure 3. SCO Agricultural Trade Network, 2017.
Sustainability 16 07930 g003
Figure 4. SCO Agricultural Trade Network, 2022.
Sustainability 16 07930 g004
Figure 5. Core-edge diagram of the trade network, 2003.
Sustainability 16 07930 g005
Figure 6. Core-edge diagram of the trade network, 2010.
Sustainability 16 07930 g006
Figure 7. Core-edge diagram of the trade network, 2017.
Sustainability 16 07930 g007
Figure 8. Core-edge diagram of the trade network, 2022.
Sustainability 16 07930 g008
Figure 9. Framework for analyzing the mechanisms of agricultural trade network formation.
Sustainability 16 07930 g009
Figure 10. Goodness of fit test.
Sustainability 16 07930 g010
Table 1. List of SCO countries.
Category of Member StatesCategory Country
List of member statesChina, Kazakhstan, Kyrgyzstan, Russia, Tajikistan, Uzbekistan, India, Pakistan, Iran
Observer statesBelarus, Afghanistan, Mongolia
Dialogue partnersSri Lanka, Turkey, Cambodia, Azerbaijan, Nepal, Armenia, Egypt, Qatar, Saudi Arabia, Kuwait, Maldives,
Myanmar, UAE, Bahrain
Source: Official Website of the SCO, 2023.
Table 2. Structural characteristics of the overall network of agricultural trade in the SCO from 2003 to 2022.
Year20032006200920122015201820202022
Network density0.3150.35170.3950.46670.48670.49330.53170.545
Average clustering coefficient0.4870.5160.5460.5850.6050.6030.630.632
Average path length1.7151.6161.5751.4981.51.4651.4721.439
Reciprocity0.40.42570.42770.5470.62220.60.58710.5797
Table 3. Description of variables from which data are derived.
VariableMeaningDataData Sources
netTrade relationsExport value of agricultural productsUncomtrade database
edgesEdge
mutualReciprocity
gwespMultiple connectivity
stabilityStability
lngdpOverall economic sizeMeasured by gross domestic productWorld Bank database
lnlandAgricultural landAgricultural land area
lnwaterTightness of waterThe proportion of freshwater withdrawals to available freshwater resources
infChinese influenceChina’s agricultural exports as a share of the country’s agricultural GDP
langLinguistic proximity matrix CEPII database
disGeographic distance matrixThe direct distance between the two capitals is 1 if the distance is greater than 3000 km; otherwise, it is 0
boundGeographic neighbor matrixThe value of the nearest neighbor is 1; otherwise it is 0
Table 4. Empirical results of SCO agricultural trade networks.
ItemsModel 1Model 2Model 3Model 4
edges−28.348 ***−23.104 ***−13.803 ***−9.384 ***
(1.320)(1.280)(1.233)(1.581)
mutual 1.694 ***1.336 ***1.036 ***
(0.180)(0.181)(0.199)
gwesp 1.236 ***1.004 ***
(0.105)(0.104)
stability 1.370 ***
(0.063)
edgecov.bound0.697 ***0.525 **0.872 ***0.562 *
(0.193)(0.174)(0.181)(0.243)
edgecov.lang2.596 ***1.999 ***2.122 ***0.783 *
(0.297)(0.266)(0.238)(0.328)
edgecov.dis−0.741 ***−0.575 ***−0.400 ***−0.252
(0.109)(0.101)(0.096)(0.135)
nodeocov.land0.105 ***0.127 ***0.118 ***0.082 **
(0.027)(0.028)(0.024)(0.031)
nodeocov.gdp0.710 ***0.670 ***0.450 ***0.297 ***
(0.045)(0.047)(0.044)(0.055)
nodeocov.inf0.077 ***0.077 ***0.042 ***0.028 *
(0.009)(0.010)(0.009)(0.012)
nodeocov.water−0.041−0.043−0.084 *−0.070
(0.037)(0.039)(0.033)(0.043)
nodeicov.land−0.046−0.071 **−0.035−0.010
(0.025)(0.026)(0.023)(0.033)
nodeicov.gdp0.371 ***0.172 ***−0.051−0.069
(0.041)(0.047)(0.046)(0.059)
nodeicov.inf0.024 *0.001−0.021 *−0.020
(0.010)(0.011)(0.010)(0.014)
nodeicov.water−0.029−0.0020.0140.053
(0.037)(0.038)(0.035)(0.049)
Num. obs.3060306030602754
AIC2671.7922572.8182426.0321642.408
BIC2744.1062681.7632551.7371773.112
Log Likelihood−1323.896−1273.409−1198.016−805.204
*** p < 0.001; ** p < 0.01; * p < 0.05. Standard errors are in parentheses.
Table 5. Robustness test results.
ItemsModel 5Model 6Model 7Model 8Model 9Model 10
edges−30.020 ***−24.907 ***−16.421 ***−13.437 ***−15.08 *−19.21 ***
(1.412)(1.363)(1.411)(2.096) (2.54)
mutual 1.552 ***1.249 ***0.923 ***1.43 *1.69 ***
(0.175)(0.178)(0.227) (0.35)
gwesp 0.842 ***0.917 ***
(0.089)(0.131)
stability 1.890 ***1.48 *
(0.078)
edgecov.bound0.612 **0.483 **0.681 ***0.4180.270.70
(0.195)(0.180)(0.187)(0.292) (0.39)
edgecov.lang2.577 ***2.046 ***1.929 ***0.4110.830.93
(0.286)(0.254)(0.217)(0.371) (0.49)
edgecov.dis−0.877 ***−0.699 ***−0.552 ***−0.294−0.29 *−0.88 ***
(0.113)(0.103)(0.097)(0.176) (0.21)
nodeocov.land0.116 ***0.127 ***0.102 ***0.0510.080.23 ***
(0.028)(0.029)(0.025)(0.039) (0.06)
nodeocov.gdp0.782 ***0.754 ***0.540 ***0.418 ***0.48 *0.47 ***
(0.047)(0.049)(0.047)(0.069) (0.09)
nodeocov.inf0.080 ***0.081 ***0.051 ***0.043 **0.05 *0.11 ***
(0.010)(0.010)(0.009)(0.015) (0.02)
nodeocov.water−0.057−0.057−0.109 **−0.091−0.030.11
(0.039)(0.041)(0.034)(0.054) (0.07)
nodeicov.land−0.018−0.038−0.024−0.003−0.03−0.09
(0.026)(0.026)(0.024)(0.041) (0.05)
nodeicov.gdp0.345 ***0.146 **−0.042−0.0110.060.17
(0.043)(0.049)(0.048)(0.075) (0.09)
nodeicov.inf0.017−0.003−0.019−0.009−0.000.04 *
(0.011)(0.011)(0.011)(0.017) (0.02)
nodeicov.water−0.040−0.0100.0070.0540.05−0.03
(0.038)(0.039)(0.035)(0.060) (0.07)
Num. obs.306030603060275427542754
AIC2567.4282490.7402363.9041234.112 595.99
BIC2639.7422599.6842489.6091364.816 653.15
Log Likelihood−1271.714−1232.370−1166.952−601.056 −284.99
*** p < 0.001; ** p < 0.01; * p < 0.05. Standard errors are in parentheses.
Disclaimer/Publisher’s Note: The statements, opinions and data contained in all publications are solely those of the individual author(s) and contributor(s) and not of MDPI and/or the editor(s). MDPI and/or the editor(s) disclaim responsibility for any injury to people or property resulting from any ideas, methods, instructions or products referred to in the content.

