Abstract
Green technology innovation (GTI) promotes the green, low-carbon transformation of equipment-manufacturing enterprises, helping to achieve sustainable development. Providing financial support for GTI can help alleviate firms’ financing constraints. Based on evolutionary game theory, this study analyzes the effect of financial support on GTI using a sample of listed Chinese equipment-manufacturing companies spanning 2015–2022. The results show that the combined support of financial institutions and the government can support enterprises’ GTI. Furthermore, the strength of financial support and the quality of environmental information disclosure affect firms’ willingness to undertake GTI. The empirical study shows that while credit support and government support positively affect firms’ GTI, equity support has a significant negative effect. Heterogeneity analysis shows that credit and government support can more effectively promote firms’ GTI when there is high-quality environmental information disclosure and intense market competition; equity support, meanwhile, has an inhibiting effect. This study enriches the literature on financial support’s effect on GTI in the equipment-manufacturing industry and can help guide governments and financial institutions to formulate policies and strategies to support firms’ GTI.
1. Introduction
China’s economic development has entered a new normal. The high energy consumption, high resource input, and high pollution emissions of traditional economic growth patterns are no longer viable for sustainable economic development. Yet, resource depletion, environmental degradation, and various related social problems are becoming increasingly serious [1]. While equipment-manufacturing enterprises rely on resource advantages to achieve growth, their high reliance on resources and a single production structure is no longer consistent with the goals of sustainable development. Accordingly, this industry needs to pursue green technology innovation (GTI) to reduce emissions and achieve green transformation.
By combining innovation and green development, GTI can promote the low-carbon transformation of equipment-manufacturing companies and become the fundamental driving force to promote the low-carbon transformation [2,3]. GTI broadly refers to products, technologies, and methods that can help conserve resources, reduce pollution, reduce emissions, and facilitate green development [4,5]. In addition to promoting sustainable development, GTI can improve firms’ value and market competitiveness [6]. However, enthusiasm for GTI is limited by its cost–benefit asymmetry; that is, GTI requires high investment while facing considerable risk. At present, China’s equipment-manufacturing enterprises are unable to scale up the development of GTI due to problems such as declining return on investment, insufficient incentive for external financial capital, and the lack of investment in transformation. If enterprises lack the resources to pursue GTI and are concerned about return on investment, the government and the financial sector need to step in and provide financial support for firms’ GTI [7].
In light of the above, there is a need to investigate financial support’s effect on firms’ GTI and how costs and benefits affect participants’ strategic choices. This study specifically focuses on equipment-manufacturing enterprises in China. Considering the different value orientations and behavioral choices of stakeholders, this study constructs a three-party evolutionary game model comprising equipment-manufacturing enterprises, financial institutions, and the government under limited rationality [8]. In this way, this research explores the combined role of financial institutions and the government in supporting firms’ GTI, as well as the interaction mechanism of the three parties, and further verifies the relevant conclusions through empirical analysis. The findings can help the government and financial institutions to better serve equipment-manufacturing enterprises and promote GTI, which is of great practical significance for realizing high-quality development and sustainable development of the economy.
2. Literature Review
2.1. Effect of Market-Oriented Financial Support on GTI
Financial support refers to the role of finance in the real economy and its influence on industrial development [9]. This study categorizes financial support into market-oriented financial support (financial institutions) and policy-oriented financial support (government). Market-based financial support is further divided into credit market financial support and capital market financial support [10].
There are two main types of research on financial support and enterprise GTI: macro-level analyses of the effect of financial development levels on enterprise GTI and micro-level analyses of the effect of different sources of financial support (e.g., bank credit and equity financing) on firms’ GTI.
Increased levels of financial development can promote technological progress and stimulate economic growth [11,12]. An active financial market can provide enterprises with more financing opportunities and lower financing costs to support their innovation [13].
Giebel and Kraft (2018) noted that financial institutions can encourage enterprises to carry out innovation by providing various types of financial support, such as credit loans and venture capital [14]. Focusing on the effect of support from financial institutions on firms’ GTI, D’Orazio (2019) found that such support promotes and helps diffuse GTI [15]. Examining the BRICS countries, Chen (2024) found a significant positive relationship between equity financing and GTI [16]. Others, however, have suggested that financial support is not conducive to enterprise innovation. The more financial support a firm receives, the more it indirectly reflects the firm’s financial constraints. Since innovation capital is limited, firms might prioritize the use of their limited funds for business management, squeezing out funds that would otherwise be used for technological innovation [17]. Acharya and Xu (2017) found that owing to short-term risks, equity financing might discourage innovation in firms with low external capital needs [18].
2.2. Effect of Policy-Oriented Financial Support on GTI
Given the incompleteness of the capital market, many companies face difficulties obtaining capital support [19]. In this regard, government subsidies can incentivize firms’ GTI. Several studies have investigated the effect of government incentive policies on firms’ GTI. Shao and Chen (2022) studied and compared how different types of government subsidies affect firms’ GTI [20]. Exploring the relationship between government subsidies, environmental regulation, and GTI, Liu (2020) found that while government subsidies can provide the necessary financial support for GTI, environmental regulations have a threshold effect on GTI [21].
Nevertheless, there are inconsistent findings regarding the effect of policy-oriented financial support on GTI. Some suggest that government support can promote GTI by reducing innovation costs and alleviating financing constraints. Wang (2021) found that government subsidies can reduce the risks and costs of R&D, prompting firms to expand their GTI output [22]. Han (2023) found that government subsidies can positively affect corporate GTI by reducing financing constraints and increasing R&D willingness and resource allocation efficiency [23]. Meanwhile, owing to information asymmetry between governments and enterprises, it is usually difficult for governments to effectively supervise subsidies, which could have a negative effect on GTI. The opacity of the subsidy distribution process and the lack of supervision can lead to rent-seeking behavior, which can crowd out firms’ investment in innovation [24]. Studies have also found that government subsidies and enterprise GTI have an inverted U-shaped relationship, and there is an optimal value of government subsidies for the promotion of firms’ GTI [25].
Policy-oriented financial support can guide and regulate the development of market-oriented financial support. Government subsidies send positive signals to the market, increasing the likelihood that firms will obtain funds from financial institutions or external investors [26,27].
2.3. Evolutionary Game Theory
Recently, researchers have started to apply evolutionary game theory to areas such as technological innovation and green development. Using a game model comprising enterprises, banks, and governments, Li (2018) explored the effect of green loans on firms’ GTI, finding that it can improve firms’ willingness to pursue GTI [28]. Silva (2019), meanwhile, used an evolutionary game model comprising enterprises and the government to investigate policy regulation and firms’ environmental compliance [29]. Chen (2021) explored the internal and external influences of GTI using an evolutionary game model involving manufacturing enterprises and the government [30]. Shi (2022) used evolutionary game theory to analyze the effect of different types of environmental regulations on firms’ GTI and found that market incentive-based regulation was the most effective [31]. Liu (2024) constructed a three-party evolutionary game model comprising the government, enterprises, and the public, focusing on subsidies and taxes to explore the suitable path for addressing the problem of carbon emissions [32].
In summary, while most studies consider financial support in terms of macro-level financial development, relatively few have explored the path of technological innovation in terms of micro-level subjects. Such an approach could further define the scope of financial support at the micro level and explore the effects of different types of financial support on enterprises’ GTI in terms of fund supply and risk diversification. Regarding methods, studies have mainly used structural equation modeling, difference-in-differences, or data envelopment analysis to explore the relationship between financial support and GTI. Relatively few, however, have used evolutionary game methods. In the studies that do use evolutionary games, most start from the perspective of the game between enterprises and the government, the game between enterprises and the public, and a tripartite game involving all three. These studies also tend to ignore the role of financial institutions in the GTI system. This study, therefore, considers the financial support provided by financial institutions and the government, taking the two as independent game participants, and constructs a tripartite evolutionary game model comprising equipment-manufacturing enterprises, financial institutions, and the government. It then analyzes the behavioral strategy selection of each game subject and the evolutionary stabilization strategy under different initial states. Subsequently, the effect of different financial support paths on firms’ GTI is further analyzed through empirical tests.
3. Evolutionary Game Model Construction
3.1. Basic Model Assumptions
In the system of financial support and GTI, the three main affected parties are equipment-manufacturing enterprises, financial institutions, and the government [33]. The GTI of Chinese equipment-manufacturing enterprises is still in the growth stage, the degree of capital financing is low, and financial support remains an important way for equipment-manufacturing enterprises to overcome financing constraints. Support from financial institutions and the government provides new development opportunities for the GTI of equipment-manufacturing enterprises [34]. The government usually assumes the role of policy-oriented financial support provider, and financial institutions provide market-oriented financial support. Therefore, the game subjects are set as equipment-manufacturing enterprises, financial institutions, and the government. Figure 1 shows the relationship between each game party.
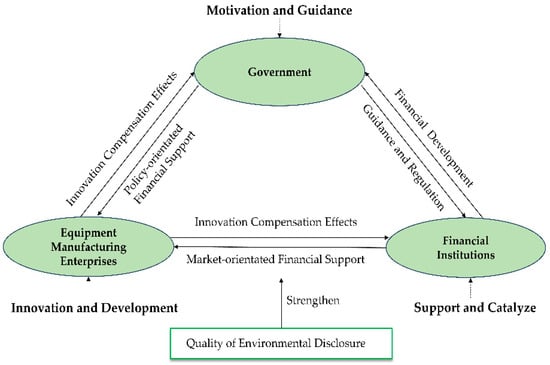
Figure 1.
Relationship between game parties.
The basic assumptions of the parameters proposed in this paper, considering the studies conducted by Li and Gao (2022), Liu et al. (2023), and Gao et al. (2024), are as follows [35,36,37].
Assumption 1.
The strategy set of enterprises = {GTI, no GTI}; the strategy set of financial institutions = {financial support, no financial support}; the strategy set of the government = {government support, no government support}.
Assumption 2.
The probability of equipment-manufacturing enterprises choosing “GTI” is x (0 ≤ x ≤ 1). Then, the probability of choosing “no GTI” is 1 − x. The probability of financial institutions choosing “financial support” is y (0 ≤ y ≤ 1), and the probability of choosing “no financial support” is 1 − y. The probability that the government chooses “government support” is z (0 ≤ z ≤ 1), and the probability that it chooses “no government support” is 1 − z.
Assumption 3.
On the enterprise side, if the enterprise chooses “no GTI,” revenue from traditional technology production is R, and its corresponding production cost is Ce1. When the enterprise chooses the “GTI” strategy, it needs to increase R&D investment and introduce low-carbon equipment, operations, and maintenance to increase inputs. Its corresponding low-carbon innovation input cost is P, and it is mainly derived from the financial institution’s loan. At this time, it directly brings down the enterprise’s energy cost, and the product attributes are changed from traditional high-carbon products to low-carbon products, which leads to an increase in the enterprise’s overall income, ∆R. GTI improves the enterprise’s market competitiveness, recognition, and popularity in the supply chain system, as well as its adaptive capacity, innovation ability, and other spillover effects, H.
Assumption 4.
If financial institutions adopt the strategy of “no financial support” and only provide conventional financial services for enterprises, their gain is I. Financial institutions that carry out financial support can provide a lower interest rate level for credit support and can combine financial elements to form bonds, funds, and other diversified financial instruments to alleviate financing constraints for firms’ GTI. It is assumed that financial institutions providing financial support have incremental benefits, ∆I. The provision of financial support by financial institutions will generate additional business costs Cf, such as the R&D input costs of financial instruments and the construction of risk control systems. The financial cost of the financial institutions reflects the differing strength of the support [38]. When financial institutions adopt the strategy of “no financial support,” the lack of financial products and services leads to firms relying only on their own funds or seeking other financing channels, such as nonfinancial institutions. At this time, the financial cost of the enterprise is M1. When financial institutions carry out “financial support,” enterprises can obtain more favorable low-cost financing from financial institutions; at this time, the enterprise’s financial cost is M2.
Assumption 5.
Regardless of whether the government sector provides support, there is a basic government gain W. It is assumed that the provision of government support requires additional regulatory costs Cg in terms of human, material, and financial resources, including the formulation of financial and environmental policies and regulations, the construction of a financial regulatory system, and a GTI system. If the government chooses to provide support, it receives the incremental benefit ∆W of increased support. At this time, government support will obtain external benefits S, such as the improvement of the financial system, the improvement of environmental benefits, and the enhancement of social credibility and government image [39]. If the government chooses not to provide support, it will not obtain any additional gains.
Assumption 6.
According to Wang et al. (2021) and Eghbali et al. (2022), a dynamic reward and punishment system is an important factor for enterprises to adopt GTI [40,41]. α is the coefficient of technological innovation support, which measures the support of government departments for enterprises in carrying out innovation [42]. When firms carry out GTI, they receive innovation incentive subsidies αA. β is the coefficient of financial support; when financial institutions choose to provide support, they will receive innovation risk compensation αB. σ is the regulatory penalty coefficient, measuring government penalties for enterprises and financial institutions [43]. When the government provides support but a firm does not carry out GTI and still uses traditional high-carbon production methods, the government will penalize it; assume the amount of punishment is σF. At the same time, the government will increase investment in environmental governance costs and other externality costs E. If financial institutions do not follow policy regulations in the processes of credit preapproval, credit, and post-credit management, the government will penalize them; the penalty amount is assumed to be σZ.
Assumption 7.
If enterprises want financial support from financial institutions, they need to cooperate with them and undergo compliance reviews. Environmental information disclosure is an important part of the evaluation system for green financing projects. Assuming that the quality coefficient of enterprise environmental information disclosure is θ, if the level of enterprise environmental information disclosure is higher, it indicates that it has more willingness and ability to pay attention to the enterprise’s capital market performance and brand image. This alleviates information asymmetry between the enterprise and financial institutions to a certain extent, thus helping the enterprise obtain credit support and reducing its financing costs [44]. At this time, the financial cost of enterprises when financial institutions provide financial support is (1 − θ) M2.
Based on the model assumptions, the definition and description of the parameters are shown in Table 1.

Table 1.
Parameter symbols and descriptions.
3.2. Income Matrix
Based on the model assumptions and parameter settings, the mixed strategy matrix of enterprises, financial institutions, and the government is constructed, as shown in Table 2.
Table 2.
Income matrix of enterprises, financial institutions, and government.
Combined with the income matrix in Table 2, the replication dynamic equations of different subjects are calculated:
- (1)
- Assuming that the expected return of enterprises choosing “GTI” is Ue1, the expected return of enterprises choosing “no GTI” is , and the average return of an enterprise is , thenThe equation for the replication dynamics of the enterprise is
- (2)
- Assuming the expected return for financial institutions choosing “financial support” is Uf1, , the expected return for financial institutions choosing “no financial support” is , and the average return for financial institutions is , thenThe equation for the replication dynamics of financial institutions is
- (3)
- Assuming that the government’s expected return from choosing “government support” is Ug1, the government’s expected return from choosing “no government support” is , and the government’s average return is , thenThe equation for the replication dynamics of the government is
4. Analysis of Evolutionarily Stable Strategy
4.1. Stability Analysis of Equipment-Manufacturing Enterprises
When , we can obtain x = 0, x= 1, , and the derived function of is as follows:
According to the evolutionary stabilization strategy and , a case-by-case discussion is needed:
- (1)
- When , F(0) is constant and equal to 0, which indicates that the current strategy selection is in a steady state and strategy selection will not continue to evolve.
- (2)
- When , it is covered by the following two scenarios:
If , it is found that and ; at this time x = 1 is an ESS. As time goes by, enterprises will eventually choose the “GTI” strategy.
If , and ; at this time, x = 0 is an ESS. As time goes by, enterprises will ultimately choose the “no GTI” strategy. The dynamic evolution of decision-making of equipment-manufacturing firms is shown in Figure 2.
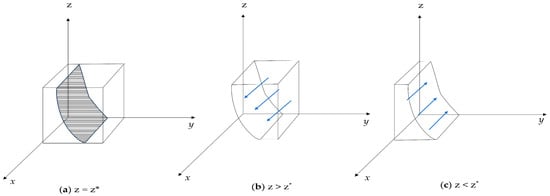
Figure 2.
Dynamic phase diagram of equipment-manufacturing enterprises.
Based on the above analysis, the following propositions can be derived:
Proposition 1.
The financial cost M2 borne by enterprises inversely affects the selection tendency of green innovation of equipment-manufacturing enterprises. The smaller M2 is, the greater the tendency of enterprises to select GTI.
Proof of Proposition 1.
, and M2 have a negative correlation. Therefore, with the increase of M2, , the final enterprise strategy will be formed x = 0. The enterprise’s strategy is not to carry out GTI. □
It can be concluded that the greater the financial support provided by financial institutions, the more enterprises will tend to choose GTI. Huang (2019) calculated the threshold value of the enterprise-acceptable green loan interest rate through the evolutionary game model, proving the effectiveness of bank credit as a way to support GTI [45].
Proposition 2.
As the coefficient α of the government’s green innovation input increases, firms will increase their investment in R&D in technology and thus choose green technology innovation strategies.
Proof of Proposition 2.
, increases as α increases. Therefore, when α rises, at this time , the stabilization point converges to x = 1. □
It can be seen that the greater the government support, the more enterprises will tend to choose GTI. This finding is consistent with the findings of Wu et al. (2022) and Li et al. (2022) [46,47].
Proposition 3.
The quality coefficient of corporate environmental information disclosure θ, positively affects the selection tendency of green technology of equipment-manufacturing enterprises.
Proof of Proposition 3.
, increases as θ increases. Therefore, when θ rises, at this time , the stabilization point converges to x = 1. □
The larger the θ, the greater the tendency of enterprises to select GTI. The reason for this is that the financial institutions’ interest rate setting will be affected by the enterprise’s environmental information disclosure, which can create a good image for the enterprise. In this way, it reduces the risk of loans from financial institutions, prompting banks and other financial institutions to offer lower interest rates and enhance the level of financial support received by enterprises themselves [48].
4.2. Stability Analysis of Financial Institutions
When , we can obtain , , and , and the derived function of is as follows:
Based on the evolutionary stabilization strategy and , a case-by-case discussion is needed:
- (1)
- When , is constant and equal to 0, which indicates that the current strategy selection is in a steady state and the strategy selection will not continue to evolve.
- (2)
- When , it can be considered by the following two scenarios:
If , it is found that and ; at this time, y = 1 is an ESS. As time goes by, financial institutions will ultimately choose the “financial support” strategy.
If , it is found that and ; at this time y = 0 is an ESS. As time goes by, financial institutions will ultimately choose the “no financial support” strategy. The evolutionary approach of behavioral choices of financial institutions is shown in Figure 3.

Figure 3.
Dynamic phase diagram of financial institutions.
4.3. Stability Analysis of Government
When , we can obtain , , and . The derived function of is as follows:
According to the evolutionary stabilization strategy and , a case-by-case discussion is needed:
- (1)
- When , is constant and equal to 0, which indicates that the current strategy selection is in a steady state and strategy selection will not continue to evolve.
- (2)
- When , it is considered by the following two scenarios:
If , it is found that and ; at this time, is an ESS. The government will eventually adopt the “no government support” strategy.
If , and ; at this time, is an ESS. The government will eventually adopt the “government support” strategy. The dynamic evolution of decision-making of government is shown in Figure 4.
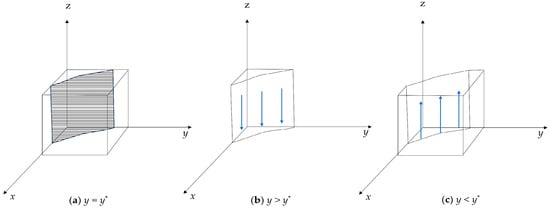
Figure 4.
Dynamic phase diagram of government.
4.4. Stability Analysis of Three-Party Evolutionary Game Systems
From the preceding analysis, we can observe that the system of replication dynamics between enterprises, financial institutions, and the government is constituted by the following Equations (4), (8) and (12).
The equilibrium points of the system are E1 (0,0,0), E2 (0,0,1), E3 (0,1,0), E4 (0,1,1), E5 (1,0,0), E6 (1,0,1), E7 (1,1,0), and E8 (1,1,1) from Equation (13). The stability analysis of the eight replicated dynamic system equilibrium points described above is carried out by constructing the Jacobi matrix, which is as follows:
The stability analysis of the eight pure-strategy equilibria of the evolving system is carried out according to Lyapunov’s first method; Table 3 shows the results.
Table 3.
Equilibrium point stability analysis.
Based on the GTI status of equipment-manufacturing enterprises and the support of financial institutions and governmental parties, four types of evolutionary stabilization strategies can be discerned. The stabilization points E1 (0,0,0), E2 (0,0,1), E3 (0,1,0), and E4 (0,1,1), where enterprises do not engage in GTI, are categorized as the original state. The stabilization strategy E5 (1,0,0) for enterprises to carry out GTI independently without support from other parties is called the GTI pattern without support. The two stabilization strategies E6 (1,0,1) and E7 (1,1,0), provided by financial institutions or the government unilaterally to support firms’ GTI, are categorized as the unilateral support pattern for the GTI of enterprises. Stabilization strategy E8 (1,1,1), in which financial institutions and the government jointly support enterprise GTI, is categorized as a model of combined efforts to support enterprise GTI.
The strategy that best suits the needs of equipment-manufacturing enterprises is E8 (1,1,1), which is the combined support for innovation pattern, while the relatively favorable strategy choices are E6 (1,0,1) and E7 (1,1,0), which reflect the unilateral support for innovation pattern. Under the pattern of combined support for innovation, the support of financial institutions and the government can help enterprises alleviate financial pressure and promote GTI to eliminate backward production and achieve green, low-carbon transformation and upgrading, which is conducive to sustainable economic development. Financial institutions are also able to innovate financial products and services in the process of providing financial support, better use financial services for the real economy, and promote the flourishing development of finance. The government can improve the social and ecological environment and enhance social credibility via the GTI synergy between financial institutions and enterprises. These eight evolutionary stabilization strategies might all occur in a real situation, but a benign financial support system can be formed under the combined support innovation pattern, which has the highest comprehensive benefits, maximizes social value, and is the ideal state of financial support for GTI.
In conclusion, this part gives the theoretical evidence that financial support affects enterprises’ GTI based on the three-party group evolution game and provides a micro-theoretical foundation for subsequent empirical tests based on the Chinese background. Under the financial support formed by the combined efforts of the “two main bodies”, the equipment-manufacturing enterprises will optimize the allocation of resources, strengthen the capital investment in green technological innovation, and carry out green project investment so as to realize green innovation.
5. Empirical Analysis
Previously, the evolutionary game model has analyzed the role of financial institutions and government involvement in the evolution of the GTI system of enterprises. Financial support, government support, and environmental information disclosure quality are the key factors affecting green technology innovation. Therefore, based on the analysis of the evolutionary game theory, this paper takes Proposition 1, Proposition 2, and Proposition 3 proposed by the evolutionary game as the hypotheses to be verified and continues to further explore the impact of financial support on the green technological innovation of the equipment-manufacturing enterprises through empirical analysis using the existing data.
5.1. Hypothesis
5.1.1. Credit Market Financial Support and GTI
Based on Proposition 1, the credit support provided by financial institutions can play the roles of capital compensation, risk sharing, and supplemental supervision. First, the credit support of financial institutions is more flexible than government support and can provide basic support and alleviate financing constraints for GTI [49]. Second, financial institutions can diversify the risk of enterprise GTI projects and realize risk transfer. Finally, financial institutions provide credit services to equipment-manufacturing enterprises, and in the follow-up, management can effectively supervise the enterprise’s use of funds for technological innovation, thus supplementing the insufficient supervision of policy-oriented financial support. Hypothesis 1 is as follows:
Hypothesis 1 (H1):
Credit support has a positive effect on the GTI of equipment-manufacturing enterprises.
5.1.2. Capital Market Financial Support and GTI
Capital market financial support is an important complement to market-oriented financial support, which is mainly supported by equity financing in the capital market for Chinese equipment-manufacturing enterprises. First, equity support can effectively increase the amount of capital held by enterprises, but it might produce the phenomenon of overfinancing, leading to the inefficient use of enterprise capital. Second, based on the principal–agent relationship, management decides how to use the firm’s capital, and there might be a moral hazard and adverse selection, causing the capital from equity financing to not be fully invested in GTI. Finally, the total volume of China’s capital market is small and immature, and short-term speculative behavior and the “herd effect” are common, hindering the ability to form innovative capital. The special nature of enterprise R&D activities reduces the willingness of enterprises to disclose information, resulting in investors having insufficient information to identify the advantages and disadvantages of innovation projects. This information asymmetry causes enterprises to be reluctant to increase innovation investment after increases in equity financing [50]. This leads to enterprise innovation lacking sufficient equity capital support, causing equity support for firms’ GTI to have an inhibitory effect.
Hypothesis 2 (H2):
Equity support has a disincentivizing effect on GTI in equipment-manufacturing enterprises.
5.1.3. Policy-Oriented Financial Support and GTI
Based on Proposition 2, Government support plays its role in GTI mainly through the supplementary role of funds, the capital guidance function, and the information transmission mechanism. First, compared with the credit support provided by financial institutions, direct government support covers a wide range of subsidies, although the scale of funds is obviously insufficient. This type of gratuitous support can provide innovation resources, reduce the cost of enterprise GTI, and spread risk [51]. Second, the government can encourage and guide financial institutions to provide financial support to equipment-manufacturing enterprises by formulating preferential policies, guiding the flow of capital into the real economy, and providing capital guidance. Finally, government support can be regarded as a kind of “endorsement” of equipment-manufacturing enterprises, which can transmit positive signals. Thus, Hypothesis 3 is as follows:
Hypothesis 3 (H3):
Government support has a positive effect on the GTI of equipment-manufacturing enterprises.
5.1.4. Effect of Environmental Information Disclosure
Environmental information disclosure can reduce information asymmetry between enterprises and the external world, which can help enterprises obtain support from financial institutions and the government, thus supporting firms’ GTI. However, regarding equity support, Richardson (2001) empirically tested the relationship between environmental information disclosure and the cost of equity financing, finding that increased environmental information disclosure increases the cost of equity financing [52]. Kumar (2017) considered that environmental information disclosure might bring carbon risk exposure, resulting in higher costs for equity financing [53]. Therefore, hypotheses H4a, H4b and H4c are proposed based on Proposition 3 and considering that environmental information disclosure may increase the cost of equity financing for enterprises, which is unfavorable for using equity financing for GTI.
Hypothesis 4a (H4a):
The quality of environmental information disclosure can strengthen the promotion effect of credit support on GTI.
Hypothesis 4b (H4b):
The quality of environmental information disclosure can strengthen the role of government support in promoting GTI.
Hypothesis 4c (H4c):
The quality of environmental information disclosure can strengthen the inhibitory effect of equity support on GTI.
5.2. Variable Selection and Model Construction
5.2.1. Sample Selection and Data Sources
This study takes listed Chinese equipment-manufacturing enterprises spanning 2015–2022 as the initial sample. Sample selection is based on the following two criteria: (1) Based on the industry classification standards of the China Securities Regulatory Commission (2012), eight major industry categories covered by the equipment-manufacturing industry are selected. (2) Shanghai- and Shenzhen-listed A-share companies are selected as the sample. The firms’ financial data mainly come from the CSMAR database; patent data mainly come from the CNRDS database.
5.2.2. Variable Selection
- (1)
- The explained variable in this study is green technology innovation (GTI). Previous studies divide the indicators of technological innovation into two categories: input indicators and output indicators. Innovation input indicators are generally selected as innovation inputs, R&D personnel ratio, and R&D expenditure ratio, and innovation output indicators are generally selected as the number of patents [54,55]. Compared with input indicators, innovation output is more representative of an enterprise’s real GTI results and reduces the subjective influence of enterprise managers’ innovation decisions. Therefore, this study uses the number of green patent applications independently filed by the sample firms in a given year plus one and takes the logarithm as a proxy variable for GTI [56,57]. The effect of time lag is taken into account. The larger the number of green patent applications, the higher the level of GTI.
- (2)
- The explanatory variable in this study is financial support, and the specific financial support paths are as follows. (1) Credit market financial support (Credit): Referring to Chen (2019), the bank credit obtained by firms is used as a measure, and the natural logarithm of the sum of long- and short-term borrowing is used to represent credit support [58]. (2) Capital market financial support (Stock): Capital market transactions mainly include the issuance of stocks, bonds, and funds, but the issuance of bonds and funds in China’s equipment-manufacturing industry is relatively small and is mainly based on equity support. Therefore, this study uses the natural logarithm of equity and capital surplus to measure equity support. (3) Policy-oriented financial support (Gov): Government support includes financial grants and interest subsidies, as well as preferential policies such as tax rebates. This study takes the total amount of government subsidies received by a firm as a proxy variable for policy-oriented financial support.
- (3)
- The following firm-level control variables are selected: Firm size (Size): The natural logarithm of the firm’s total assets is used to represent firm size; larger firms are more likely to realize economies of scale and gain financing advantages [59]. Combining return on total assets (ROA) with the gearing ratio (Lev), a good level of profitability, and appropriate capital structure are important factors for GTI [60]. Tobin’s Q (TobinQ) is used to measure the relative value of enterprises. The cash–asset ratio (Cash) is chosen to measure the cash held by the enterprise. Firms can ensure capital investment in innovation projects by improving their cash–asset ratio. This study uses the growth rate of operating income to represent the growth of the enterprise (Growth), which is a strong indicator of the transformation of the enterprise’s technological innovation results. Table 4 presents the descriptive statistics of all variables.
Table 4. Descriptive statistics of the variables.
5.2.3. Econometric Model
The following two-way fixed-effects model is constructed based on the hypotheses:
Considering the cross-effects of various types of financial support in real situations, Model (17) reflects the effect of various financial support variables on the GTI of equipment-manufacturing enterprises under the simultaneous effect of the relationship:
and represent individual fixed effects and time-fixed effects, respectively; is the error term, i stands for equipment-manufacturing enterprises, and t stands for time.
5.3. Empirical Test and Results
5.3.1. General Regression Analysis
As shown in Table 5, Model (1) tests the effect of credit support on enterprises’ GTI. Credit support and GTI have a significant positive correlation at the 5% level, indicating that credit support provided by banks and other financial institutions can alleviate financing constraints, diversify innovation risks, and promote the improvement of enterprise GTI. H1 is confirmed.
Table 5.
Regression results of financial support on GTI.
Model (2) tests the effect of equity support on enterprise GTI. The regression results show that the capital market’s financial support has a significant negative relationship with firms’ GTI, indicating that equity financing from the capital market inhibits GTI. These results confirm H2.
Model (3) reflects the effect of policy-oriented financial support on enterprises’ GTI. The coefficient of government support on enterprise GTI is significantly positive at the 5% level. As an external promoter of enterprise GTI, the stronger the government support for enterprises, the greater the willingness of enterprises to carry out GTI. This can, to a certain extent, alleviate the risks and adjustments of enterprises facing innovation problems. Its unique signaling effect can prompt other subjects in the market to inject funds into the enterprise, alleviate the enterprise’s external financing pressure, and support GTI. H3 is verified.
Model (4) considers the combined effect of credit support, equity support, and government support on enterprises’ GTI. Its regression results are consistent with the previous analysis.
5.3.2. Robustness Test
To test the reliability of the empirical results, the following methods are selected for robustness testing.
First, change the explanatory variables. In the first column of Table 6, the measure of GTI is replaced by selecting the number of green invention patent applications independently filed by sample firms in a given year plus one; the logarithm of the number of green invention patents filed is taken as a proxy variable [61]. The re-regression is consistent with the previous results.
Table 6.
Robustness test results.
Second, adjust the sample time range. To exclude the noise interference of non-routine major macro public events, this study excludes the observed data of 2020 and 2021 and then re-regresses them. The regression results of Model (2) are consistent with the basic regression and pass the robustness test.
Third, adjust the estimation method. Construct a dummy variable for GTI, which is 1 if the enterprise carries out GTI and 0 otherwise; replace the logit model for regression. Since there could be a large number of 0 values for the explanatory variable GTI, and there might be a left-truncated feature at the 0 point, the Tobit model is used again for regression. From the regression results of the different models, the significance of credit support, equity support, and government support remains consistent with the previous findings, indicating that the results have a certain degree of robustness.
5.3.3. Endogeneity Test
Endogeneity problems can lead to biased model estimates. Considering the possible reverse causality between credit support, government support, and enterprises’ GTI, to enhance the robustness of the results, the instrumental variable (IV) method is used for endogeneity testing.
Drawing on Lewbel [62], this study selects the third power of the difference between the mean of credit market financial support and credit market financial support as the IV. . Meanwhile, this study selects a one-period lag of government support for the IV test.
The results of two-stage least-squares regression show that in the first-stage regression, the coefficient of the influence of IVs on financial support in the credit market is significant at the 1% level, which is a positive correlation, and the F value is greater than 10, which meets the correlation requirements between IVs and endogenous variables. From the second-stage regression, the replaced credit market financial support has the same significant positive effect on GTI, and the IV passes the unidentifiable test and the weak IV test, demonstrating that the selected IV is effective and that the results of the benchmark regression are robust and reliable. Government support similarly passes the endogeneity test (see Table 7).
Table 7.
Endogeneity test results.
5.4. Further Analysis: Heterogeneity Test
5.4.1. Heterogeneity of Environmental Disclosure
The higher the quality of environmental information disclosure, the greater the promotion of enterprise GTI [63]. Drawing on Kim and Verrecchia [64], the KV index is calculated to measure the quality of environmental information disclosure. The median is used as a threshold variable to divide the group into high-quality environmental disclosure and low-quality environmental disclosure; Table 8 shows the results.
Table 8.
Heterogeneity test based on the quality of environmental information disclosure.
The effects of credit and government support on the GTI of firms with high-quality environmental information levels are significant at the 5% level and 1% level, respectively. We can see that environmental information disclosure effectively reduces information asymmetry between enterprises and financial institutions and the government, facilitates recognizing the real situation of enterprises, and reduces the additional risk premium of financial institutions in providing financial support. At the same time, it enhances the identifiability of the enterprise itself, which helps firms obtain subsidy support and improves their GTI through its unique signaling effect and resource supply attribute. Environmental information disclosure can effectively alleviate the financing constraints faced by enterprises. H4a and H4c are supported. The coefficient of the effect of high-quality environmental disclosure on enterprise equity support is significantly negatively correlated, which is consistent with the results of the base regression. High-quality environmental information disclosure might amplify its own risk, making the risk premium demanded by investors higher. The cost of equity capital rises, which is not conducive to enterprises’ GTI. We can see that the quality of environmental information disclosure significantly strengthens the inhibitory effect of capital market financial support on enterprises’ GTI. H4b is supported.
5.4.2. Heterogeneity in Market Competition Intensity
When an enterprise is in a highly competitive market, the fierce competition will increase the elimination pressure faced by enterprises. Thus, firms will pay more attention to enhancing their innovation ability and more urgently carry out GTI to obtain core competitiveness. To explore the effect of market competition intensity on financial support for enterprises’ GTI, the Herfindahl–Hirschman Index (HHI) is selected to reflect the market competition intensity faced by enterprises [65]. Using its median as the threshold variable, the research sample is divided into a strong market competition group and a weak market competition group.
As shown in Table 9, credit support and government support have a significant positive effect on enterprises with strong market competition, indicating that the intensity of market competition can positively regulate the promotion effect of credit support and government support on GTI. Compared with firms under weak market competition, those under strongly competitive conditions can more effectively use financial institutions and the government for financial support and pursue GTI to achieve green transformation to cope with competition. Equity support is significant at the 5% confidence level, consistent with the basic regression structure. High-intensity market competition can reduce external regulatory costs and information asymmetry, while capital market investors also have more opportunities to grasp the potential risks faced by enterprises. This suggests that the intensity of external market competition significantly strengthens the inhibitory effect of equity support.
Table 9.
Heterogeneity test based on the intensity of competition in the market
6. Discussion
6.1. Discussion of Evolutionary Game Analysis
This paper constructs a three-party evolutionary game model of equipment-manufacturing enterprises, financial institutions, and the government. By analyzing the stability of each subject and the system of replicated dynamic equations, the article explores the key influencing factors and role mechanisms of GTI of equipment-manufacturing enterprises, puts forward relevant propositions, and discusses the optimal mode of financial support acting on GTI, which can be found:
- (1)
- In the evolutionary system of financial support for the GTI of equipment-manufacturing enterprises, the three groups—equipment-manufacturing enterprises, financial institutions, and the government—can reach a stable evolutionary state in the three-way evolutionary game, and the strategic choice of each game subject will change with the behavioral, strategic choice of the other two subjects.
- (2)
- Financial support and government support can positively affect the willingness of equipment-manufacturing enterprises to carry out GTI. Lower financial costs or higher government subsidies represent stronger support from financial institutions and the government. If enterprises can obtain the support, enterprises can offset the innovation costs with the additional benefits of GTI, and then they will be more active in green technology innovation. At this time, market-oriented financial support and policy-oriented support can effectively release the incentive effect of innovation revenue, forcing equipment-manufacturing enterprises to accelerate technology research and development or the production of green and low-carbon products and then promote the green transformation of enterprises.
- (3)
- The quality of environmental information disclosure plays a reinforcing role in the process of financial support for enterprises’ GTI. Environmental information disclosure does not directly affect green technological innovation but uses its market signals to guide enterprises to standardize their own behavior, enhance the attractiveness of enterprises to external investors, and help enterprises obtain financial support to promote technological innovation. Improving the quality of environmental information disclosure can help enterprises gain a proactive advantage in market competition and promote green technological innovation.
- (4)
- In the whole evolutionary system, four evolutionary patterns can be summarized: original state, no support for innovation, unilateral support, and combined support. Under the model of joint support for enterprises’ GTI, financial institutions provide market-oriented financial support, and the government provides policy-oriented financial support. The two are synchronized and coupled to promote GTI, in which the government’s support can play the role of macro-level regulation and control, and the enterprises and financial institutions reach a stable synergy state, jointly influenced by the government, thus forming a virtuous circle with the greatest social value. E8 (1,1,1) is the ideal state in this study, and its corresponding evolutionary strategies are “GTI,” “financial support,” and “government support.” The effect of financial support on GTI can be realized through the path of the combination of market-oriented financial support and policy-oriented financial support.
6.2. Discussion of Empirical Analysis
The analysis of the evolutionary game model provides a theoretical foundation. Based on the panel data of listed companies in China’s equipment-manufacturing industry, this paper further empirically analyzes the impact of various types of financial support paths on the role of green technological innovation and mainly discusses the following:
- (1)
- Credit support has a significant role in promoting green technological innovation in the equipment-manufacturing industry. Green technological innovation requires continuous capital injection, and there is a high demand for capital in both the start-up stage of innovation activities and the transformation stage of achievements. And the capital deposit will affect the willingness of enterprises to carry out green technological innovation. The theoretical analysis in the evolutionary game provides us with the theoretical basis for this conclusion. The conclusion is further verified by the actual data of Chinese equipment-manufacturing enterprises that credit support can play a positive guiding role in green technology innovation. Adequate financial support, such as bank funds, can effectively alleviate the financing constraints of green technological innovation by directly increasing the capital stock of enterprises and improving the information asymmetry problem of enterprises in the R&D process, thus promoting green technological innovation. This result was also confirmed by Lu et al. (2022) and Fang (2024) [66,67].
- (2)
- Government support has a significant role in promoting GTI in the equipment-manufacturing industry. Evolutionary game theory analysis and empirical findings coincide with the views of these scholars, such as Li et al. (2019). and Li et al. (2021) [68,69]. The support provided by the government has the attributes of both signals and resources, which is crucial for GTI. The empirical test found that government subsidies can alleviate the financial pressure on enterprises, diversify the risk of enterprises to carry out innovative activities and improve the level of GTI. The reasons for this are the following two aspects. First, under the resource attribute, the capital increment provided by government subsidies to enterprises is characterized by gratuitousness and directness, which can compensate for the loss of technological innovation failure to a certain extent, thus promoting the willingness of enterprises to bear the high risk of GTI activities. Second, under the signal attribute, government subsidy play can send signals to external capital markets about the specific technological advantages and low-carbon advantages of enterprises. This signal can enhance the financial institutions’ external capital market investors for the enterprise’s investment information, enhance the enterprise’s financing ability, and also improve the level of financial support that enterprises can obtain, helping equipment-manufacturing enterprises for green innovation.
- (3)
- Equity support has a disincentive effect on GTI in the equipment-manufacturing industry. The reasons could be that, first, equity financing is cheaper and finances a larger amount of capital than debt financing. When an enterprise obtains a large amount of funds, how to use the funds becomes a key issue. There could be a failure to invest equity-backed funds in GTI projects, leading to redundancy and a decline in the utilization rate of funds. Second, technological innovation activities are characterized by high investment and high risk. The information asymmetry between investors and enterprises on technological innovation issues and the unequal status between investors and enterprises can lead to adverse selection and moral hazard problems. When managers believe the current business environment is not good, in consideration of personal reputation, they will shift funds from R&D and innovation projects with high uncertainty to financial projects with less risk, reducing the possibility of investment failure [70,71]. Finally, the volatility of China’s capital market is large, and equity financing is more susceptible to fluctuations owing to vibrations in the capital market compared with bond financing, thus weakening the capital market’s role in supporting GTI.
- (4)
- In the heterogeneity analysis, we further discuss the effects of environmental information disclosure and market competition intensity in the relationship related to financial support for green technology innovation. Environmental information disclosure is a reflection of the degree of green preference and environmental governance within the enterprise, which is crucial to the sustainable development of the enterprise [72]. Based on the theoretical analysis of the evolutionary game, we consider that environmental information disclosure can improve the level of green technological innovation of enterprises, and from that, it influences the role of various types of financial support on green technological innovation. A high level of environmental information disclosure can elevate a firm’s profile, help it obtain more credit support and government support, reduce GTI costs, and thus improve green innovation output [73]. However, a high level of environmental information disclosure might also expose the firm’s risks, causing investors to exhibit short-term speculative behavior and the “herd effect”, thus affecting innovation capital formation and enhancing the inhibiting effect of equity support.
- (5)
- From the external perspective of enterprises, the intensity of market competition reflects the degree of urgency of enterprises on green technology innovation and the degree of demand for external financial support. Through the empirical data test, we find that the intensity of market competition can enhance the role of various types of financial support for green technology innovation. The intensity of market competition can enhance the effect of various types of financial support on GTI. Under strong market competition, firms can more effectively use financial institutions and the government for financial support and more rapidly pursue GTI to achieve green transformation and cope with market competition [74]. At the same time, investors in the capital market have more opportunities to grasp the potential risks faced by enterprises, and market competition strengthens the inhibitory effect of equity support.
7. Conclusions and Policy Implications
7.1. Main Conclusions
GTI can help achieve the goals of sustainable development [75]. This study investigated the relationship between financial support and GTI of equipment-manufacturing enterprises. There are two research objectives: first, to find the key influencing factors of GTI and the best mode that can realize financial support to promote GTI; second, to assess the impact of different financial support approaches on GTI of enterprises. Based on this, this paper first uses the evolutionary game method to dynamically analyze the relationship between the GTI behavior of equipment-manufacturing enterprises, financial institutions, and government support behavior. We deeply excavate the key influencing factors affecting the GTI of the equipment-manufacturing industry, seek the best path of financial support for GTI, and theoretically analyze the micro-mechanism of financial support for GTI. Second, based on the empirical data of listed companies in China’s equipment-manufacturing industry, the magnitude and direction of the roles between credit support, government support, equity support, and green technology innovation are examined. In addition, the differences in the above effects between high-quality and low-quality environmental information disclosure enterprises, and strong market competition and weak market competition enterprises are further analyzed. The main conclusions are as follows:
- (1)
- In the three-party evolutionary game model, the strategic choices of the parties interact with each other, and the support provided by financial institutions and the government is conducive to promoting the strategic choices of enterprises’ green technological innovation. Financial support and environmental information disclosure can reduce the financial cost of enterprise green technology innovation and further strengthen the tendency of enterprises to choose green technology innovation. The joint support innovation model is the best realization path of financial support for green technological innovation. The combined support innovation pattern can form a benign green cycle of “active market” and “active government”, which can support firms’ GTI and realize the maximum social value.
- (2)
- The empirical tests show that there are significant differences in the effect of different financial support paths on the GTI of equipment-manufacturing enterprises. Credit support and government support have a significant positive effect on firms’ GTI, while equity financing has a negative effect, which remains consistent across multiple robustness tests.
- (3)
- Environmental information disclosure and market competition intensity play an important moderating role in the relationship between financial support and green technological innovation. Credit support and government support show differentiated effects, helping enterprises with high-quality environmental information disclosure and strong market competition to boost green technological innovation and discouraging green technological innovation in enterprises with low-quality environmental information disclosure and weak market competition. Equity support, on the other hand, inhibits green technological innovation in enterprises with high disclosure quality and fierce market competition.
7.2. Policy Implications
Based on the findings, this study proposes the following measures:
- (1)
- Optimize capital allocation and effectively use financial support. The equipment-manufacturing industry should be able to leverage its external financing channels and optimize its internal capital allocation to improve the efficiency of its use of funds and alleviate its financing constraints.
- (2)
- Establish and improve the environmental information disclosure system. If the equipment-manufacturing industry can improve its environmental information disclosure, it can help investors to better understand the actual situations of enterprises. This is also conducive to the regulatory control of banks and the government. It can enhance the visibility of firms in the capital market, alleviate information asymmetry between firms and external investors, and help equipment-manufacturing enterprises obtain adequate financial support.
- (3)
- Strengthen financial support in the credit market. Financial institutions can provide differentiated interest rate support for different types of green enterprises or GTI projects and strengthen credit support for high-quality green enterprises. In addition, green financial product innovation promotes GTI by carbon-intensive enterprises. Financial institutions should explore financial products suitable for equipment-manufacturing enterprises to reduce their GTI financing costs.
- (4)
- Strengthen the capital guidance function of policy-oriented financial support. By optimizing subsidies and tax incentives, the government can give full play to its regulatory role, aiming to improve policy support for firms’ GTI and guide various types of capital flow into the real economy to alleviate GTI financing constraints.
7.3. Limitations and Future Research
This study has some limitations. Financial support for GTI is a complex system involving multiple stakeholders and different mechanisms. This study mainly focuses on the game relationship between equipment-manufacturing enterprises, financial institutions, and the government; future research can consider game relationships between other stakeholders. Meanwhile, the payment function settings of the game subjects of all parties in the model can be improved to bring them closer to reality and to better explain reality. Second, this study considers the direct relationship between financial support and firms’ GTI. However, the effect path of financial support is complex, and more factors can be considered in future research to better explore the mechanisms and quantify the relationship between the two. In addition, forms of financial support are diverse. This study only considered credit support, equity financing, and government support. Future work can enrich the path of financial support to study the relationship between financial support and GTI in greater detail.
Author Contributions
Conceptualization, Q.W.; methodology, Q.W. and J.L.; software, J.L.; formal analysis, Q.W. and J.L.; writing—original draft preparation, J.L.; writing—review and editing, Q.W. and J.L.; supervision, Q.W.; project administration, Q.W.; funding acquisition, Q.W. All authors have read and agreed to the published version of the manuscript.
Funding
This research was funded by the Liaoning Provincial Education Department Project (CN) (grant no. LJKMR20220639).
Institutional Review Board Statement
Not applicable.
Informed Consent Statement
Not applicable.
Data Availability Statement
The data presented in this paper are available upon request from the corresponding author.
Conflicts of Interest
The authors have no conflicts of interest to declare.
References
- Hölscher, K.; Wittmayer, J.M.; Loorbach, D. Transition versus Transformation: What’s the Difference? Environ. Innov. Soc. Transit. 2018, 27, 1–3. [Google Scholar] [CrossRef]
- Zeng, J.; Škare, M.; Lafont, J. The Co-Integration Identification of Green Innovation Efficiency in Yangtze River Delta Region. J. Bus. Res. 2021, 134, 252–262. [Google Scholar] [CrossRef]
- Li, D.; Zeng, T. Are China’s Intensive Pollution Industries Greening? An Analysis Based on Green Innovation Efficiency. J. Clean. Prod. 2020, 259, 120901. [Google Scholar] [CrossRef]
- Wang, M.; Li, Y.; Liao, G. Research on the Impact of Green Technology Innovation on Energy Total Factor Productivity, Based on Provincial Data of China. Front. Environ. Sci. 2021, 9, 710931. [Google Scholar] [CrossRef]
- Sahoo, S.; Kumar, A.; Upadhyay, A. How Do Green Knowledge Management and Green Technology Innovation Impact Corporate Environmental Performance? Understanding the Role of Green Knowledge Acquisition. Bus. Strategy Environ. 2023, 32, 551–569. [Google Scholar] [CrossRef]
- Li, G.; Wang, X.; Su, S.; Su, Y. How Green Technological Innovation Ability Influences Enterprise Competitiveness. Technol. Soc. 2019, 59, 101136. [Google Scholar] [CrossRef]
- Khan, S.U.; Shah, A.; Rizwan, M.F. Do Financing Constraints Matter for Technological and Non-Technological Innovation? A (Re)Examination of Developing Markets. Emerg. Mark. Financ. Trade 2021, 57, 2739–2766. [Google Scholar] [CrossRef]
- Smith, J.M. Evolutionary Game Theory. Phys. D Nonlinear Phenom. 1986, 22, 43–49. [Google Scholar] [CrossRef]
- Goldsmith, R.W. Financial Structure and Economic Growth in Advanced Countries: An Experiment in Comparative Financial Morphology. In Capital Formation and Economic Growth; Princeton University Press: Princeton, NJ, USA, 1955; pp. 112–167. [Google Scholar]
- Lee, B.S. Bank-Based and Market-Based Financial Systems: Time-Series Evidence. Pac.-Basin Financ. J. 2012, 20, 173–197. [Google Scholar] [CrossRef]
- Fang, Z.; Gao, X.; Sun, C. Do Financial Development, Urbanization and Trade Affect Environmental Quality? Evidence from China. J. Clean. Prod. 2020, 259, 120892. [Google Scholar] [CrossRef]
- Hao, Y.; Wang, L.-O.; Lee, C.-C. Financial Development, Energy Consumption and China’s Economic Growth: New Evidence from Provincial Panel Data. Int. Rev. Econ. Financ. 2020, 69, 1132–1151. [Google Scholar] [CrossRef]
- Benfratello, L.; Schiantarelli, F.; Sembenelli, A. Banks and Innovation: Microeconometric Evidence on Italian Firms. J. Financ. Econ. 2008, 90, 197–217. [Google Scholar] [CrossRef]
- Giebel, M.; Kraft, K. Bank Credit Supply and Firm Innovation. SSRN J. 2018, 2, 105961. [Google Scholar] [CrossRef]
- D’Orazio, P.; Valente, M. The Role of Finance in Environmental Innovation Diffusion: An Evolutionary Modeling Approach. J. Econ. Behav. Organ. 2019, 162, 417–439. [Google Scholar] [CrossRef]
- Chen, Q. From Concept to Capital: Investigating the Influence of Green Innovation on Equity Financing in BRICS Economies. Int. Rev. Financ. Anal. 2024, 93, 103233. [Google Scholar] [CrossRef]
- Kliman, A.; Williams, S. Why ‘Financialisation’ Hasn’t Depressed US Productive Investment. Camb. J. Econ. 2014, 39, 67–92. [Google Scholar] [CrossRef]
- Acharya, V.; Xu, Z. Financial Dependence and Innovation: The Case of Public versus Private Firms. J. Financ. Econ. 2017, 124, 223–243. [Google Scholar] [CrossRef]
- Acemoglu, D.; Aghion, P.; Zilibotti, F. Distance to frontier, selection, and economic growth. J. Eur. Econ. Assoc. 2006, 4, 37–74. [Google Scholar] [CrossRef]
- Shao, Y.; Chen, Z. Can Government Subsidies Promote the Green Technology Innovation Transformation? Evidence from Chinese Listed Companies. Econ. Anal. Policy 2022, 74, 716–727. [Google Scholar] [CrossRef]
- Liu, J.; Zhao, M.; Wang, Y. Impacts of Government Subsidies and Environmental Regulations on Green Process Innovation: A Nonlinear Approach. Technol. Soc. 2020, 63, 101417. [Google Scholar] [CrossRef]
- Wang, P.; Dong, C.; Chen, N.; Qi, M.; Yang, S.; Nnenna, A.B.; Li, W. Environmental Regulation, Government Subsidies, and Green Technology Innovation—A Provincial Panel Data Analysis from China. Int. J. Environ. Res. Public Health 2021, 18, 11991. [Google Scholar] [CrossRef] [PubMed]
- Han, F.; Mao, X.; Yu, X.; Yang, L. Government Environmental Protection Subsidies and Corporate Green Innovation: Evidence from Chinese Microenterprises. J. Innov. Knowl. 2024, 9, 100458. [Google Scholar] [CrossRef]
- Liu, D.; Chen, T.; Liu, X.; Yu, Y. Do More Subsidies Promote Greater Innovation? Evidence from the Chinese Electronic Manufacturing Industry. Econ. Model 2019, 80, 441–452. [Google Scholar] [CrossRef]
- Lin, B.; Xie, Y. Positive or Negative? R&D Subsidies and Green Technology Innovation: Evidence from China’s Renewable Energy Industry. Renew. Energy 2023, 213, 148–156. [Google Scholar]
- Meuleman, M.; De Maeseneire, W. Do R&D Subsidies Affect SMEs’ Access to External Financing? Res. Policy 2012, 41, 580–591. [Google Scholar]
- Wu, A. The Signal Effect of Government R&D Subsidies in China: Does Ownership Matter? Technol. Forecast. Soc. Chang. 2017, 117, 339–345. [Google Scholar]
- Li, Z.; Liao, G.; Wang, Z.; Huang, Z. Green Loan and Subsidy for Promoting Clean Production Innovation. J. Clean. Prod. 2018, 187, 421–431. [Google Scholar] [CrossRef]
- da Silva Rocha, A.B.; Salomão, G.M. Environmental Policy Regulation and Corporate Compliance in Evolutionary Game Models with Well-Mixed and Structured Populations. Eur. J. Oper. Res. 2019, 279, 486–501. [Google Scholar] [CrossRef]
- Chen, H.; Wang, J.; Miao, Y. Evolutionary Game Analysis on the Selection of Green and Low Carbon Innovation between Manufacturing Enterprises. Alex. Eng. J 2021, 60, 2139–2147. [Google Scholar] [CrossRef]
- Shi, Y.; Li, Y. An Evolutionary Game Analysis on Green Technological Innovation of New Energy Enterprises under the Heterogeneous Environmental Regulation Perspective. Sustainability 2022, 14, 6340. [Google Scholar] [CrossRef]
- Liu, D.; Feng, M.; Liu, Y.; Wang, L.; Hu, J.; Wang, G.; Zhang, J. A Tripartite Evolutionary Game Study of Low-Carbon Innovation System from the Perspective of Dynamic Subsidies and Taxes. J. Environ. Manag. 2024, 356, 120651. [Google Scholar] [CrossRef] [PubMed]
- Xu, R.; Guo, T.; Zhao, H. Research on the Path of Policy Financing Guarantee to Promote SMEs’ Green Technology Innovation. Mathematics 2022, 10, 642. [Google Scholar] [CrossRef]
- Xie, X.; Huo, J.; Zou, H. Green Process Innovation, Green Product Innovation, and Corporate Financial Performance: A Content Analysis Method. J. Bus. Res. 2019, 101, 697–706. [Google Scholar] [CrossRef]
- Li, M.; Gao, X. Implementation of Enterprises’ Green Technology Innovation under Market-Based Environmental Regulation: An Evolutionary Game Approach. J. Environ. Manag. 2022, 308, 114570. [Google Scholar] [CrossRef] [PubMed]
- Liu, L.; Wang, Z.; Song, Z.; Zhang, Z. Evolutionary Game Analysis on Behavioral Strategies of Four Participants in Green Technology Innovation System. Manag. Decis. Econ. 2023, 44, 960–977. [Google Scholar] [CrossRef]
- Gao, Y.; Ning, J.; Zhang, M. An Evolutionary Game Dynamic Analysis of Enterprise Technological Innovation Implementation Strategy: From The Perspective of Green Bonds. IEEE Trans. Eng. Manag. 2024, 71, 11551–11564. [Google Scholar] [CrossRef]
- Li, Y.; Shi, Y. Dynamic Game Analysis of Enterprise Green Technology Innovation Ecosystem under Double Environmental Regulation. Int. J. Environ. Res. Public Health 2022, 19, 11047. [Google Scholar] [CrossRef]
- Guo, Q.; Zhou, M.; Liu, N.; Wang, Y. Spatial Effects of Environmental Regulation and Green Credits on Green Technology Innovation under Low-Carbon Economy Background Conditions. Int. J. Environ. Res. Public Health 2019, 16, 3027. [Google Scholar] [CrossRef]
- Wang, M.; Li, Y.; Cheng, Z.; Zhong, C.; Ma, W. Evolution and Equilibrium of a Green Technological Innovation System: Simulation of a Tripartite Game Model. J. Clean. Prod. 2021, 278, 123944. [Google Scholar] [CrossRef]
- Eghbali, M.-A.; Rasti-Barzoki, M.; Safarzadeh, S. A Hybrid Evolutionary Game-Theoretic and System Dynamics Approach for Analysis of Implementation Strategies of Green Technological Innovation under Government Intervention. Technol. Soc. 2022, 70, 102039. [Google Scholar] [CrossRef]
- Yuan, X.-M.; Zheng, C.-C. Evolutionary Game and Simulation Analysis of Low-Carbon Technology Innovation with Multi-Agent Participation. IEEE Access 2022, 10, 11284–11295. [Google Scholar] [CrossRef]
- Wang, D.P.; Wang, T.T.; Zhang, B.Q. Differential Game of Cooperation on Carbon Emission Reduction in Supply Chain Considering the Government Subsidy. Oper. Res. Manag. Sci. 2019, 28, 46–55. [Google Scholar]
- Luo, W.; Guo, X.; Zhong, S.; Wang, J. Environmental Information Disclosure Quality, Media Attention and Debt Financing Costs: Evidence from Chinese Heavy Polluting Listed Companies. J. Clean. Prod. 2019, 231, 268–277. [Google Scholar] [CrossRef]
- Huang, Z.; Liao, G.; Li, Z. Loaning Scale and Government Subsidy for Promoting Green Innovation. Technol. Forecast. Soc. Chang. 2019, 144, 148–156. [Google Scholar] [CrossRef]
- Wu, G.; Deng, L.; Niu, X. Evolutionary Game Analysis of Green Technology Innovation Behaviour for Enterprises from the Perspective of Prospect Theory. Discret. Dyn. Nat. Soc. 2022, 2022, 5892384. [Google Scholar] [CrossRef]
- Li, C.; Wang, Z.; Wang, L. Factors Affecting Firms’ Green Technology Innovation: An Evolutionary Game Based on Prospect Theory. Environ. Monit. Assess. 2022, 195, 227. [Google Scholar] [CrossRef]
- Ye, L.; Fang, Y. Evolutionary Game Analysis on Firms and Banks’ Behavioral Strategies: Impact of Environmental Governance on Interest Rate Setting. Environ. Impact Assess. Rev. 2021, 86, 106501. [Google Scholar] [CrossRef]
- Yu, C.-H.; Wu, X.; Zhang, D.; Chen, S.; Zhao, J. Demand for Green Finance: Resolving Financing Constraints on Green Innovation in China. Energy Policy 2021, 153, 112255. [Google Scholar] [CrossRef]
- Hall, B.H. The Financing of Research and Development. Oxf. Rev. Econ. Policy 2002, 18, 35–51. [Google Scholar] [CrossRef]
- Yao, H.; Wan, Z.; Zeng, H.; Wu, Q. How Does Low-Carbon Financial Policy Affect Corporate Green Innovation?—Re-Examination of Institutional Characteristics, Influence Mechanisms, and Local Government Behavior. Sustainability 2024, 16, 3944. [Google Scholar] [CrossRef]
- Richardson, A.J.; Welker, M. Social Disclosure, Financial Disclosure and the Cost of Equity Capital. Account. Org. Soc. 2001, 26, 597–616. [Google Scholar] [CrossRef]
- Kumar, P.; Firoz, M. The Impact of Voluntary Environmental Disclosure on Cost of Equity Capital—Evidence from Indian Firms. J. Contemp. Manag. Res. 2017, 11, 1–26. [Google Scholar]
- Costantini, V.; Crespi, F.; Palma, A. Characterizing the Policy Mix and Its Impact on Eco-Innovation: A Patent Analysis of Energy-Efficient Technologies. Res. Policy 2017, 46, 799–819. [Google Scholar] [CrossRef]
- Luong, H.; Moshirian, F.; Nguyen, L.; Tian, X.; Zhang, B. How Do Foreign Institutional Investors Enhance Firm Innovation? J. Financ. Quant. Anal. 2017, 52, 1449–1490. [Google Scholar] [CrossRef]
- Shao, Y. Does Excessive Debt Affect the Green Technology Innovation? Evidence from China. Environ. Dev. Sustain. 2023, 26, 19579–19596. [Google Scholar] [CrossRef]
- Xue, L.; Zhang, Q.; Zhang, X.; Li, C. Can Digital Transformation Promote Green Technology Innovation? Sustainability 2022, 14, 7497. [Google Scholar] [CrossRef]
- Chen, Y.; Zhang, J. The Interdependence of Debt and Innovation Sustainability: Evidence from the Onset of Credit Default Swaps. Sustainability 2019, 11, 2946. [Google Scholar] [CrossRef]
- Wu, W.; Liang, Z.; Zhang, Q. Effects of Corporate Environmental Responsibility Strength and Concern on Innovation Performance: The Moderating Role of Firm Visibility. Corp. Soc. Responsib. Environ. Manag. 2020, 27, 1487–1497. [Google Scholar] [CrossRef]
- Xing, C.; Zhang, Y.; Tripe, D. Green Credit Policy and Corporate Access to Bank Loans in China: The Role of Environmental Disclosure and Green Innovation. Int. Rev. Financ. Anal. 2021, 77, 101838. [Google Scholar] [CrossRef]
- Xiang, X.; Liu, C.; Yang, M. Who Is Financing Corporate Green Innovation? Int. Rev. Econ. Financ. 2022, 78, 321–337. [Google Scholar] [CrossRef]
- Lewbel, A. Constructing Instruments for Regressions with Measurement Error When No Additional Data Are Available, with An Application to Patents and R&D. Econometrica 1997, 65, 1201–1213. [Google Scholar]
- Zhang, Y.; Xing, C.; Wang, Y. Does Green Innovation Mitigate Financing Constraints? Evidence from China’s Private Enterprises. J. Clean. Prod. 2020, 264, 121698. [Google Scholar] [CrossRef]
- Kim, O.; Verrecchia, R.E. The Relation among Disclosure, Returns, and Trading Volume Information. Account. Rev. 2001, 76, 633–654. [Google Scholar] [CrossRef]
- Abbas, J.; Balsalobre-Lorente, D.; Amjid, M.A.; Al-Sulaiti, K.; Al-Sulaiti, I.; Aldereai, O. Financial Innovation and Digitalization Promote Business Growth: The Interplay of Green Technology Innovation, Product Market Competition and Firm Performance. Innov. Green Dev. 2024, 3, 100111. [Google Scholar] [CrossRef]
- Lu, N.; Wu, J.; Liu, Z. How Does Green Finance Reform Affect Enterprise Green Technology Innovation? Evidence from China. Sustainability 2022, 14, 9865. [Google Scholar] [CrossRef]
- Fang, Y. Enterprise Innovation, Government Subsidies, and Bank Loans: An Empirical Analysis from the Science and Technology Innovation Board of China. J. Knowl. Econ. 2024. [Google Scholar] [CrossRef]
- Li, L.; Chen, J.; Gao, H.; Xie, L. The Certification Effect of Government R&D Subsidies on Innovative Entrepreneurial Firms’ Access to Bank Finance: Evidence from China. Small Bus. Econ. 2019, 52, 241–259. [Google Scholar]
- Li, Z.; Pan, Y.; Yang, W.; Ma, J.; Zhou, M. Effects of Government Subsidies on Green Technology Investment and Green Marketing Coordination of Supply Chain under the Cap-and-Trade Mechanism. Energy Econ. 2021, 101, 105426. [Google Scholar] [CrossRef]
- Kini, O.; Williams, R. Tournament Incentives, Firm Risk, and Corporate Policies. J. Financ. Econ. 2012, 103, 350–376. [Google Scholar] [CrossRef]
- Serfling, M.A. CEO Age and the Riskiness of Corporate Policies. J. Corp. Financ. 2014, 25, 251–273. [Google Scholar] [CrossRef]
- Lu, Z.; Li, H. Does Environmental Information Disclosure Affect Green Innovation? Econ. Anal. Policy 2023, 80, 47–59. [Google Scholar] [CrossRef]
- Feng, E.; Siu, Y.L.; Wong, C.W.Y.; Li, S.; Miao, X. Can Environmental Information Disclosure Spur Corporate Green Innovation? Sci. Total Environ. 2024, 912, 169076. [Google Scholar] [CrossRef] [PubMed]
- Jiang, Z.; Xu, C.; Zhou, J. Government Environmental Protection Subsidies, Environmental Tax Collection, and Green Innovation: Evidence from Listed Enterprises in China. Environ. Sci. Pollut. Res. 2023, 30, 4627–4641. [Google Scholar] [CrossRef] [PubMed]
- Li, T.; Liao, G. The Heterogeneous Impact of Financial Development on Green Total Factor Productivity. Front. Energy Res. 2020, 8, 29. [Google Scholar] [CrossRef]
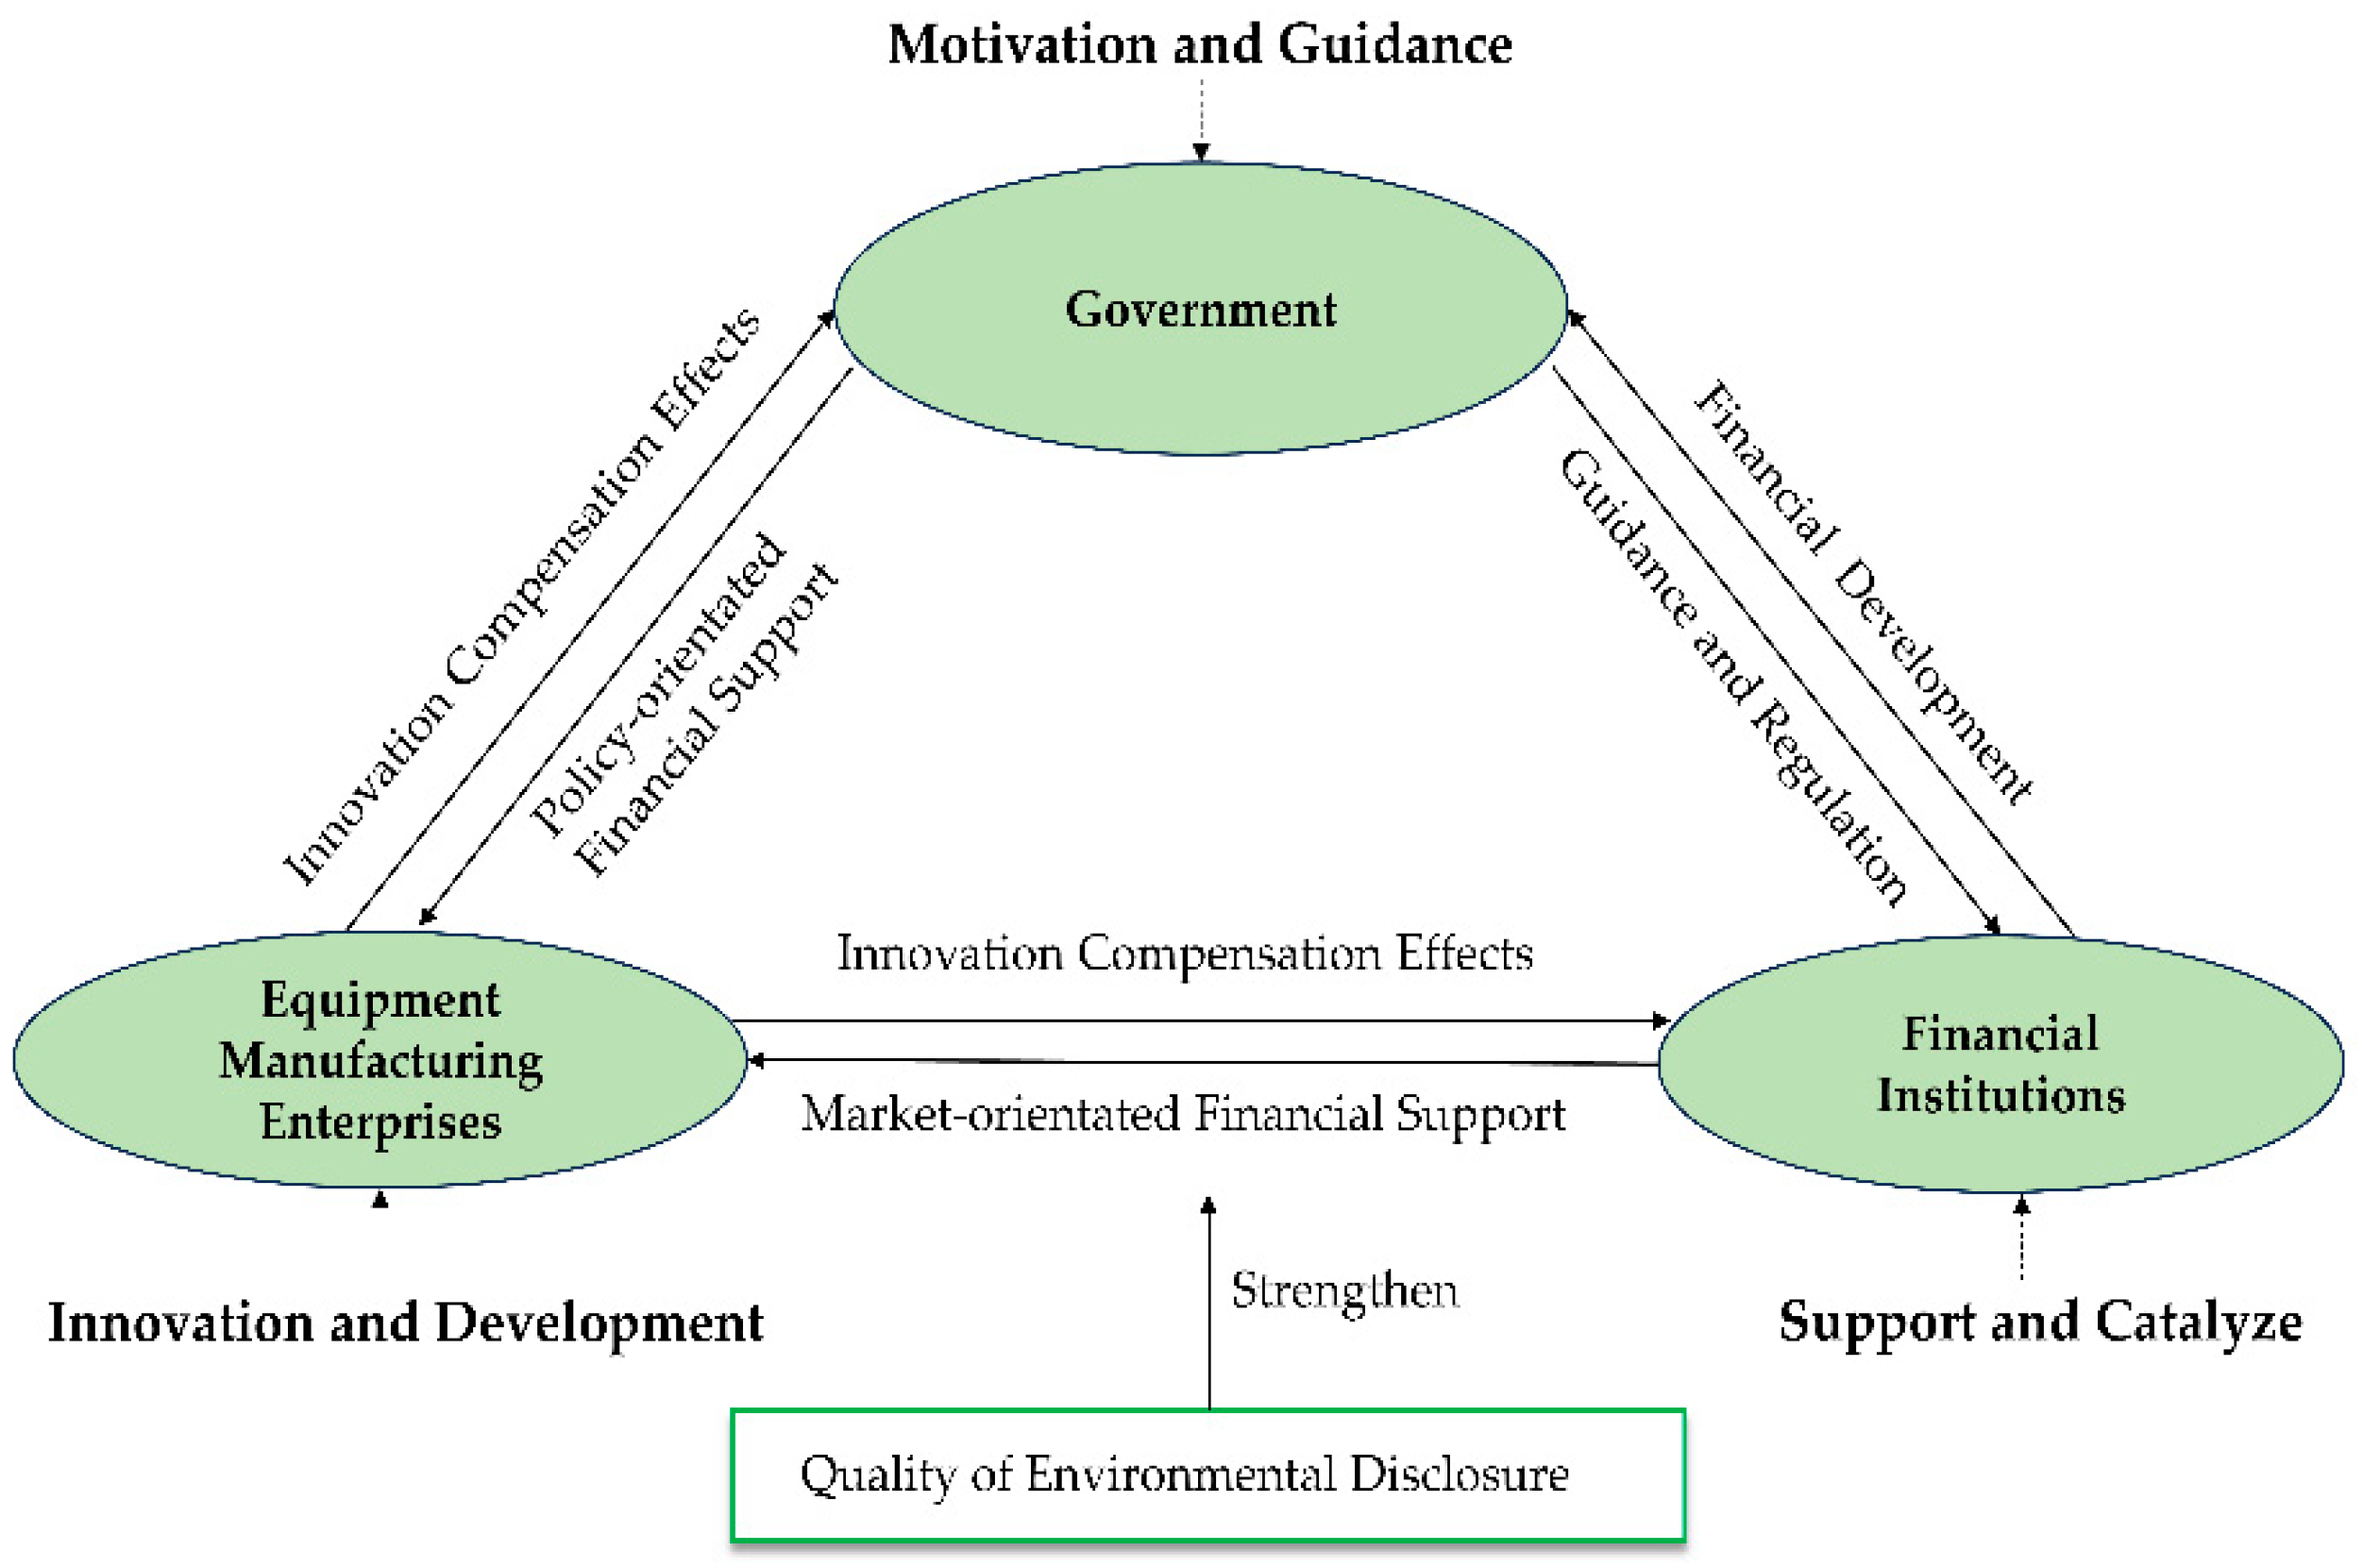
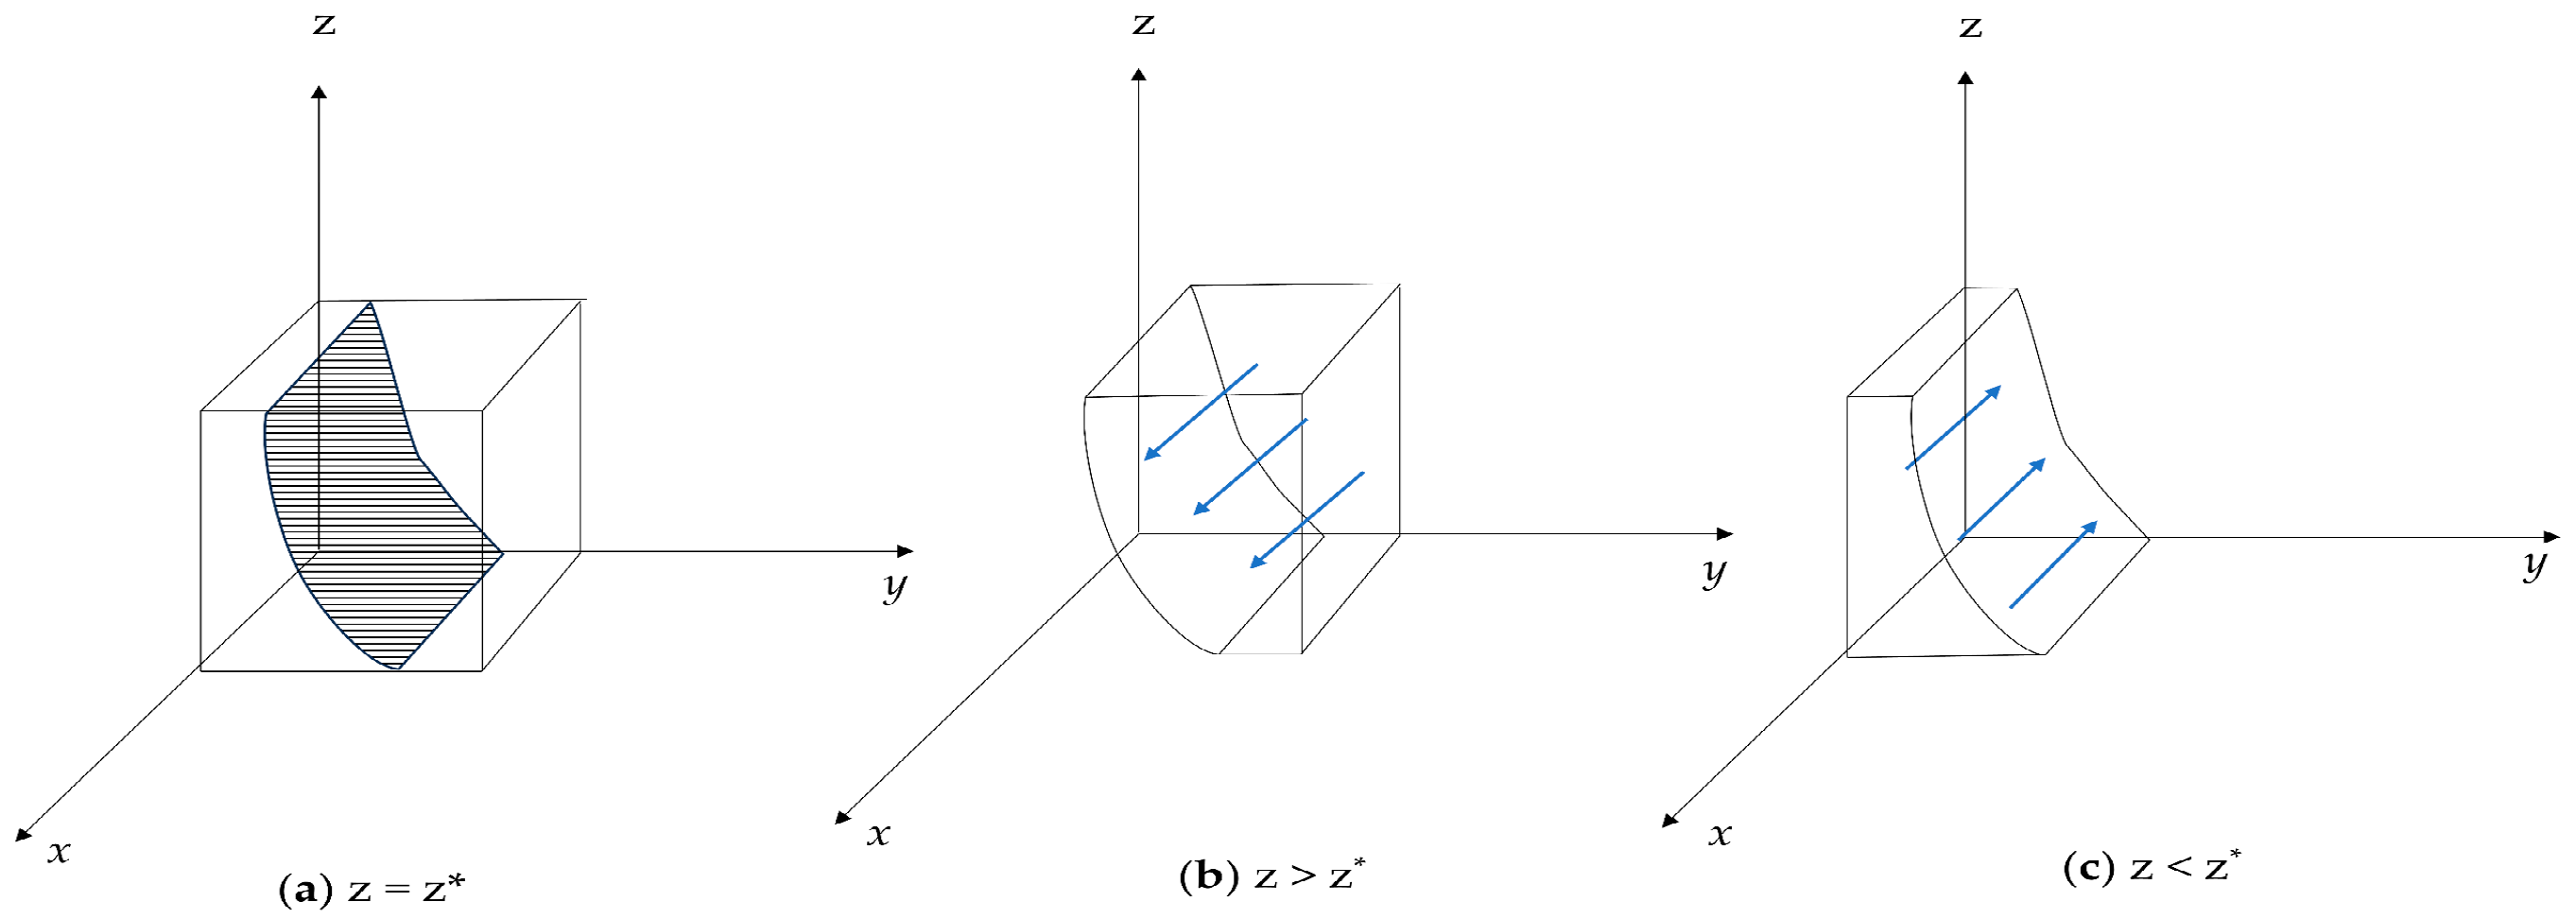
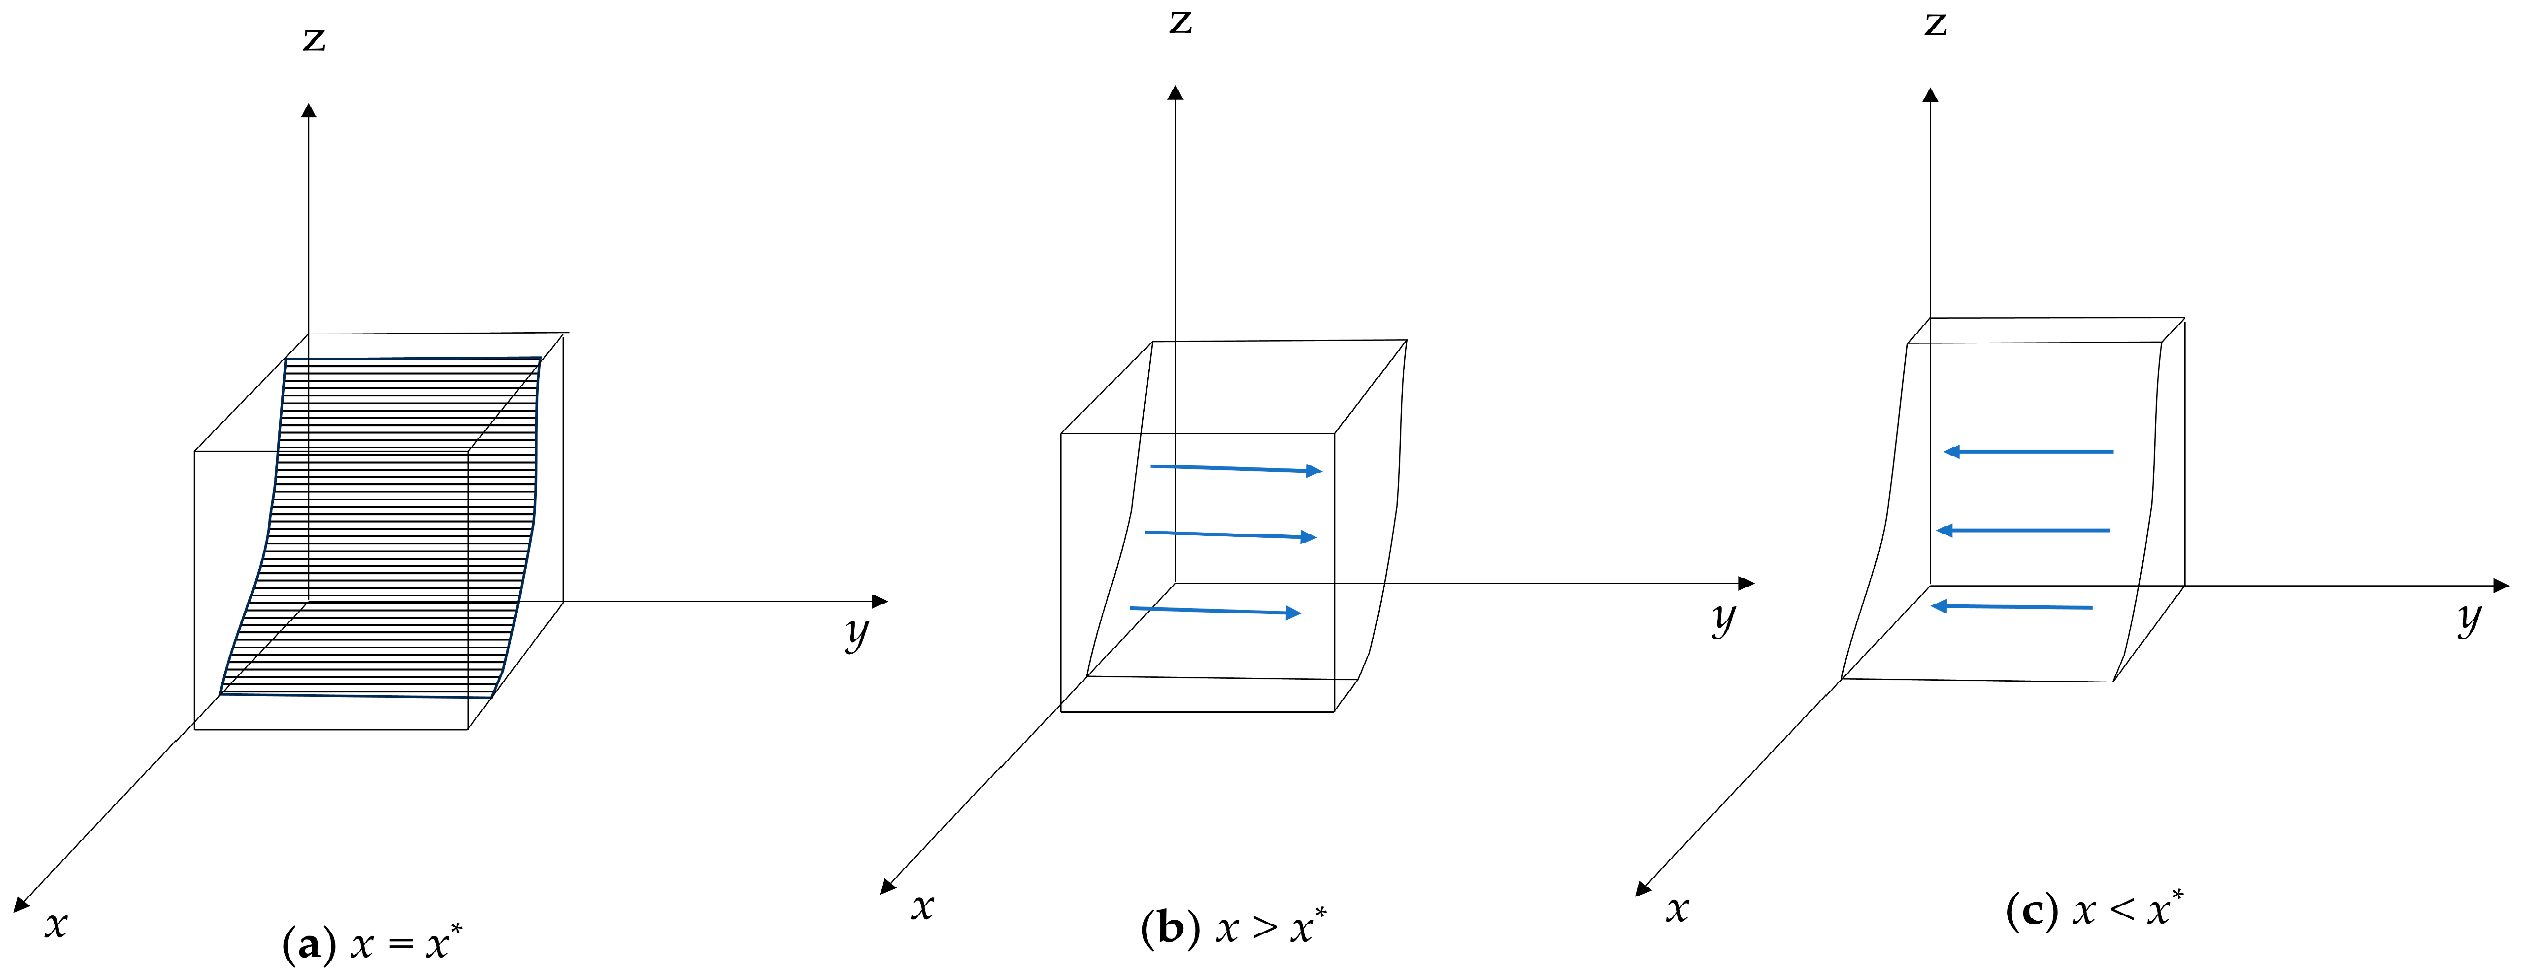
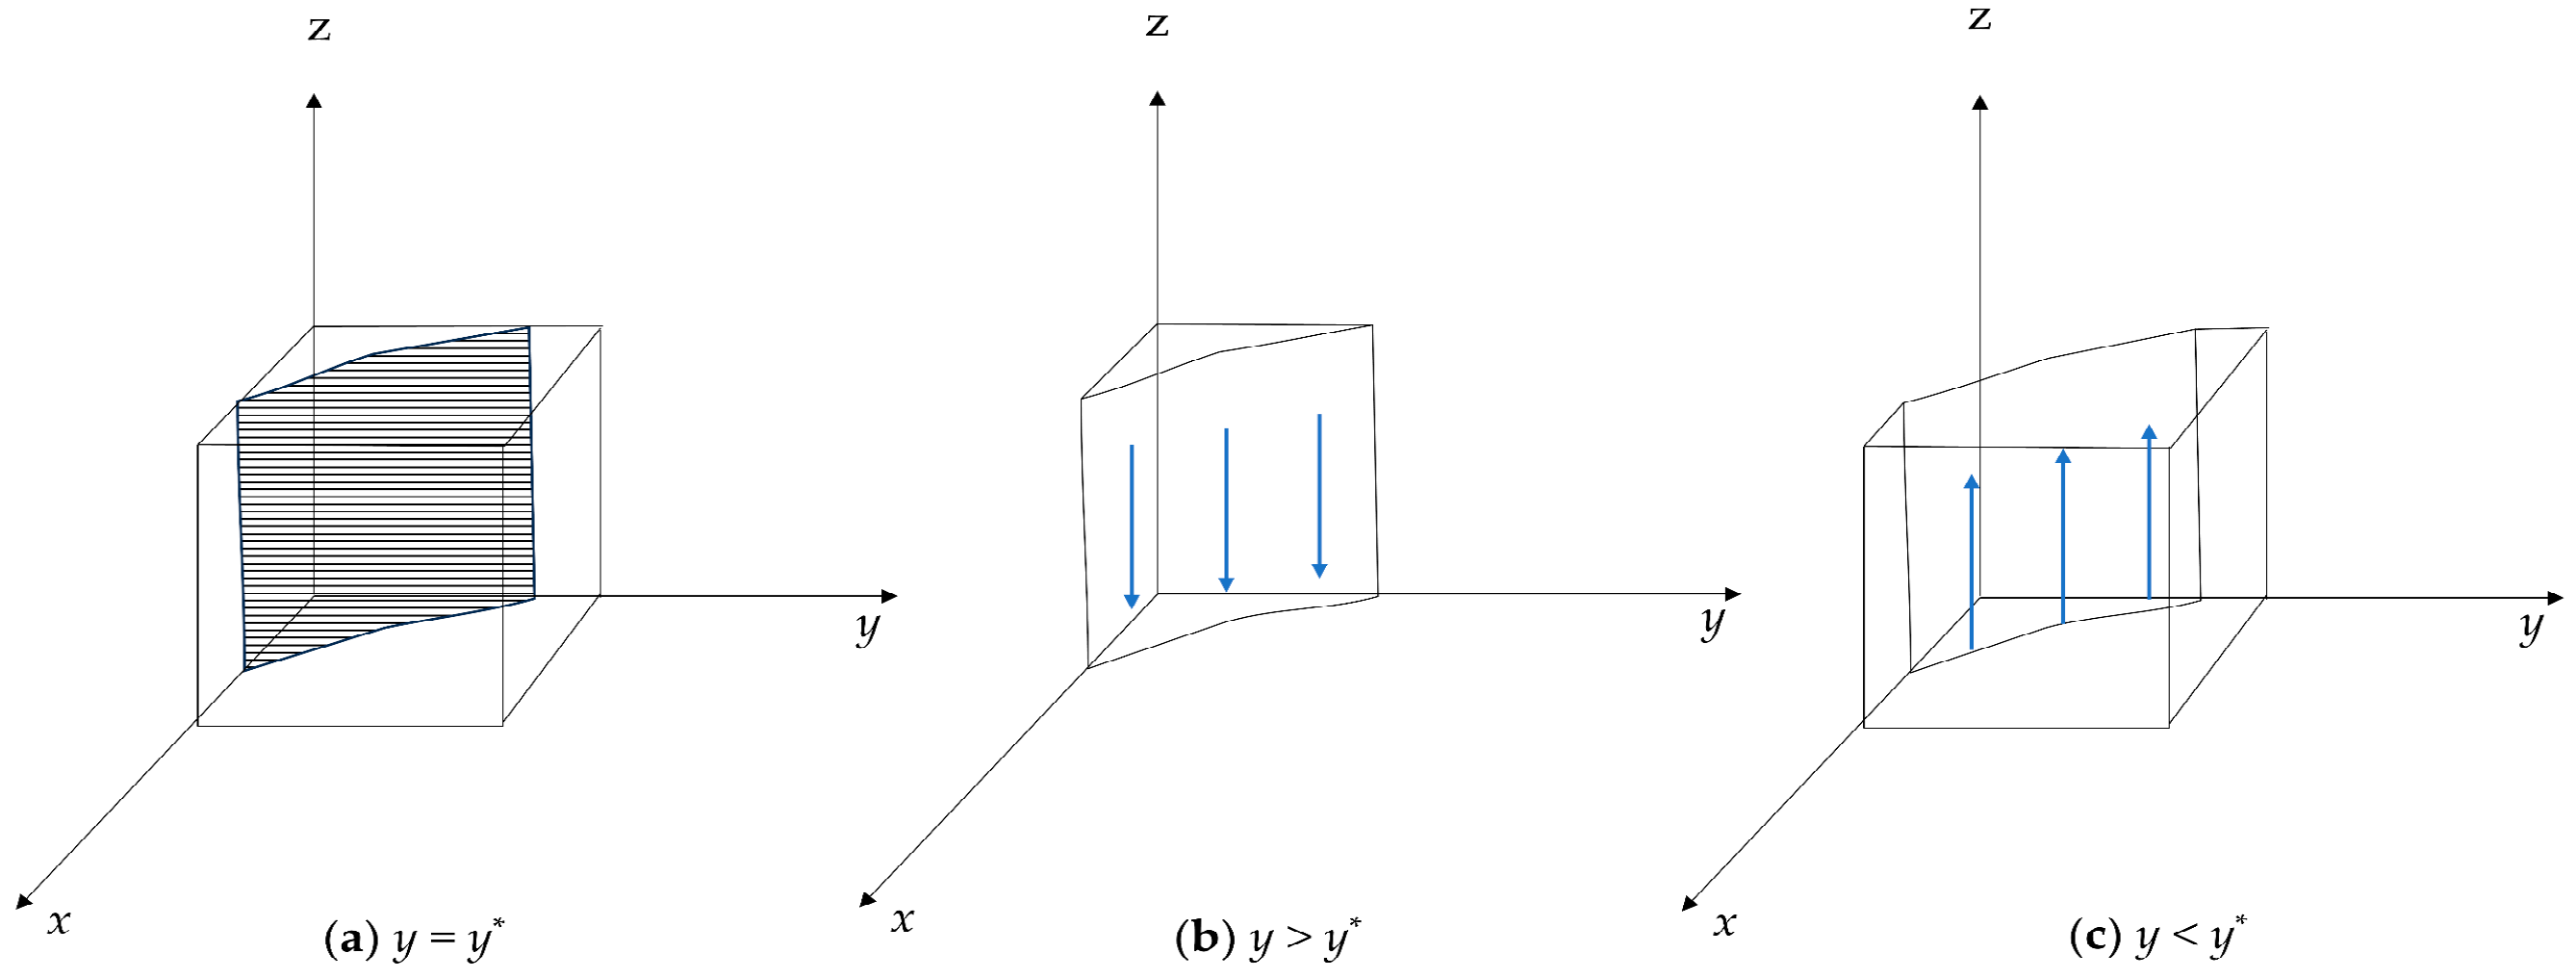
Disclaimer/Publisher’s Note: The statements, opinions and data contained in all publications are solely those of the individual author(s) and contributor(s) and not of MDPI and/or the editor(s). MDPI and/or the editor(s) disclaim responsibility for any injury to people or property resulting from any ideas, methods, instructions or products referred to in the content. |
© 2024 by the authors. Licensee MDPI, Basel, Switzerland. This article is an open access article distributed under the terms and conditions of the Creative Commons Attribution (CC BY) license (https://creativecommons.org/licenses/by/4.0/).