
Spatio-Temporal Dynamics of Soil Organic Carbon Stock in Greek Croplands: A Long-Term Assessment


Abstract
1. Introduction
2. Materials and Methods
2.1. Data Sources
2.2. Methodology
2.2.1. Data Collection
2.2.2. Spatiο-Temporal Analysis
2.2.3. Statistical Analysis
2.2.4. Synthesis and Interpretation
3. Results and Discussion
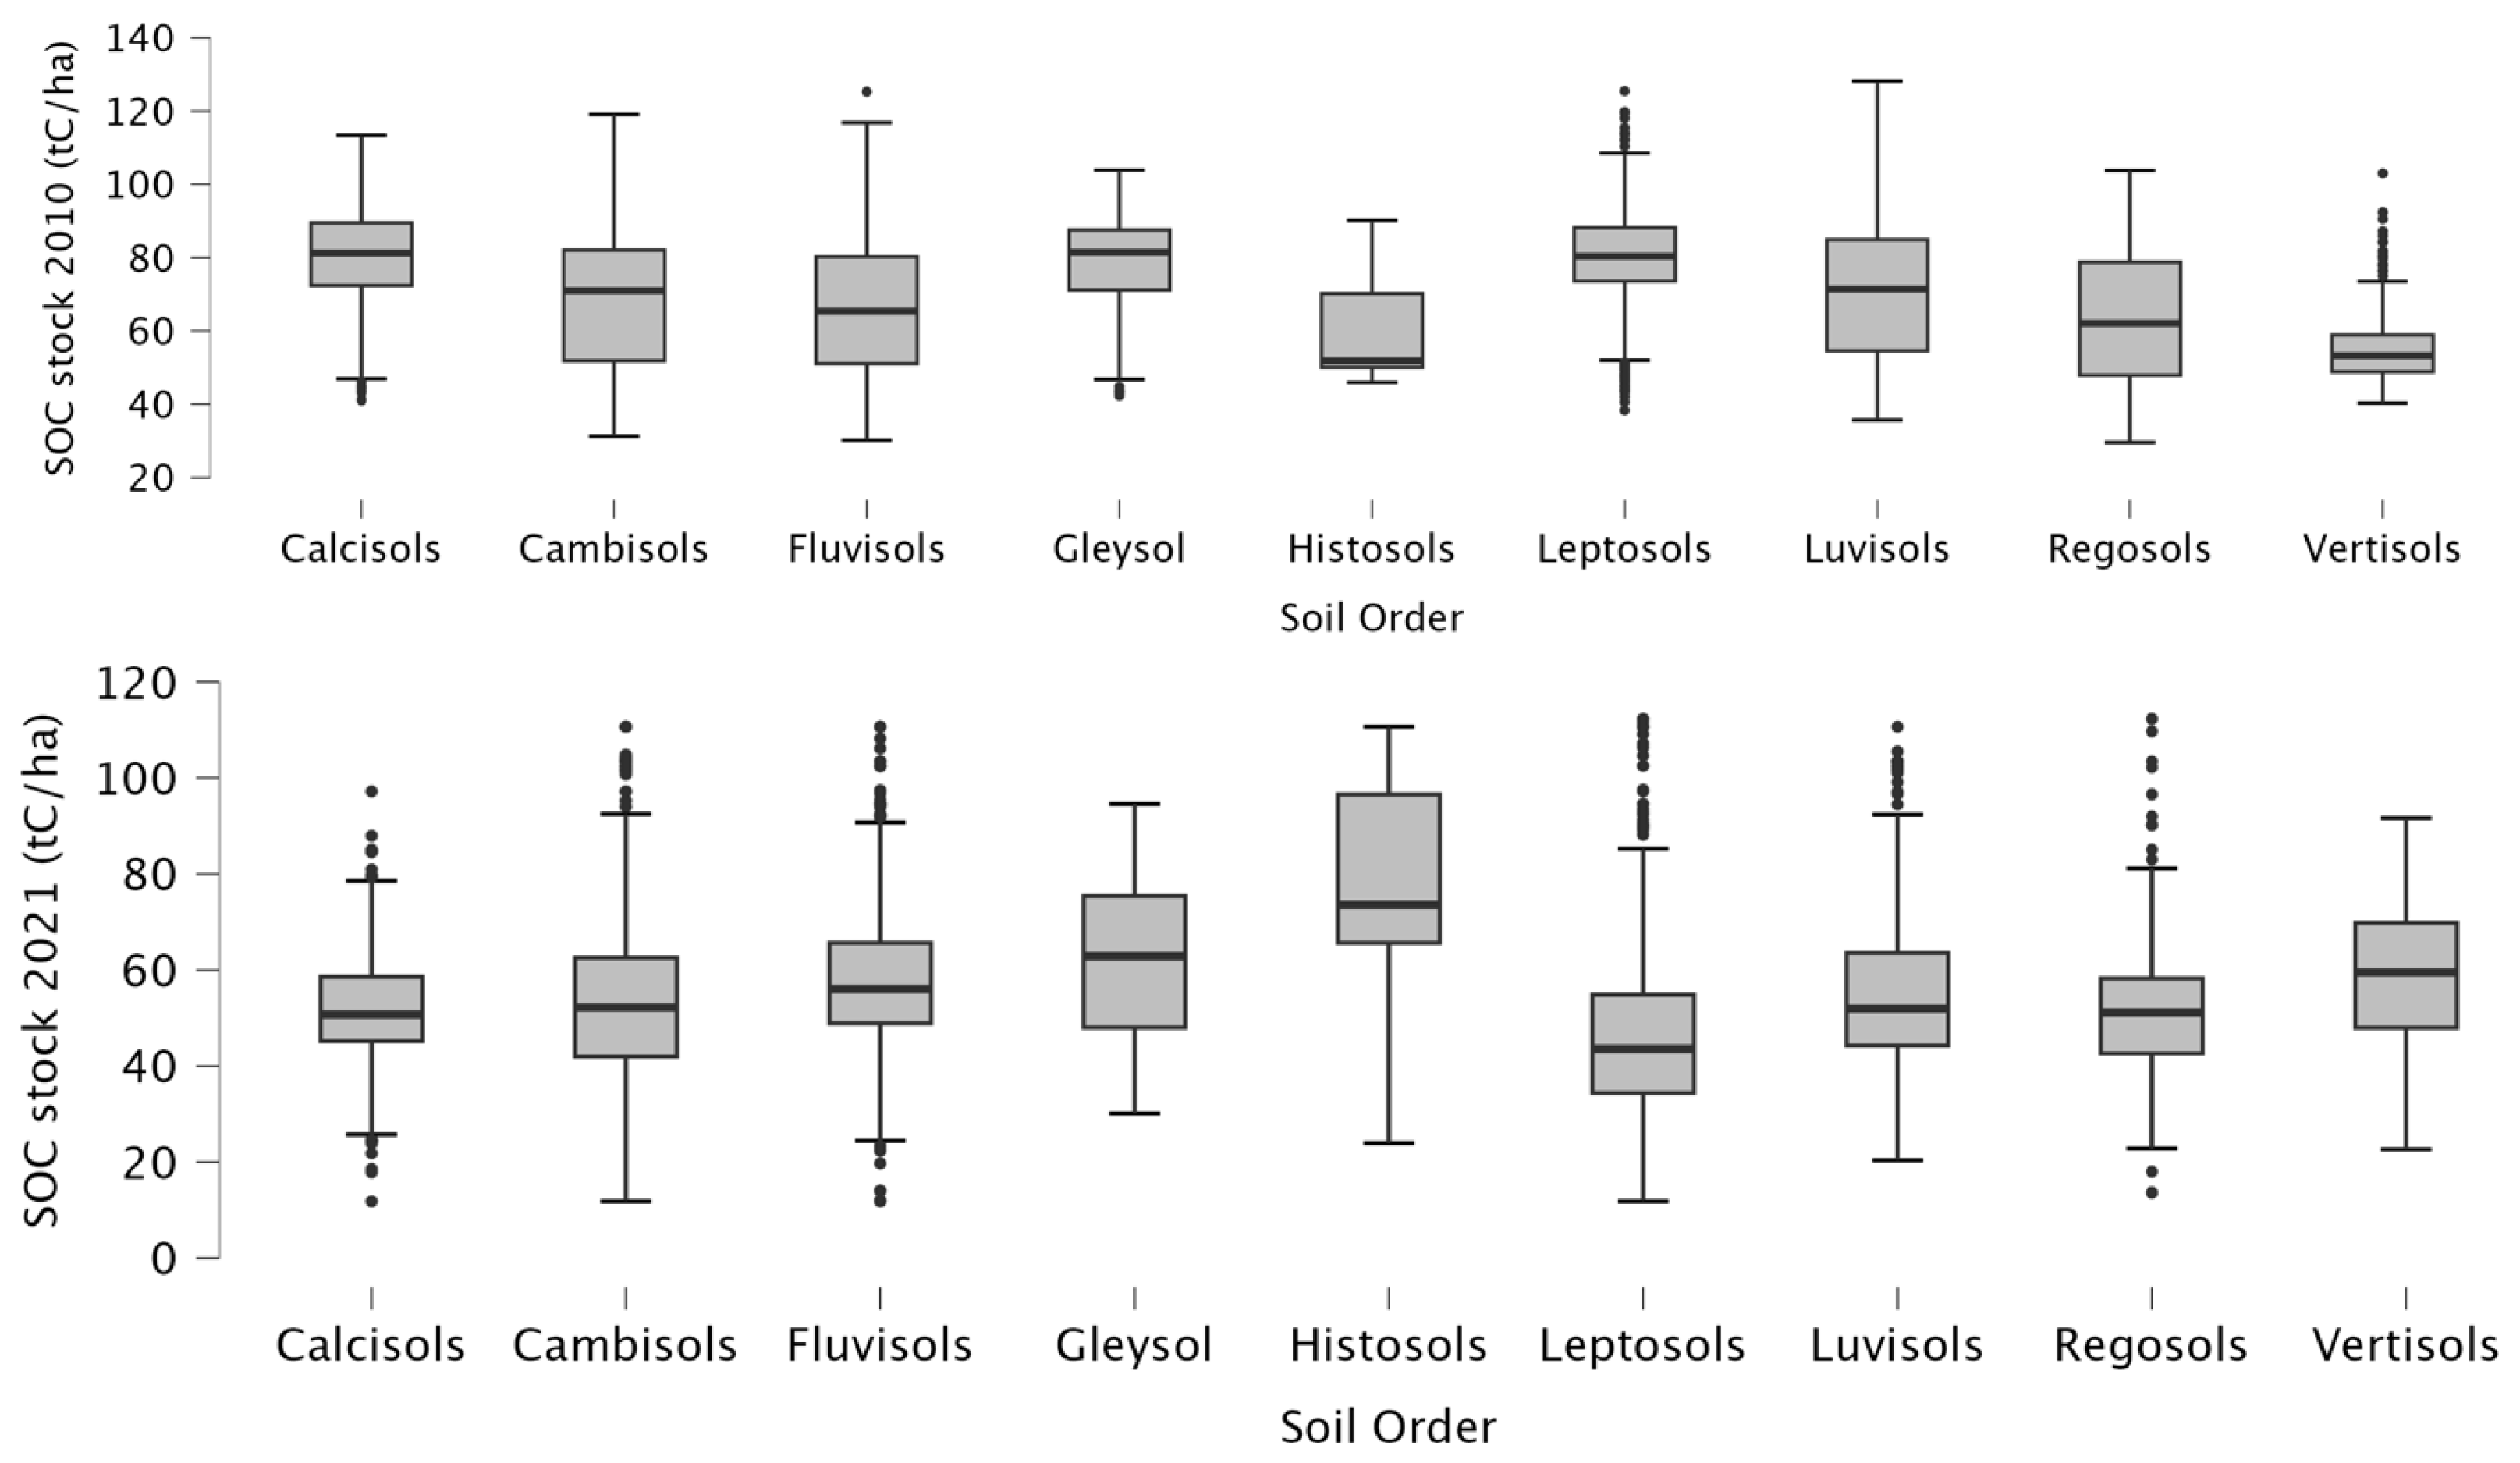
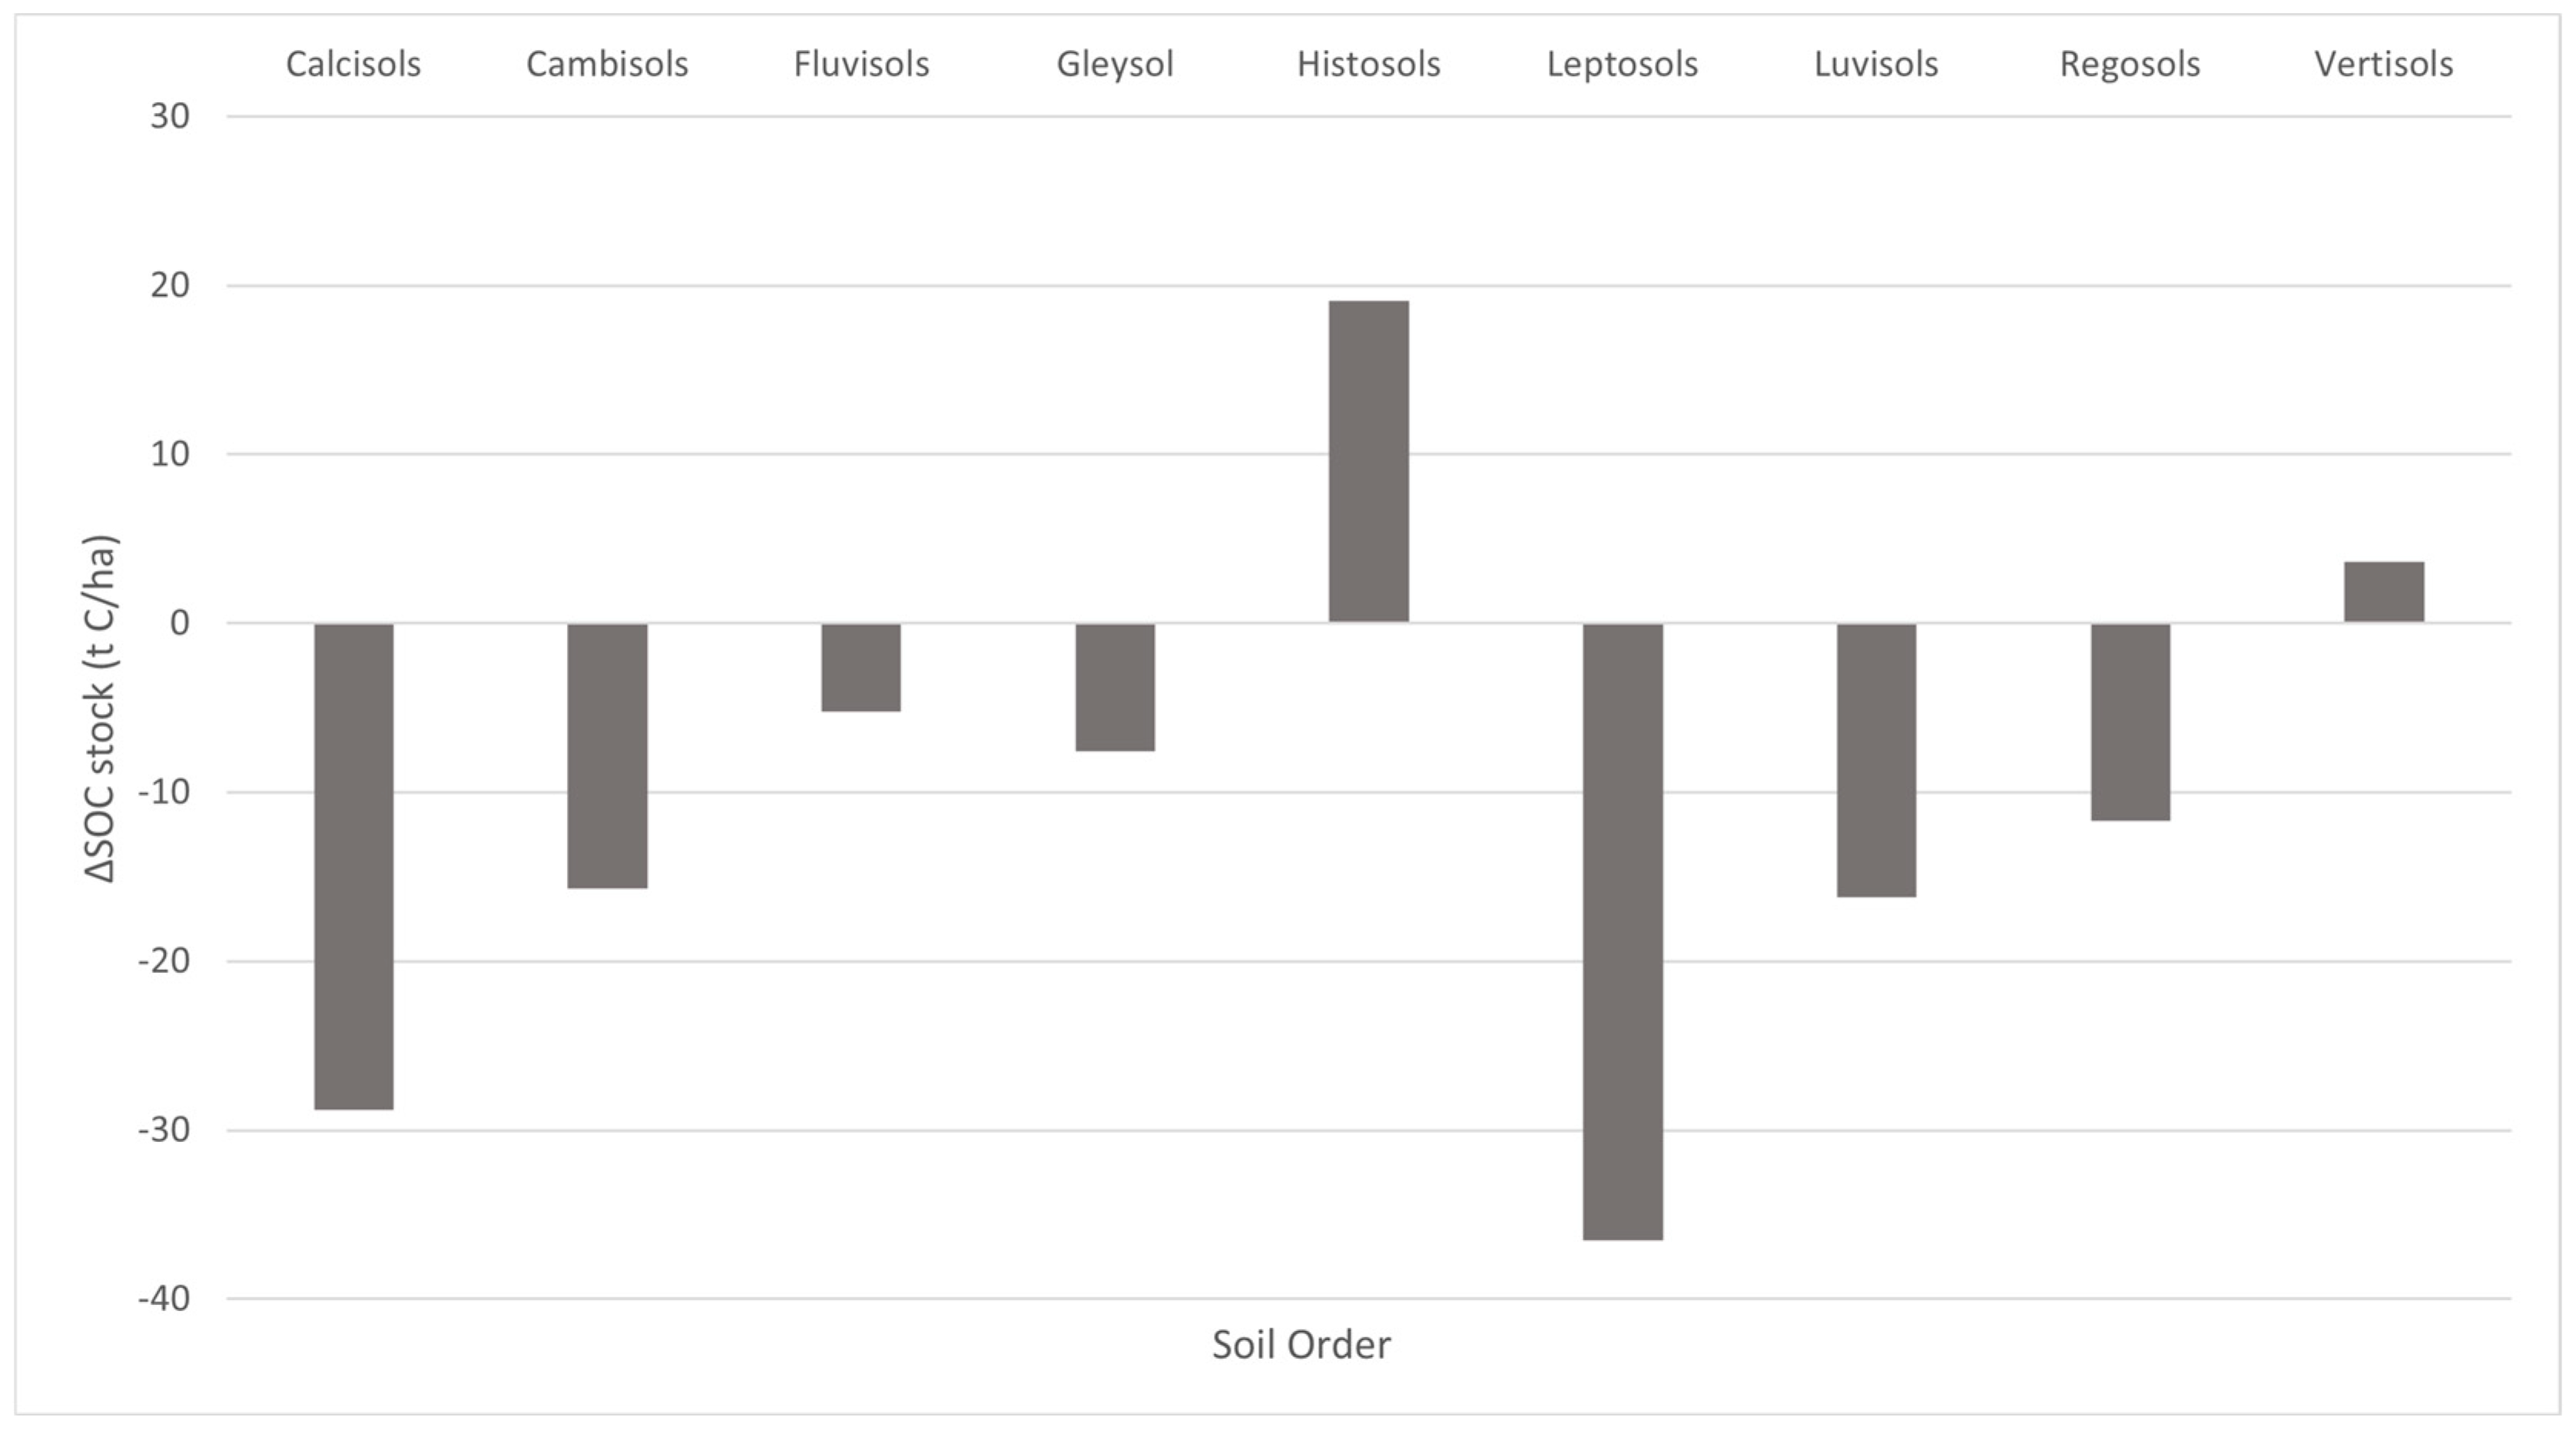
3.1. Soil Orders
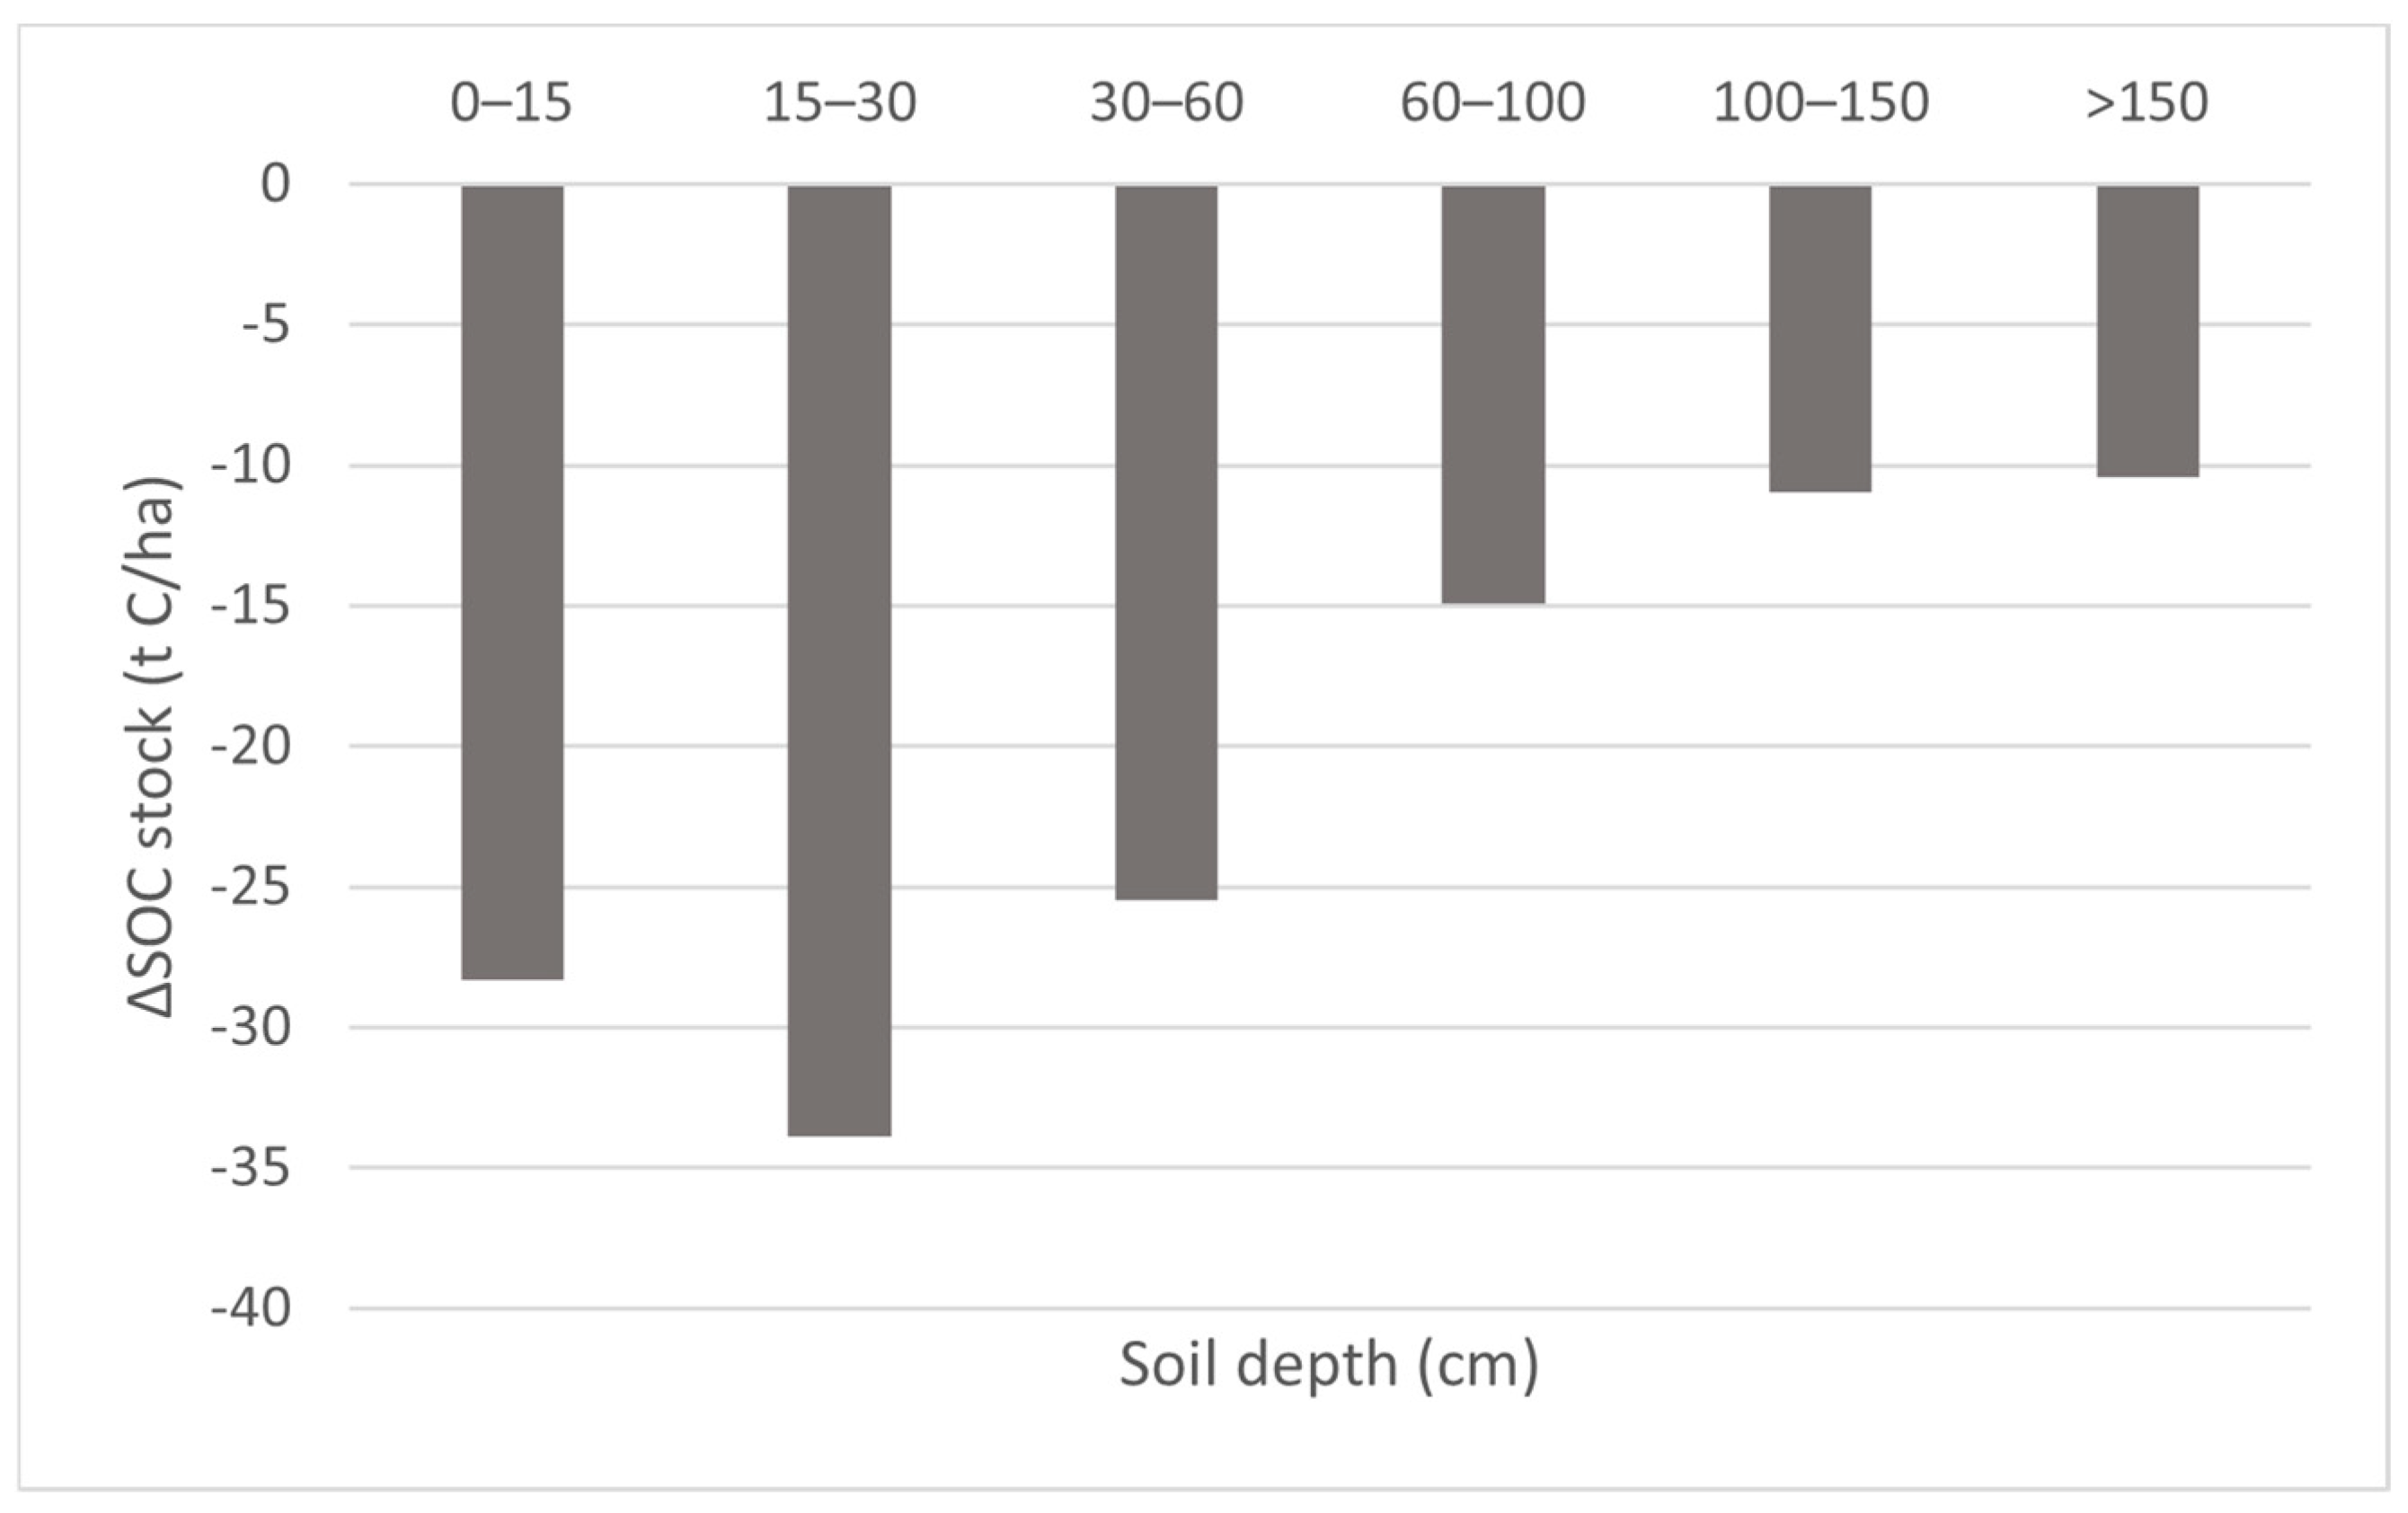
3.2. Soil Depth
3.3. Soil Coarse Materials
3.4. Soil Texture
3.5. Soil Cation Exchange Capacity
3.6. Soil Drainage
3.7. Soil Slope
3.8. Soil pH
4. Conclusions
Author Contributions
Funding
Institutional Review Board Statement
Informed Consent Statement
Data Availability Statement
Conflicts of Interest
References
- Natural Resources Conservation Service. Soil Health. U.S. Department of Agriculture. Available online: https://www.nrcs.usda.gov/conservation-basics/natural-resource-concerns/soils/soil-health (accessed on 11 September 2024).
- European Commission. Soil Health. European Commission Environment, 5 July 2023. Available online: https://environment.ec.europa.eu/topics/soil-and-land/soil-health_en (accessed on 11 September 2024).
- Jungkunst, H.F.; Göpel, J.; Horvath, T.; Ott, S.; Brunn, M. Global soil organic carbon–climate interactions: Why scales matter. Wiley Interdiscip. Rev. Clim. Chang. 2022, 13, e780. [Google Scholar] [CrossRef]
- Poeplau, C.; Don, A. Carbon sequestration in agricultural soils via cultivation of cover crops—A meta-analysis. Agric. Ecosyst. Environ. 2015, 200, 33–41. [Google Scholar] [CrossRef]
- Qin, Z.; Huang, Y.; Zhuang, Q. Soil organic carbon sequestration potential of cropland in China. Glob. Biogeochem. Cycles 2013, 27, 711–722. [Google Scholar] [CrossRef]
- Townsend-Small, A.; Czimczik, C.I. Carbon sequestration and greenhouse gas emissions in urban turf. Geophys. Res. Lett. 2010, 37, L02707. [Google Scholar] [CrossRef]
- Lal, R. Soil carbon sequestration impacts on global climate change and food security. Science 2004, 304, 1623–1627. [Google Scholar] [CrossRef]
- Qu, R.; Chen, S.; Wang, K.; Liu, Q.; Yang, B.; Yue, M.; Peng, C. Potential future changes in soil carbon dynamics in the Ziwuling Forest, China under different climate change scenarios. Sci. Total Environ. 2024, 912, 169008. [Google Scholar] [CrossRef]
- Brandao, M.; Mila, I.; Canals, L.; Clift, R. Soil Organic Carbon Changes in the Cultivation of Energy Crops: Implications for GHG Balances and Soil Quality for Use in LCA. Biomass Bioenergy 2011, 35, 2323–2336. [Google Scholar] [CrossRef]
- Minasny, B.; Malone, B.P.; McBratney, A.B.; Angers, D.A.; Arrouays, D.; Chambers, A.; Chaplot, V.; Chen, Z.-S.; Cheng, K.; Das, B.S.; et al. Soil carbon 4 per mille. Geoderma 2017, 292, 59–86. [Google Scholar] [CrossRef]
- Chambers, A.; Lal, R.; Paustian, K. Soil carbon sequestration potential of US croplands and grasslands: Implementing the 4 per Thousand Initiative. J. Soil Water Conserv. 2016, 71, 68A–74A. [Google Scholar] [CrossRef]
- Smith, P.; House, J.I.; Bustamante, M.; Sobocká, J.; Harper, R.; Pan, G.; West, P.C.; Clark, J.M.; Adhya, T.; Rumpel, C.; et al. Global change pressures on soils from land use and management. Glob. Chang. Biol. 2016, 22, 1008–1028. [Google Scholar] [CrossRef]
- Georgiadis, N.M.; Dimitropoulos, G.; Avanidou, K.; Bebeli, P.; Bergmeier, E.; Dervisoglou, S.; Dimopoulos, T.; Grigoropoulou, D.; Hadjigeorgiou, I.; Kairis, O.; et al. Farming practices and biodiversity: Evidence from a Mediterranean semi-extensive system on the island of Lemnos (North Aegean, Greece). J. Environ. Manag. 2022, 303, 114131. [Google Scholar] [CrossRef] [PubMed]
- Gkoltsiou, A.; Athanasiadou, E.; Paraskevopoulou, A.T. Agricultural Heritage Landscapes of Greece: Three Case Studies and Strategic Steps towards Their Acknowledgement, Conservation and Management. Sustainability 2021, 13, 5955. [Google Scholar] [CrossRef]
- Sun, T.; Tong, W.J.; Chang, N.J.; Deng, A.X.; Lin, Z.L.; Feng, X.B.; Li, J.Y.; Song, Z. Estimation of soil organic carbon stock and its controlling factors in cropland of Yunnan Province, China. J. Integr. Agric. 2021, 20, 2–14. [Google Scholar] [CrossRef]
- Poeplau, C.; Don, A.; Vesterdal, L.; Leifeld, J.; Wesemael, B.; Schumacher, J.; Gensior, A. Temporal dynamics of soil organic carbon after land-use change in the temperate zone—Carbon response functions as a model approach. Glob. Chang. Biol. 2011, 17, 2415–2427. [Google Scholar] [CrossRef]
- Zhao, Y.; Liu, C.; Li, X.; Ma, L.; Zhai, G.; Feng, X. Sphagnum increases soil’s sequestration capacity of mineral-associated organic carbon via activating metal oxides. Nat. Commun. 2023, 14, 5052. [Google Scholar] [CrossRef]
- Leifeld, J.; Menichetti, L. The underappreciated potential of peatlands in global climate change mitigation strategies. Nat. Commun. 2018, 9, 1071. [Google Scholar] [CrossRef]
- Lai, L.; Kumar, S.; Folle, S.; Owens, V. Predicting soils and environmental impacts associated with switchgrass for bioenergy production: A DAYCENT modeling approach. GCB Bioenergy 2017, 10, 287–302. [Google Scholar] [CrossRef]
- Batjes, N.H. Total carbon and nitrogen in the soils of the world. Eur. J. Soil Sci. 1996, 47, 151–163. [Google Scholar] [CrossRef]
- Fernández-Ugalde, O.; Tóth, G. Pedotransfer functions for predicting organic carbon in subsurface horizons of European soils. Eur. J. Soil Sci. 2017, 68, 716–725. [Google Scholar] [CrossRef]
- Montgomery, D.R. Soil erosion and agricultural sustainability. Proc. Natl. Acad. Sci. USA 2007, 104, 13268–13272. [Google Scholar] [CrossRef]
- Yang, X.; Xu, J.; Wang, H.; Quan, H.; Yu, H.; Luan, J.; Wang, D.; Li, Y.; Lv, D. Vertical distribution characteristics of soil organic carbon and vegetation types under different elevation gradients in Cangshan, Dali. PeerJ 2024, 12, e16686. [Google Scholar] [CrossRef] [PubMed]
- Poeplau, C.; Jacobs, A.; Don, A.; Vos, C.; Schneider, F.; Wittnebel, M.; Tiemeyer, B.; Heidkamp, A.; Prietz, R.; Flessa, H. Stocks of organic carbon in German agricultural soils—Key results of the first comprehensive inventory. J. Plant Nutr. Soil Sci. 2020, 183, 665–681. [Google Scholar] [CrossRef]
- Jobbágy, E.G.; Jackson, R.B. The vertical distribution of soil organic carbon and its relation to climate and vegetation. Ecol. Appl. 2000, 10, 423–436. [Google Scholar] [CrossRef]
- Poeppl, R.E.; Dilly, L.A.; Haselberger, S.; Renschler, C.S.; Baartman, J.E.M. Combining Soil Erosion Modeling with Connectivity Analyses to Assess Lateral Fine Sediment Input into Agricultural Streams. Water 2019, 11, 1793. [Google Scholar] [CrossRef]
- Hengl, T.; De Jesus, J.M.; Heuvelink, G.B.M.; Gonzalez, M.R.; Kilibarda, M.; Blagotić, A.; Shangguan, W.; Wright, M.N.; Geng, X.; Bauer-Marschallinger, B.; et al. SoilGrids250m: Global gridded soil information based on machine learning. PLoS ONE 2017, 12, e0169748. [Google Scholar] [CrossRef]
- Filipiak, M.; Gabriel, D.; Kuka, K. Simulation-based assessment of the soil organic carbon sequestration in grasslands in relation to management and climate change scenarios. Heliyon 2023, 9, e17287. [Google Scholar] [CrossRef]
- Poeplau, C.; Don, A.; Six, J.; Kaiser, M.; Benbi, D.; Chenu, C.; Cotrufo, M.F.; Derrien, D.; Gioacchini, P.; Grand, S.; et al. Isolating organic carbon fractions with varying turnover rates in temperate agricultural soils—A comprehensive method comparison. Soil Biol. Biochem. 2018, 125, 10–26. [Google Scholar] [CrossRef]
- Najmuldeen, H. Effects of soil texture on chemical compositions, microbial populations and carbon mineralization in soil. J. Exp. Biol 2010, 6, 59–64. [Google Scholar]
- Smith, P.; Martino, D.; Cai, Z.; Gwary, D.; Janzen, H.; Kumar, P.; McCarl, B.; Ogle, S.; O’Mara, F.; Rice, C.; et al. Greenhouse gas mitigation in agriculture. Philos. Trans. R. Soc. B Biol. Sci. 2008, 363, 789–813. [Google Scholar] [CrossRef]
- Lugato, E.; Panagos, P.; Bampa, F.; Jones, A.; Montanarella, L. A new baseline of organic carbon stock in European agricultural soils using a modelling approach. Glob. Chang. Biol. 2014, 20, 313–326. [Google Scholar] [CrossRef]
- Panagos, P.; Van Liedekerke, M.; Jones, A.; Montanarella, L. European Soil Data Centre: Response to European policy support and public data requirements. Land Use Policy 2012, 29, 329–338. [Google Scholar] [CrossRef]
- Panagos, P.; Van Liedekerke, M.; Borrelli, P.; Köninger, J.; Ballabio, C.; Orgiazzi, A.; Lugato, E.; Liakos, L.; Hervas, J.; Jones A Montanarella, L. European Soil Data Centre 2.0: Soil data and knowledge in support of the EU policies. Eur. J. Soil Sci. 2022, 73, e13315. [Google Scholar] [CrossRef]
- European Soil Data Centre (ESDAC). European Commission, Joint Research Centre. Available online: https://esdac.jrc.ec.europa.eu (accessed on 26 December 2023).
- Triantakonstantis, D.; Detsikas, S. Greek National Map of Soil Organic Carbon. In Proceedings of the 23rd EGU General Assembly, Online. 19–30 April 2021. EGU21-13211. [Google Scholar] [CrossRef]
- Triantakonstantis, D.; Detsikas, S.E. Soil organic carbon sequestration potential dynamics in saline and sodic soils in Greece, Chapter 6. In Earth Observation, Remote Sensing in Precision Agriculture; Lamine, S., Srivastava, P.K., Kayad, A., Muñoz-Arriola, F., Pandey, P.C., Eds.; Academic Press: Cambridge, MA, USA, 2024; pp. 93–103. [Google Scholar]
- Misopolinos, N.; Silleos, N.; Bilas, G.; Karapetsas, N.; Dionisiou, N.; Misopolinos, L.; Pazarloglou, M.; Srati, S.; Cherif, I.; Ovakoglou, G.; et al. Soil Map of Greece 1:30.000, under Project: Development of a Universal SYSTEM of Handling Geoinformation Data and Mapping Agricultural Areas of Greece, Report in Greek; Commissioned by Payment and Control Agency for Guidance and Guarantee Community Aid (O.P.E.K.E.P.E); Aristotle University of Thessaloniki (AUTH): Thessaloniki, Greece, 2015. [Google Scholar]
- JASP Statistical Software. Available online: https://jasp-stats.org/ (accessed on 8 February 2024).
- De Rosa, D.; Ballabio, C.; Lugato, E.; Fasiolo, M.; Jones, A.; Panagos, P. Soil organic carbon stocks in European croplands and grasslands: How much have we lost in the past decade? Glob. Chang. Biol. 2024, 30, e16992. [Google Scholar] [CrossRef]
- Ferré, C.; Mascetti, G.; Gentili, R.; Citterio, S.; Comolli, R. Soil climate regulation services: High SOC stock in Podzols and Umbrisols in an alpine grassland (Valle Adamé, Italy). Environ. Earth Sci. 2023, 82, 534. [Google Scholar] [CrossRef]
- Wiesmeier, M.; Spoerlein, P.; Geuss, U.; Hangen, E.; Haug, S.; Reischl, A.; Schilling, B.; von Luetzow, M.; Koegel-Knabner, I. Soil organic carbon stocks in southeast Germany (Bavaria) as affected by land use, soil type and sampling depth. Glob. Chang. Biol. 2012, 18, 2233–2245. [Google Scholar] [CrossRef]
- Gregory, P.J. Roots, rhizosphere and soil: The route to a better understanding of soil science? Eur. J. Soil Sci. 2006, 57, 2–12. [Google Scholar] [CrossRef]
- Gill, R.A.; Burke, I.C. Influence of soil depth on the decomposition of Bouteloua gracilis roots in the shortgrass steppe. Plant Soil 2002, 241, 233–242. [Google Scholar] [CrossRef]
- Zhang, Y.; Li, P.; Liu, X.; Xiao, L.; Li, T.; Wang, D. The response of soil organic carbon to climate and soil texture in China. Front. Earth Sci. 2022, 16, 835–845. [Google Scholar] [CrossRef]
- Bouma, T.J.; Bryla, D.R. On the assessment of root and soil respiration for soils of different textures: Interactions with soil moisture contents and soil CO2 concentrations. Plant Soil 2000, 227, 215–221. [Google Scholar] [CrossRef]
- Kaiser, K.; Guggenberger, G. Mineral surfaces and soil organic matter. Eur. J. Soil Sci. 2003, 54, 219–236. [Google Scholar] [CrossRef]
- Manrique, L.A.; Jones, C.A.; Dyke, P.T. Predicting Cation-Exchange Capacity from Soil Physical and Chemical Properties. Soil Sci. Soc. Am. J. 1991, 55, 787–794. [Google Scholar] [CrossRef]
- Tete, E.; Viaud, V.; Walter, C. Organic carbon and nitrogen mineralization in a poorly-drained mineral soil under transient waterlogged conditions: An incubation experiment. Eur. J. Soil Sci. 2015, 66, 427–437. [Google Scholar] [CrossRef]
- Holz, M.; Augustin, J. Erosion effects on soil carbon and nitrogen dynamics on cultivated slopes: A meta-analysis. Geoderma 2021, 397, 115045. [Google Scholar] [CrossRef]
- Karchegani, P.M.; Ayoubi, S.; Mosaddeghi, M.R.; Honarjoo, N. Soil organic carbon pools in particle-size fractions as affected by slope gradient and land use change in hilly regions, western Iran. J. Mt. Sci. 2012, 9, 87–95. [Google Scholar] [CrossRef]
- Jakšić, S.; Ninkov, J.; Milić, S.; Vasin, J.; Živanov, M.; Jakšić, D.; Komlen, V. Influence of Slope Gradient and Aspect on Soil Organic Carbon Content in the Region of Niš, Serbia. Sustainability 2021, 13, 15. [Google Scholar] [CrossRef]
- Liao, K.; Wu, S.; Zhu, Q. Can Soil pH Be Used to Help Explain Soil Organic Carbon Stocks? Clean-Soil Air Water 2016, 44, 1685–1689. [Google Scholar] [CrossRef]
- Tu, C.; He, T.; Lu, X.; Luo, Y.; Smith, P. Extent to which pH and topographic factors control soil organic carbon level in dry farming cropland soils of the mountainous region of Southwest China. Catena 2018, 163, 204–209. [Google Scholar] [CrossRef]


Disclaimer/Publisher’s Note: The statements, opinions and data contained in all publications are solely those of the individual author(s) and contributor(s) and not of MDPI and/or the editor(s). MDPI and/or the editor(s) disclaim responsibility for any injury to people or property resulting from any ideas, methods, instructions or products referred to in the content. |
© 2024 by the authors. Licensee MDPI, Basel, Switzerland. This article is an open access article distributed under the terms and conditions of the Creative Commons Attribution (CC BY) license (https://creativecommons.org/licenses/by/4.0/).
Share and Cite
Triantakonstantis, D.; Batsalia, M.; Lolos, N. Spatio-Temporal Dynamics of Soil Organic Carbon Stock in Greek Croplands: A Long-Term Assessment. Sustainability 2024, 16, 7984. https://doi.org/10.3390/su16187984
Triantakonstantis D, Batsalia M, Lolos N. Spatio-Temporal Dynamics of Soil Organic Carbon Stock in Greek Croplands: A Long-Term Assessment. Sustainability. 2024; 16(18):7984. https://doi.org/10.3390/su16187984
Chicago/Turabian StyleTriantakonstantis, Dimitrios, Maria Batsalia, and Nikolaos Lolos. 2024. "Spatio-Temporal Dynamics of Soil Organic Carbon Stock in Greek Croplands: A Long-Term Assessment" Sustainability 16, no. 18: 7984. https://doi.org/10.3390/su16187984
APA StyleTriantakonstantis, D., Batsalia, M., & Lolos, N. (2024). Spatio-Temporal Dynamics of Soil Organic Carbon Stock in Greek Croplands: A Long-Term Assessment. Sustainability, 16(18), 7984. https://doi.org/10.3390/su16187984