Article

Unlocking Green Patterns: The Local and Spatial Impacts of Green Finance on Urban Green Total Factor Productivity

1
School of Marxism, Anhui University, Hefei 230601, China
2
School of Law and Business, Wuhan Institute of Technology, Wuhan 430079, China
*
Author to whom correspondence should be addressed.
Sustainability 2024, 16(18), 8005; https://doi.org/10.3390/su16188005
Submission received: 15 August 2024 / Revised: 6 September 2024 / Accepted: 11 September 2024 / Published: 13 September 2024

Abstract

:
The urgency of global climate change and environmental degradation has become increasingly apparent, and green finance, as a pioneering financial tool, is providing critical support to unlock regional green patterns. Based on the data of China’s prefecture level from 2010 to 2021, this study examines the causal relationship and mechanism of green finance (GF) and urban green total factor productivity (GTFP) using the spatial Durbin model. The results show the following: (1) Green finance can not only improve local GTFP, but also has a spatial spillover effect, and it is still valid after a robustness test, which means that the development of GF can significantly promote urban green transformation. (2) The local effect and spatial spillover effect of green finance are more obvious in coastal and developed areas. (3) After deconstructing the mechanism of green transformation, this paper finds that improving urban energy utilization efficiency, mitigating the capital mismatch degree, and enhancing new quality productivity are important impact channels for green finance to enhance urban GTFP. These conclusions not only provide a theoretical reference for GF to help with the construction of a high-quality “Double Cycle” new development pattern, but also promote low-carbon transformation. This study has obvious application value and provides experience for other developing countries to seek green transformation from the perspective of green finance practice.

1. Introduction

In recent years, the world has experienced unprecedented changes in the climate system, from sea level rise and frequent extreme weather events to the rapid melting of sea ice [1,2]. The United Nations Intergovernmental Panel on Climate Change (IPCC) reports that about half of the world’s population now faces severe water shortages for at least one month of the year due to extreme weather events, while rising temperatures are exacerbating the spread of vector-borne diseases such as West Nile virus and Lyme disease. Therefore, the drive towards a sustainable transformation of regional economies is an urgent matter that must be solved without delay. One of the core methods is to promote urban green total factor productivity (GTFP) [3,4]. The GTFP takes into account not only the traditional factors of productivity, but also unexpected outputs such as energy consumption and environmental pollution, which can better reflect the coordination degree between economic and environmental sustainability. Therefore, exploring how to improve GTFP is an important engine for promoting green development, and exploring the influence path has become the focus of academics and policymakers [5,6,7].
There are two main reasons why we chose Chinese cities as our research samples. First of all, the aggressive economic expansion in China has become an important engine for the global economy; however, its growth process is accompanied by increasing ecological and environmental problems [8]. The carbon dioxide emissions from China in 2023 account for 32% of total global emissions, which reflects the severe challenge that China faces in balancing economic development and environmental protection [9]. Second, China’s green capital market is developing rapidly and has become one of the largest green finance markets in the world. According to the 2021 Annual Report on China’s Ecological and Environmental Statistics, China’s total investment in the environmental sector accounts for 0.8% of GDP [10]. Therefore, as one of the largest developing countries in the world, it is of great importance to study the impact of green finance on GTFP in the context of China, which can provide experience for the green development transformation of other developing countries.
The existing research has analyzed the causal effects on GTFP from the digital economy [11], green innovation [3], Clean air policy [12], sustainable finance [13], and other aspects. However, most studies are based on the simple linear impact on GTFP, ignoring the impact of the spatial spillover effects that arise from the externalities associated with GF [14,15]. In fact, due to the interaction between economic entities, there exists a notable spatial correlation among various regions concerning economic development, resource allocation, and pollution emissions [16]. In the regions with more developed green finance, its demonstration effect on the surrounding areas can stimulate the latter’s green development momentum and, thus, have a positive impact on the surrounding areas’ GTFP. The existence of this spatial spillover effect indicates that GF influences GTFP in a non-isolated manner through a complex spatial dynamic process. Therefore, extending the spatial impact on regional GTFP from the perspective of green finance is one of the most important motivations.
In addition, identifying the local effect of GF on GTFP and its spatial spillover effect can provide the endogenous impetus for urban green transformation. On the one hand, institutional theory holds that when organizations obey institutional pressure and follow social norms on organizational structure and process, they can obtain higher legitimacy, more resources, and stronger viability [17]. As a market-based environmental regulation, green finance can exert a kind of mandatory isomorphic pressure on organizations. This pressure encourages organizations to follow green standards and actively participate in green activities, thus promoting green transformation and the improvement of GTFP [7,18,19]. On the other hand, as an important financial tool in the low-carbon era, green finance effectively compensates for the shortcomings of traditional finance in supporting green development. It can provide capital support and a strong impetus for improving regional GTFP through its innovative products and financial services [7]. Additionally, it can impact urban GTFP by improving energy use efficiency, reducing resource mismatch, and enhancing new quality productivity, which is also another important motivation. Specifically, this paper mainly answers the following questions: (1) Can the development of GF become a catalyst to improve regional GTFP and promote regional green development transformation? (2) Is there a spatial spillover effect of green finance on urban GTFP? (3) Through what mechanism does green finance affect urban GTFP?
Therefore, using China’s prefecture-level data over the period from 2010 to 2021, this study first calculates the urban GTFP using the Super-slack-based model and analyzes the development trend of green finance from the time and space dimension. It is conducive to better playing the role of GF in upgrading the economic structure, improving energy utilization efficiency, and reducing environmental pollution [20]. Secondly, we use the spatial Durbin model to investigate the causal effect and the mechanism of GF on urban GTFP. We find that GF can significantly promote local GTFP, and there is a positive spatial spillover effect; moreover, this promotion effect is more obvious in coastal areas and developed cities. This discovery is helpful to promote the coordinated development of the regional economy and stimulate win-win cooperation between regions. Finally, we adopt mechanism tests to verify that GF can promote the improvement of urban GTFP by improving energy utilization efficiency, alleviating resource mismatch, and enhancing new quality productivity, which provides a path choice for urban China to achieve green sustainable collaborative transformation.
The marginal contribution of this paper is as follows: First, unlike the previous literature using a single index to measure GF, we extend the measure of the existing GF index. Utilizing the original measurement criteria as a foundation, this paper introduces green support, green funds, green rights and interests, and other indicators to construct a more comprehensive index of green finance at the prefecture level. Second, we consider the impact of green finance on GTFP as a complex spatial dynamic process. Based on the institutional theory, this paper unifies GF and GTFP and discusses the local and spatial spillover effect between them. While the previous literature considered the impact of green finance on GTFP as an isolated process, it only discussed the local impact and benefit of green finance on GTFP, ignoring the spatial correlation. Finally, unlike the impact channels of industrial structure upgrades in the common literature, this paper attempts to deconstruct the mechanism of green transformation from the three dimensions of energy efficiency, resource mismatch, and new quality productivity. This study also offers a theoretical exploration of the impact channels of GF on urban GTFP, and it provides a basis for relevant environmental policy formulation.
The remaining organizations are as follows: Section 2 is the literature review. Section 3 puts forward the research hypothesis based on the theoretical analysis. Section 4 is the research design; Section 5 presents the empirical results. Section 6 makes the conclusions and policy suggestions.

2. Literature Review

There are three types of literature that are closely related to this paper, which are as follows: first, the measurement of the urban green finance level; second, the potential impact of GF on economic activity; and third, the influencing factors of GTFP. Related studies have tried to reveal the potential mechanisms affecting urban GTFP. Through an in-depth analysis of the existing literature, this study aims to provide a comprehensive perspective in order to better understand how green finance can contribute to sustainable economic development.
As for the measurement of GF indicators, the existing literature mainly measures green finance from the perspective of policy and indicator measurement. From a policy perspective, the existing literature mainly examines the operation of green credit policy [21], green finance reform, and innovation pilot zone policy [22]. From the indicator measurement standpoint, most existing studies analyze GF development with single indicators and multi-indicators. For example, the GF index system is structured by adopting the percentage of green loans [23] or core indicators such as green credit [24].
In terms of research on the impact of green finance, the existing literature mainly focuses on the economic, social, and environmental effects. In terms of the economic effects, the existing literature has shown that GF can impact productivity [25], resource efficiency [26], regional development [27], and economic growth [28]. For example, Zhang and Zhao [27] found that green finance has a significant positive impact on regional economic development. In terms of the social impacts, previous research has shown that GF has the potential to impact urban employment [22], high-quality agricultural development [29], and the quality of export products [30]. For example, Xin et al. [22] found that the urban-level green finance reform policy stimulated employment growth. In terms of environmental impacts, the existing literature has shown that green innovation [23], corporate carbon emissions [7], and green energy transformation [1] are all affected by green finance. However, nearly all studies discuss the linear impact of GF, but the externality of GF determines that it is necessary to further investigate the spatial correlation when studying GF.
Although a large amount of literature has discussed the factors affecting GTFP, the existing research predominantly concentrates on macro factors, and the impact on GTFP has not been investigated from the perspective of GF. As a market-based environmental regulation, GF can exert a kind of coercive isomorphic pressure. This pressure encourages enterprises to become actively involved in green activities, driving the improvement of GTFP across the region. For example, scholars have mainly explored the impact of factors such as the digital economy [11], green innovation [3], and policies [12] on the GTFP of an economy. For example, using provincial data, Wang et al. [31] found that green technology can significantly improve GTFP. Second, in terms of the mechanism, the existing literature mostly focuses on the channel of industrial structure upgrading [32], while few research papers start from the perspective of energy efficiency and new quality productivity.
In summary, although the existing literature has produced a wealth of research on GF and GTFP, some aspects need to be further deepened. First, the existing green finance index is not sufficient to fully capture the dimension value. This system needs to be further developed to better reflect the combined role of green finance in promoting environmental sustainability and economic efficiency. Second, there is an obvious gap in the analysis of the drivers of GF on GTFP. As a market-based environmental regulation, the incentive and pressure mechanism of green finance on firms’ environmental behavior has not received sufficient academic attention. Third, most previous research concentrates on the direct linear effects of GF on GTFP, often ignoring the spatial spillover effect that may be caused by externality. Fourth, in terms of impact channels, existing studies mainly focus on the upgrading of industrial structure, but the mechanism of how green finance affects GTFP through energy efficiency and new quality productivity remains to be further explored. Therefore, it is necessary to further explore the impact and potential mechanisms of action of green finance on GTFP.

3. Theoretical Analysis and Hypotheses

Green finance is regarded as the provision of investment, financing, and other financial services for projects with environmental protection purposes [33]. Based on the regulatory and financial effects of green finance, this paper proposes that it can significantly improve regional GTFP. From the perspective of the regulatory effect and institutional theory, green finance can exert a mandatory isomorphic power on organizations, thus promoting the development of green activities [17,34,35]. From the perspective of the financial effect, green finance, as a crucial financial tool leading to the low-carbon era, can compensate for the shortcomings of traditional finance and improve regional GTFP [36]. In addition, due to the exchanges and interactions, spatially related regions influence each other in terms of economic development, resource allocation, and pollution emission. Regions with similar economic backgrounds can stimulate the growth of GTFP through imitation. The cities with better development of green finance can have a demonstration effect on the surrounding regions and stimulate the development of green finance in the surrounding regions. As a result, the GTFP of the surrounding area is improved. Thus, we propose the following hypothesis:
H1: 
GF has the potential to improve the GTFP in local cities and also has a positive spatial spillover effect.
Improving energy use efficiency is a critical driver to promote urban GTFP [37]. Green finance aims to support green projects such as clean energy, energy efficiency improvement, and environmental protection [38]. We suggest that GF significantly influences urban GTFP by improving the efficiency of energy use. First, green finance provides financial support for renewable energy projects, which can reduce the dependency on traditional energy sources and effectively improve energy use efficiency. Second, green finance provides financial support for reducing energy waste and promoting energy storage technologies by providing financing tools such as low-cost green loans and green bonds, thus further improving energy use efficiency [30]. In addition, the energy efficiency improvement effect caused by green finance can also play an exemplary role in the region, stimulating the imitation and follow-up of the surrounding areas in energy efficiency improvement and forming a positive regional spatial spillover effect. Such spillovers not only contribute to the sustainable development of the regional economy, but also provide impetus for the achievement of broader environmental and social goals. Thus, we propose the following hypothesis:
H2: 
GF has the potential to improve the GTFP in both local and neighboring cities by improving urban energy utilization efficiency.
Resource allocation is the core function of financial institutions, and it determines the capital effective use and healthy development of the economy [32]. This paper argues that GF alleviates resource misallocation by optimizing resource allocation. Compared with traditional finance, GF can more effectively compensate for the shortcomings of traditional financial services [39]. It effectively solves the problem of resource misallocation by utilizing various modern financial tools such as Internet financial platforms and mobile payment. It can also provide the necessary financial services to guide the flow of capital into sustainable development. This kind of capital flow promotes the introduction of new technologies and the development of green activities and provides substantial financial support for the improvement of GTFP in other regions. Moreover, as the degree of marketization increases, the positive role of green finance in reducing resource misallocation is not limited to the local area, but can also gradually spill over into the surrounding areas through talent flows, technical exchanges, and information sharing. Such positive interregional spillovers could stimulate broader economic activity and environmental improvements. Thus, we propose the following hypothesis:
H3: 
GF has the potential to improve the GTFP in both local and neighboring cities by reducing resource misallocation.
New quality productivity represents a high level of modern ability, which is characterized by a higher technological level, better performance, more efficient resource use, and stronger sustainability [40]. This paper aims to explore how green finance can improve urban GTFP by promoting new quality productivity. Green finance has shown great innovation potential in promoting market-scale expansion, product innovation, optimizing participant structure, and supporting green development strategies. The research about green financial products not only meets the diversified capital needs of new quality productivity in technology research and project construction, but also brings solid financial support and guarantee by promoting the deep integration and efficient use of data and ecological factors [41]. Moreover, the development of new quality productivity is crucial for the construction of regional industrial chains and industrial clusters. This development not only promotes industrial synergy and resource sharing within the region, but also drives the green transformation of the surrounding cities through interregional synergy, thus improving the GTFP. The formation of this regional industrial chain and cluster has promoted economic activities and environmental improvements within and outside of the cities. Thus, we propose the following hypothesis:
H4: 
GF has the potential to improve the GTFP in both local and neighboring cities by enhancing new quality productivity.

4. Research Design

4.1. Econometric Model

4.1.1. Baseline Regression Model

The spatial econometric models in the existing literature include the spatial Durbin model (SDM), the spatial autoregressive model (SAR), and the spatial error model (SEM). Among them, the SDM combines the characteristics of the SAR and the SEM and considers the spatial correlation of dependent variables and independent variables. Therefore, to verify Hypothesis 1 in this paper, referring to Hunjra et al. [3] and Wang and Guo [42], we use the SDM for this baseline regression, as follows:
G T F P i t = α 0 + α 1 W G T F P i t + α 2 W G f i t + α 3 W X i t + β 1 G f i t + β 2 X i t + λ i + μ t + ε i t
where G T F P i t is the green total factor productivity of city i in year t; α 1 is the spatial autocorrelation coefficient; W represents the spatial weight matrix, and the geographical distance and economic weight matrix are used in the benchmark regression; G f i t is the green finance level; X i t are the control variables; λ i   a n d   μ t are the individual and time-fixed effect terms, respectively; and ε i t is the random disturbance term.

4.1.2. Mechanism Analysis Model

M i t = α 0 + α 1 W l n G T F P i t + α 2 W G f i t + α 3 W l n X i t + β 1 G f i t + β 2 l n X i t + λ i + μ t + ε i t
where the M i t represents the mechanism variable, including energy utilization efficiency, resource mismatch degree, new quality productivity level, and the other variables, which are the same as above.

4.2. Variable

4.2.1. Independent Variable

Although single-indicator methods are commonly adopted in GF development studies, they still face limitations and are not sufficient to comprehensively and deeply capture the multidimensional value of green finance. Therefore, based on the research of Huang et al. [20] and Zhao [7], this paper further expands the indicator system to build a more comprehensive and detailed green finance indicator system. The system not only covers the four core areas, such as green credit, but also innovatively introduces green support, green funds, and green rights and interests, as shown in Figure 1, to more comprehensively capture the multi-dimension aspect of GF. Based on this index system, the entropy method is used to measure the GF development level at the prefecture level in China.

4.2.2. Dependent Variable

The studies on efficiency evaluation mainly use two methods, namely, stochastic boundary analysis (SFA) and data-enveloping analysis (DEA). Compared with SFA, the DEA method only needs a linear programming model to evaluate whether the decision-making unit (DMU) is relatively efficient, and it is a non-parametric method that does not consider the form of production function. Traditional DEA methods have radial and angular restrictions, leading to biased results. To address this issue, Tone [43] proposed a non-radial and non-angular SBM. However, for multiple DMUs with the same efficiency value, the SBM cannot be further compared. To overcome this limitation, Tone [44] proposed a Super-SBM to realize effective comparison and ranking of DMU efficiency values. The Super-SBM is mainly used to consider static efficiency. To further examine the dynamic change process of efficiency in time series, regarding Li and Chen [45], we adopted the Malmquist index combined with the Super-SBM to measure the GTFP. The input indicators in the calculation process include capital, labor, and energy; the anticipated output variable is the economic growth; and the unanticipated output indicators include industrial SO2 emissions, solid waste emissions, and industrial wastewater emissions. The specific model is presented below, as follows:
ρ * = min x μ 1 q + w i = 1 n y g r y g r k + i = 1 n y b μ y b μ k
s . t . X ¯ i i = 1 , 0 n λ i X i + S i , j = 1 , , m Y ¯ g r r = 1 , 0 n λ r Y i g S r g , r = 1 , , q Y ¯ g u = 1 , 0 n λ u Y u S u b , μ = 1 , , w X ¯ i X i k , Y ¯ r g Y r k g , Y ¯ u b Y u k b λ 0 , i = 1 , 0 n λ i = 1 , r = 1 , 0 n λ r = 1 , u = 1 , 0 n λ u = 1 ,
M a l m q u i s t = D t x t + 1 , y t + 1 g , y t + 1 b D t x t , y t g , y t b × D t + 1 x t + 1 , y t + 1 g , y t + 1 b D t + 1 x t , y t g , y t b 1 / 2
where ρ * is the efficiency value of the evaluated DMU; X i is the ith input; Y ¯ g r is the rth expected output; Y u is the u undesired output; S i , S r g , and S u b are relaxation vectors of the input, expected output, and non-expected output, respectively; and λ is the weight vector. The lines above the letters represent the projected values corresponding to the inputs or outputs in the model. The Malmquist index represents the dynamic efficiency index, reflecting the state of the efficiency value of DMU between the t period and the t + 1 period.

4.2.3. Other Control Variables

To mitigate the endogeneity problems caused by missing variables as much as possible, this paper controls for the variables that may affect the GTFP at the city level. Referring to Gao et al. [5] and Tian and Zhang [46], the following control variables are considered: (1) the city economic level (Loed), where the GDP of each city is measured using logarithmic processing; (2) the industrial structure index (Isr), where the Thiel index is used to measure it; (3) the technology investment level (Rg), which is measured using the ratio of the annual R&D expenditure to the GDP; (4) the environmental regulation intensity (Erc), which is ratio of the environmental vocabulary to the word frequency of reports published by prefecture-level city government; (5) the urban financial development level (Ufd), which is measured using the proportion of financial institutions’ deposits and loans to the GDP; and the fiscal decentralization (Fdc), which is measured using the proportion of public finance revenue to public finance expenditure.

4.2.4. Mechanism Variables

The mechanism variables of this paper are energy efficiency, resource mismatch, and new quality productivity. Among them, energy use efficiency is measured using the GDP per unit of energy consumption, according to Zaidi et al. [47]. The degree of resource mismatch is measured using the capital mismatch index, according to Gao et al. [48]. This paper constructs a comprehensive index system for the development level of new quality productivity from multiple dimensions and adopts the entropy weight method to measure the development level of new quality productivity following Liu and He [40].

4.3. Data Source

This study examines the impact of green finance on the GTFP for Chinese cities from 2010 to 2021. All of the data are obtained from national and provincial statistical yearbooks, such as the China Science and Technology Statistical Yearbook and the China Energy Statistical Yearbook. Following Li and Chen [45], we first select all cities in China as the target, however, due to the availability of data, some cities may suffer from serious data shortages. Therefore, we eliminate the samples with severe missing data to ensure data quality. To avoid the influence of outliers on the research results, we winsorize all variables by 1%. In the end, 230 urban samples were sorted out, resulting in a final data count of 2760. The mean value of the urban GTFP is 0.650 and the standard deviation is 0.319, indicating that there are some differences in the cities. The mean value of the GF index is 0.327, the standard deviation is 0.978, and the degree of volatility is different in different regions. The descriptive statistics of the data used in this paper are shown in Table 1.

5. Empirical Results

Before the empirical study of how GF affects urban GTFP, the analysis of its spatiotemporal evolution pattern is an indispensable step. The spatial–temporal trend of the GF index is shown in Figure 2, which compares the development in various prefecture-level cities in 2010, 2013, 2016, and 2020. From a time perspective, the color and change area of the four charts gradually deepens over time, indicating that the GF is in a continuous good trend from the perspective of development depth and breadth. From a spatial perspective, the central and eastern cities have a stronger development momentum and a faster diffusion rate, while the western region has a weaker growth momentum.

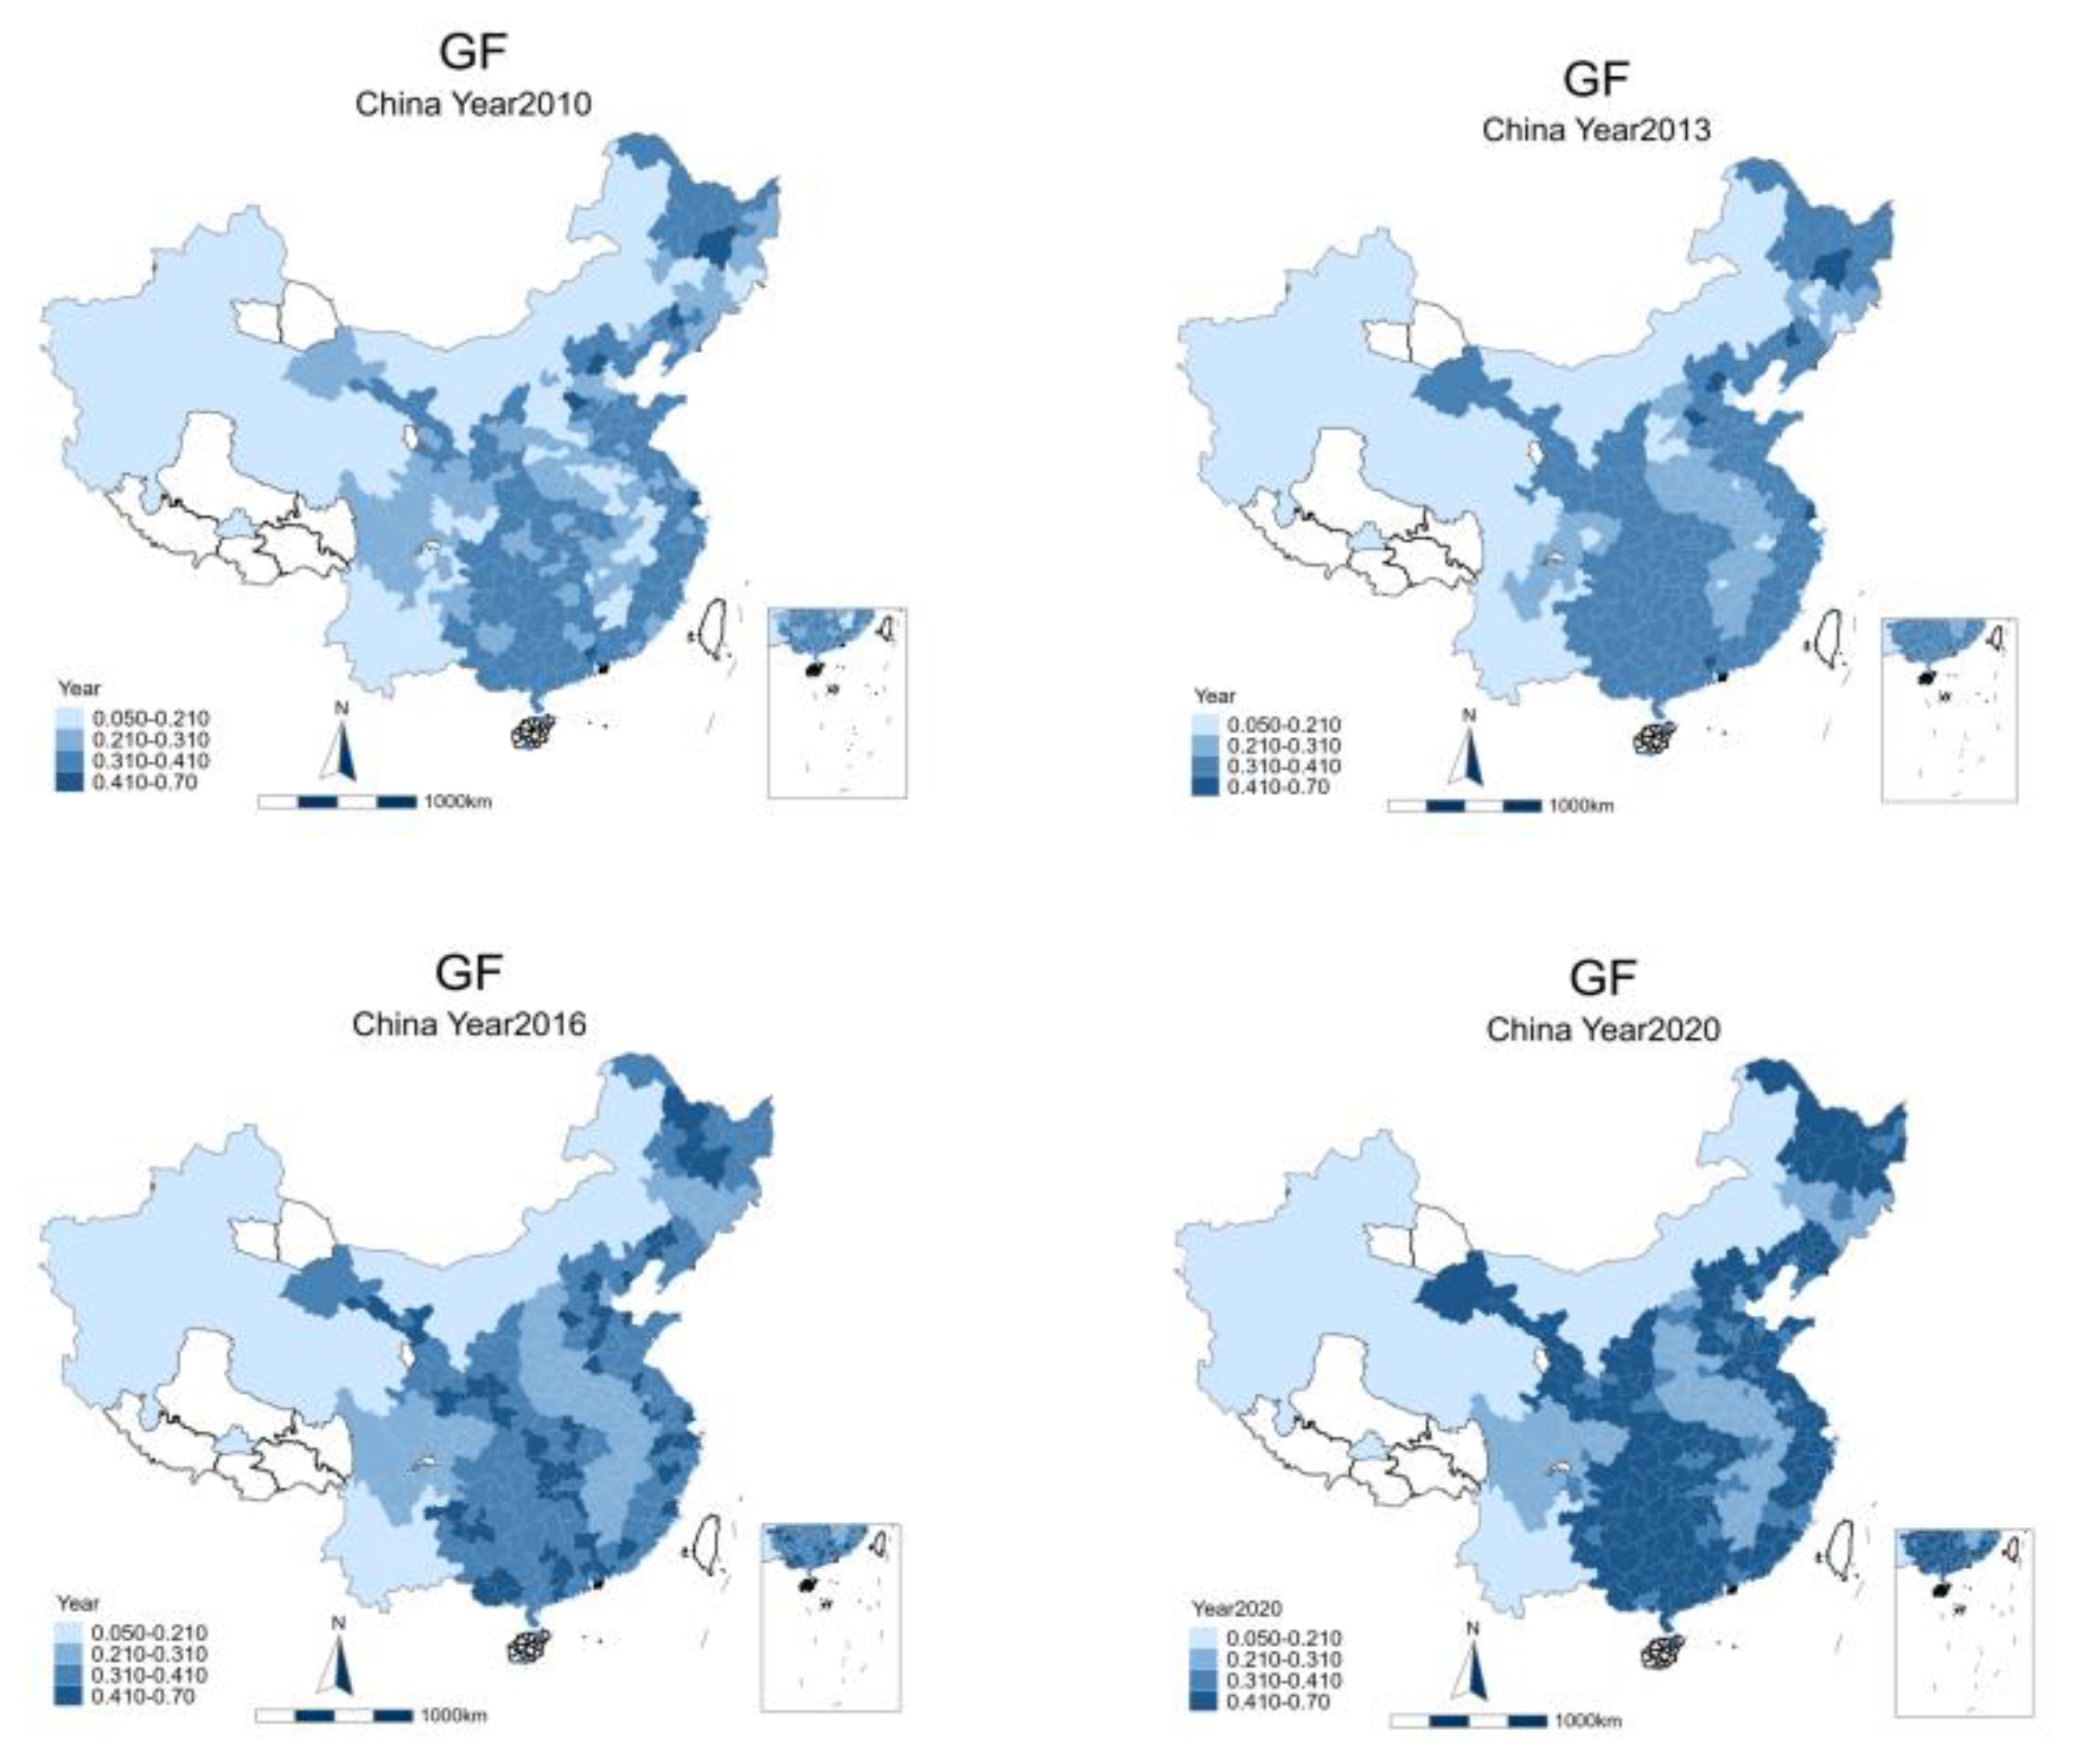
5.1. Spatial Correlation Analysis

The spatial correlation of the data needs to be assessed using the global Moran index. The spatial econometric model can only be applied when the data exhibit significant spatial correlation, as follows:
I = n i = 1 n j = 1 n W i j Y i Y ¯ Y j Y ¯ i = 1 n j = 1 n W i j i = 1 n Y i Y ¯ 2
The results of the spatial spillover effect test are shown in Table 2. The results show that the Moran I index values are all greater than 0, and all are significant at the level of 1%. This shows that the green development level of cities presents a significant positive spatial correlation, that is, the GTFP of each city presents a high-high, low-low cluster situation. Moreover, it can be seen from the table that the value of the index has been increasing from 2010 to 2021, indicating that this spatial correlation has gradually increased over time.

5.2. Benchmark Regression

The benchmark regression results are outlined in Table 3, where Columns (1)–(3) are the regression results using the geographical distance matrix and Columns (4)–(6) using the economic weight matrix. The regression results show that the spatial autocorrelation coefficients of the GTFP are significantly greater than 0, indicating that the GTFP has a spatial spillover effect. The results of Columns (1)–(6) indicate that both the general and spatial regression coefficients for GF are significantly positive, irrespective of whether the geographical distance matrix or the economic weight matrix is adopted. This implies that GF exerts a direct facilitating impact on urban GTFE, coupled with a positive spatial spillover effect; therefore, Hypothesis 1 is valid, and this result aligns with Yue et al. [36]. The potential reasons may be that GF can compensate for the shortcomings of traditional finance, promote green development, and inject capital to improve the GTFP. At the same time, the economic interaction among spatially related regions promotes the imitation and improvement of green productivity in similar regions, and the demonstration effect of developed GF regions drives the development of the surrounding areas to jointly improve the GTFP.
Given that the estimated results may be affected by spatial lag terms, this paper further explores the direct and indirect effects of green finance on urban GTFE. Of these, the direct effect captures the local influence of GF on the GTFP, while the indirect effect reflects the influence that extends to related regions. Table 4 displays the decomposition results, which reveal that GF has both significant direct and indirect positive effects, indicating that GF helps to improve the GTFP of both the local area and the related regions, a conclusion similar to that of Feng et al. [32].

5.3. Mechanism Analysis

We attempt to use Model (2) to investigate the impact channels of energy use efficiency, resource mismatch, and new quality productivity. Column (1) in Table 5 shows the mechanism test result of energy use efficiency, which shows that the spatial regression coefficient of GF on energy use efficiency is significantly positive, indicating that GF can improve energy use efficiency and improve the GTFP of local and surrounding cities. Hypothesis 2 is valid. This is similar to the conclusion reached by Lee et al. [49]. The reason for this result may be that GF can help the development of clean energy, reduce dependency on traditional energy sources, and improve energy efficiency. At the same time, low-cost financing is provided to support the research and development of energy-saving and energy-storage technologies to enhance energy efficiency. Its demonstration effect drives the improvement of green finance and energy utilization efficiency in the surrounding areas, forming a spatial spillover effect.
Column (2) shows the regression result of the resource mismatch effect, which shows that the local and spatial regression coefficient of green finance on resource mismatch are both significantly negative, that is, GF alleviates the urban resource mismatch and exerts a positive influence on the GTFP of local and surrounding cities. Hypothesis 3 is valid. This conclusion is similar to that of Nepal et al. [50]. The reason for this result is that green finance fills the gap of traditional finance, optimizes resource allocation through internet platforms and other channels, finances environmental protection projects, and improves the GTFP. Under the role of marketization, its positive influence is transmitted to the surrounding areas through the flow of talent, technology, and information. It also holds the potential to encourage the sustainable development of the surrounding areas.
Column (3) shows the regression result of new quality productivity, which shows that the local and spatial regression coefficient of green finance on new quality productivity are significantly positive, i.e., green finance promotes the GTFP of local and surrounding cities by improving the level of new quality productivity. Hypothesis 4 is valid. The reason for this result may be that green finance can create a market environment for new quality productivity, promote product innovation, meet diversified capital needs, and promote the integration of data and ecology. Its development drives industrial chain clusters, enhances regional cooperation and resource sharing, promotes green transformation, and improves the GTFP in local and surrounding regions.

5.4. Robustness Test

5.4.1. Replacement Estimation Model

Considering that economic and social development has a certain inertia, this paper refers to Hunjra et al. [3] and adds a one-stage lag of GTFP to Equation (1) to build a dynamic spatial Durbin model. As presented in Column (1) of Table 6, the results indicate that the local and spatial regression coefficients of GF are significantly positive at significance levels of 5% and 1%, respectively. This result indicates that the promoting effect of green finance on urban GTFP still exists after controlling the lag of GTFP for one stage.

5.4.2. Replacement Weight Matrix

Although we have controlled as much as possible for other factors influencing GTFP in our benchmark model, we have considered that different spatial weight matrices may have an impact. Therefore, this paper refers to Yu et al. [51] and Hunjra et al. [3]. For the regression, the weight matrix is replaced by the geographical adjacency matrix and the economic distance matrix, which are shown in Columns (2) and (3). This shows that, after replacing the spatial weight matrix, the local and spatial coefficients of GF on urban GTFP are positive, which is consistent with the benchmark regression results.

5.4.3. Exclusion of Special Samples

To account for the exogenous effect of the COVID-19 epidemic, this paper excludes the 2020 data from the samples and re-runs the regression. The regression results are reported in Column (4) of Table 6. The regression results show that the autoregressive coefficient of the GTFP is significantly positive at the 1% significance level; in addition, the local regression and the spatial regression coefficient of GF on urban GTFP are significant, respectively, which reconfirms the baseline result.

5.5. Heterogeneity Test

Considering the differences between cities caused by multiple factors, we conduct heterogeneity tests at the regional level. Based on geographical location and economic level, the selected cities were classified into inland and coastal cities, mainly according to whether the city’s administrative area includes a coastline. In addition, based on the city classification table published by China Financial News in 2018, the first three types of cities in the classification table are classified as developed cities, and the last three types of cities in the classification table are defined as developing cities, according to Li et al. [52]. Furthermore, the grouping regression analysis method is used to reveal the heterogeneity of GTFP development in different regional cities. The statistical results of grouping regression are shown in detail in Table 7, which provides an empirical basis for understanding the regional differences in GF impacting GTFP among cities.
Columns (1) and (2) of Table 7 show the results of inland and coastal cities. The regression results show that GF has no statistical significance on the GTFP of inland cities, while the regression coefficient of the GTFP of coastal cities is significantly positive at the 1% significance level. That is, green finance can only positively promote the GTFP of coastal cities in local and spatial ways. This result may be because coastal cities have more mature and open capital markets, a freer innovation environment, and better resource endowments. The superposition of these factors makes green finance better serve coastal cities with a greater openness than inland cities.
Columns (3) and (4) in Table 7 show the regression results of developed cities and developing cities, respectively. The regression results show that GF has no statistical significance on the GTFP of developing cities, while it is significantly positive for developed areas. In other words, GF can only positively promote the GTFP of developed cities. The reason for this result may be that developed regions possess a more advanced level of economic growth and scientific and technological basic conditions, which will have a strong siphon effect on the capital, talent, and resources in cities such as Beijing, Shanghai, Shenzhen, and other regions, which makes developed cities have a more advanced environmental protection system and a faster green transformation speed. Therefore, compared with developing cities, green finance plays a more significant role in promoting the GTFP in developed cities.

6. Conclusions and Policy Implication

This study applies the Super-SBM-Malmquist model to measure the GTFP of 230 prefecture-level cities from 2010 to 2021. We further quantitatively analyze the impact of GF on GTFP, including the local effect and spatial spillover effect, and thoroughly discuss its potential mechanism. The results clearly show that GF can significantly influence urban GTFP, which is not only reflected in the direct improvement of local cities’ GTFP, but also has a positive external impact on neighboring cities by strengthening economic ties. In addition, by further deconstructing the mechanism, we also obtain the impact path of green finance on urban GTFP, that is, improving energy efficiency, optimizing resource allocation, and stimulating new quality productivity are key factors for GF to promote urban GTFP. Moreover, heterogeneity analysis indicates that GF contributes more significantly to the GTFP in coastal and developed cities. This phenomenon may be closely related to the higher degree of marketization, better financial systems, and greater environmental awareness in these regions.
Although this paper has examined the local impact of green finance on urban GTFP and its spatial spillover effect, it further explores the impact channels from the perspective of energy use efficiency, resource mismatch level, and new quality productivity. However, the impact of green finance on GTFP may also be influenced by many factors, such as renewable energy technology innovation, public environmental concern, etc. Future studies can further explore other possible pathways. In addition, the impact of green finance on GTFP may also be influenced by other policies, such as the pilot policy of green finance reform and the innovation pilot zone, and heterogeneous environmental regulations may have an impact on urban GTFP. Future studies should explore the role of green-finance-related policies on urban green transformation from the perspective of environmental regulation intensity in order to improve relevant studies on green finance.
The conclusions of this paper firstly enrich the theoretical system related to green finance and provide a theoretical reference for green finance to help to build a new development pattern of high-quality “Double Cycle” and promote regional green and low-carbon transformation. Secondly, from the perspective of sustainable development, this conclusion not only sets a benchmark for China’s green development path, but also provides valuable experience for other developing countries in the process of green transformation. Finally, from the perspective of policy formulation, the research results of this paper can provide a useful reference for the government in formulating green finance policies, help to optimize the design of green finance policies, promote the accurate implementation of policies, and, thus, accelerate the sustainable development process of the global green economy. Therefore, some relevant policy implications can be made, as follows:
First, strengthening the construction and improvement of the GF policy system is essential. Given the fact that GF can improve urban GTFP and drive the evolution of urban areas towards green development, the government should introduce more specific and detailed GF policies and clarify the goals, ways, and safeguards for the development of green finance. In addition, the government should establish a sound legal and regulatory system for green finance to provide a sound legal guarantee for the healthy development of green finance. The government should improve the regulatory mechanism for green finance to ensure compliance and risk control in green finance enterprises.
Second, improving energy efficiency, alleviating resource misallocation, and improving new quality productivity are the key paths for GF to promote urban GTFP. Therefore, the government should encourage the adoption of eco-friendly technologies, enhance energy efficiency, and reduce resource waste. Simultaneously, through the means of GF to alleviate the problem of resource mismatch, they should promote the reasonable flow and efficient allocation of production factors in the region and provide strong support for the development of new quality productivity. In addition, industrial collaboration and resource sharing between regions should be strengthened to promote the emergence of green industrial chains and improve the GTFP.
Third, supporting the improvement of the new quality productivity development is also important. The new quality productivity represents the development direction of advanced productivity generated by the revolutionary breakthrough of technology, the innovative allocation of production factors, and the deep transformation and upgrading of industries. Based on the research conclusion of this paper, green finance can improve new quality productivity and promote the GTFP in local and surrounding cities. Therefore, under the premise of controllable risks, credit allocation should be reasonable, according to the macroeconomic development situation, and policy preferences should be given in credit approval, post-loan management, and credit pricing of green credit to promote more resource to flow into green and low-carbon fields.
Fourth, considering that the effect of GF on GTFP has differentiated effects due to different geographical locations and economic development levels, this study suggests that differentiated GF policies should be formulated and implemented according to cities with different geographical locations and economic development levels. Specifically, coastal and economically developed cities should make full use of their economic and technological advantages and strengthen the deep integration of green finance with scientific and technological innovation and industrial upgrading to form a demonstration effect, and then drive the green transformation and sustainable development of the surrounding and economically underdeveloped areas. At the same time, the monitoring and evaluation of the implementation effects of green finance policies should be strengthened to ensure the effectiveness and adaptability of policies to respond to changing economic and environmental conditions.
Finally, the government should encourage financial institutions to innovate green financial products, promote financial institutions to optimize green credit approval processes, improve approval efficiency, and reduce financing costs. At the same time, it is necessary to strengthen the cooperation and exchange of GF among different regions and jointly explore new models and paths for the development of GF to achieve optimal allocation and the sharing of green financial resources through regional cooperation.

Author Contributions

Conceptualization, L.T. and J.X.; methodology, L.T. and J.X.; software, D.G.; validation, L.T., J.X. and D.G.; formal analysis, J.X.; investigation, L.T.; resources, D.G.; data curation, J.X.; writing—original draft preparation, L.T.; writing—review and editing, J.X.; visualization, D.G.; supervision, J.X.; project administration, D.G.; funding acquisition, D.G. All authors have read and agreed to the published version of the manuscript.

Funding

This research was funded by [Communication Dynamics and Guidance of Human Destiny Community Based on Network Public Opinion Big Data] grant number [2023AH050030] And The APC was funded by [Anhui Province Philosophy and Social Sciences Key project].

Institutional Review Board Statement

Not applicable.

Informed Consent Statement

Not applicable.

Data Availability Statement

The data presented in this study are available on request from the corresponding author.

Conflicts of Interest

The authors declare no conflict of interest.

References

  1. Chen, D.; Hu, H.; Wang, N.; Chang, C.P. The impact of green finance on transformation to green energy: Evidence from industrial enterprises in China. Technol. Forecast. Soc. Chang. 2024, 204, 123411. [Google Scholar] [CrossRef]
  2. Tan, L.; Gao, D.; Liu, X. Can Environmental Information Disclosure Improve Energy Efficiency in Manufacturing? Evidence from Chinese Enterprises. Energies 2024, 17, 2342. [Google Scholar] [CrossRef]
  3. Hunjra, A.I.; Zhao, S.; Tan, Y.; Bouri, E.; Liu, X. How do green innovations promote regional green total factor productivity? Multidimensional analysis of heterogeneity, spatiality and nonlinearity. J. Clean. Prod. 2024, 467, 142935. [Google Scholar] [CrossRef]
  4. Wang, P.; Xue, W.; Wang, Z. Fog and haze control and enterprise green total factor productivity-evidence from China. Financ. Res. Lett. 2024, 65, 105561. [Google Scholar] [CrossRef]
  5. Gao, D.; Zhou, X.; Liu, X. The Bright Side of Uncertainty: The Impact of Climate Policy Uncertainty on Urban Green Total Factor Energy Efficiency. Energies 2024, 17, 2899. [Google Scholar] [CrossRef]
  6. Gao, D.; Zhou, X.; Mo, X.; Liu, X. Unlocking sustainable growth: Exploring the catalytic role of green finance in firms’ green total factor productivity. Environ. Sci. Pollut. Res. 2024, 31, 14762–14774. [Google Scholar] [CrossRef]
  7. Zhao, J. Impact of green finance on low-carbon transformation: Spatial spillover effects in China. N. Am. J. Econ. Financ. 2024, 74, 102202. [Google Scholar] [CrossRef]
  8. Zhang, Z.; Zhang, L. Government green procurement policies and corporate green total factor productivity. Financ. Res. Lett. 2024, 65, 105556. [Google Scholar] [CrossRef]
  9. Gao, L.; Huang, R. Digital transformation and green total factor productivity in the semiconductor industry: The role of supply chain integration and economic policy uncertainty. Int. J. Prod. Econ. 2024, 274, 109313. [Google Scholar] [CrossRef]
  10. Fan, L.; Peng, B.; Lin, Z.; Zou, H.; Du, H. The Effects of Green Finance on Pollution and Carbon Reduction: Evidence from China’s Industrial Firms. Int. Rev. Econ. Financ. 2024, 95, 103490. [Google Scholar] [CrossRef]
  11. Lian, Y.; Dong, H.; Cao, H. The effect of digital economy and environmental regulation on green total factor productivity: Evidence from China. Glob. Financ. J. 2024, 62, 101010. [Google Scholar] [CrossRef]
  12. Zhou, L.; Fan, J.; Hu, M.; Yu, X. Clean air policy and green total factor productivity: Evidence from Chinese prefecture-level cities. Energy Econ. 2024, 133, 107512. [Google Scholar] [CrossRef]
  13. Lee, C.C.; Lee, C.C. How does green finance affect green total factor productivity? Evidence from China. Energy Econ. 2022, 107, 105863. [Google Scholar] [CrossRef]
  14. Lin, J.; Zhang, L.; Dong, Z. Exploring the effect of green finance on green development of China’s energy-intensive industry—A spatial econometric analysis. Resour. Environ. Sustain. 2024, 16, 100159. [Google Scholar] [CrossRef]
  15. Guo, Q.T.; Dong, Y.; Feng, B.; Zhang, H. Can green finance development promote total-factor energy efficiency? Empirical evidence from China based on a spatial Durbin model. Energy Policy 2023, 177, 113523. [Google Scholar] [CrossRef]
  16. Zhang, H.; Geng, C.; Wei, J. Coordinated development between green finance and environmental performance in China: The spatial-temporal difference and driving factors. J. Clean. Prod. 2022, 346, 131150. [Google Scholar] [CrossRef]
  17. Tina Dacin, M.; Goodstein, J.; Richard Scott, W. Institutional theory and institutional change: Introduction to the special research forum. Acad. Manag. J. 2002, 45, 45–56. [Google Scholar] [CrossRef]
  18. Zhao, C. Is low-carbon energy technology a catalyst for driving green total factor productivity development? The case of China. J. Clean. Prod. 2023, 428, 139507. [Google Scholar] [CrossRef]
  19. Zhao, X.; Benkraiem, R.; Abedin, M.Z.; Zhou, S. The charm of green finance: Can green finance reduce corporate carbon emissions? Energy Econ. 2024, 134, 107574. [Google Scholar] [CrossRef]
  20. Huang, Y.; Chen, C.; Lei, L.; Zhang, Y. Impacts of green finance on green innovation: A spatial and nonlinear perspective. J. Clean. Prod. 2022, 365, 132548. [Google Scholar] [CrossRef]
  21. Song, X.; Zhang, L.; Ren, S. How does green credit affect industrial green transformation? Mechanism discussion and empirical test. Heliyon 2024, 10, e33312. [Google Scholar] [CrossRef] [PubMed]
  22. Xin, B.; Zhou, L.; Gonzalez, E.D.S. Does green finance reform hit urban employment?—Evidence from China’s green finance pilot policy. Cities 2024, 152, 105239. [Google Scholar] [CrossRef]
  23. Shi, R.; Zhou, H.; Li, X.; Zhao, X. Green finance, investor preferences, and corporate green innovation. Financ. Res. Lett. 2024, 66, 105676. [Google Scholar] [CrossRef]
  24. Wang, C.; Qiu, J.; Chen, B.; Deng, X. Green finance, green culture and corporate green management innovation: Evidence from Chinese listed companies. Financ. Res. Lett. 2024, 67, 105774. [Google Scholar] [CrossRef]
  25. Lin, T.X.; Li, L.; Padhan, H.; Pruseth, S.K.; Patel, G.; Haouas, I. The impact of green finance funds on industrial productivity cycles: Evidence from developing economies. Technol. Forecast. Soc. Chang. 2024, 208, 123706. [Google Scholar] [CrossRef]
  26. Yi, H.; Hao, L.; Liu, A.; Zhang, Z. Green finance development and resource efficiency: A financial structure perspective. Resour. Policy 2023, 85, 104068. [Google Scholar] [CrossRef]
  27. Zhang, T.; Zhao, F. A study on the relationships among green finance, environmental pollution and economic development. Energy Strategy Rev. 2024, 51, 101290. [Google Scholar] [CrossRef]
  28. Yin, X.; Xu, Z. An empirical analysis of the coupling and coordinative development of China’s green finance and economic growth. Resour. Policy 2022, 75, 102476. [Google Scholar] [CrossRef]
  29. Yuan, X.; Zhang, J.; Shi, J.; Wang, J. What can green finance do for high-quality agricultural development? Fresh insights from China. Socio-Econ. Plan. Sci. 2024, 94, 101920. [Google Scholar] [CrossRef]
  30. Ma, D.; Zhu, Y.; Yang, Y. How Green finance affects export production quality: Fresh evidence from China. Energy Econ. 2024, 131, 107381. [Google Scholar] [CrossRef]
  31. Wang, H.; Cui, H.; Zhao, Q. Effect of green technology innovation on green total factor productivity in China: Evidence from spatial durbin model analysis. J. Clean. Prod. 2021, 288, 125624. [Google Scholar] [CrossRef]
  32. Feng, C.; Zhong, S.; Wang, M. How can green finance promote the transformation of China’s economic growth momentum? A perspective from internal structures of green total-factor productivity. Res. Int. Bus. Financ. 2024, 70, 102356. [Google Scholar] [CrossRef]
  33. Wei, N. Green finance, market integration, and regional economic resilience. Financ. Res. Lett. 2024, 67, 105777. [Google Scholar] [CrossRef]
  34. Wu, J.; Xia, Q.; Li, Z. Green innovation and enterprise green total factor productivity at a micro level: A perspective of technical distance. J. Clean. Prod. 2022, 344, 131070. [Google Scholar] [CrossRef]
  35. Chai, S.; Zhang, K.; Wei, W.; Ma, W.; Abedin, M.Z. The impact of green credit policy on enterprises’ financing behavior: Evidence from Chinese heavily-polluting listed companies. J. Clean. Prod. 2022, 363, 132458. [Google Scholar] [CrossRef]
  36. Yue, H.; Zhou, Z.; Liu, H. How does green finance influence industrial green total factor productivity? Empirical research from China. Energy Rep. 2024, 11, 914–924. [Google Scholar] [CrossRef]
  37. Jiang, Y.; Guo, Y.; Bashir, M.F.; Shahbaz, M. Do renewable energy, environmental regulations and green innovation matter for China’s zero carbon transition: Evidence from green total factor productivity. J. Environ. Manag. 2024, 352, 120030. [Google Scholar] [CrossRef] [PubMed]
  38. Chen, F.; Zeng, X.; Guo, X. Green finance, climate change, and green innovation: Evidence from China. Financ. Res. Lett. 2024, 63, 105283. [Google Scholar] [CrossRef]
  39. Xiao, Y.; Chen, K. Green finance, natural resource dependence and environmental quality: Evidence from China. Resour. Policy 2024, 92, 104977. [Google Scholar] [CrossRef]
  40. Liu, Y.; He, Z. Synergistic Industrial Agglomeration, New Quality Productive Forces and High-quality Development of the Manufacturing Industry. Int. Rev. Econ. Financ. 2024, 94, 103373. [Google Scholar] [CrossRef]
  41. Su, X.; Qiao, R.; Xu, S. Impact of green finance on carbon emissions and spatial spillover effects: Empirical evidence from China. J. Clean. Prod. 2024, 457, 142362. [Google Scholar] [CrossRef]
  42. Wang, J.; Guo, D. Siphon and radiation effects of ICT agglomeration on green total factor productivity: Evidence from a spatial Durbin model. Energy Econ. 2023, 126, 106953. [Google Scholar] [CrossRef]
  43. Tone, K. A slacks-based measure of efficiency in data envelopment analysis. Eur. J. Oper. Res. 2001, 130, 498–509. [Google Scholar] [CrossRef]
  44. Tone, K. A slacks-based measure of super-efficiency in data envelopment analysis. Eur. J. Oper. Res. 2002, 143, 32–41. [Google Scholar] [CrossRef]
  45. Li, Y.; Chen, Y. Development of an SBM-ML model for the measurement of green total factor productivity: The case of pearl river delta urban agglomeration. Renew. Sustain. Energy Rev. 2021, 145, 111131. [Google Scholar] [CrossRef]
  46. Tian, X.; Zhang, H. Analysis of the impact factors of industrial structure upgrading on green total factor productivity from the perspective of spatial spillover effects. Heliyon 2024, 10, e28660. [Google Scholar] [CrossRef]
  47. Zaidi SA, H.; Ashraf, R.U.; Khan, I.; Li, M. Impact of natural resource depletion on energy intensity: Moderating role of globalization, financial inclusion and trade. Resour. Policy 2024, 94, 105112. [Google Scholar] [CrossRef]
  48. Gao, D.; Feng, H.; Cao, Y. The spatial spillover effect of innovative city policy on carbon efficiency: Evidence from China. Singap. Econ. Rev. 2024, 1–23. [Google Scholar] [CrossRef]
  49. Lee, C.C.; Wang, C.S.; He, Z.; Xing, W.W.; Wang, K. How does green finance affect energy efficiency? The role of green technology innovation and energy structure. Renew. Energy 2023, 219, 119417. [Google Scholar] [CrossRef]
  50. Nepal, R.; Liu, Y.; Wang, J.; Dong, K. How does green finance promote renewable energy technology innovation? A quasi-natural experiment perspective. Energy Econ. 2024, 134, 107576. [Google Scholar] [CrossRef]
  51. Yu, D.; Li, X.; Yu, J.; Li, H. The impact of the spatial agglomeration of foreign direct investment on green total factor productivity of Chinese cities. J. Environ. Manag. 2021, 290, 112666. [Google Scholar] [CrossRef] [PubMed]
  52. Li, G.; Gao, D.; Li, Y. Impacts of market-based environmental regulation on green total factor energy efficiency in China. China World Econ. 2023, 31, 92–114. [Google Scholar] [CrossRef]
Figure 1. The system of the green finance index. Source: This figure was drawn by the author using Word 2017 software.
Sustainability 16 08005 g001
Figure 2. Green finance development level in prefecture cities. Source: This figure was drawn by the author using ArcGIS 10.8 software.
Sustainability 16 08005 g002
Table 1. Descriptive statistics.
(1)(2)(3)(4)(5)
VariablesNMeanSDMinMax
GTFP27600.6500.3190.0001.800
GF27600.3270.9780.0000.624
Loed276016.480.88614.2619.54
ISR27600.0240.0640.0000.182
Rg27600.0220.0210.0000.041
Erc27600.0340.0140.0000.012
Ufd27602.2401.1000.58812.62
Fdc27600.4940.2210.0001.541
Table 2. The urban GTFP global Moran I index.
VariablesIzp-Value
20100.1833.4410.000
20110.2214.3970.000
20120.1744.8780.000
20130.2438.1220.000
20140.2336.4860.000
20150.3077.0460.000
20160.3529.7820.000
20170.36911.4970.000
20180.4098.7160.000
20190.3899.7030.000
20200.41110.2480.000
20210.4209.3040.000
Table 3. The result of benchmark regression.
(1)(2)(3)(4)(5)(6)
Geographical distance matrixEconomic weight matrix
GF0.437 **0.332 ***0.215 **0.544 ***0.359 ***0.308 ***
(2.32)(3.17)(2.14)(4.40)(4.39)(3.42)
W*GF0.280 ***0.251 ***0.173 ***0.349 ***0.284 **0.208 **
(3.07)(4.85)(3.10)(5.36)(2.45)(2.37)
W*GTFP0.411 *0.354 **0.271 **0.276 **0.347 **0.314 **
(1.72)(2.20)(1.99)(2.32)(2.16)(2.29)
Constant1.621 ***1.536 ***1.339 ***1.646 **1.821 **1.739 ***
(3.54)(2.98)(2.62)(2.37)(1.99)(2.59)
Control××
City FE××××
Year FE××
R20.2450.3270.3870.2170.3860.409
N276027602760276027602760
Note: T values are shown in parentheses, and * p < 0.1, ** p < 0.05, and *** p < 0.01.
Table 4. Decomposition results of spatial spillover effect.
(1)(2)(3)(4)(5)(6)
Geographical distance matrixEconomic weight matrix
Direct effectIndirect effectTotal
effects
Direct effectIndirect effectTotal
effects
GF0.377 **0.292 ***0.669 **0.232 ***0.258 ***0.490 ***
(2.32)(3.17)(2.14)(4.40)(4.39)(3.42)
Note: T values are shown in parentheses, and ** p < 0.05, and *** p < 0.01.
Table 5. Mechanism test.
(1)(2)(3)
Energy Use EfficiencyResource Mismatch Degree New Quality Productivity
GF0.263 ***−0.175 **0.382 **
(3.31)(−2.32)(2.31)
W*GF0.116 **−0.149 *0.185 ***
(2.45)(−1.86)(4.55)
W*GTFP0.396 **−0.323 **0.349 *
(1.98)(−1.97)(1.79)
Constant1.167 ***1.352 ***1.387 ***
(2.66)(3.37)(3.65)
Control
City FE
Year FE
R20.4510.3170.538
N276027602760
Note: T values are shown in parentheses, and * p < 0.1, ** p < 0.05, and *** p < 0.01.
Table 6. Robustness test.
(1)(2)(3)(4)
Control Lag GTFPGeographic Adjacency Matrix Economic Distance MatrixExclude 2020 Data
GF0.264 **0.124 **0.415 ***0.338 ***
(2.37)(2.31)(3.30)(2.69)
W* GF0.243 ***0.185 **0.249 *0.286 **
(2.69)(2.55)(1.86)(2.06)
W*GTFP0.122 *0.267 **0.372 ***0.199 ***
(1.75)(2.45)(2.97)(2.68)
L. GTFP0.329 **
(2.22)
Constatnt1.139 ***0.944 ***1.058 ***1.769 ***
(3.88)(2.58)(2.99)(2.73)
Control
City FE
Year FE
R20.5740.3240.3780.408
N2430276027602557
Note: T values are shown in parentheses, and * p < 0.1, ** p < 0.05, and *** p < 0.01.
Table 7. Heterogeneity test.
(1)(2)(3)(4)
Inland CityCoastal CityDeveloped City Developing City
GF0.3380.505 ***0.641 ***0.216
(1.02)(2.60)(2.71)(1.58)
W* GF0.3110.393 ***0.385 ***0.412
(1.55)(4.06)(3.25)(0.94)
W*GTFP0.562 **0.649 *0.228 ***0.311 *
(2.31)(1.90)(3.25)(1.71)
Constatnt1.287 **1.587 ***2.215 ***1.834 ***
(2.21)(3.28)(2.96)(2.77)
Control
City FE
Year FE
R20.2580.3390.4250.358
N179395710911659
Note: T values are shown in parentheses, and * p < 0.1, ** p < 0.05, and *** p < 0.01.
Disclaimer/Publisher’s Note: The statements, opinions and data contained in all publications are solely those of the individual author(s) and contributor(s) and not of MDPI and/or the editor(s). MDPI and/or the editor(s) disclaim responsibility for any injury to people or property resulting from any ideas, methods, instructions or products referred to in the content.

