Abstract
In light of China’s ambitious goals to peak carbon emissions by 2030 and achieve carbon neutrality by 2060, this study uniquely explores the decoupling dynamics between economic growth and carbon emissions in Xinjiang using panel data from 2006 to 2020 across various prefectures and cities. By employing the Tapio decoupling elasticity index and the Logarithmic Mean Divisia Index (LMDI) decoupling model, we found that Xinjiang, as a whole, has not fully decoupled its carbon emissions from economic growth, with overall emissions below the national average. The carbon emissions growth rate in Xinjiang has significantly decreased from 17.7% during 2005–2010 to 3.35% in 2015–2020, with weak decoupling particularly evident in northern and eastern regions. To achieve full decoupling, it is imperative for policymakers to reform the economic growth model in northern Xinjiang and restructure the energy mix in eastern Xinjiang. Additionally, the promotion of low-carbon industries and the enhancement of green energy efficiency are crucial for advancing the region’s sustainable development.
1. Introduction
Xinjiang, as a strategic national energy base and a pivotal region in China’s ‘Belt and Road’ initiative, is abundant in mineral resources such as oil, coal, and natural gas [1]. It plays a critical role in the country’s energy supply chain, including west-to-east power transmission and coal transportation. The region’s industrial activities, particularly in sectors like petrochemicals, mining, and heavy manufacturing, are major contributors to Xinjiang’s carbon emissions, making it one of China’s major energy-consuming provinces [2]. Additionally, Xinjiang’s vast area, complex terrain, and harsh climatic conditions—such as aridity and extreme temperature variations—result in significant differences in energy transportation and usage patterns across the region. The southern part of Xinjiang is relatively underdeveloped, relying mainly on agriculture and resource extraction, whereas the northern and eastern parts are more industrialized, with cities like Changji and Kumul dominated by heavy industries, particularly in energy and chemical sectors. These economic and environmental differences have significantly impacted carbon emissions. As a result, it is crucial to closely examine Xinjiang’s energy consumption patterns and their specific contributions to carbon emissions, highlighting the significant challenge of balancing economic growth with low-carbon development, a matter of both national and global importance.
The concept of “decoupling” originated in physics as a measure of assessing the dependence between variables [3] and has been subsequently used to analyze the link between economic growth and resource consumption or environmental pollution. If there is no relationship of dependency between them, decoupling is considered to have been achieved. Carbon decoupling refers to the idealized process of weakening, or even eliminating, the relationship between economic growth and carbon dioxide emissions and is an important indicator [4]. Many researchers have studied this issue from different perspectives. Tapio proposed a model for decoupling the relationship between the GDP and the capacity for transportation in 2005 [5], marking the origin of what has since become a foundational approach in the field. Zhang et al. (2022) examined the characteristics of carbon emissions and the status of decoupling of the Yellow River Basin by using the Tapio decoupling index as well as the catch-up decoupling model. The results showed that carbon emissions in the Yellow River Basin have decreased, and 91.2% of the cities in the region have managed to decouple them from their economic growth [6]. Huang et al. (2022) analyzed the decoupling relationship between economic development and carbon emissions in the transportation industry in the Yangtze River Economic Zone from 2004 to 2018 and identified a “weak decoupling”. The results showed that carbon emissions due to petroleum-based energy consumption accounted for 95.51% of the overall emissions from transportation [7].
Previous research has demonstrated that solely analyzing the emission-based relationship between economic development and carbon emissions is insufficient to identify the driving factors behind the latter. A more comprehensive examination of these factors can uncover the connection between economic growth and low carbon emissions. Among the models currently used for decoupling, structural decomposition analysis (SDA) stands out as a prominent method [8]. The exponential structural model (IDA) [9] and the IPAT model [10] also exist. SDA is a method based on the input–output model that is used to analyze the contributions of independent and dependent variables of the economic system [11]. However, its requirement of a large amount of data limits the application of this method. The IPAT model [12] classifies environmental variables into the population (P) [13], the degrees of prosperity (A) [14], technological progress (B) [15], and carbon emissions (C) [16]. It is a quantitative model that represents the impact of human activities on the environment [17]. However, its use is also limited because it considers only demographic and technological factors, which are often not decomposable in empirical situations [18,19,20]. The IDA method originated from Laspeyres’ proposed Laspeyres decomposition algorithm and has primarily advanced around three issues: non-decomposable terms in the Laspeyres index algorithm, algorithmic and logarithmic form selection for weights in factor level synthesis, and logarithmic assignment [21]. The Divisia Index-based method of decomposition has been widely used on this basis and has been improved to develop the arithmetic mean-division index (AMDI) and the log mean-division index (LMDI) [22]. LMDI-based decomposition is the most widely used method of factorization because it yields no residuals, is easy to use, and avoids the problem of pseudo-regression [23,24]. Liu et al. (2021) analyzed the factors influencing industrial emissions and economic development in Ningxia based on the LMDI model, derived the benefits in terms of the coefficient of carbon emissions, energy structure, level of economic development, and population to construct Kaya’s constant equation, and concluded that only the intensity of energy use drove industrial carbon emissions in Ningxia while the other factors inhibited them [25]. Zhang (2022) provided a decoupling analysis of economic growth and carbon emissions in Henan province from 2000 to 2019 by using the Tapio decoupling model and the LMDI model. The status of decoupling was mainly divided into analyses of the energy structure, industrial institutions, and technological progress, and the results showed that economic growth and carbon emissions in Henan were weakly decoupled [26].
A cursory review of the relevant literature shows that, first, prevalent research has favored exploring the relationship between economic development and carbon emissions in the country’s coastal cities [27], more economically developed regions, and pilot cities for carbon trading, and has seldom considered cities in Xinjiang province. Second, most of the data used in research are older than 16 years, and span over a relatively short period, such that this may yield inaccurate analyses of the problem. Finally, few studies have examined the factors driving carbon emissions in Xinjiang. In light of this, this study investigated the decoupling relationship between economic growth and carbon emissions in Xinjiang as well as the composition of the factors driving this relationship. We used the Tapio decoupling model and the LMDI method to analyze the status of their decoupling in Xinjiang, explored the factors driving carbon emissions in the area, and considered emissions in 14 prefectural and municipal areas of Xinjiang. We then considered the decoupling between carbon emissions and the economy in its southern, northern, and eastern regions. This will provide a reference for the Xinjiang government to formulate appropriate policies regarding carbon emissions, and to take measures to ensure a low-carbon, green, and environmentally friendly economy.
In order to thoroughly analyze the decoupling relationship between economic growth and carbon emissions in Xinjiang, this study employs the following data and methodologies.
2. Data and Methods
2.1. Overview of Study Area
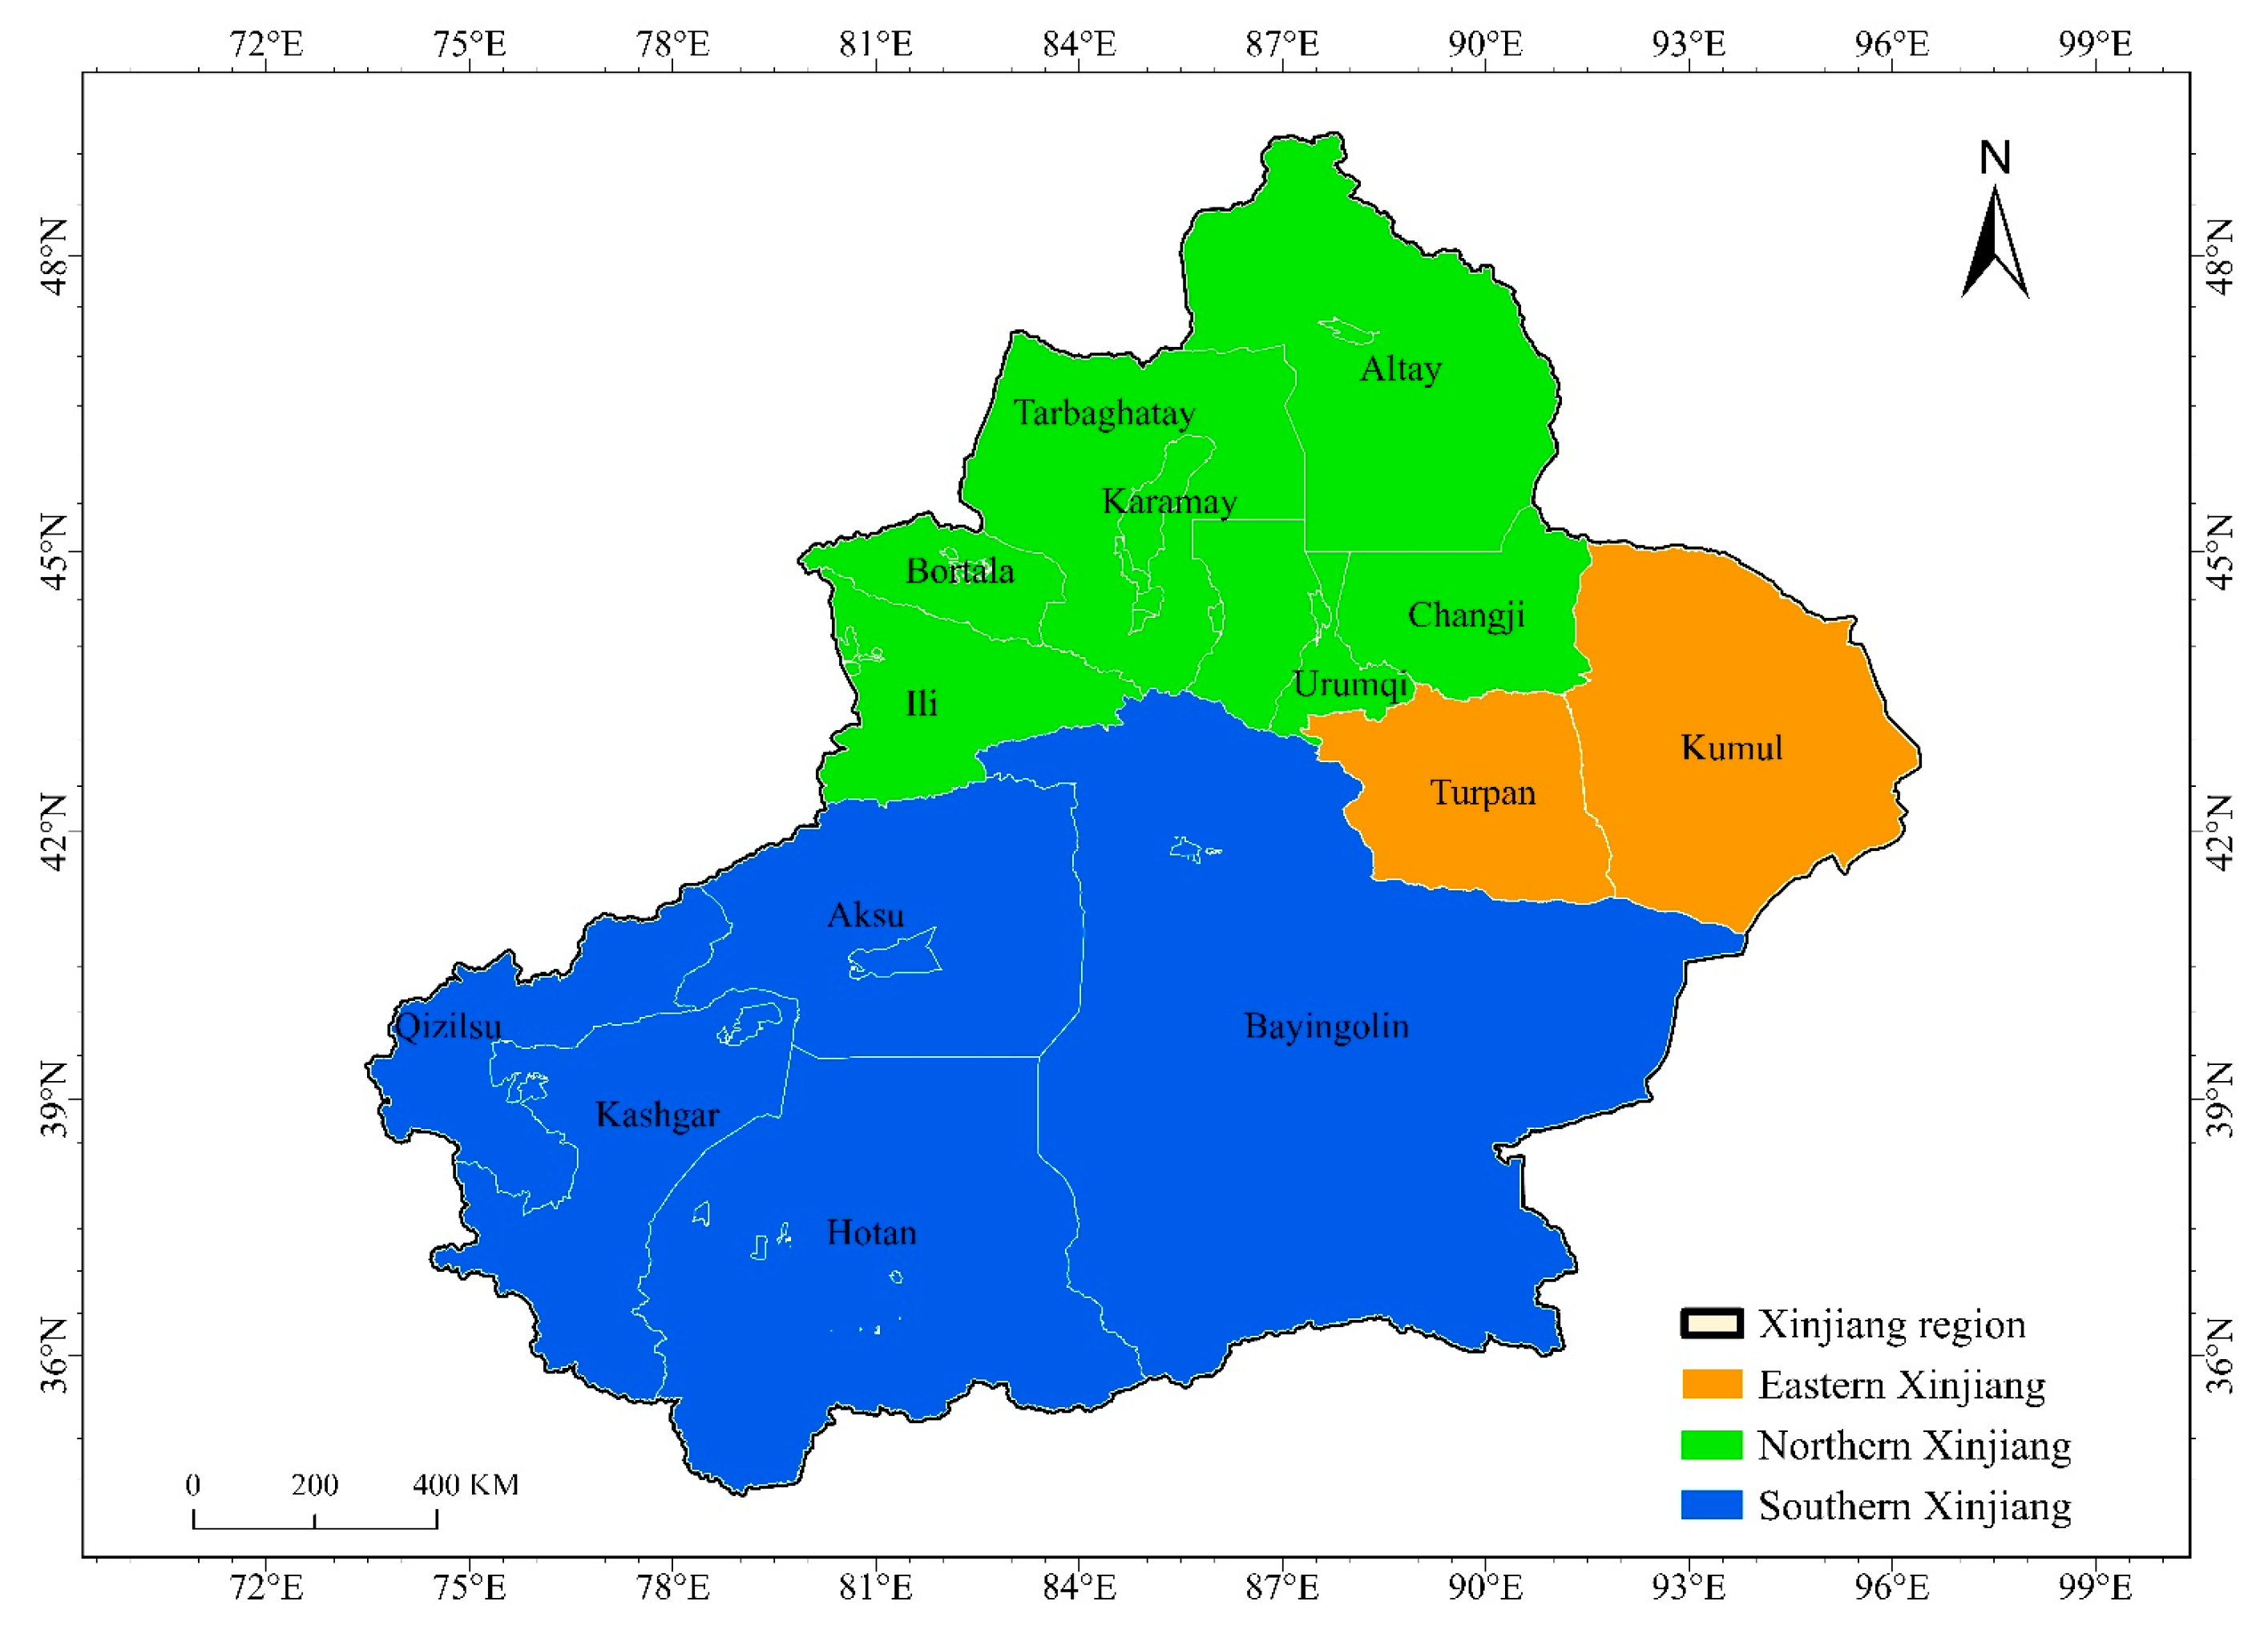
The Xinjiang region is located in northwestern China and occupies an area of 1,664,900 square kilometers, accounting for one-sixth of the country’s area of land (Figure 1). The Tian Shan mountain range stretches across the center of Xinjiang and divides it into two halves in the north and south, with the Tarim Basin in the south and the Junggar Basin in the north. It is customary to refer to the south of Tian Shan as the southern border, its north as the northern border, and the Kumul and Turpan Basins as the eastern border [28].

Figure 1.
Map of southern, northern, and eastern Xinjiang.
2.2. Methodology for Carbon Emissions Calculation
Carbon emissions were calculated using the Intergovernmental Panel on Climate Change’s (IPCC’s) standardized methodology. This approach involves multiplying energy consumption by corresponding emission factors specific to each type of fuel. The IPCC method is widely recognized for its robustness and consistency, making it suitable for comparative studies across different regions. In the context of Xinjiang, a region with a diverse energy mix dominated by fossil fuels such as coal, oil, and natural gas, the selection of emission factors was particularly crucial to ensure accuracy.
The general formula used to calculate the total carbon emissions is
where represents the total carbon emissions in Xinjiang, is the carbon emissions from the -th energy source, denotes the terminal consumption of the -th energy source in Xinjiang, is the reference coefficient for converting the -th energy source to standard coal equivalent, and is the carbon emission coefficient of the -th energy source, which reflects the amount of CO2 emitted per unit of energy consumed.
This formula allows for the aggregation of emissions from different energy sources to calculate the total carbon emissions for the region. The specific emission factors () and conversion coefficients () are critical as they account for the varying carbon intensities of different fuels. Table 1 lists the reference factors for converting different types of energy sources to standard coal equivalents () and their corresponding carbon emission factors (). These factors are derived from the IPCC Guidelines for National Greenhouse Gas Emission Inventories (2006) and are used to ensure consistency and accuracy in the calculation of carbon emissions across different regions and energy types.

Table 1.
Standard factors of coal conversion and carbon emissions for various sources of energy.
2.3. Model Construction
2.3.1. Tapio Decoupling Index
The Tapio decoupling index is a quantitative measure designed to evaluate the relationship between economic growth and environmental impact, particularly carbon emissions. The index is derived from the elasticity concept, which, in this context, represents the responsiveness of carbon emissions to changes in GDP [29]. The Tapio decoupling index is calculated as follows:
where is the elasticity of decoupling between economic growth and carbon emissions. It quantifies how much carbon emissions change in response to a unit change in GDP, and are the emissions and the GDP in the base period, respectively, and and are the differences in their values between the current period and the base period.
According to Tapio’s division of the values of the elasticity of decoupling, its status can be divided into the eight categories shown in Table 2. When < 0, this indicates a state of absolute decoupling, where economic growth is achieved while reducing carbon emissions. When 0 ≤ D < 0.8, this indicates relative decoupling, where the economy grows faster than carbon emissions, but emissions still increase. When 0.8 ≤ D ≤ 1.2, this reflects a coupling or weak decoupling state, where economic growth and carbon emissions increase at similar rates. When D > 1.2, this represents negative decoupling, where carbon emissions increase faster than economic growth, which is undesirable.
Table 2.
Elasticity and status of decoupling.
To accurately reflect the regional disparities within Xinjiang, the Tapio decoupling index was applied with consideration of each region’s specific economic activities and energy consumption patterns. For example, the model distinguishes between northern Xinjiang, where industrial activities dominate and carbon emissions are higher, and southern Xinjiang, where agriculture plays a more significant role with relatively lower emissions. This regional differentiation allows for a more precise assessment of the decoupling status across the province.
While the Tapio index provides a broad overview of the elasticity between economic growth and carbon emissions, it does not fully explain the underlying factors driving this relationship. To gain deeper insights into these factors, the Log Mean Divisia Index (LMDI) decomposition method is employed. This method allows us to break down the changes in carbon emissions into specific contributing elements, offering a more detailed analysis.
2.3.2. LMDI-Based Decomposition
The carbon emissions in Xinjiang can be decomposed into several contributing factors using the Log-Mean Divisia Index (LMDI) approach, grounded in the Kaya Identity [30]. The Kaya Identity, a widely recognized equation in environmental economics, expresses carbon dioxide emissions as the product of four factors: population, GDP per capita, energy intensity, and carbon intensity. This identity is crucial for understanding how changes in these factors drive changes in carbon emissions over time. The LMDI method is particularly advantageous because it allows for the precise decomposition of these individual factors’ effects without residuals [31], offering insights into the specific contributions of each to overall emissions changes. Unlike other methods that may aggregate or approximate the contributions of different factors, the LMDI approach provides a more granular and accurate understanding of how specific elements, such as energy intensity or economic growth, directly influence emissions. This capability to isolate and quantify changes in emissions to specific factors, with a high level of precision and no residuals, makes LMDI a powerful tool for policy analysis and decision-making in environmental management. In this study, we focus on a simplified version of the Kaya Identity, which can be expressed as
where represents the total carbon emissions in Xinjiang, measured in tons of CO2. It reflects the aggregate emissions resulting from all economic activities in the region. denotes the total energy consumption in Xinjiang, measured in tons of standard coal (tce). This is a key measure of energy use, indicating the total amount of energy consumed across various sectors of the economy. represents the gross domestic product of Xinjiang, measured in currency units (USD).
The term () captures the carbon intensity effect, indicating the carbon content of the energy mix, with lower values suggesting a cleaner energy structure. Lower values in carbon intensity reflect a shift toward less carbon-intensive energy sources.
The term () captures the energy intensity effect, representing how efficiently the economy uses energy. Lower values in energy intensity indicate higher energy efficiency, meaning that the economy is using less energy to generate the same level of economic output. The energy intensity effect measures how efficiently the economy uses energy, with lower values indicating higher energy efficiency. Thus, the total carbon emissions in Xinjiang can be expressed as
where , , and correspond to the carbon intensity, energy intensity, and economic growth effects, respectively.
To analyze the changes in carbon emissions between two comparison years, we denote the carbon emissions in period as , while those in the base period are denoted by . The difference in carbon emissions between the reporting period and the base period is
This equation allows us to decompose the total change in carbon emissions into the contributions from changes in carbon intensity, energy intensity, and economic growth. A weighted average of the above equation yields the following expression:
where , and denote the coefficients of the elasticity of decoupling of the intensity of the energy structure, intensity of energy consumption, and efficiency of economic development, respectively.
The Tapio decoupling index was employed in this study due to its ability to quantify the relationship between economic growth and carbon emissions across different regions. Its elasticity-based approach provides a clear measure of how economic activity and emissions are coupled or decoupled. In addition, the LMDI decomposition method was chosen for its capacity to break down changes in carbon emissions into contributing factors such as energy intensity and economic scale. This method was preferred over other decomposition techniques due to its lack of residuals and ease of interpretation, making it particularly suitable for regional analysis in Xinjiang.
2.3.3. Data Sources and Description
We used the Xinjiang Statistical Yearbook to obtain data on the sources of energy, regional GDP, and industrial output of the province, which are crucial for analyzing the economic drivers of carbon emissions [32]. The 2023 Statistical Bulletin on National Economic and Social Development of Xinjiang Uygur Autonomous Region was used to fill gaps in the data, particularly for the most recent economic activities and energy consumption statistics. Carbon emission coefficients were collected from the 2006 IPCC Guidelines for National Greenhouse Gas Emission Inventories, ensuring that the emission calculations align with internationally recognized standards. Additionally, equivalent coefficients of standard coal were sourced from the China Energy Statistical Yearbook. The data for the Corps region were not considered due to the inconsistency in the scope of the statistical yearbook. This study focused on 14 prefecture-level cities in Xinjiang: 7 in the north (including Urumqi and Karamay), 5 in the south (including Kashgar and Aksu), and 2 in the east (Turpan and Kumul).
2.4. Methodology Flowchart
The overall methodology for this study is outlined in Figure 2, which provides a clear flowchart of the carbon emission calculation, Tapio decoupling index analysis, and LMDI-based decomposition. The process begins with data input, where energy consumption data is gathered and processed using standardized emission factors. Following this, the total carbon emissions are calculated for each energy source. For the decoupling analysis, the Tapio index is used, where growth rates of GDP and carbon emissions are standardized and compared to classify the decoupling states. Simultaneously, the LMDI decomposition method is applied, leveraging the Kaya identity to break down the contributions of carbon intensity, energy intensity, and economic growth. This stepwise process allows for a detailed understanding of the factors influencing carbon emissions and the decoupling status in Xinjiang.
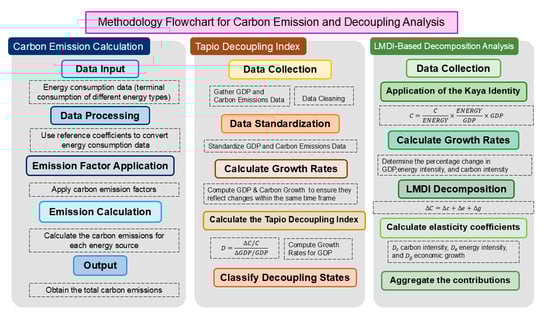
Figure 2.
Methodology flowchart for carbon emission and decoupling analysis.
3. Results and Analysis
3.1. Status of Carbon Emissions in Xinjiang
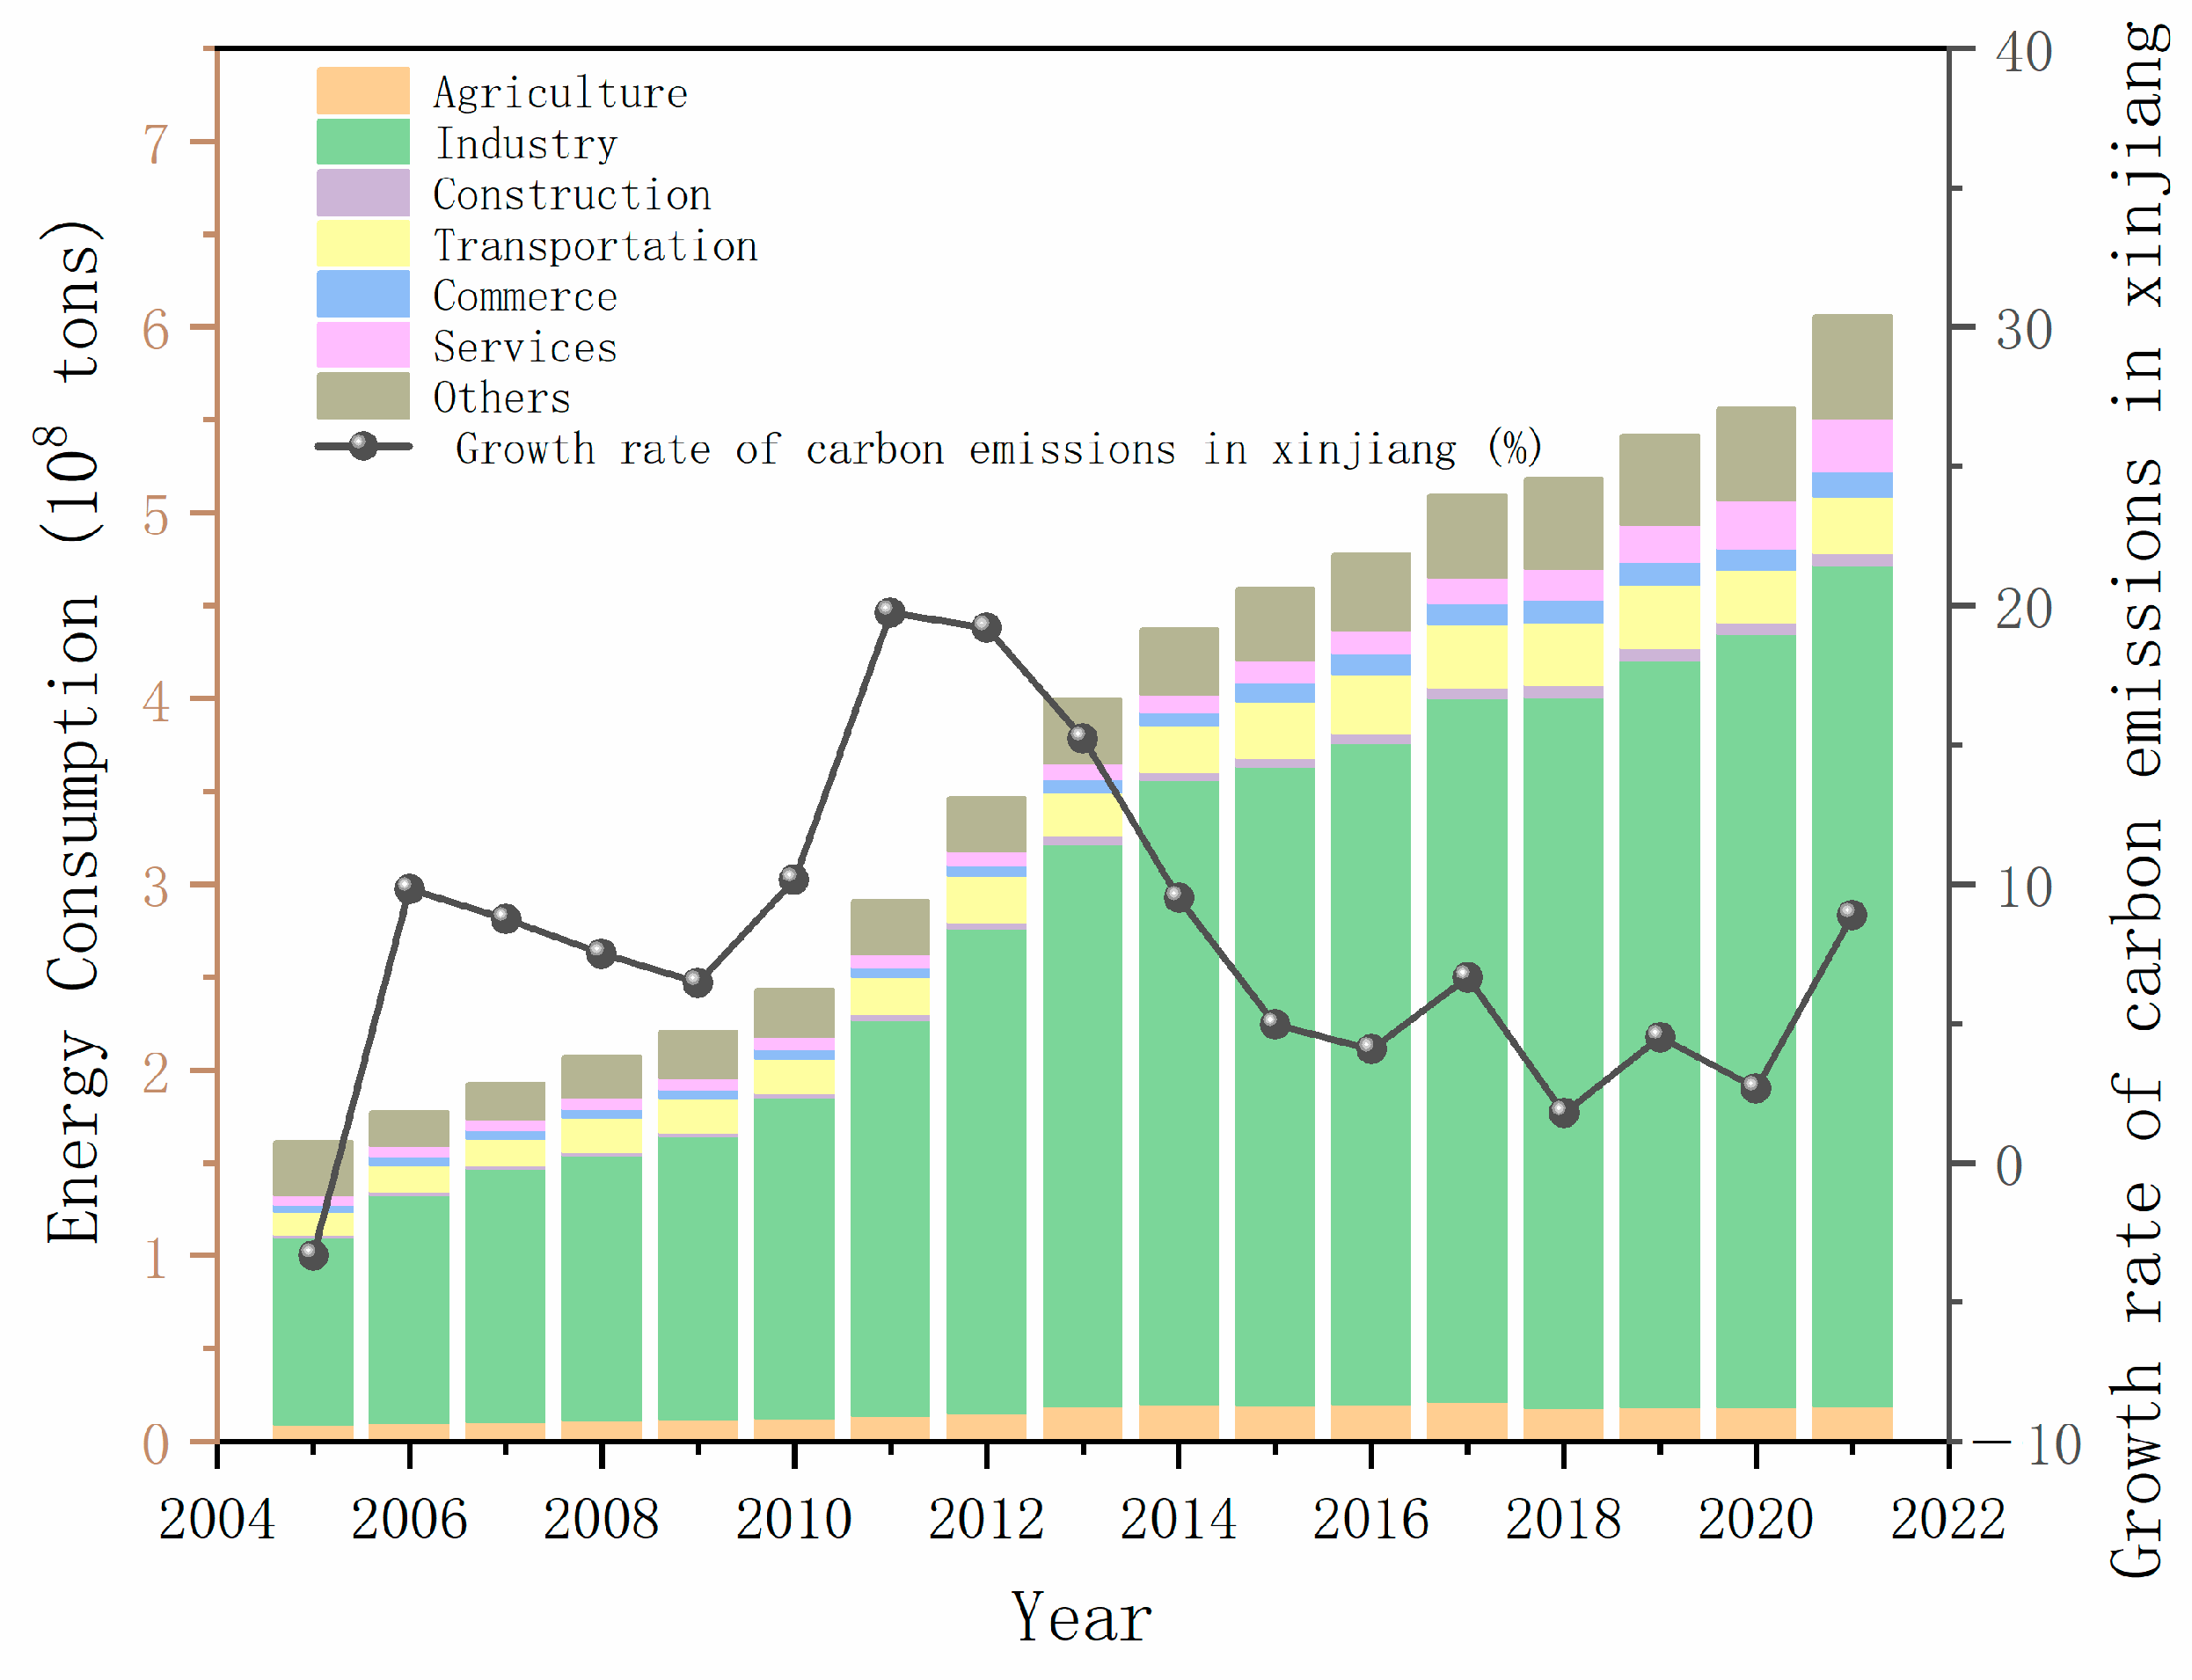
Based on carbon emission data from various industries in Xinjiang from 2005 to 2021, total carbon emissions increased from 161.34 million tons in 2005 to 605.54 million tons in 2021, with an average annual growth rate of approximately 8.43%. This significant growth primarily reflects the rapid development of Xinjiang’s economy, particularly in the processes of industrialization and urbanization.
The industrial sector is the primary driver of carbon emission growth, with its emissions rising from 100.81 million tons in 2005 to 452.71 million tons in 2021, marking an increase of about 350%. The sector’s share of total carbon emissions rose from 62.5% to 74.8%, underscoring the dominant role of industrial expansion in regional carbon emissions. In addition to the industrial sector, carbon emissions from transportation, construction, and services also saw substantial increases, with growth rates of 147.3%, 437.1%, and 447.1%, respectively. The rapid growth of the construction industry is particularly noteworthy, indicating that as urbanization accelerates, construction activities are increasingly contributing to carbon emissions. The significant rise in transportation emissions reflects the expansion of infrastructure and logistics activities. Meanwhile, the service sector, despite its relatively moderate growth, still contributes a significant absolute volume of emissions, emphasizing its impact on the regional economic and carbon emission structure (Figure 3).

Figure 3.
Total carbon emissions and their rate of growth in Xinjiang from 2005 to 2021.
The reasons for the variations in carbon emission growth can be attributed to multiple factors. First, the global financial crisis in 2008 and 2009 led to a decrease in international market demand, particularly for energy and raw materials, which directly impacted Xinjiang’s resource-intensive economic structure, leading to a temporary slowdown in carbon emission growth [33]. Second, during the period from 2015 to 2020, the adjustment of China’s overall economic structure, with a shift from heavy industry to service-oriented and high-tech industries, also played a crucial role in moderating carbon emissions. This shift resulted in a slower expansion of energy-intensive industries in Xinjiang, contributing to a reduction in the overall growth rate of carbon emissions [34]. Additionally, the implementation of energy-saving and emission reduction policies during the “13th Five-Year Plan” period, such as phasing out outdated production capacity, promoting clean energy [35], and improving energy efficiency, led to enhanced energy consumption efficiency within Xinjiang’s industrial sector, thereby reducing carbon emission intensity. Concurrently, Xinjiang’s position as a key base for renewable energy in China has spurred rapid development in wind and solar energy, which has helped mitigate the growth of carbon emissions by gradually replacing fossil fuels. Moreover, the strengthening of environmental regulations, stricter emission standards, and the normalization of environmental inspections have encouraged enterprises to invest more in environmental protection measures, further contributing to the deceleration of carbon emissions growth.
We analyzed the carbon emissions in Xinjiang by dividing it into three regions: south, north, and east Xinjiang (Table 3).
Table 3.
Overview of carbon emissions in Xinjiang.
Table 3 illustrates significant regional disparities in carbon emissions across Xinjiang. Northern Xinjiang not only has the highest share of carbon emissions among the three regions, accounting for 69.4%, but also hosts the largest economy and the highest level of development, with a GDP of USD 12,014.7 billion. Despite this, the region’s carbon intensity stands at 3.5 t/million USD, which is above the national average of 1.6 t/million USD in 2021. This indicates a strong reliance on energy-intensive industries that contribute to its higher carbon footprint.
In contrast, southern Xinjiang accounts for only 15.1% of the region’s total carbon emissions, with a GDP of USD 6091.8 billion and a relatively lower carbon intensity of 1.5 t/million USD. This lower carbon intensity reflects the region’s more diversified economic activities, which are less dependent on heavy industry and thus contribute less to carbon emissions.
Eastern Xinjiang, while contributing 15.5% to the total emissions, shows a much higher carbon intensity of 6.6 t/million USD, which is over four times the national average. This suggests that the region’s industrial activities are heavily reliant on fossil fuels, resulting in a disproportionately high carbon footprint relative to its economic output. The data underscores the urgent need for a transition to cleaner energy sources in Eastern Xinjiang to mitigate its environmental impact.
3.2. Decoupling Analysis of Economic Growth and Carbon Emissions
We used the Tapio decoupling model to analyze the relationship between economic growth and carbon emissions in 14 prefectures and cities of Xinjiang, taking into account the region’s specific economic activities and energy consumption patterns. Given Xinjiang’s reliance on energy-intensive industries, such as oil and coal extraction, the analysis incorporated these regional-specific factors to accurately categorize each city’s development type and carbon emissions characteristics. As shown in Table 4, we refined the original eight states of decoupling into the following four categories:
Table 4.
Urban development types based on decoupling values.
- (1)
- Low-Carbon Development (D < 0): Cities in this category demonstrated an inverse relationship between economic growth and carbon emissions, indicating absolute decoupling. These cities were advanced in low-carbon environmental protection and did not heavily rely on fossil fuels for economic development.
- (2)
- Intensive Expansion (0 ≤ D < 0.8): In these cities, the rate of economic growth was significantly higher than that of carbon emissions, suggesting relative decoupling. These cities were improving energy efficiency, allocating resources rationally, and gradually reducing dependency on fossil fuels.
- (3)
- Inefficient Expansion (0.8 ≤ D ≤ 1.2): In this category, carbon emissions and economic growth were closely linked, with no significant decoupling. These cities were unable to use energy efficiently and intensively, leading to inefficient expansion.
- (4)
- Extensive Expansion (D > 1.2): Cities in this group experienced a growth rate in carbon emissions that outpaced economic growth, reflecting negative decoupling. These cities heavily depended on energy-intensive industries and exhibited a high-carbon energy structure.
In calculating the Tapio decoupling index, this study took into account the different economic activities across various regions of Xinjiang. The heavy industry-driven economic growth in northern Xinjiang, particularly in oil and coal extraction, has led to higher carbon emissions, whereas the agriculture and light industry in southern Xinjiang contribute less to carbon emissions. Eastern Xinjiang, primarily dependent on resource extraction, exhibits higher carbon intensity due to less efficient energy use. To reflect these regional characteristics, regional economic and carbon emission data were used in the decoupling index calculations.
Using the Tapio index, as defined in Formula (2), we determined the type of development for each city in Xinjiang, focusing on the relationship between industrial economic growth and industrial carbon emissions. Based on the earlier analysis, industrial carbon emissions accounted for 74.7% of the total carbon emissions in Xinjiang by 2021. Given this significant contribution, the decoupling status between industrial economic growth and carbon emissions offers a critical perspective for analysis. Figure 4 illustrates the comprehensive changes in municipal-level development across Xinjiang from 2006 to 2020, reflecting different decoupling patterns closely related to the regional economic structure and the implementation of national policies under China’s 11th, 12th, and 13th Five-Year Plans.
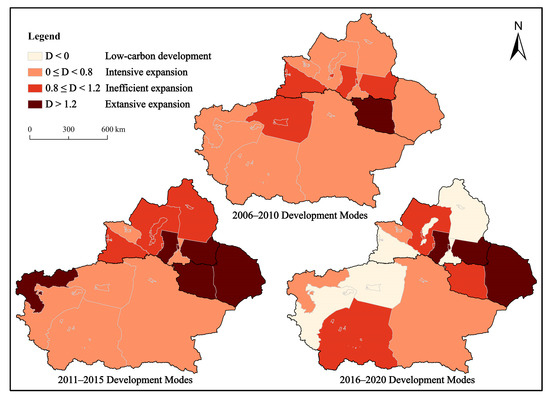
Figure 4.
Modes of development of municipalities in Xinjiang from 2006 to 2020.
From 2006 to 2010, Xinjiang’s overall economic and industrial development was relatively slow. This period was characterized by moderate growth, where industrial activities had not yet dominated the region’s economic landscape. As a result, carbon emissions were still manageable, and many regions exhibited favorable decoupling statuses. For instance, Urumqi and Karamay were in the intensive expansion category, where economic growth outpaced the increase in carbon emissions, reflecting early efforts to improve energy efficiency. Similarly, Altay also managed to maintain a balanced growth pattern with its focus on eco-tourism, which allowed it to control carbon emissions while supporting economic development.
The 2011–2015 period marked a turning point, driven by the rapid industrial expansion under the 12th Five-Year Plan. This era saw a surge in energy-intensive industries, often without adequate regulatory oversight, leading to what can be described as “wild growth”. Cities like Karamay shifted from intensive to inefficient expansion, struggling to maintain energy efficiency amidst the rapid industrial growth. Meanwhile, regions like Turpan and Kumul, which were initially in the intensive expansion category, also saw their decoupling status deteriorate to inefficient expansion, largely due to the unchecked growth in industries such as coal mining and energy production. Additionally, Aksu, Hotan, and Kizilsu moved into the extensive expansion category, where carbon emissions rose more sharply than economic output, highlighting the consequences of unregulated industrial activities and the region’s heavy reliance on resource extraction.
During the 13th Five-Year Plan (2016–2020), national policies began to emphasize energy conservation and emission reduction, leading to significant shifts in the decoupling statuses across various regions. Urumqi, which had benefited from targeted interventions, transitioned to a low-carbon development model by closing down high-energy-consuming enterprises and modernizing its industrial base. However, this success came at a cost to surrounding areas like Changji and Kumul, where these high-energy industries were relocated, resulting in persistently high carbon emissions and keeping these regions in the intensive and extensive expansion categories, respectively.
In contrast, Karamay, which had struggled in the previous period, successfully moved to low-carbon development by 2020, thanks to significant investments in renewable energy and advanced carbon management technologies. Similarly, Altay also achieved low-carbon development, capitalizing on its natural resources to promote sustainable eco-tourism and renewable energy projects. Meanwhile, cities like Bortala and Ili, which had shown promise in the earlier period, remained in the intensive expansion category, indicating that while they managed to control carbon emissions to some extent, they still faced challenges in achieving full decoupling. Turpan and Kumul continued to struggle with inefficient expansion, unable to break free from their reliance on traditional energy-intensive industries. The analysis of these cities underscores the complexity of achieving decoupling in a region as diverse as Xinjiang. While cities like Urumqi, Karamay, and Altay have made significant strides towards low-carbon development. This success is largely attributed to the early adoption of carbon capture and storage (CCS) technologies [36] and substantial investments in renewable energy, particularly solar and wind power [37]. Others like Aksu, Hotan, and Kizilsu remain heavily burdened by their industrial legacies. The relocation of industries from more developed areas to less regulated ones further complicates efforts to reduce overall carbon emissions. Moving forward [38], it is critical to implement region-specific strategies that not only focus on reducing emissions but also on fostering sustainable economic practices that align with each region’s unique industrial and environmental context.
3.3. Analysis of Factors Influencing Carbon Emissions in Xinjiang
Having explored the decoupling status of various cities in Xinjiang, it is now essential to examine the underlying factors that have influenced carbon emissions across the region during the 2005–2020 period. We used previously measured carbon emissions in Xinjiang and the LMDI model, as given in Formulae (3)–(8), to calculate the impact of each factor on the changes in carbon emissions. The results are shown in Table 5.
Table 5.
LMDI-based decomposition of carbon emissions in Xinjiang, 2005–2020.
To more accurately analyze the contributions of different regions to carbon emissions, the LMDI decomposition model was adjusted based on the economic activities in the southern, northern, and eastern parts of Xinjiang. For instance, the industrial activities in northern Xinjiang are predominantly energy-intensive, especially in cities like Urumqi and Karamay, where carbon emissions are mainly driven by the petrochemical industry. In contrast, southern Xinjiang relies on agriculture and light industry, with lower energy consumption and carbon emission intensity. Eastern Xinjiang’s carbon emissions are primarily driven by mining activities. Therefore, in the LMDI decomposition, different energy intensity and carbon intensity coefficients were applied for each region to better reflect the relationship between regional economic activities and carbon emissions.
The analysis reveals that northern Xinjiang experienced a significant increase in carbon emissions, driven primarily by the intensity of energy consumption. The region contributed a total of 341.63 units to energy consumption intensity, with major contributors being cities like Urumqi (38.20 units), Karamay (103.29 units), and Ili (130.25 units). Despite reductions in the intensity of the energy mix in most of these cities (Karamay with −130.33 units and Ili with −55.94 units), the overall increase in carbon emissions highlights the heavy reliance on energy-intensive industries and the inefficiency in energy use. Urumqi’s carbon emissions are mainly driven by its large industrial base and heavy reliance on fossil fuels. The city’s contribution to energy consumption intensity (38.20 units) indicates that despite attempts to improve the energy mix, these efforts have not been sufficient to offset the high demand for energy. The city’s economic benefits are positive (68.47 units), but the cost in terms of carbon emissions is substantial. To mitigate this, Urumqi needs to focus on further improving energy efficiency and accelerating the transition to renewable energy sources. Despite a significant reduction in the intensity of its energy mix (−130.33 units), Karamay’s energy consumption intensity (103.29 units) remains a concern. This indicates that while the city has made strides in adopting cleaner energy sources, the sheer volume of energy consumption continues to drive emissions upward. Karamay’s high economic development benefits (104.68 units) suggest that economic growth is strong, but the city must balance this with more aggressive measures to reduce energy consumption.
In contrast, southern Xinjiang shows a much more modest increase in carbon emissions due to energy consumption intensity, with a total contribution of 4.32 units. However, specific cities within this region, like Kashgar and Hotan, have shown concerning trends. The Kashgar’s positive contribution to energy consumption intensity (36.78 units) combined with a decrease in the intensity of the energy mix (−33.46 units) suggests that while there are efforts to improve energy quality, the overall consumption remains high. Kashgar’s negative economic development benefits (−6.58 units) further highlight the inefficiency in translating energy use into economic growth. This calls for targeted policies to enhance energy efficiency and optimize resource allocation to support sustainable economic development. Although Hotan shows a minor positive impact from energy consumption intensity (6.62 units), its economic development benefits are negative (−6.46 units). This indicates that the region is struggling with both economic performance and energy management. Hotan needs substantial support to modernize its industrial base, improve energy infrastructure, and integrate more sustainable practices.
Eastern Xinjiang, particularly Kumul and Turpan, presents a mixed picture with regard to carbon emissions and economic development. The most striking case in Eastern Xinjiang is Kumul, where the intensity of energy consumption contributed 123.09 units to carbon emissions. This high figure underscores the region’s reliance on traditional energy sources and highlights the need for a transition towards cleaner energy. Despite this, Kumul has managed to achieve significant economic development benefits (84.21 units), suggesting that there is potential for growth if energy consumption can be optimized. Strategic investments in renewable energy and improvements in energy efficiency are essential for reducing Kumul’s carbon footprint while sustaining its economic momentum. Turpan shows a more balanced outcome with a minor negative impact from energy consumption intensity (−3.10 units) but positive economic development benefits (37.80 units). This suggests that the city is on a more sustainable path, but there is still room for improvement in reducing overall energy consumption and further enhancing the energy mix.
3.4. Comparative Analysis with Existing Studies
To further validate and contextualize our findings, a comparative analysis was conducted against three key studies that have examined carbon emissions in Xinjiang:
- (1)
- Luo et al. [39] utilized a carbon sinks and emissions balance model to explore land use transitions in Xinjiang. While their study focused on the compensatory mechanisms of carbon sinks, our research emphasizes the contributions of industrial sectors to emissions, particularly in energy-intensive industries. This contrast highlights how different methodologies can reveal complementary aspects of the carbon emissions landscape in Xinjiang.
- (2)
- The 2021 study on the Xinjiang Production and Construction Corps employed a different decomposition model to identify the driving factors of carbon emissions, with a focus on agricultural activities [40]. In contrast, our LMDI analysis underscores the significance of industrial activities, particularly in northern Xinjiang, as the primary contributors to carbon emissions. This finding suggests that, while agricultural activities are important, the role of heavy industry is more pronounced in shaping the region’s carbon footprint.
- (3)
- The 2020 study on energy bases in Xinjiang provided insights into the broader energy consumption patterns across the region [41]. Our findings align with this study, particularly regarding the high carbon emissions in northern Xinjiang due to energy-intensive industries. However, our use of the LMDI method allows for a more detailed decomposition of the contributing factors, offering a granular understanding of how energy intensity and economic activities specifically drive emissions.
This comparative analysis not only reinforces the robustness of our findings but also highlights the distinct advantages of the LMDI method in providing precise and residual-free decomposition of factors influencing carbon emissions. By comparing our results with those obtained using other methodologies, we demonstrate the LMDI model’s utility in offering actionable insights for policy formulation and environmental management.
4. Conclusions and Recommendations
4.1. Conclusions
In light of China’s ambitious goals to peak carbon emissions by 2030 and achieve carbon neutrality by 2060, this study has explored the decoupling dynamics between economic growth and carbon emissions in Xinjiang from 2004 to 2020. The analysis, which employed the Tapio decoupling elasticity index and the LMDI decoupling model, has revealed several critical insights into the region’s carbon emissions trajectory.
Xinjiang, as a whole, has not fully decoupled its carbon emissions from economic growth, with overall emissions still below the national average. This indicates that while the region’s economic activities have contributed to growth, particularly in the northern and eastern parts, they have also driven significant carbon emissions. These findings underscore the need for targeted interventions in these industrial areas to achieve more sustainable growth patterns.
A notable observation is the significant reduction in Xinjiang’s carbon emissions growth rate, which declined from 17.7% during 2006–2010 to 3.35% in 2015–2020. Although this deceleration suggests some progress in mitigating emissions, the overall decoupling effect remains weak, especially in the northern and eastern regions. This emphasizes the need for continued and enhanced efforts in these areas to better align economic growth with environmental sustainability.
To achieve full decoupling, it is imperative for policymakers to undertake comprehensive reforms. In northern Xinjiang, the economic growth model needs to be revised to reduce its reliance on energy-intensive industries, while in eastern Xinjiang, restructuring the energy mix towards cleaner sources is essential. Additionally, promoting low-carbon industries and improving green energy efficiency across the region are critical strategies for advancing sustainable development and meeting China’s broader environmental goals.
4.2. Scalability and Applicability of Methods and Results
The methodologies used in this study, specifically the Tapio decoupling index and LMDI decomposition, are not only applicable to Xinjiang but can also be effectively adapted for analyzing carbon emissions in other regions with varying economic and environmental contexts. The Tapio index provides a flexible framework for assessing the degree of decoupling between economic growth and carbon emissions, which is crucial for regions that are either rapidly industrializing or undergoing significant economic transitions. The LMDI decomposition method, with its precision and ability to isolate the impact of individual factors such as energy intensity, economic structure, and technological advancement, allows for a detailed understanding of the dynamics driving carbon emissions. This method is particularly advantageous in regions where energy consumption patterns and industrial activities vary significantly, as it can accommodate a wide range of data inputs and provide nuanced insights without residuals, unlike some other decomposition methods.
The results obtained from this study, particularly the identification of key drivers of carbon emissions and the categorization of regional decoupling types, offer valuable insights that are likely applicable to other high-emission regions. For instance, this study’s findings on the influence of energy intensity and economic structure on carbon emissions can be used to inform similar analyses in regions like Inner Mongolia, which shares some economic characteristics with Xinjiang, such as heavy reliance on coal and energy-intensive industries. Furthermore, the successful application of carbon capture and storage (CCS) technologies in Karamay and the promotion of renewable energy in Altay provide a replicable model for other regions aiming to balance economic growth with carbon emission reductions.
Moreover, the insights gained from the regional disparities within Xinjiang highlight the importance of tailoring policy interventions to specific local conditions. This suggests that other regions with diverse economic and environmental profiles could benefit from a similar localized approach to decoupling analysis. For example, the strategies used in southern Xinjiang to promote low-carbon industries could be adapted for regions in other parts of China or globally where similar conditions prevail. Future research should focus on testing these methods and findings in different contexts, considering the unique economic drivers, energy resources, and policy frameworks of each region. This will not only validate the robustness of the methods used but also expand their applicability, making them valuable tools for global efforts to achieve sustainable development and carbon neutrality.
4.3. Recommendations
To effectively decouple carbon emissions from economic growth in Xinjiang, several key strategies need to be implemented. First, it is essential to enhance energy efficiency and reduce carbon intensity, particularly within the industrial sectors of northern and eastern Xinjiang. These regions, being heavily reliant on traditional energy sources, would benefit significantly from adopting cleaner technologies, optimizing energy consumption, and promoting the use of renewable energy sources. By upgrading industrial processes and integrating high-efficiency equipment, these sectors can reduce their carbon footprint while maintaining economic growth.
Regional disparities in carbon emissions also highlight the need for targeted policies tailored to the specific circumstances of different areas within Xinjiang. For instance, northern Xinjiang should prioritize transitioning from energy-intensive industries to high-tech and service sectors. This transition can be supported by creating incentives for businesses to innovate and adopt green technologies. In contrast, eastern Xinjiang, where reliance on fossil fuels remains high, should focus on reducing this dependence through investments in renewable energy infrastructure and improving energy efficiency across all sectors.
Furthermore, the enforcement of stricter environmental regulations is critical to ensuring that industries adhere to emission reduction targets. This can be achieved through regular monitoring and stringent verification processes, coupled with economic incentives such as tax breaks or subsidies for companies that demonstrate substantial progress in reducing their emissions. These measures will not only promote compliance but also encourage industries to innovate and adopt more sustainable practices.
Finally, promoting low-carbon development across all regions of Xinjiang is crucial for long-term sustainability. This can be achieved by fostering the growth of low-carbon industries, particularly in the southern regions, where economic activities are less dependent on heavy industry. Encouraging the adoption of green technologies and providing support for businesses to reduce their carbon footprint will contribute significantly to the overall goal of sustainable economic development in Xinjiang.
5. Limitations
This study identified and discussed several limitations that may impact the overall results and should be considered when interpreting and applying the findings. The data used in this study were primarily sourced from statistical yearbooks and relevant literature, which may suffer from time lags, incompleteness, or inconsistencies, particularly in sector-specific carbon emission data. These limitations in data quality may influence the precision of the results, especially in sector-specific analyses. However, the identification of overall trends and key driving factors remains valuable for guiding future research and policy development. Additionally, the analysis using the LMDI model and Tapio decoupling index is based on several assumptions, such as levels of economic activity, energy intensity, and energy structure. The validity of these assumptions and the selection of parameters directly impact the reliability of the results. Therefore, while these model assumptions provide a useful framework for analysis, they may lead to deviations from actual conditions, and caution should be exercised when interpreting the findings.
This study’s focus on Xinjiang as a whole, without detailed differentiation among its sub-regions, presents another limitation. Significant economic and environmental differences exist within Xinjiang, and a unified analysis might not fully capture how these disparities affect carbon emissions. For example, the differences in economic development and energy structure between southern and northern Xinjiang may not be fully reflected in a unified analysis, potentially underestimating or overestimating regional contributions to carbon emissions. Furthermore, the study period from 2004 to 2020, while covering a significant time span, may not fully account for future trends and policy changes that could significantly impact carbon emissions dynamics. Lastly, although this study analyzed carbon emissions in major sectors, data for some sub-sectors may be insufficient, limiting the comprehensiveness of the analysis. This lack of detailed sectoral data may lead to an incomplete analysis of key drivers of carbon emissions in certain industries, potentially underestimating or overestimating their contributions.
Despite these limitations, this study provides important preliminary insights into the relationship between economic growth and carbon emissions in Xinjiang. While data quality and model assumptions may introduce some margin of error, the identification of overall trends and key drivers remains valuable. The spatial and temporal limitations highlight the need for more detailed regional analyses and long-term trend predictions in future research. Moreover, the limitations in sectoral analysis suggest the necessity for further data collection and analysis of sub-sectors to provide more comprehensive policy recommendations.
Author Contributions
Conceptualization, L.J. and B.Z.; methodology, L.J.; validation, B.Z. and Z.L.; formal analysis, L.J.; investigation, L.J., B.Z. and Z.L.; resources, B.Z.; data curation, B.Z. and Z.L.; writing—original draft preparation, L.J.; writing—review and editing, B.Z. and Z.L.; visualization, B.Z.; supervision, B.Z.; discussion of content, Z.L.; All authors have read and agreed to the published version of the manuscript.
Funding
This research was funded by the Key Research and Development Program of the Xinjiang Uygur Autonomous Region (grant no. 2022B01010) and the Major Project of the National Social Science Foundation of China (grant no. 21&ZD133).
Data Availability Statement
The original contributions presented in this study are included in the article; further inquiries can be directed to the corresponding author.
Conflicts of Interest
The authors declare no conflicts of interest.
Abbreviations
| CCS | Carbon capture and storage |
| GDP | Gross domestic product |
| IDA | Index decomposition analysis |
| IPAT | Impact = Population × Affluence × Technology |
| IPCC | Intergovernmental Panel on Climate Change |
| LMDI | Logarithmic Mean Divisia Index |
| SDA | Structural decomposition analysis |
References
- Zhan, Y.; Li, Z. Analysis of carbon emissions from the textile and garment industry in Xinjiang. Inn. Mong. Sci. Econ. 2023, 20, 6–9. (In Chinese) [Google Scholar]
- HKTDC Research. Xinjiang: Market Profile. Available online: https://research.hktdc.com/en/data-and-profiles/mcpc/provinces/xinjiang (accessed on 22 August 2024).
- Pang, J.; Liao, Y.; Sun, K.; Shi, Y. Analysis of the decoupling of China’s economic growth from coal consumption and the factors influencing it. China Environ. Sci. 2024, 44, 1144–1157. (In Chinese) [Google Scholar]
- He, F.; Liu, T.; Zhou, Z.; Hu, R. Study on the relationship between carbon emission and economic growth based on EKC theory: A comparative analysis between Zhejiang Province and Anhui Province. Ecol. Econ. 2024, 40, 21–29. [Google Scholar]
- Tapio, P. Towards a theory of decoupling: Degrees of decoupling in the EU and the case of road traffic in Finland between 1970 and 2001. Transp. Pol. 2005, 12, 137–151. [Google Scholar] [CrossRef]
- Zhang, H.; Yuan, P.; Zhu, Z. Carbon decoupling effect and emission reduction pathway in the Yellow River Basin. Resour. Sci. 2024, 40, 59–69. [Google Scholar]
- Huang, H.; Zuo, W.; Xu, S. Study on the decoupling effect and driving factors of carbon emissions from transportation and energy in the Yangtze River Economic Zone. Yangtze River Basin Resour. Environ. 2022, 31, 862–877. (In Chinese) [Google Scholar]
- Gao, X.; Lin, L.; Li, M.; Hailin, W.; Pan, X. Implied carbon and drivers of China’s exports to the EU: A provincial scale analysis. Syst. Eng. Theor. Pract. 2024, 44, 2423–2433. (In Chinese) [Google Scholar]
- Huang, Y. Analysis of Influencing Factors of Industrial Carbon Emission and Carbon Emission Forecast of Shanghai Municipality. Master’s Thesis, Shanghai University of Finance and Economics, Shanghai, China, 2023. (In Chinese). [Google Scholar]
- Ying, Y.; Wu, J.; Chen, H. Spatial and temporal carbon footprint patterns in Chengdu-Chongqing region and the factors affecting them. Heilongjiang Environ. Circ. 2024, 37, 19–24. (In Chinese) [Google Scholar]
- Liu, H.; Zhao, H.; Wang, M.; Fan, D. The impact of technological progress and structural adjustment on industrial emission reduction in Guangdong Province: An empirical analysis based on LMDI. Environ. Sci. Re. 2024, 37, 1654–1665. [Google Scholar]
- Lin, B.; Jiang, Z. Prediction of environmental Kuznets curve of carbon dioxide in China and analysis of its influencing factors. Manag. World 2009, 4, 27–36. (In Chinese) [Google Scholar]
- Zhu, Q.; Peng, X.; Lu, Z.; Yu, J. Analysis model and demonstration of the impact of population and consumption on carbon emissions. Chin. J. Popul. Resour. 2010, 20, 98–102. (In Chinese) [Google Scholar]
- Yang, Q.; Liu, H. Decomposition and influencing factors of regional differences in carbon dioxide emissions in China: A study based on provincial panel data from 1995 to 2009. J. Quant. Tech. Econ. 2012, 29, 36–49. (In Chinese) [Google Scholar]
- He, X.; Zhang, Y. Influencing factors of industrial carbon emissions and CKC recombination effect in China: An empirical study of dynamic panel data based on STIRPAT Model. China Ind. Econ. 2012, 1, 26–35. (In Chinese) [Google Scholar]
- Eibinger, T.; Deixelberger, B.; Manner, H. Panel data in environmental economics: Econometric issues and applications to IPAT models. J. Environ. Econ. Manag. 2024, 125, 102941. [Google Scholar] [CrossRef]
- Li, Z.; Chen, J.; Wang, P.; Zhou, Z.; Chen, X. The synergy between temporal and spatial effects of human activities on CO2 emissions in Chinese cities. Environ. Impact. Assess. Rev. 2023, 103, 107264. [Google Scholar] [CrossRef]
- Lu, S.; Huo, Y.; Su, N.; Fan, M.; Wang, R. Energy consumption forecasting of urban residential buildings in cold regions of China. J. Energy Eng. 2023, 149, 04023002. [Google Scholar] [CrossRef]
- Hua, J.; Gao, J.; Chen, K.; Li, J. Driving effect of decoupling provincial industrial economic growth and industrial carbon emissions in China. Int. J. Environ. Res. Public Health 2022, 20, 145. [Google Scholar] [CrossRef] [PubMed]
- Zhang, Y.; Dong, Q.; Ma, G. Effects of rural population aging on agricultural carbon emissions in China. Sustainability 2023, 15, 6812. [Google Scholar] [CrossRef]
- Jenkins, D.G.; Erb, K.H.; Haberl, H. Socio-ecological predictors of global patterns in human appropriation of net primary production. Ecol. Indic. 2022, 142, 109249. [Google Scholar] [CrossRef]
- Wu, C.; Sun, S.; Cui, Y.; Xing, S. Driving factors analysis and scenario prediction of CO2 emissions in power industries of key provinces along the Yellow River based on LMDI and BP neural network. Front. Ecol. Evol. 2024, 12, 1362541. [Google Scholar] [CrossRef]
- Chong, C.H.; Zhou, X.; Zhang, Y.; Ma, L.; Bhutta, M.S.; Li, Z.; Ni, W. LMDI decomposition of coal consumption in China based on the energy allocation diagram of coal flows: An update for 2005–2020 with improved sectoral resolutions. Energy 2023, 285, 129266. [Google Scholar] [CrossRef]
- Feng, D.; Xu, W.; Gao, X.; Yang, Y.; Feng, S.; Yang, X.; Li, H. Carbon emission prediction and the reduction pathway in industrial parks: A scenario analysis based on the integration of the LEAP model with LMDI decomposition. Energies 2023, 16, 7356. [Google Scholar] [CrossRef]
- Liu, T.; Dong, H.; Gao, L.; Luo, T. Analysis of factors affecting decoupling of industrial carbon emissions and research on emission reduction countermeasures in Ningxia. J. Ningxia Univ. 2023, 44, 356–361. (In Chinese) [Google Scholar]
- Zhang, N. Decoupling analysis of economic growth and energy and carbon emissions in Henan Province. Coop. Econ. Sci. Technol. 2022, 11, 7–9. (In Chinese) [Google Scholar]
- Jain, S.; Rankavat, S. Analysing driving factors of India’s transportation sector CO2 emissions: Based on LMDI decomposition method. Heliyon 2023, 9, e19871. [Google Scholar] [CrossRef]
- Yuan, X.; Shi, J. Analysis of ecological carrying capacity of arable land in southern Xinjiang based on DPSIR-TOPSIS model. J. Tarim Univ. 2024, 35, 100–112. (In Chinese) [Google Scholar]
- Li, G.; Ma, Y.; Zeng, X. Evaluation of green development level in national key ecological function areas: The case of Shaanxi Province. Stat. Decis. Making 2024, 40, 129–133. [Google Scholar]
- Ortega-Ruiz, G.; Mena-Nieto, A.; García-Ramos, J.E. Is India on the right pathway to reduce CO2 emissions? Decomposing an enlarged Kaya identity using the LMDI method for the period 1990–2016. Sci. Total Environ. 2020, 737, 139638. [Google Scholar] [CrossRef]
- Yang, P.; Liang, X.; Drohan, P.J. Using Kaya and LMDI models to analyze carbon emissions from the energy consumption in China. Environ. Sci. Pollut. Res. Int. 2020, 27, 26495–26501. [Google Scholar] [CrossRef]
- Li, W.; Yu, X. Xinjiang Production and Construction Corps Statistical Yearbook 2020; China Statistical Publishing House: Beijing, China, 2020. (In Chinese) [Google Scholar]
- Sun, X.L.; Zhu, M.Q. Formulation of public policy against limited resources—Taking the policy of “redisposing, coordinating and paid utilizing of coal resources” in Shanxi province, china as an example. In Proceedings of the 9th International Conference on Public Administration 2013, Cape Town, South Africa, 31 October 2013. [Google Scholar]
- Cui, D.F.; Zhu, J.H. Research on the evaluation of urban-rural integration process in Xinjiang uygur autonomous region of China. In Proceedings of the 8th International Conference on Innovation and Management, Fukuoka Kitakyushu, Japan, 30 November 2022. [Google Scholar]
- Han, X.; Zheng, Y.; He, Y.; Wang, Y.; Luo, J. Study on the optimization measures of carbon emissions in Chengdu’s territorial space under the trend of clean energy and energy structure adjustment. In E3S Web of Conferences; EDP Sciences: Les Ulis, France, 2023; Volume 406, p. 02028. [Google Scholar]
- Ma, X.; Wen, D.G.; Yang, G.D.; Li, X.F.; Diao, Y.J.; Dong, H.H.; Cao, W.; Yin, S.G.; Zhang, Y.M. Potential assessment of CO2 geological storage based on injection scenario simulation: A case study in eastern Junggar Basin. J. Groundw. Sci. Eng. 2021, 9, 279–291. [Google Scholar]
- Zhang, J.; Guo, Y.; Pau, D.; Li, K.; Xie, K.; Zou, Y. Pyrolysis kinetics and determination of organic components and N-alkanes yields of Karamay transformer oil using TG, FTIR and Py-GC/MS analyses. Fuel 2021, 306, 121691. [Google Scholar] [CrossRef]
- Wang, L.; Yang, S.; Chen, K.; Liu, S.; Jin, X.; Xie, Y. A long-duration glacier change analysis for the Urumqi River Valley, a representative region of central Asia. Remote Sens. 2024, 16, 1489. [Google Scholar] [CrossRef]
- Luo, K.; Wang, H.; Ma, C.; Wu, C.; Zheng, X.; Xie, L. Carbon sinks and carbon emissions balance of land use transition in Xinjiang, China: Differences and compensation. Sci. Rep. 2022, 12, 22456. [Google Scholar] [CrossRef] [PubMed]
- Wang, M.; Feng, L.; Zhang, P.; Cao, G.; Liu, H.; Chen, J.; Li, X.; Wei, W. Carbon emissions in the Xinjiang production and construction corps and driving factors. Front. Energy Res. 2021, 9, 627149. [Google Scholar] [CrossRef]
- Qin, J.; Tao, H.; Cheng, C.; Brindha, K.; Zhan, M.; Ding, J.; Mu, G. Analysis of factors influencing carbon emissions in the energy base, Xinjiang autonomous region, China. Sustainability 2020, 12, 1089. [Google Scholar] [CrossRef]

Disclaimer/Publisher’s Note: The statements, opinions and data contained in all publications are solely those of the individual author(s) and contributor(s) and not of MDPI and/or the editor(s). MDPI and/or the editor(s) disclaim responsibility for any injury to people or property resulting from any ideas, methods, instructions or products referred to in the content. |
© 2024 by the authors. Licensee MDPI, Basel, Switzerland. This article is an open access article distributed under the terms and conditions of the Creative Commons Attribution (CC BY) license (https://creativecommons.org/licenses/by/4.0/).