Article

Estimating the Canopy Nitrogen Content in Maize by Using the Transform-Based Dynamic Spectral Indices and Random Forest

1
Institute of Agricultural Economics and Information Technology, NingXia Academy of Agriculture and Forestry Sciences, Yinchuan 750002, China
2
School of Computer Science and Engineering, Nanjing University of Science and Technology, Nanjing 210018, China
3
College of Geography and Tourism, Qilu Normal University, Jinan 250200, China
*
Author to whom correspondence should be addressed.
Sustainability 2024, 16(18), 8011; https://doi.org/10.3390/su16188011
Submission received: 5 August 2024 / Revised: 11 September 2024 / Accepted: 11 September 2024 / Published: 13 September 2024
(This article belongs to the Section Sustainable Agriculture)

Abstract

:
The monitoring of maize health status is crucial for achieving sustainable agricultural development. Canopy nitrogen content (CNC) is essential for the synthesis of proteins and chlorophyll in maize leaves and, thus, significantly influences maize growth and yield. In this study, we developed a CNC spectral estimation model based on transform-based dynamic spectral indices (TDSI) and the random forest (RF) algorithm, enabling the rapid monitoring of CNC in maize canopy leaves. A total of 60 maize canopy leaf samples and the corresponding field canopy spectra were collected. Subsequently, the canopy spectra data were transformed using centralization transformation (CT), first derivative (D1), second derivative (D2), detrend transformation (DT), and min-max normalization (MMN) methods. Three types of band combination methods (band difference, band ratio, and normalized difference) were used to construct the TDSIs. Finally, the optimal TDSI was selected and used as the independent variable, and the measured CNC was used as the dependent variable to build a CNC spectral estimation model based on the RF algorithm. Results indicated that (1) TDSIs can more accurately characterize the CNC in maize, with a correlation coefficient approximately 102% higher than those of raw spectral bands. (2) The optimal TDSIs included T D S I 1247 , 1249 C T - R I , T D S I 625 , 641 C T - N D I , T D S I 540 , 703 D 1 - R I , T D S I 514 , 540 D 1 - R I , T D S I 514 , 530 D 1 - D I , T D S I 540 , 697 D 1 - N D I , T D S I 970 , 1357 D 2 - D I , T D S I 523 , 1031 D 2 - N D I , T D S I 617 , 620 D T - R I , and T D S I 2109 , 2127 M M N - N D I . (3) The CNC spectral estimation model based on the optimal TDSIs, and the RF algorithm achieved accuracy indices with R2 and RPIQ of 0.92 and 4.99, respectively, representing a maximum improvement of approximately 67.27% over the traditional CNC spectral estimation model (based on the R2 value). This study provides an approach for the rapid and accurate estimation of CNC in maize, contributing to the sustainable development of agriculture.

1. Introduction

Maize (Zea mays L.) is one of the most important food crops globally [1]. Throughout the growth cycle of maize, various external stress factors (e.g., moisture, temperature, and illumination) can affect maize growth and yield [2,3]. Canopy nitrogen content (CNC) is a key indicator of maize health status and is closely associated with the photosynthetic efficiency of maize [4,5]. Therefore, monitoring CNC is critical for assessing its maize growth status and ensuring sustainable agriculture.
Hyperspectral remote sensing techniques have developed into a practical approach for the nondestructive measurement and monitoring of CNC in maize [4,6]. Compared to laboratory-based chemical measurements of CNC in maize, spectral estimation approaches offer several obvious advantages, such as efficiency, non-destructiveness, and low cost. Furthermore, the vegetation indices-driven spectral estimation approach was commonly used in the CNC spectral measurement of plants at the field scale [7,8]. De Souza et al. [9] evaluated the effectiveness of various vegetation indices in estimating the nitrogen nutrition index of sweet pepper crops. Their results suggested that the relationship between vegetation indices and the nitrogen nutrition index was strongest, and certain vegetation indices may serve as valuable tools for estimating crop nitrogen status. Xu et al. [10] selected 19 vegetation indices as candidate features and then chose the optimal features as the independent variables, with the measured nitrogen content of the rice leaves as the dependent variable. The constructed regression models proved effective in estimating the nitrogen content in rice fields.
Nevertheless, vegetation indices with specific mathematical transformations of multiple bands are typically designed for specific areas, and these indices may become ineffective when applied to different research areas due to changes in environmental conditions, growth stages, and crop varieties. The vegetation indices-driven CNC spectral estimation model exhibited high uncertainties. Elmetwalli et al. [11] indicated that moisture-induced stress influencing the growth of wheat and maize not only affects the blue, green, and red spectral regions but also causes the green peak in moisture-stressed treatments to shift towards longer wavelengths. Furthermore, Inoue et al. [12], Chen et al. [13], and Wen et al. [6] suggested many classical vegetation spectral indices are limited in their robustness and general applicability due to being designed for particular regional conditions, growth stages, and crop species. Therefore, the vegetation indices-driven CNC spectral estimation model should be optimized as the plant environment changes continuously.
The dynamic spectral index, based on a two-band combination approach, is well-suited for characterizing the CNC status in maize under complex field conditions [6,14]. Zhao et al. [15] reported that the dynamic spectral index approach can create millions of possible spectral indices, making the identification of optimal CNC spectral indices easier. Abulaiti et al. [16] suggested that a two-band combination approach can be useful for determining optimal CNC spectral indices for crop nitrogen concentrations of the cotton canopy; the model using a ratio-based dynamic spectral index is the most accurate for CNC estimation.
However, previous studies on the construction of dynamic spectral indices failed to address the noise and irrelevant information in the raw canopy spectra of maize, thereby limiting the applicability of dynamic spectral indices in CNC spectral estimation [17,18]. To address this limitation, in this study, several spectral mathematical transformations were employed to enhance the distinctive CNC signals and reduce noise in the raw canopy spectra of maize. Subsequently, transform-based dynamic spectral indices (TDSI) were constructed using transformed spectral data through a two-band combination method. Finally, the optimal TDSI was selected and used as input to build a CNC spectral estimation model using the random forest (RF) algorithm [19,20,21].
RF has proven to be an efficient method for constructing plant spectral estimation models of various biochemical parameters [22,23,24,25]. RF is described as an ensemble learning model that improves accuracy and robustness by constructing multiple decision trees and combining their predictions [26,27]. It is capable of handling high-dimensional spectral data and preventing overfitting, making it widely applicable in classification and prediction tasks. Liang et al. [28] have reported that the RF model posed a high accuracy in the spectral estimation of leaf nitrogen contents, with an accuracy index of R2 of 0.87. López-Calderón et al. [29] constructed an effective RF model for spectral estimation of the nitrogen content of forage maize, and the RF model showed a satisfactory performance. Overall, the combination of RF and TDSI exhibited great potential in constructing an accurate CNC spectral estimation model in maize.
This study aimed to (1) build the TDSI based on canopy spectra data of the maize; (2) select the optimal TDSI for characterizing the CNC of maize; (3) construct a CNC spectral estimation model for maize.

2. Materials and Methods

2.1. Experimental Area and Design

The experimental area is located in Ningxia Hui Autonomous Region (Province), China (Figure 1), with geographical coordinates ranging from 110° E to 120° E and 38° N to 39° N. The area has an average elevation of approximately 1344 m and is characterized by a temperate continental climate [30]. The mean annual precipitation is around 295 mm, with an average annual temperature of 8.3 °C. The predominant soil type in the region is sandy loam. According to open soil survey reports [31], the soil in the study area has an average pH of 8.36, organic matter content of 6.0 g/kg, available phosphorus content of 4.3 mg/kg, available potassium content of 340 mg/kg, and total nitrogen content of 0.44 g/kg. These soil characteristics suggest that the experimental area is suitable for maize cultivation and the development of a CNC spectral estimation model.
A total of 10 experimental grids were set up (isolated by fences) within the experimental area. At each grid, two experimental sites were predetermined (as shown in Figure 1). The maize canopy leaves and those field spectral data were collected during the maize’s jointing, tasseling, and grain-filling stages, resulting in a total of 60 canopy samples. The maize variety used was Xianyu 1225, with a planting row spacing of 60 cm and a plant spacing of 18~20 cm. In addition, the first five experimental grids (N1 to N5) were subjected to five different nitrogen fertilizer gradients (as shown in Table 1), while the sixth to tenth rectangular grids (N6 to N10) were replicates of the first five grids. Variations in the growth status of maize within different experimental grids were created in this experiment, making them comparable to the growth status of maize over a larger regional scale, thereby supporting the construction of a robust CNC spectral estimation model.

2.2. Data Acquisition and Preprocessing

2.2.1. Canopy Leaf Sample Acquisition and Spectral Measurement

The ASD FieldSpec4 portable spectroradiometers (Analytical Spectral Devices, Inc., Boulder, CO, USA) were used to measure the spectral reflectance of maize canopy leaves. The ASD FieldSpec4 has a spectral range of 350 nm to 2500 nm [32]. Specifically, within the range of 350 nm to 1000 nm, the sampling interval is 1.4 nm, and the spectral resolution is 3 nm. In the range of 1000 nm to 2500 nm, the sampling interval is 2 nm, and the spectral resolution is 10 nm. A total of 2151 spectral bands were collected.
In this study, the top 1~4 leaf positions in the maize leaf hierarchy were recognized as the maize canopy leaves. Maize canopy spectral measurements were conducted under clear and cloudless weather conditions between 10:00 and 14:00. During spectral measurements, the fiber optic probe was positioned vertically downward at a height of approximately 0.5 m to 0.8 m above the maize canopy leaves. Ten spectral curves were measured for each maize canopy leaf sample. To eliminate the effects of changes in the field environmental conditions and sunlight angle, a whiteboard calibration was performed [33].

2.2.2. Preprocessing of Canopy Spectral Data

First, outlier spectral curves from each canopy leaf sample were removed based on the shape and peak characteristics of standardized spectral curves of maize obtained under laboratory conditions. Subsequently, the remaining spectral data were averaged to obtain representative spectra for each canopy leaf sample. Finally, based on the literature review and observational analysis [34], the noisy spectral ranges (350~399 nm) were removed from each sample. The preprocessing of canopy spectral data was conducted using ViewSpecPro software (version 5.6).

2.3. Building the Transform-Based Dynamic Spectral Indices (TDSI)

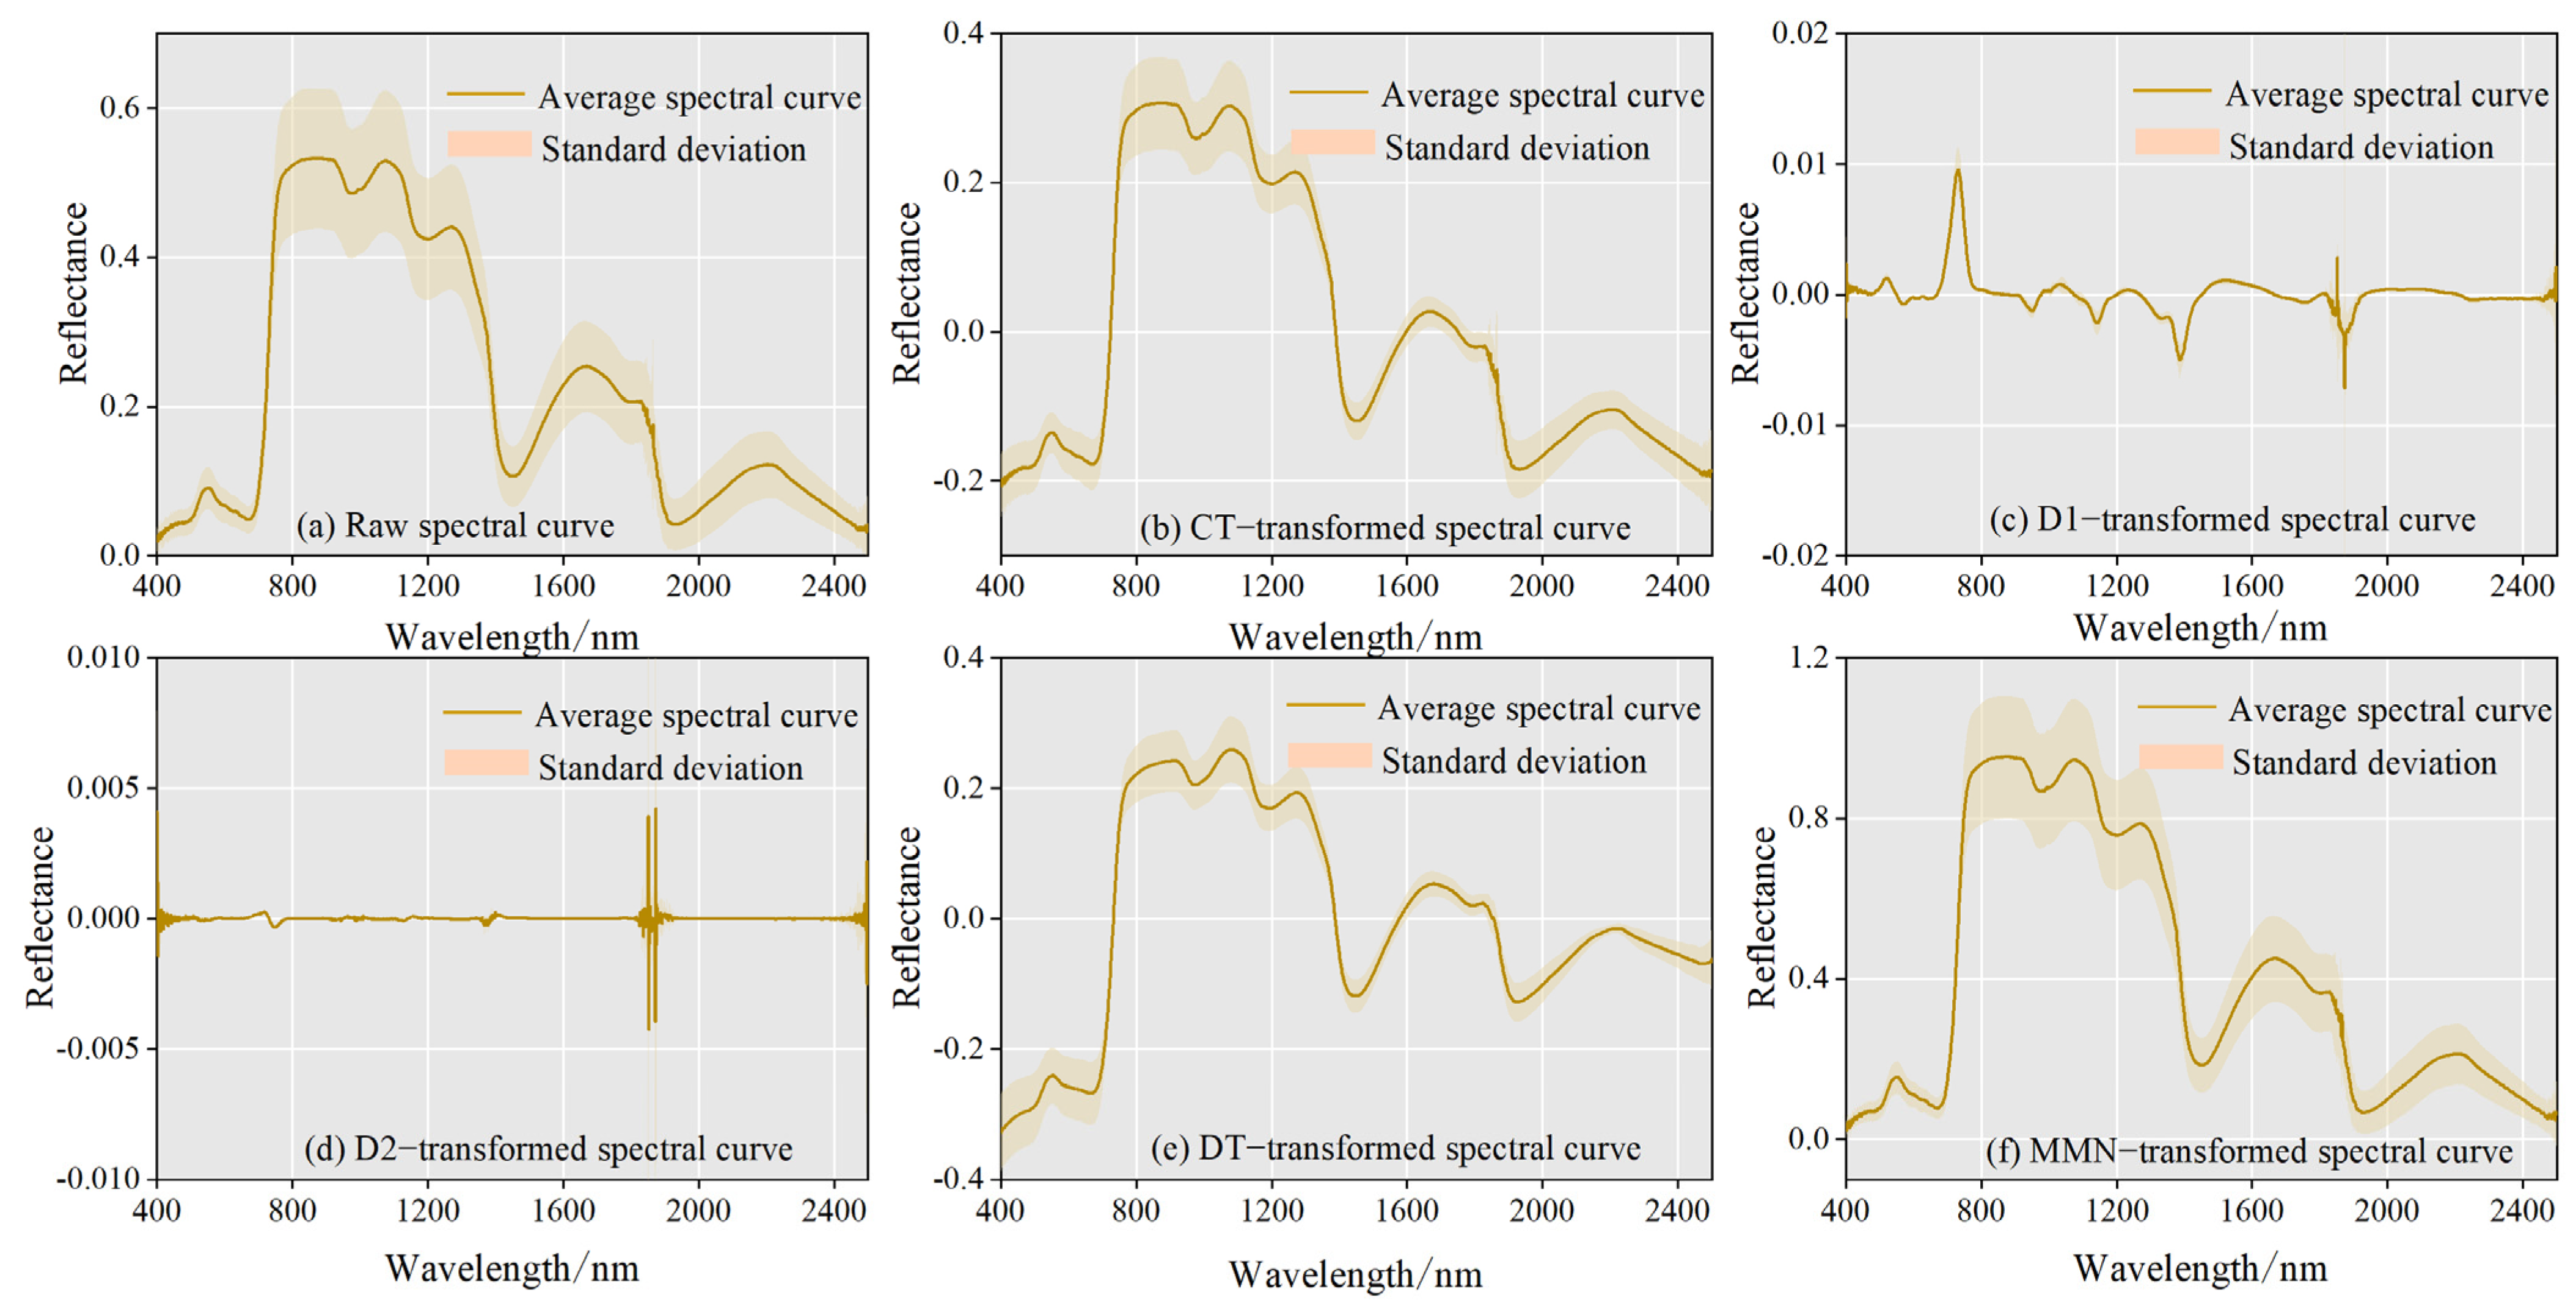
2.3.1. Spectral Transformations

Mathematical transformations are effective in reducing environmental noise and enhancing the spectral absorption features associated with CNC in maize canopy spectra [20,35]. Based on a literature review [16,23,24,36,37,38], five mathematical transformation methods were applied to process the maize canopy spectra: CT (Centralization transformation), D1 (First derivative), D2 (Second derivative), DT (Detrend transformation), and MMN (Min-max normalization).
Centralization transformation (CT) is a spectral transformation method that reduces spectral deviations by removing the absolute absorption values of the spectra [23,24]. After applying this transformation method, the convergence speed of models is improved. The formula can be expressed as follows:
x ¯ k = i = 1 n x i , k n
x CT = x x ¯ k
where n represents the number of spectral samples x i , k denotes the reflectance of the k-th spectral band for the i-th spectral samples. x ¯ k indicates the average reflectance of each spectral band, x is the raw reflectance of each spectral band, and x CT represents the CT-transformed spectral data.
The first derivative (D1) transformation is a spectral data processing method that can effectively reduce the impact of moisture on field spectra, thereby improving the quality and interpretability of spectral data [36]. The calculation formula is shown as follows:
D 1 ( λ i ) = R ( λ i + 1 ) R ( λ i ) Δ λ
where D1(λi) represents the first derivative value at bands λi; R(λi) and R(λi+1) denote the reflectance at bands λi and λi + 1, respectively; and Δλ is the interval between adjacent bands.
Second derivative (D2) transformation is also a spectra processing method that is widely used in spectral analysis of soil and vegetation [16]. Similar to the D1 transformation method, the D2 transformation method could decrease the environmental noise in field spectral data while further enhancing the distinguishability of CNC spectral features. The calculation formula is as follows:
D 2 ( λ i ) = ( R ( λ i + 2 ) R ( λ i + 1 ) + R ( λ i ) ) ( Δ λ ) 2
where D2(λi) represents the second derivative value of spectral band λi; R(λi), R(λi+1), and R(λi+2) indicates the spectral reflectance at bands λi, λi + 1, and λi + 2, respectively; and Δλ is the interval between adjacent bands.
Detrend transformation (DT) aimed to eliminate baseline drift in field spectra, thereby reducing or removing systematic spectral variations caused by different sampling locations, samples, and measurement batches [37]. DT method can be expressed as follows:
DT ( λ i ) = R ( λ i ) f ( λ i )
where DT(λi) is the detrended value at spectral band λi; R(λi) represents the reflectance of the original spectral band λi; and f(λi) means the fitted trend function.
Max-min normalization (MMN) is a spectra transformation method that enhances the differentiation of spectral data among various canopy leaf samples by linearly transforming the data range to a standardized [0, 1] interval [38]. The MMN method not only reduces absolute reflectance variations caused by differences in optical sensors or environmental conditions but also enhances the absorption features of nitrogen in maize leaves. The MMN method can be represented by the following Equation (6):
MMN ( λ i ) = R ( λ i ) R min R max R min
where R(λi) is the reflectance value of the spectral band λi, and Rmin and Rmax represent the minimum and maximum reflectance values across the entire spectral range, respectively.

2.3.2. Dynamic Spectral Indices Construction

The spectral features of nitrogen in maize canopy leaves within the visible-near infrared range are influenced by water, chlorophyll, and plant leaf microstructure [39,40]. To accurately extract the spectral absorption features of nitrogen in maize canopy leaves, three transform-based dynamic spectral indices (TDSI) were constructed: the transform-based dynamic difference index (TDSIDI), the dynamic ratio index (TDSIRI), and the dynamic normalized difference index (TDSINDI). These indices are expressed as Equations (7)–(9) in the following:
T D S I i , j DI = b i b j
T D S I i , j RI = b i / b j
T D S I i , j NDI = ( b i / b j ) / ( b i + b j )
where i and j represent the spectral bands, and b means the reflectance value of the spectral band. bi and bj are the reflectance values of i-th and j-th spectral bands, respectively.

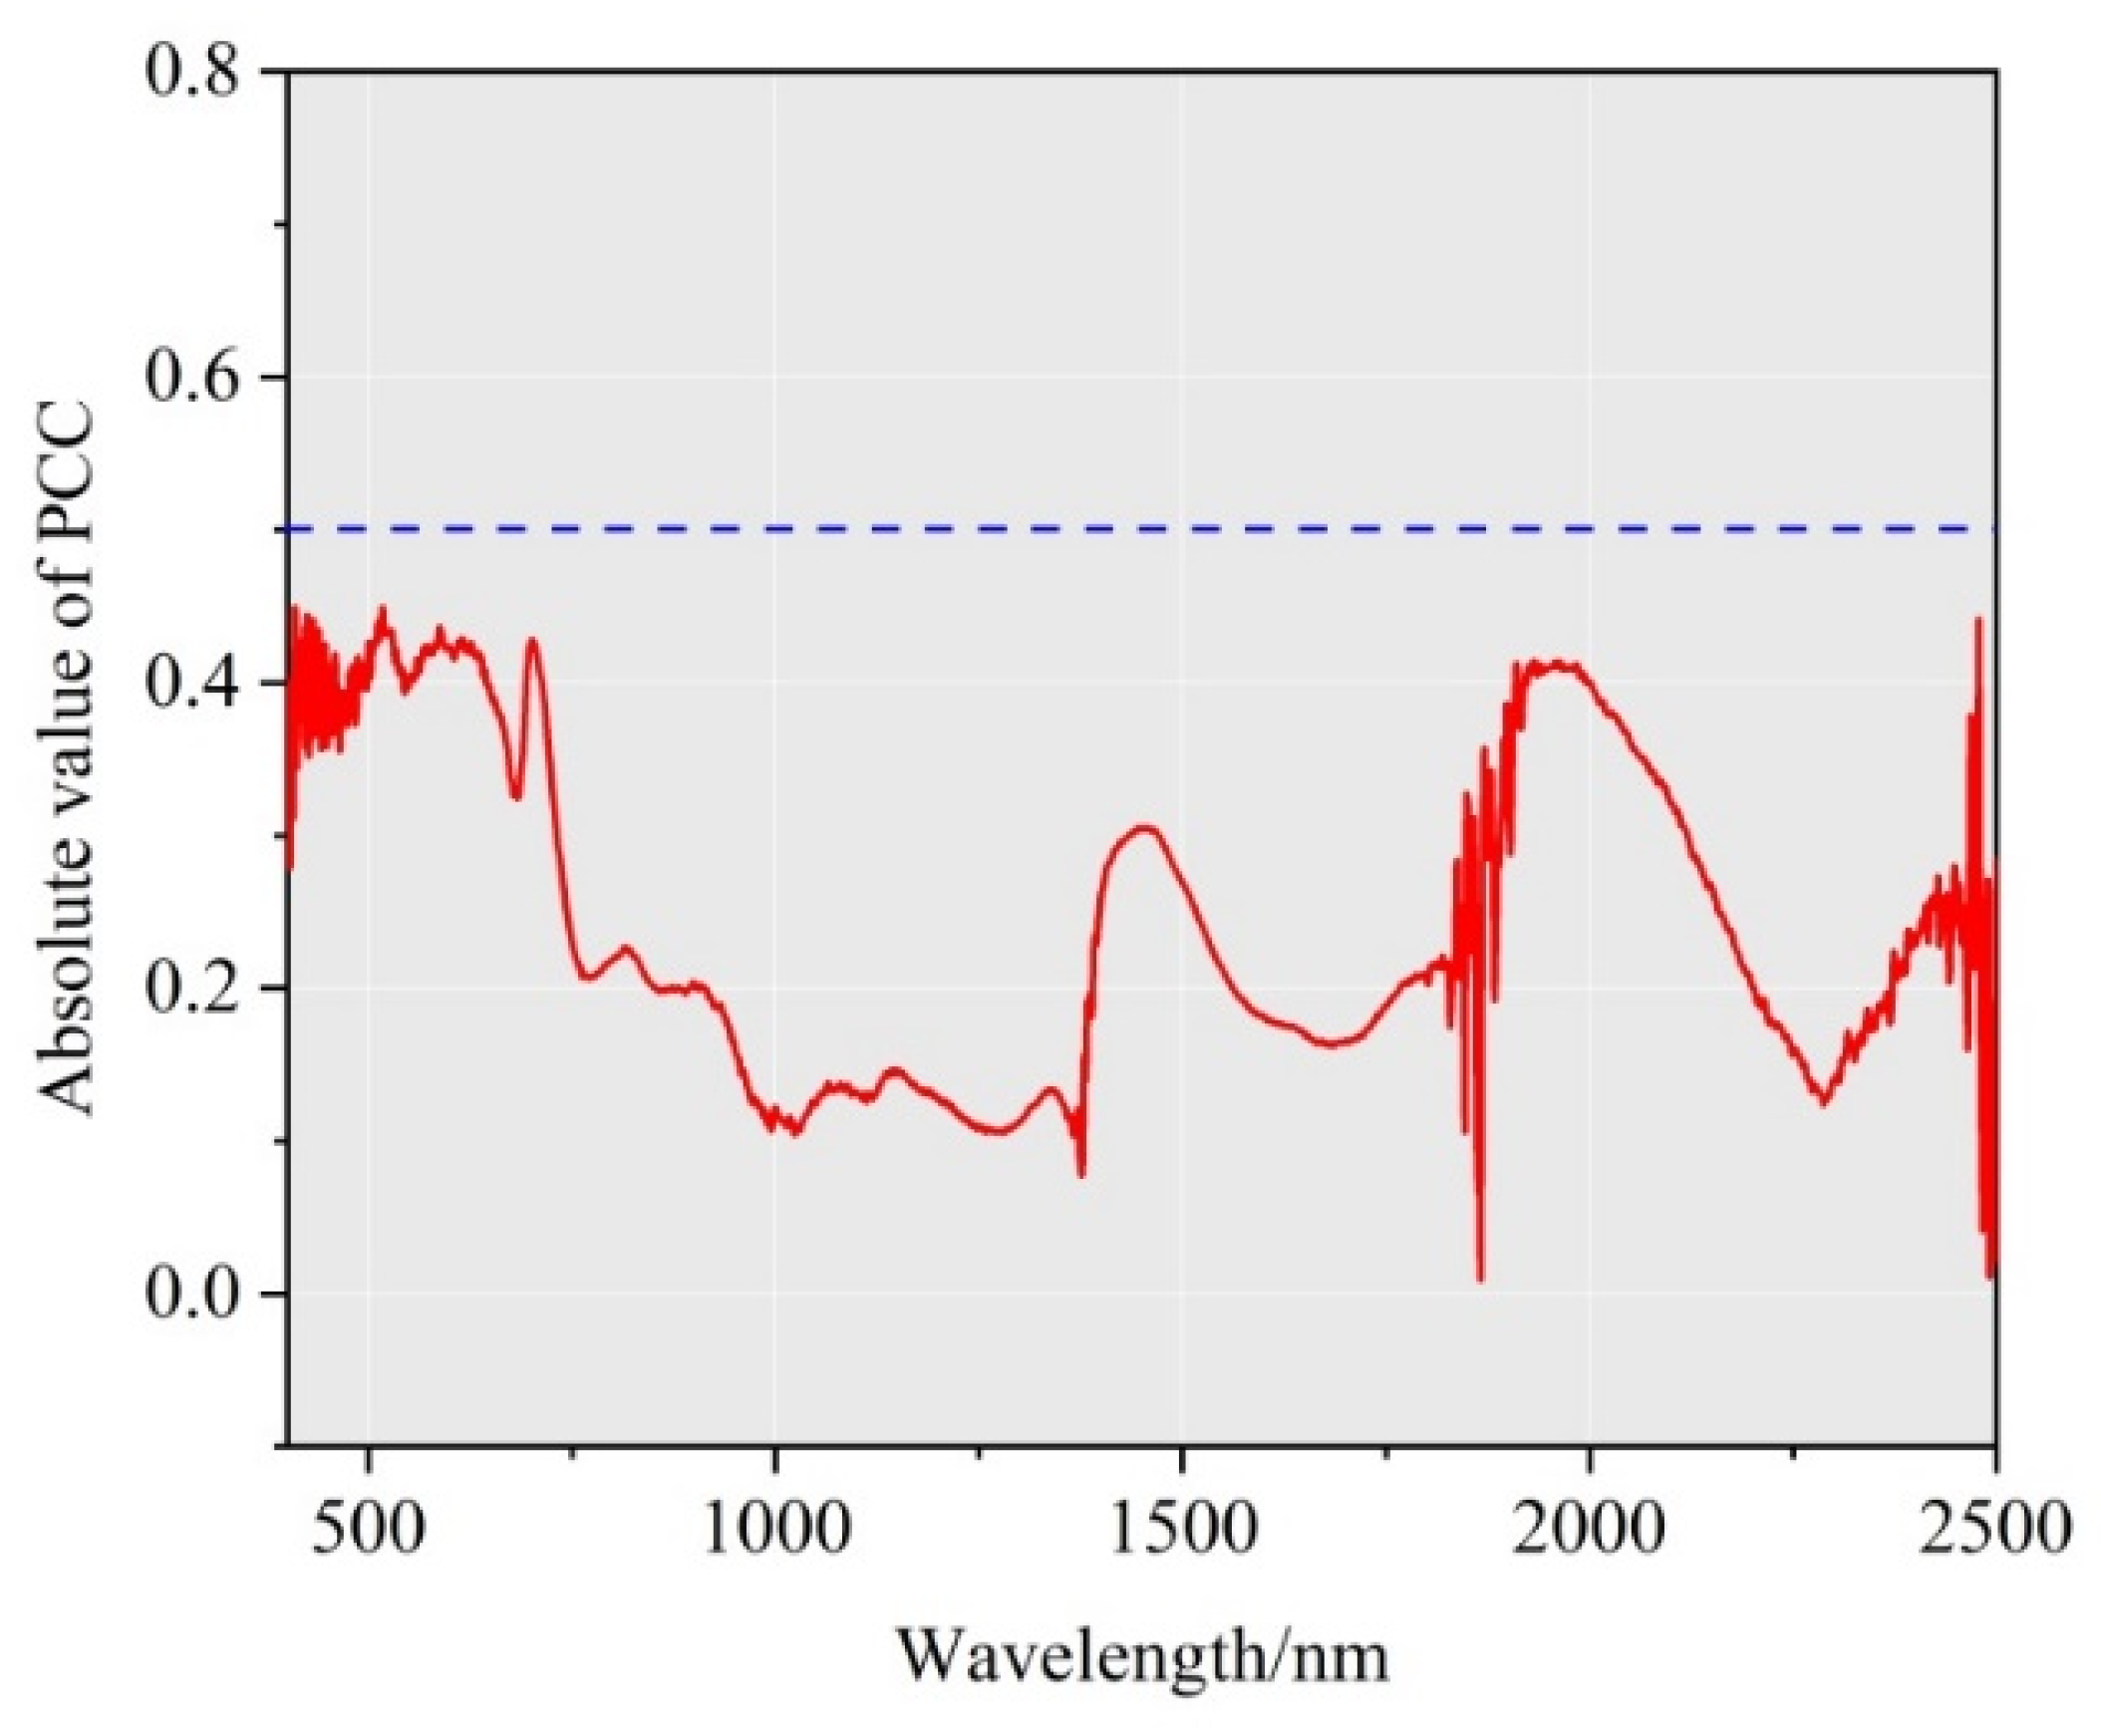
2.3.3. Selecting the Optimal Transform-Based Dynamic Spectral Indices

Based on Equations (7)–(9), millions of TDSIs were generated. Information redundancy exists among these TDSIs, and their correlations with CNC vary in strength. Consequently, it was necessary to select the optimal TDSIs that effectively respond to CNC, and optimized the inputs of the CNC spectral estimation model.
The Pearson correlation coefficient (PCC) is a method used to assess the correlation degree between two sets of variables, X and Y. This method is widely applied in vegetation spectral analysis [41,42]. The PCC value reflects the linear correlation level between maize biochemical parameters and spectral bands, which helps identify the CNC feature bands and optimal TDSIs. The calculation of PCC can be expressed as follows:
PCC = i = 1 n ( X i X ¯ ) ( Y i Y ¯ ) i = 1 n ( Y i Y ¯ ) 2 × i = 1 n ( X i X ¯ ) 2
where n represents the number of maize canopy leaf samples, Xi and Yi indicate the spectral parameters and CNC, respectively, and X ¯ and Y ¯ represent the average values of spectral parameters and CNC, respectively. The PCC ranges from −1 to 1; a PCC value close to 1 indicates a strong positive correlation between X and Y, whereas a PCC value close to −1 indicates a strong negative correlation. A PCC value of 0 only indicates that there is no linear correlation between the two variables. However, this does not exclude the possibility of a non-linear relationship, such as a quadratic relationship, between the variables. In Section 2.3, all statistical analyses were performed using programming methods on the Python 3.8 platform.

2.4. Random Forest

Random forest (RF), first proposed by Breiman in 2001 [26], is an ensemble learning-based predictive model consisting of multiple decision trees. The final prediction result is derived from aggregating votes from individual trees. RF employs a bootstrap aggregating (bagging) process, which involves randomly selecting a fixed number of samples and feature sets from the original dataset [27]. This approach enhances model diversity, effectively addressing the weak generalization capability of decision trees and mitigating overfitting issues [23]. In this study, the RF model was implemented using the Scikit-learn package on the Python 3.8 platform, with the n_estimators parameter set to 200 and random_state set to 42 [43].

2.5. Model Evaluation

10-fold cross-validation was used to select the optimal CNC spectral estimation model and evaluate its performance. The common indices for assessing spectral estimation models include the coefficient of determination (R2), root mean square error (RMSE), and the ratio of performance to inter-quartile range (RPIQ) [7,44,45]. R2 indicates the proportion of variance in the dependent variable that can be explained by the independent variables. RMSE represents the square root of the average of squared differences between estimated and measured values. RPIQ is the ratio of the interquartile range to the root mean square error. According to the relevant literature, an RPIQ ≥ 4.05 indicates a model with very strong estimation accuracy. When 3.37 ≤ RPIQ < 4.05, the estimation capability of the model is considered good. If 2.07 ≤ RPIQ < 3.37, the model is moderate and needs further improvement. For 2.02 ≤ RPIQ < 2.70, the discrepancy between estimated and actual values is substantial, suggesting that the model is not suitable for quantitative spectral analysis. In general, larger values of R2 and RPIQ and smaller values of RMSE indicate better model performance [41,46]. The equations to calculate R2, RMSE, and RPIQ are shown in the following:
R 2 = i = 1 n y i ^ y ¯ 2 i = 1 n y i y ¯ 2
R M S E = 1 n i = 1 n y i ^ y i 2
R P I Q = I Q R M S E
where y i represents the measured CNC, y ^ represents the estimated CNC, y ¯ denotes the average CNC of all canopy leaf samples, n denotes the sample size, and IQ represents the interquartile range (IQ = Q3 − Q1), which is the difference between the third quartile (Q3) and the first quartile (Q1).
Additionally, various algorithms, including multiple linear regression (MLR) [47], artificial neural networks (ANN) [48], partial least squares regression (PLSR) [49], and support vector machine (SVM) [50], were employed to construct CNC spectral estimation models. Although these algorithms have demonstrated relatively average and inconsistent performance across different studies, they were implemented in this research as part of a comparative analysis [51]. All models were programmatically developed and executed on the Python 3.8 platform.

3. Results

3.1. Statistical Characteristics of CNC in Maize

The descriptive statistical characteristics of CNC in maize are shown in Table 2. The CNC ranges from 10.4 g/kg to 25.5 g/kg, with an average value of 16.79 g/kg. The coefficient of variation (CV), used to assess the fluctuation of the CNC data, is 0.30, indicating moderate variability in the sample set [52,53]. While some outliers are present in the canopy leaf samples, they are not prevalent. The discrepancy between the median and mean values suggests a non-normal distribution of the canopy leaf sample dataset, potentially influenced by external factors such as fertilizer application. Additionally, the positive skewness value of the entire sample set indicates a right-skewed distribution of CNC in the canopy leaf sample dataset.

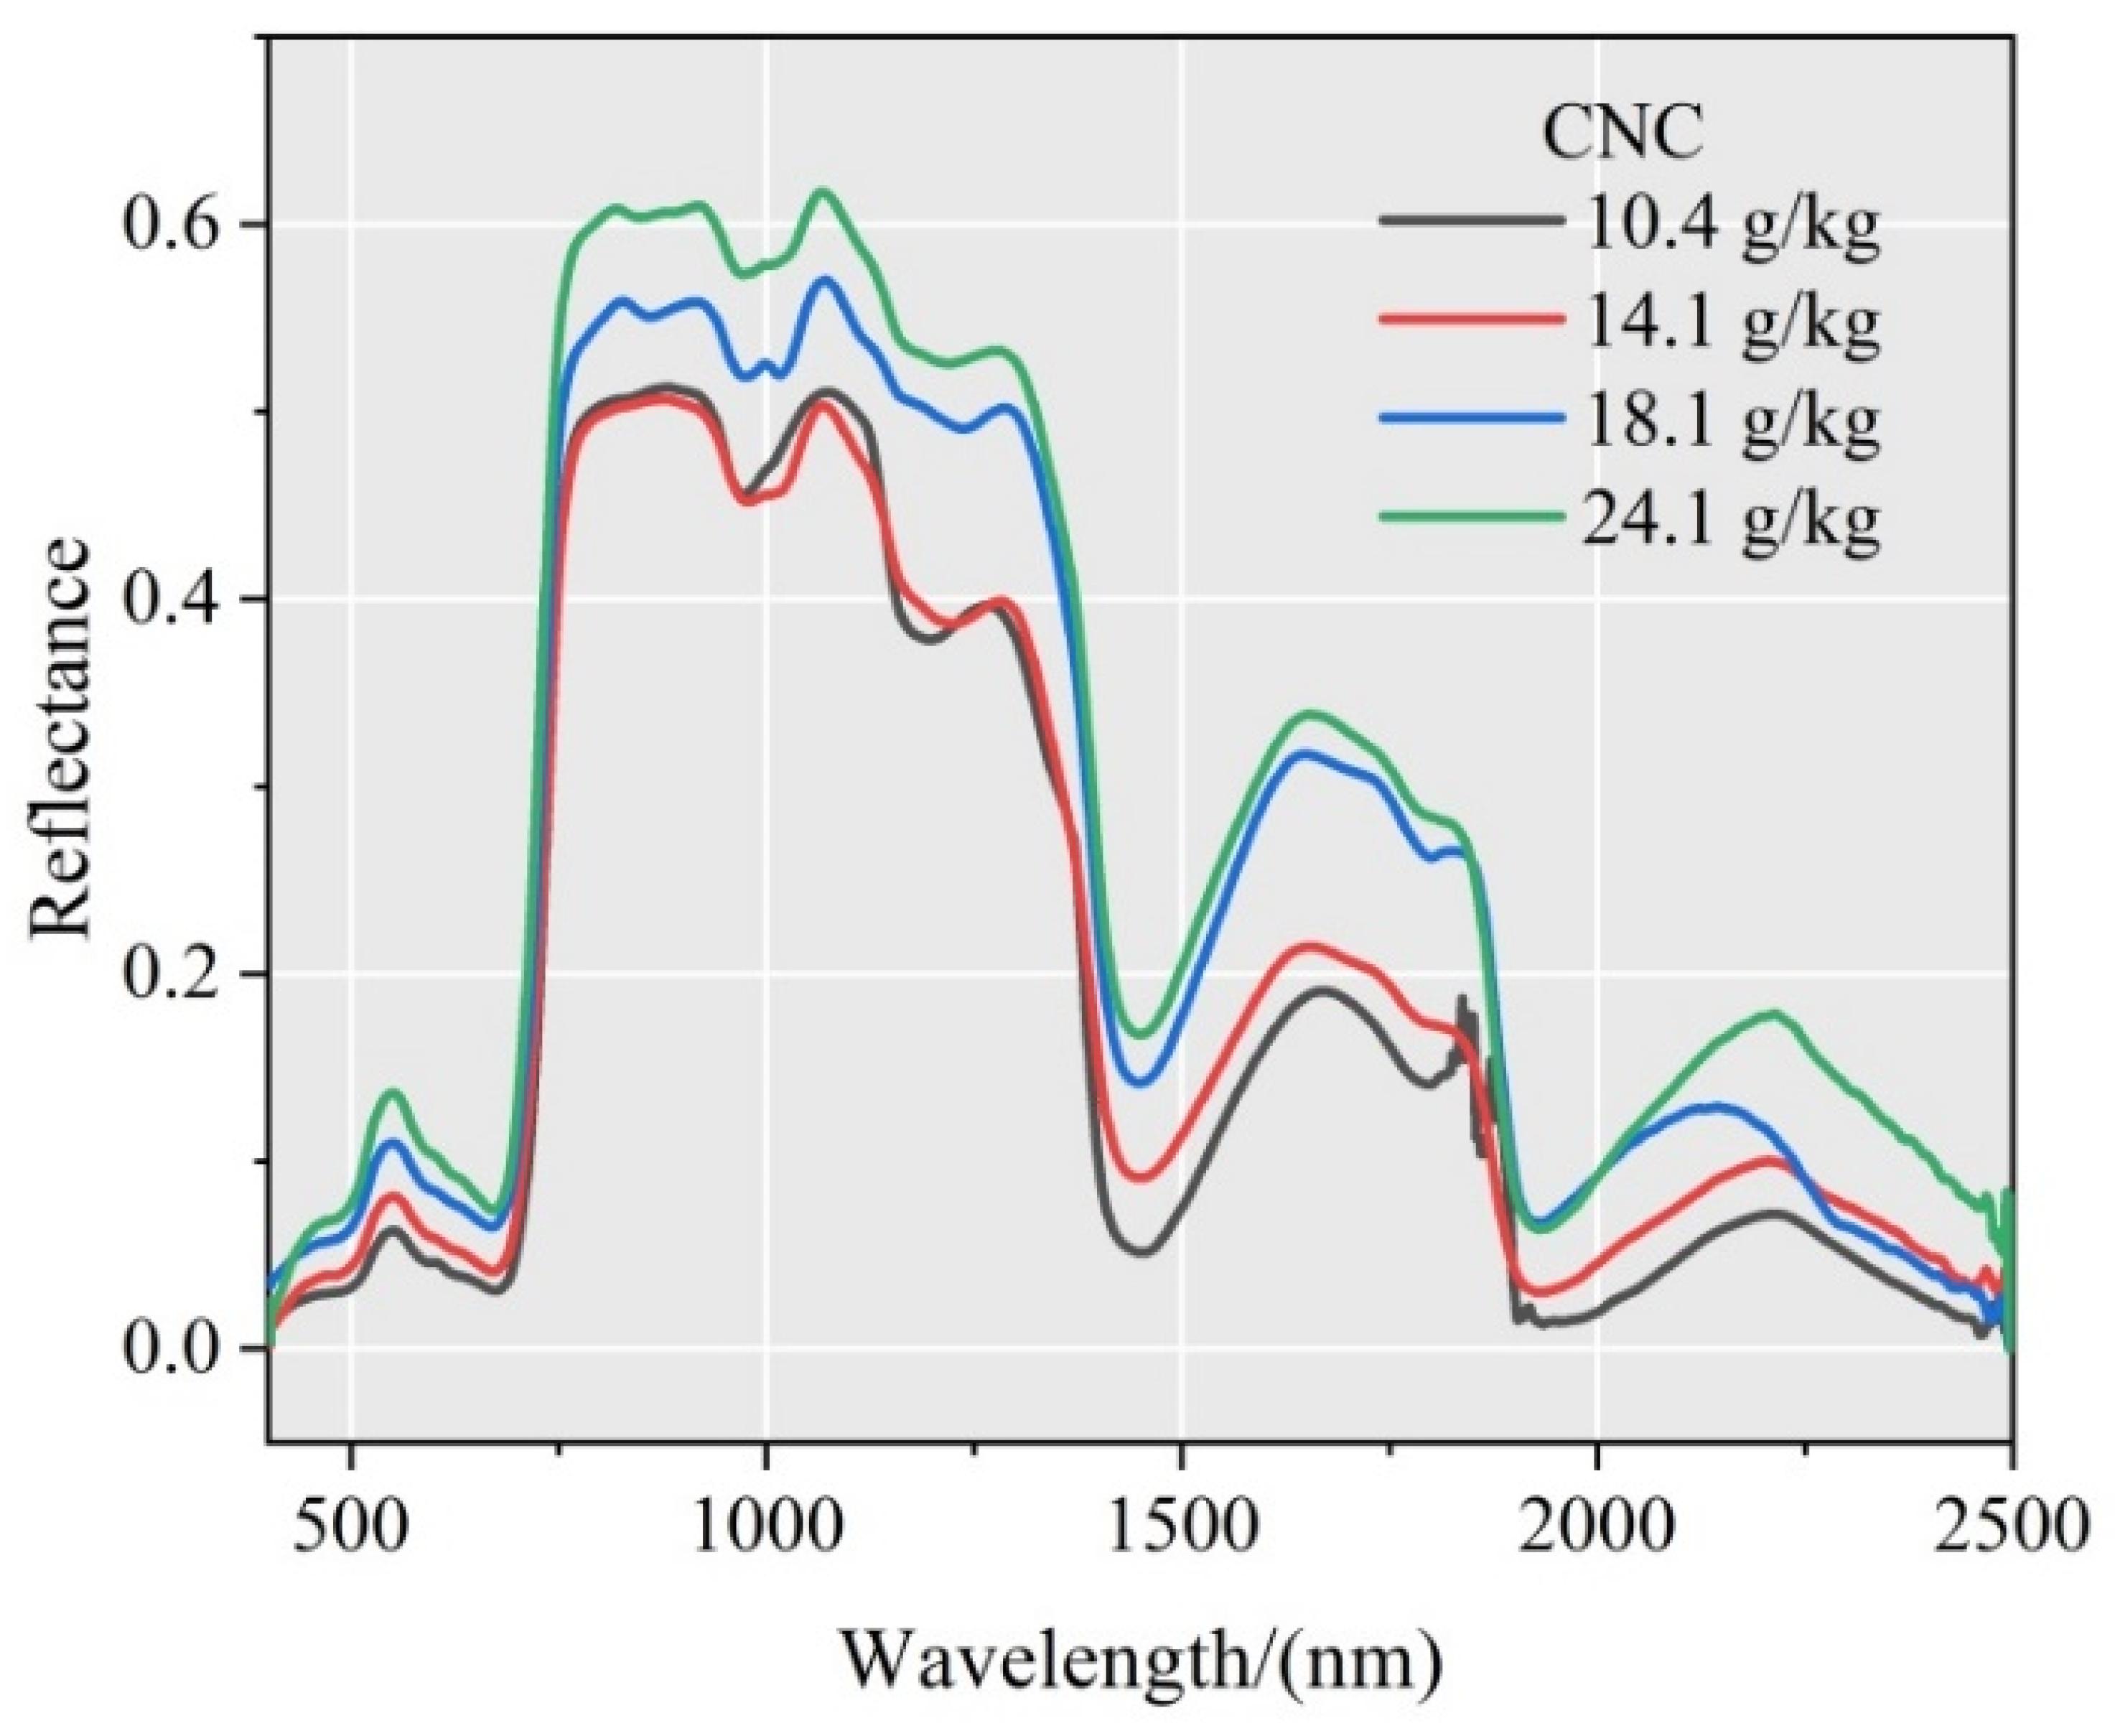
3.2. Characteristics of Maize Canopy Spectra

Spectral Curves of the Canopy Leaf Samples with Different CNC

The spectral curves of canopy leaf samples under different CNC in maize are shown in Figure 2. Overall, the shapes and peak characteristics of spectral curves of different canopy leaf samples are similar. They exhibit reflection peaks at the red edge position (670~760 nm) and distinct water absorption valleys at the wavelengths of 1400 nm and 1900 nm. When the CNC is higher, the reflectance of maize canopy leaves is higher, especially in the spectral range of 770 nm to 1300 nm. The spectral curve of maize canopy leaves with a CNC of 24.10 g/kg is much higher compared to that of 10.40 g/kg. It is worth noting that the positive correlation between spectral reflectance and CNC may not be significant when the CNC is below 15.00 g/kg. The analysis of spectral curves and exploration of spectral mechanisms provide a foundation for constructing a CNC spectral estimation model.
Figure 3 illustrates the raw spectral curves transformed by five different methods (CT, D1, D2, DT, MMN). The CT-transformed spectral curve is similar in shape to the raw spectral curve, but the differences in spectral curves between different canopy leaf samples are reduced, indicating that the environmental noise and irrelevant information have been mitigated. The reflectance values of the D1-transformed spectra fluctuate around 0, significantly highlighting the absorption features of the canopy leaves, particularly at the red edge (closely related to the growth status of the plants), while also lessening the effects from the environment noise information. The D2-transformed spectral curve is similar to the D1-transformed spectral curve, further mining the CNC features in the spectral data. The shape of the DT-transformed spectral curve is similar to the raw spectrum in the visible range, but its decreasing trend slows down in the near-infrared and short-wave infrared ranges, suggesting that the influence of water on the canopy spectra is mitigated. After MMN transformation, the spectral differences between different canopy leaf samples increase, enhancing the spectral features of CNC. In summary, the raw spectra of the canopy leaf samples, after mathematical transformations, enhance the spectral features of CNC and effectively reduce the noise generated by water and plant environmental information.

3.3. Optimal Spectral Transformation Indices for Characterizing CNC

Based on Equation (10), the PCC values of the TDSIs are shown in Figure 4. Significant differences are observed in the PCC values of TDSIs calculated from various transformed spectral data, reflecting variations in different spectral ranges and TDSI calculation methods. The PCC values of TDSIs derived from the D1-transformed spectral data exhibit notable changes across different spectral ranges, indicating that the spectral features of CNC are highlighted while noise and irrelevant information are diminished. Moreover, the highest PCC values of TDSIs are observed in the spectral ranges of 500~600 nm, 2100~2300 nm, and 800~1200 nm, suggesting a close relationship with CNC. All TDSIs were ranked in descending order based on their PCC values. Adjacent TDSIs within a spectral range of 50 nm were required not to be of the same type; otherwise, only the TDSI with the highest PCC value was retained. Finally, based on the criterion of a PCC value greater than 0.8 and ensuring minimal collinearity among TDSIs, we selected the top 10 optimal TDSIs: T D S I 1247 , 1249 C T - R I , T D S I 625 , 641 C T - N D I , T D S I 540 , 703 D 1 - R I , T D S I 514 , 540 D 1 - R I , T D S I 514 , 530 D 1 - D I , T D S I 540 , 697 D 1 - N D I , T D S I 970 , 1357 D 2 - D I , T D S I 523 , 1031 D 2 - N D I , T D S I 617 , 620 D T - R I , and T D S I 2109 , 2127 M M N - N D I .

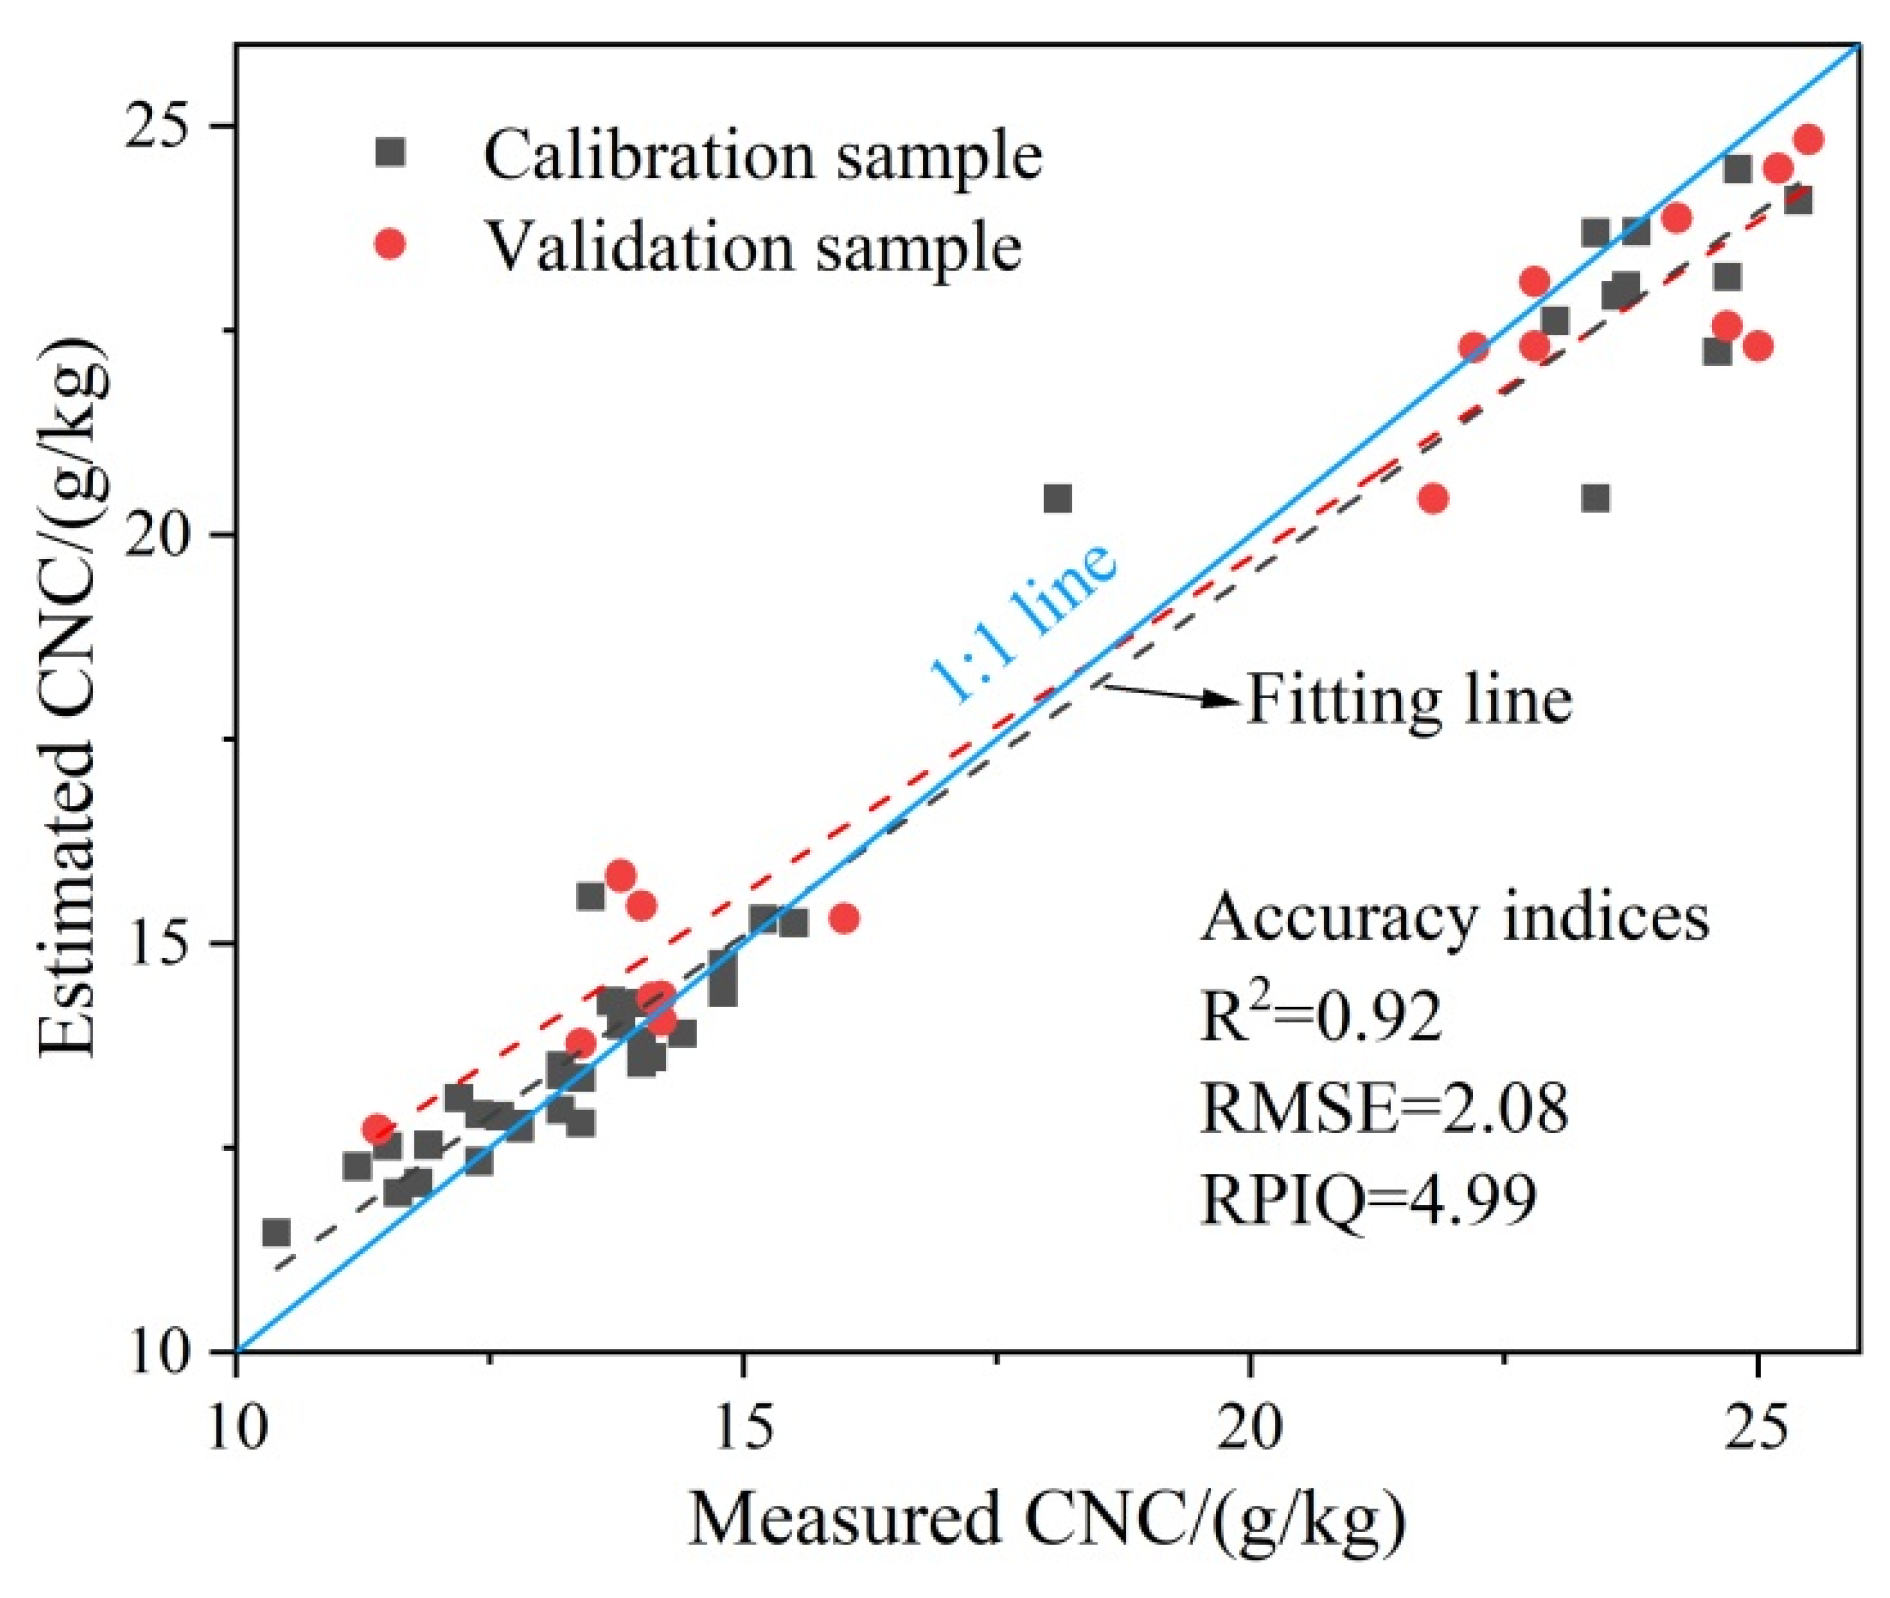
3.4. CNC Spectral Estimation Models

Using the optimal TDSIs as independent variables and measured CNC values of canopy leaf samples as dependent variables, an RF algorithm was employed to construct the CNC spectral estimation model. The calibration and validation results of the model are shown in Figure 5. This model exhibited excellent CNC spectral estimation accuracy, with an R2 value of 0.92, an RMSE of 2.08, and an RPIQ of 4.99. The measured and estimated CNC values are close to the 1:1 line with minimal deviation, indicating satisfactory model performance.

4. Discussion

The average PCC value of the optimal TDSI (0.83) is approximately 102% higher than that of the raw spectral bands (0.41) in the maize canopy. The TDSI developed in this study effectively reduces the influence of moisture and background noise information on the spectral data of maize canopies, thereby more accurately characterizing the CNC in maize. As shown in Figure 6, the raw spectral bands closely related to CNC are primarily located in the ranges of 505~533 nm, 690~716 nm, and 1918~2006 nm. The average PCC value of these sensitive spectral bands is 0.41 (Figure 6), whereas the optimal TDSI has an average PCC value of 0.83 (Figure 4), representing a 102% increase. Detailed computational data, specifically the PCC values of these sensitive spectral bands, can be found in the Supplementary Materials. Ma et al. [35] indicated that the appropriate spectral transformation method could highlight the feature band of the target parameters of the plant while also reducing the background noise information. Li et al. [7] demonstrated that the raw spectral data of maize canopy leaves are impacted by solar radiant flux, moisture, and plant structure and that spectral transformation methods are effective in improving the signal-to-noise ratio, reducing background noise, and enhancing weak signals of crop parameters. The TDSI is constructed in this study using transformed spectral data obtained from maize canopy, effectively enhancing the CNC spectral characteristics.
Additionally, various vegetation indices have demonstrated the ability to accurately represent CNC status in maize, and a considerable number of these indices have been used in the construction of spectral estimation models for CNC [7,8,9,10]. However, these vegetation indices are typically designed under specific environmental conditions, thus exhibiting high accuracy and applicability only in those conditions. When selecting vegetation indices for the construction of CNC spectral estimation models, it is generally necessary to select from a large number of published studies to ensure the vegetation indices are suitable for the target area, making it a challenging task. TDSI, with its millions of possible band combinations, can provide the optimal spectral indices for CNC in the target area [6,14,15], which can also be quickly identified by using feature selection algorithms. Overall, TDSI is an effective method for characterizing the CNC status in maize, strongly supporting the construction of a CNC spectral estimation model.
The performance of the CNC spectral estimation model, which is based on the RF algorithm and optimal TDSIs, significantly outperforms traditional CNC spectral estimation models. The minimum improvement observed was approximately 9.52% compared to the SVM model, while the maximum improvement was about 67.27% compared to the MLR model when considering the R2 value. Traditional CNC spectral estimation models were developed using optimal TDSIs as predictors and measured CNC values as the response variable, employing four algorithms: MLR, ANN, PLSR, and SVM. Table 3 presents the accuracy indicators for these models. The MLR and ANN models yielded RPIQ values below 2.02, revealing substantial discrepancies between estimated and measured CNC values, thus proving inadequate for accurate CNC estimation in maize. Linear regression models (e.g., MLR and PLSR) lack the capacity for nonlinear fitting, hampering accurate representation of the spectral-CNC relationship. Although ANN is a nonlinear regression method, it requires a substantial number of representative training samples to effectively map spectral values to CNC values; insufficient sample size can lead to overfitting and reduced model generalizability. The SVM model achieved relatively high CNC estimation accuracy (R2 = 0.84, RMSE = 3.83, RPIQ = 2.71), with measured values closely aligning with the 1:1 line. However, its performance remains inferior to the RF model employed in this study.
The spectral estimation approach for CNC in maize, based on the optimal TDSIs and RF algorithm, provides robust support for the advancement of precision agriculture. This approach enables the assessment of CNC status in maize without causing damage to the plants, thereby offering a foundation for designing optimized fertilization strategies in agricultural systems. Future research should focus on extending this TDSI and RF-based CNC spectral estimation method to other crop species, such as wheat, cotton, and rice [13,14]. Additionally, exploring CNC spectral estimation techniques for maize using UAV (unmanned aerial vehicle)--based hyperspectral imagery is crucial for facilitating rapid and cost-effective monitoring of maize CNC at the regional scale [54].

5. Conclusions

This study developed an efficient approach based on optimal TDSIs combined with an RF algorithm for estimating CNC in maize at the field scale. Results indicated that (1) five spectral transformation methods (CT, D1, D2, DT, and MMN) effectively reduced moisture and background noise information in canopy spectra and significantly enhanced the spectral features of CNC in maize. The correlation between TDSI and CNC was higher than that of the raw spectral band by 102%. (2) The selected optimal TDSIs were T D S I 1247 , 1249 C T - R I , TDSI 625 , 641 CT - NDI , TDSI 540 , 703 D 1 - RI , TDSI 514 , 540 D 1 - RI , TDSI 514 , 530 D 1 - DI , TDSI 540 , 697 D 1 - NDI , T D S I 970 , 1357 D 2 - D I , T D S I 523 , 1031 D 2 - N D I , TDSI 617 , 620 DT - RI , and TDSI 2109 , 2127 MMN - NDI . (3) The CNC spectral estimation model, constructed with optimal TDSIs and an RF algorithm, achieved R2 and RPIQ values of 0.92 and 4.99, respectively, representing a maximum improvement of approximately 67.27% in the R2 value compared to the MLR model and a minimum improvement of approximately 9.52% compared to the SVM model. The CNC spectral estimation method proposed in this study provides a technical approach for supporting the development of optimized fertilization strategies and promoting sustainable agriculture.

Supplementary Materials

The following supporting information can be downloaded at: https://www.mdpi.com/article/10.3390/su16188011/s1.

Author Contributions

Writing—original draft preparation, S.Y.; methodology, writing, and review, J.L. (Jianbei Li); formal analysis, J.L. (Ji Li) and X.Z.; data computation and validation, C.M., Z.L. and M.R.; All authors have read and agreed to the published version of the manuscript.

Funding

This work was supported by the Ningxia Key Research and Development Program Project (2023BCF01051) and the Ningxia Natural Science Foundation Project (2023AAC03411).

Institutional Review Board Statement

Not applicable.

Informed Consent Statement

Informed consent was obtained from all subjects involved in the study.

Data Availability Statement

Research data related to this study can be obtained by contacting the corresponding author.

Conflicts of Interest

The authors declare no conflicts of interest.

References

  1. Murdia, L.; Wadhwani, R.; Wadhawan, N.; Bajpai, P.; Shekhawat, S. Maize utilization in India: An overview. Am. J. Food Nutr. 2016, 4, 169–176. [Google Scholar]
  2. Ramazan, S.; Nazir, I.; Yousuf, W.; John, R. Environmental stress tolerance in maize (Zea mays): Role of polyamine metabolism. Funct. Plant Biol. 2022, 50, 85–96. [Google Scholar] [CrossRef] [PubMed]
  3. Salika, R.; Riffat, J. Abiotic stress responses in maize: A review. Acta. Physiol. Plant. 2021, 43, 130. [Google Scholar] [CrossRef]
  4. Wang, Z.; Chen, J.; Zhang, J.; Tan, X.; Raza, M.A.; Ma, J.; Zhu, Y.; Yang, F.; Yang, W. Assessing canopy nitrogen and carbon content in maize by canopy spectral reflectance and uninformative variable elimination. Crop J. 2022, 10, 1224–1238. [Google Scholar] [CrossRef]
  5. Wen, P.; Shi, Z.; Li, A.; Ning, F.; Zhang, Y.; Wang, R.; Li, J. Estimation of the vertically integrated leaf nitrogen content in maize using canopy hyperspectral red edge parameters. Precis. Agric. 2021, 22, 984–1005. [Google Scholar] [CrossRef]
  6. Wen, P.-F.; He, J.; Ning, F.; Wang, R.; Zhang, Y.-H.; Li, J. Estimating leaf nitrogen concentration considering unsynchronized maize growth stages with canopy hyperspectral technique. Ecol. Indic. 2019, 107, 105590. [Google Scholar] [CrossRef]
  7. Li, F.; Elsayed, S.; Hu, Y.; Schmidhalter, U. Passive reflectance sensing using optimized two-and three-band spectral indices for quantifying the total nitrogen yield of maize. Comput. Electron. Agr. 2020, 173, 105403. [Google Scholar]
  8. Ramos, A.P.M.; Osco, L.P.; Furuya, D.E.G.; Gonçalves, W.N.; Santana, D.C.; Teodoro, L.P.R.; da Silva Junior, C.A.; Capristo-Silva, G.F.; Li, J.; Baio, F.H.R. A random forest ranking approach to predict yield in maize with UAV-based vegetation spectral indices. Comput. Electron. Agr. 2020, 178, 105791. [Google Scholar] [CrossRef]
  9. de Souza, R.; Peña-Fleitas, M.T.; Thompson, R.B.; Gallardo, M.; Padilla, F.M. Assessing performance of vegetation indices to estimate nitrogen nutrition index in pepper. Remote Sens. 2020, 12, 763. [Google Scholar] [CrossRef]
  10. Xu, S.; Xu, X.; Blacker, C.; Gaulton, R.; Zhu, Q.; Yang, M.; Yang, G.; Zhang, J.; Yang, Y.; Yang, M. Estimation of leaf nitrogen content in rice using vegetation indices and feature variable optimization with information fusion of multiple-sensor images from UAV. Remote Sens. 2023, 15, 854. [Google Scholar] [CrossRef]
  11. Elmetwalli, A.H.; Tyler, A.N. Estimation of maize properties and differentiating moisture and nitrogen deficiency stress via ground–based remotely sensed data. Agric. Water Manag. 2020, 242, 106413. [Google Scholar] [CrossRef]
  12. Inoue, Y.; Guérif, M.; Baret, F.; Skidmore, A.; Gitelson, A.; Schlerf, M.; Darvishzadeh, R.; Olioso, A. Simple and robust methods for remote sensing of canopy chlorophyll content: A comparative analysis of hyperspectral data for different types of vegetation. Plant Cell Environ. 2016, 39, 2609–2623. [Google Scholar] [CrossRef] [PubMed]
  13. Chen, P.; Haboudane, D.; Tremblay, N.; Wang, J.; Vigneault, P.; Li, B. New spectral indicator assessing the efficiency of crop nitrogen treatment in corn and wheat. Remote Sens. Environ. 2010, 114, 1987–1997. [Google Scholar] [CrossRef]
  14. Yao, X.; Zhu, Y.; Tian, Y.; Feng, W.; Cao, W. Exploring hyperspectral bands and estimation indices for leaf nitrogen accumulation in wheat. Int. J. Appl. Earth Obs. 2010, 12, 89–100. [Google Scholar] [CrossRef]
  15. Zhao, B.; Duan, A.; Ata-Ul-Karim, S.T.; Liu, Z.; Chen, Z.; Gong, Z.; Zhang, J.; Xiao, J.; Liu, Z.; Qin, A.; et al. Exploring new spectral bands and vegetation indices for estimating nitrogen nutrition index of summer maize. Eur. J. Agron. 2018, 93, 113–125. [Google Scholar] [CrossRef]
  16. Abulaiti, Y.; Sawut, M.; Maimaitiaili, B.; Chunyue, M. A possible fractional order derivative and optimized spectral indices for assessing total nitrogen content in cotton. Comput. Electron. Agr. 2020, 171, 105275. [Google Scholar] [CrossRef]
  17. Meiyan, S.; Jinyu, Z.; Xiaohong, Y.; Xiaohe, G.; Baoguo, L.; Yuntao, M. A spectral decomposition method for estimating the leaf nitrogen status of maize by UAV-based hyperspectral imaging. Comput. Electron. Agr. 2023, 212, 108100. [Google Scholar] [CrossRef]
  18. Lin, D.; Chen, Y.; Qiao, Y.; Qin, D.; Miao, Y.; Sheng, K.; Li, L.; Wang, Y. A study on an accurate modeling for distinguishing nitrogen, phosphorous and potassium status in summer maize using in situ canopy hyperspectral data. Comput. Electron. Agr. 2024, 221, 108989. [Google Scholar] [CrossRef]
  19. Liang, L.; Geng, D.; Yan, J.; Qiu, S.; Di, L.; Wang, S.; Xu, L.; Wang, L.; Kang, J.; Li, L. Estimating crop LAI using spectral feature extraction and the hybrid inversion method. Remote Sens. 2020, 12, 3534. [Google Scholar] [CrossRef]
  20. Wen, S.; Shi, N.; Lu, J.; Gao, Q.; Yang, H.; Gao, Z. Estimating chlorophyll fluorescence parameters of rice (Oryza sativa L.) based on spectrum transformation and a joint feature extraction algorithm. Agronomy 2023, 13, 337. [Google Scholar] [CrossRef]
  21. Qiao, L.; Gao, D.; Zhang, J.; Li, M.; Sun, H.; Ma, J. Dynamic influence elimination and chlorophyll content diagnosis of maize using UAV spectral imagery. Remote Sens. 2020, 12, 2650. [Google Scholar] [CrossRef]
  22. Prado Osco, L.; Marques Ramos, A.P.; Roberto Pereira, D.; Akemi Saito Moriya, É.; Nobuhiro Imai, N.; Takashi Matsubara, E.; Estrabis, N.; de Souza, M.; Marcato, J., Jr.; Gonçalves, W.N. Predicting canopy nitrogen content in citrus-trees using random forest algorithm associated to spectral vegetation indices from UAV-imagery. Remote Sens. 2019, 11, 2925. [Google Scholar] [CrossRef]
  23. Yang, S.; Hu, L.; Wu, H.; Ren, H.; Qiao, H.; Li, P.; Fan, W. Integration of crop growth model and random forest for winter wheat yield estimation from UAV hyperspectral imagery. IEEE J. Sel. Top. Appl. Earth Obs. Remote Sens. 2021, 14, 6253–6269. [Google Scholar] [CrossRef]
  24. Yang, H.; Li, F.; Wang, W.; Yu, K. Estimating above-ground biomass of potato using random forest and optimized hyperspectral indices. Remote Sens. 2021, 13, 2339. [Google Scholar] [CrossRef]
  25. Fernández-Habas, J.; Cañada, M.C.; Moreno, A.M.G.; Leal-Murillo, J.R.; González-Dugo, M.P.; Oar, B.A.; Gómez-Giráldez, P.J.; Fernández-Rebollo, P. Estimating pasture quality of mediterranean grasslands using hyperspectral narrow bands from field spectroscopy by random forest and PLS regressions. Comput. Electron. Agric. 2022, 192, 106614. [Google Scholar] [CrossRef]
  26. Breiman, L. Random forests. Mach. Learn. 2001, 45, 5–32. [Google Scholar] [CrossRef]
  27. Xu, X.; Wang, X.; Yang, P.; Meng, Y.; Yu, D.; Li, C. Strategy for mapping soil salt contents during the bare soil period through a satellite image: Optimal calibration set combined with random forest. Catena 2023, 223, 106900. [Google Scholar] [CrossRef]
  28. Liang, L.; Di, L.; Huang, T.; Wang, J.; Lin, L.; Wang, L.; Yang, M. Estimation of leaf nitrogen content in wheat using new hyperspectral indices and a random forest regression algorithm. Remote Sens. 2018, 10, 1940. [Google Scholar] [CrossRef]
  29. López-Calderón, M.J.; Estrada-Ávalos, J.; Rodríguez-Moreno, V.M.; Mauricio-Ruvalcaba, J.E.; Martínez-Sifuentes, A.R.; Delgado-Ramírez, G.; Miguel-Valle, E. Estimation of total nitrogen content in forage maize (Zea mays L.) using spectral indices: Analysis by random forest. Agriculture 2020, 10, 451. [Google Scholar] [CrossRef]
  30. Xu, X.; Chen, Y.; Wang, M.; Wang, S.; Li, K.; Li, Y. Improving estimates of soil salt content by using two-date image spectral changes in Yinbei, China. Remote Sens. 2021, 13, 4165. [Google Scholar] [CrossRef]
  31. Li, B.; Xu, Z.; Guo, X.; Zhou, T. Comparative analysis of soil nutrient status across different ecological zones in Ningxia. J. Cold-Arid Agric. Sci. 2023, 3, 434–440. [Google Scholar]
  32. Buchaillot, M.L.; Soba, D.; Shu, T.; Liu, J.; Aranjuelo, I.; Araus, J.L.; Runion, G.B.; Prior, S.A.; Kefauver, S.C.; Sanz-Saez, A. Estimating peanut and soybean photosynthetic traits using leaf spectral reflectance and advance regression models. Planta 2022, 255, 93. [Google Scholar] [CrossRef] [PubMed]
  33. Zhang, J.; Ma, D.; Wei, X.; Jin, J. Visible and near-infrared hyperspectral diurnal variation calibration for corn phenotyping using remote sensing. Remote Sens. 2023, 15, 3057. [Google Scholar] [CrossRef]
  34. Li, C.; Czyż, E.A.; Halitschke, R.; Baldwin, I.T.; Schaepman, M.E.; Schuman, M.C. Evaluating potential of leaf reflectance spectra to monitor plant genetic variation. Plant Methods 2023, 19, 108. [Google Scholar] [CrossRef] [PubMed]
  35. Ma, Y.; Zhang, Q.; Yi, X.; Ma, L.; Zhang, L.; Huang, C.; Zhang, Z.; Lv, X. Estimation of cotton leaf area index (LAI) based on spectral transformation and vegetation index. Remote Sens. 2021, 14, 136. [Google Scholar] [CrossRef]
  36. Ribeiro, S.G.; Teixeira, A.d.S.; de Oliveira, M.R.R.; Costa, M.C.G.; Araújo, I.C.d.S.; Moreira, L.C.J.; Lopes, F.B. Soil organic carbon content prediction using soil-reflected spectra: A comparison of two regression methods. Remote Sens. 2021, 13, 4752. [Google Scholar] [CrossRef]
  37. Rodríguez-Pérez, J.R.; Marcelo, V.; Pereira-Obaya, D.; García-Fernández, M.; Sanz-Ablanedo, E. Estimating soil properties and nutrients by visible and infrared diffuse reflectance spectroscopy to characterize vineyards. Agronomy 2021, 11, 1895. [Google Scholar] [CrossRef]
  38. Chen, Y.; Wang, X.; Zhang, X.; Sun, Y.; Sun, H.; Wang, D.; Xu, X. Spectral quantitative analysis and research of fusarium head blight infection degree in wheat canopy visible areas. Agronomy 2023, 13, 933. [Google Scholar] [CrossRef]
  39. Xu, X.; Chen, Y.; Dai, X.; Lei, T.; Wang, S.; Li, K. An improved vis-nir estimation model of soil organic matter through the artificial samples enhanced calibration set. IEEE J. Sel. Top. Appl. Earth Obs. Remote Sens. 2023, 16, 4626–4637. [Google Scholar] [CrossRef]
  40. Xu, K.; Ye, H. Light scattering in stacked mesophyll cells results in similarity characteristic of solar spectral reflectance and transmittance of natural leaves. Sci. Rep. 2023, 13, 4694. [Google Scholar] [CrossRef]
  41. Xu, X.; Wang, Z.; Song, X.; Zhan, W.; Yang, S. A remote sensing-based strategy for mapping potentially toxic elements of soils: Temporal-spatial-spectral covariates combined with random forest. Environ. Res. 2024, 240, 117570. [Google Scholar] [CrossRef] [PubMed]
  42. Peng, Y.; Wang, L.; Zhao, L.; Liu, Z.; Lin, C.; Hu, Y.; Liu, L. Estimation of soil nutrient content using hyperspectral data. Agriculture 2021, 11, 1129. [Google Scholar] [CrossRef]
  43. Pedregosa, F.; Varoquaux, G.; Gramfort, A.; Michel, V.; Thirion, B.; Grisel, O.; Blondel, M.; Prettenhofer, P.; Weiss, R.; Dubourg, V. Scikit-learn: Machine learning in python. J. Mach. Learn. Res. 2011, 12, 2825–2830. [Google Scholar]
  44. García-Martínez, H.; Flores-Magdaleno, H.; Ascencio-Hernández, R.; Khalil-Gardezi, A.; Tijerina-Chávez, L.; Mancilla-Villa, O.R.; Vázquez-Peña, M.A. Corn grain yield estimation from vegetation indices, canopy cover, plant density, and a neural network using multispectral and RGB images acquired with unmanned aerial vehicles. Agriculture 2020, 10, 277. [Google Scholar] [CrossRef]
  45. Bellon-Maurel, V.; Fernandez-Ahumada, E.; Palagos, B.; Roger, J.-M.; McBratney, A. Critical review of chemometric indicators commonly used for assessing the quality of the prediction of soil attributes by NIR spectroscopy. TrAC Trends Anal. Chem. 2010, 29, 1073–1081. [Google Scholar] [CrossRef]
  46. An, G.; Xing, M.; He, B.; Liao, C.; Huang, X.; Shang, J.; Kang, H. Using machine learning for estimating rice chlorophyll content from in situ hyperspectral data. Remote Sens. 2020, 12, 3104. [Google Scholar] [CrossRef]
  47. Yang, C.; Everitt, J.H. Using spectral distance, spectral angle and plant abundance derived from hyperspectral imagery to characterize crop yield variation. Precis. Agric. 2012, 13, 62–75. [Google Scholar] [CrossRef]
  48. Worden, K.; Tsialiamanis, G.; Cross, E.; Rogers, T. Artificial Neural Networks. In Machine Learning in Modeling and Simulation: Methods and Applications; Springer: Cham, Switzerland, 2023; pp. 85–119. [Google Scholar]
  49. Burnett, A.C.; Anderson, J.; Davidson, K.J.; Ely, K.S.; Lamour, J.; Li, Q.; Morrison, B.D.; Yang, D.; Rogers, A.; Serbin, S.P. A best-practice guide to predicting plant traits from leaf-level hyperspectral data using partial least squares regression. J. Exp. Bot. 2021, 72, 6175–6189. [Google Scholar] [CrossRef]
  50. Bhadra, S.; Sagan, V.; Maimaitijiang, M.; Maimaitiyiming, M.; Newcomb, M.; Shakoor, N.; Mockler, T.C. Quantifying leaf chlorophyll concentration of sorghum from hyperspectral data using derivative calculus and machine learning. Remote Sens. 2020, 12, 2082. [Google Scholar] [CrossRef]
  51. Zhu, W.; Sun, Z.; Yang, T.; Li, J.; Peng, J.; Zhu, K.; Li, S.; Gong, H.; Lyu, Y.; Li, B. Estimating leaf chlorophyll content of crops via optimal unmanned aerial vehicle hyperspectral data at multi-scales. Comput. Electron. Agr. 2020, 178, 105786. [Google Scholar] [CrossRef]
  52. Puggard, W.; Niwitpong, S.-A.; Niwitpong, S. Confidence intervals for common coefficient of variation of several Birnbaum–Saunders distributions. Symmetry 2022, 14, 2101. [Google Scholar] [CrossRef]
  53. Lv, J.; Liu, Y.; Zhang, Z.; Dai, J. Factorial kriging and stepwise regression approach to identify environmental factors influencing spatial multi-scale variability of heavy metals in soils. J. Hazard Mater. 2013, 261, 387–397. [Google Scholar] [CrossRef] [PubMed]
  54. Fu, Z.; Jiang, J.; Gao, Y.; Krienke, B.; Wang, M.; Zhong, K.; Cao, Q.; Tian, Y.; Zhu, Y.; Cao, W. Wheat growth monitoring and yield estimation based on multi-rotor unmanned aerial vehicle. Remote Sens. 2020, 12, 508. [Google Scholar] [CrossRef]
Figure 1. Location of experimental area and sampling sites in Ningxia, China; (a), (b), and (c) represent the maps of China, Ningxia Province, and the experimental area, respectively.
Sustainability 16 08011 g001
Figure 2. Spectral curves of canopy leaf samples under different CNC in maize.
Sustainability 16 08011 g002
Figure 3. Transformed spectral curves of canopy leaf samples in maize (CT: centralization transformation; D1: first derivative; D2: second derivative; DT: detrend transformation; MMN: min-max normalization).
Sustainability 16 08011 g003
Figure 4. PCC values of transform-based dynamic spectral indices (TDSIs).
Sustainability 16 08011 g004
Figure 5. Scatter plot of estimated versus measured CNC value in maize.
Sustainability 16 08011 g005
Figure 6. PCC values of the raw spectral bands in maize canopy.
Sustainability 16 08011 g006
Table 1. The nitrogen fertilizer application scheme within the experimental grids in Ningxia, China/(kg/hm2).
Experimental GridTotal Nitrogen RatioNitrogen Application RateBasal FertilizerAdditional Fertilization
UreaDiammonium PhosphatePotassium SulfateUrea
First PeriodSecond Period
N10Non034212000
N20.55247.516534212016575.0
N31.00450.0345342120330169.5
N41.20510.0390342120390195.0
N51.30540.0420342120420199.5
Note: The sixth to tenth experimental grids (N6 to N10) were replicates of the first five grids (N1 to N5).
Table 2. Descriptive statistical characteristics of CNC in maize.
Samples
Set
Maximum/(g/kg)Minimum/(g/kg)Mean/(g/kg)Median
/(g/kg)
SDCVKurtosisSkewness
n = 6025.510.416.7914.15.070.30−1.290.69
Note: SD is the standard deviation, and CV is the coefficient of variation.
Table 3. Comparison of CNC spectral estimation models constructed with four classical regression algorithms.
IDModelR2RMSERPIQ
1MLR0.557.811.33
2PLSR0.705.791.79
3ANN0.637.061.47
4SVM0.843.832.71
5this study0.922.084.99
Disclaimer/Publisher’s Note: The statements, opinions and data contained in all publications are solely those of the individual author(s) and contributor(s) and not of MDPI and/or the editor(s). MDPI and/or the editor(s) disclaim responsibility for any injury to people or property resulting from any ideas, methods, instructions or products referred to in the content.

