
Clusters as Tools to Measure Sustainable Value Chains

Abstract
1. Introduction
2. Materials and Methods
- -
- The overall value of each indicator (Total) represents the aggregated value at cluster level for the respective indicator;
- -
- In the case of the indicator related to “number of companies”, if a company acts on more links—as is usually the case—it should be allocated to the link where the company concentrates its highest activity to avoid duplication.
3. Results
4. Discussion
5. Conclusions
Author Contributions
Funding
Informed Consent Statement
Data Availability Statement
Conflicts of Interest
References
- Porter, M. Competitive Advantage: Creating and Sustaining Superior Performance; Free Press: New York, NY, USA, 1985; pp. 11–15. [Google Scholar]
- Lutkevich, B. TechTarget. June 2021. Available online: https://www.techtarget.com/whatis/definition/supply-chain (accessed on 10 May 2024).
- Legenvre, H.; Hameri, A.-P.; Golini, R. Ecosystems and supply chains. How do they differ and relate. Digit. Bus. 2022, 2, 100029. [Google Scholar] [CrossRef]
- Wang, Z.; Wei, S.-J.; Yu, X.; Zhu, K. Global value chains over business cycles. J. Int. Money Financ. 2022, 126, 102643. [Google Scholar] [CrossRef]
- Arora, A.; Arora, A.; Anyu, J.; McIntyre, J. Global Value Chains’ Disaggregation through Supply Chain Collaboration, Market Turbulence, and Performance Outcomes. Sustainability 2021, 13, 4151. [Google Scholar] [CrossRef]
- Yun, J.J.; Yigitcanlar, T. Open Innovation in Value Chain for Sustainability of Firms. Sustainability 2017, 9, 811. [Google Scholar] [CrossRef]
- Stanisławski, R. Open Innovation as a Value Chain for Small and Medium-Sized Enterprises: Determinants of the Use of Open Innovation. Sustainability 2020, 12, 3290. [Google Scholar] [CrossRef]
- Freije, I.; de la Calle, A.; Ugarte, J. Role of supply chain integration in the product innovation capability of servitized manufacturing companies. Technovation 2022, 118, 102216. [Google Scholar] [CrossRef]
- Niu, W.; Shen, H. Investment in process innovation in supply chains with knowledge spillovers under innovation uncertainty. Eur. J. Oper. Res. 2022, 302, 1128–1141. [Google Scholar] [CrossRef]
- Fischer, B.; Meissner, D.; Boschma, R.; Vonortas, N. Global value chains and regional systems of innovation: Towards a critical juncture? Technol. Forecast. Soc. Chang. 2024, 201, 123245. [Google Scholar] [CrossRef]
- Bontadini, F.; Evangelista, R.; Meliciani, V.; Savona, M. Technology, global value chains and functional specialisation in Europe. Res. Policy 2024, 53, 104908. [Google Scholar] [CrossRef]
- Delera, M.; Pietrobelli, C.; Calza, E.; Lavopa, A. Does value chain participation facilitate the adoption of Industry 4.0 technologies in developing countries? World Dev. 2022, 152, 105788. [Google Scholar] [CrossRef]
- Rossini, M.; Ahmadi, A.; Staudacher, A. Integration of Lean Supply Chain and Industry 4.0. In Proceedings of the 5th International Conference on Industry 4.0 and Smart Manufacturing, Lisbon, Portugal, 22–24 November 2024. [Google Scholar]
- Huang, K.; Wang, K.; Lee, P.K.; Yeung, A.C. The impact of industry 4.0 on supply chain capability and supply chain resilience: A dynamic resource-based view. Int. J. Prod. Econ. 2023, 262, 108913. [Google Scholar] [CrossRef]
- Hafidy, I.; Benghabrit, A.; Zekhnini, K.; Benabdellah, A. Driving Supply CHain Resilience: Exploring the Potential of Operation Management and Industry 4.0. In Proceedings of the 5th International Conference on Industry 4.0 and Smart Manufacturing, Lisbon, Portugal, 22–24 November 2024. [Google Scholar]
- Nikookar, E.; Gligor, D.; Russo, I. Supply chain resilience: When the recipe is more important than the ingredients for managing supply chain disruptions. Int. J. Prod. Econ. 2024, 272, 109236. [Google Scholar] [CrossRef]
- Spieske, A.; Gebhardt, M.; Kopyto, M.; Birkel, H.; Hartmann, E. The future of Industry 4.0 and supply chain resilience after the COVID-19 pandemic: Empirical evidence from a Delphi study. Comput. Ind. Eng. 2023, 181, 109344. [Google Scholar] [CrossRef] [PubMed]
- Al-Omoush, J.; de Lucas, A.; del Val, M. The role of e-supply chain collaboration in collaborative innovation and value co-creation. J. Bus. Res. 2023, 158, 113647. [Google Scholar] [CrossRef]
- Gningue, J.; Wonyra, K.; Tchagnao, A.-F.; Bayale, N. Participation of developing countries in global value chains: What role for information and communication technologies? Telecommun. Policies 2023, 47, 102508. [Google Scholar] [CrossRef]
- Birasnav, M.; Chaudhary, R.; Dunne, J.H.; Bienstock, J.; Seaman, C. Green Supply Chain Management: A theoretical framework and research directions. Comput. Ind. Eng. 2022, 172, 108441. [Google Scholar] [CrossRef]
- Junaid, M.; Zhang, Q.; Syed, M.W. Effects of sustainable supply chain integration on green innovation and firm performance. Sustain. Prod. Consum. 2022, 30, 145–157. [Google Scholar] [CrossRef]
- Osei, M.B.; Papadopoulos, T.; Acquaye, A.; Stamati, T. Improving sustainable supply chain performance through organisational culture: A competing values framework approach. J. Purch. Supply Manag. 2023, 29, 100821. [Google Scholar] [CrossRef]
- Patel, J.; Tsionas, M. Cultural interconnectedness in supply chain networks and change in performance: An internal efficiency perspective. Int. J. Prod. Econ. 2022, 243, 108314. [Google Scholar] [CrossRef]
- Picancao Dias, G.; Silva, M.; Viana, F. Contributions of social capital to supply chain sustainability practices: Conceptual framework and propositions. Clean. Logist. Supply Chain. 2024, 11, 100151. [Google Scholar] [CrossRef]
- Gatenholm, G.; Halldórsson, A. Responding to discontinuities in product-based service supply chains in the COVID-19 pandemic: Towards transilience. Eur. Manag. J. 2023, 41, 425–436. [Google Scholar] [CrossRef] [PubMed]
- Gurbuz, M.C.; Yurt, O.; Ozdemir, S.; Sena, V.; Yu, W. Global supply chains risks and COVID-19: Supply chain structure as a mitigating strategy for small and medium-sized enterprises. J. Bus. Res. 2023, 155, 113407. [Google Scholar] [CrossRef] [PubMed]
- Ozdemir, D.; Sharma, M.; Dhir, A.; Daim, T. Supply chain resilience during the COVID-19 pandemic. Technol. Soc. 2022, 68, 101847. [Google Scholar] [CrossRef] [PubMed]
- Ambrogio, G.; Filice, L.; Lomgo, F.; Padovano, A. Workforce and supply chain disruption as a digital and technological innovation opportunity for resilient manufacturing system in the COVD-19 pandemic. Comput. Ind. Eng. 2022, 169, 108158. [Google Scholar] [CrossRef] [PubMed]
- El Korchi, A. Survivability, resilience and sustainability of supply chains: The COVID-19 pandemic. J. Clean. Prod. 2022, 377, 134363. [Google Scholar] [CrossRef] [PubMed]
- Kazancoglu, I.; Ozbiltekin-Pala, M.; Mangla, S.; Kazancoglu, Y.; Jabeen, F. Role of flexibility, agility and responsiveness for sustainable chain resilience during COVID-19. J. Clean. Prod. 2022, 362, 132431. [Google Scholar] [CrossRef]
- Roesch, A.-L.; Haerting, R.-C.; Gakharia, S. The transformation of global value chains in the age of Covid-19 and Digitization. Procedia Comput. Sci. 2022, 207, 2474–2482. [Google Scholar] [CrossRef]
- Sun, J.; Lee, H.; Yang, J. The Impact of the COVID-19 Pandemic on the Global Value Chain of the Manufacturing Industry. Sustainability 2021, 13, 12370. [Google Scholar] [CrossRef]
- Khorana, S.; Escaith, H.; Ali, S.; Kumari, S.; Do, Q. The changing contours of global value chains post-COVID: Evidence from the Commonwealth. J. Bus. Res. 2022, 153, 75–86. [Google Scholar] [CrossRef]
- Ferrari, A.A.; Bogner, K.; Palacio, V.; Crisostomo, D.; Seeber, N.; Ebersberger, B. The COVID-19 pandemic as a window of opportunity for more sustainable and circular supply chains. Clean. Logist. Supply Chain 2023, 7, 100101. [Google Scholar] [CrossRef]
- Kramer, J.-P.; Galdiga, L.; Welford, M.; Schmidt, F. Report on the survey “Solutions to Supply Chain Disruptions in the EU”. 2022. Available online: https://clustercollaboration.eu/sites/default/files/document-store/ECCP_SC_Disruptions_Report_final.pdf (accessed on 6 June 2024).
- Adeyemi, O.; Potticary, M.; Sunmola, F.; Idris, M.; Adeyemi, E.; Raji, I. A Comparative analysis of service supply chain performance using analytic hierarchy process methodology. In Proceedings of the 5th International Conference on Industry 4.0 and Smart Manufacturing, Lisbon, Portugal, 22–24 November 2024. [Google Scholar]
- UNIDO. Industrial Value Chain Diagnostics: An Integrated Tool; UNIDO: Vienna, Austria, 2011. [Google Scholar]
- Ruskey, B.; Rosenberg, E. Minimising risks in Bayesian supply chain network. Comput. Ind. Eng. 2022, 169, 108134. [Google Scholar] [CrossRef]
- Kraude, R.; Narayanan, S.; Talluri, S. Evaluating the performance of supply chain risk mitigation strategies using network data envelopment analysis. Eur. J. Oper. Res. 2022, 303, 1168–1182. [Google Scholar] [CrossRef]
- Karmaker, C.; Al Aziz, R.; Palit, T.; Bari, A.M. Analysing supply chain risk factors in the small and medium enterprises under fuzzy environment: Implications towards sustainability for emerging economies. Sustain. Technol. Entrep. 2023, 2, 100032. [Google Scholar]
- Yan, B.-R.; Dong, Q.-L.; Li, Q. Research on Risk Management of Supply Chain Emergencies in International Capacity Co-operation. Sustainability 2019, 11, 5184. [Google Scholar] [CrossRef]
- Chen, W.; Xing, L. Measuring the Intermediate Goods’ External Dependency on the Global Value Chain: A Case Study of China. Sustainability 2022, 14, 4360. [Google Scholar] [CrossRef]
- Men, K.; Sun, H.; Kou, M. Global Value Chains and Spatial Spillovers of Economic Growth—Based on the Perspective of Participation and Status Index in Global Value Chain. Sustainability 2022, 14, 15518. [Google Scholar] [CrossRef]
- Gereffi, G.; Fenrandez-Stark, K. Global Value Chain Analysis: A Primer, 2nd ed.; Duke: Durham, NC, USA, 2016. [Google Scholar]
- Capello, R.; Dellisanti, R. Smile-and-go. Regional performance through global value chains in Europe. Pap. Reg. Sci. 2024, 103, 100018. [Google Scholar] [CrossRef]
- Rozenblat, C.; Daban, M.; Guerrero, A.N.; le Corvec, A.; Konstandopoulos, A. Europe Social and Industrial Clusters to Support European Cities under COVID-19: The Impact of the European Alliance on Coronavirus Actions. In Cities under COVID-19: A Systems Perspective; Springer: Singapore, 2023; pp. 87–111. [Google Scholar]
- Muller, V. European Cluster Collaboration Platform. 21 October 2020. Available online: https://clustercollaboration.eu/news/role-clusters-accelerating-european-recovery-previous-recordings (accessed on 6 June 2024).
- Novo, A.; Raluy, M.H.; Manes, A.L. Report on the Survey Identification of Disruptions in Value and Supply Chains. 2022. Available online: https://www.clustercollaboration.eu/knowledge-sharing/publications/document-library/report-survey-identification-disruptions-value-and-supply-chains (accessed on 23 July 2024).
- OECD. Interconnected Economies: Benefiting from Global Value Chains; OECD Publishing: Paris, France, 2013. [Google Scholar]
- Ministerul Economiei, Antreprenoriatului si Turismului. Strategia Industriala a Romaniei 2023–2027; Ministerul Economiei, Antreprenoriatului si Turismului: Bucuresti, Romania, 2023. [Google Scholar]
- Cosnita, D. Methodology for Integration of Existing Industry Sectors into Digital Value Chains. 2021. Available online: https://dtp.interreg-danube.eu/uploads/media/approved_project_output/0001/47/d12c5fb9f68fe7e7fb81a1b3478c06ab258bdc05.pdf (accessed on 7 June 2024).
- Bruckler, M.; Wietschel, L.; Messmann, L.; Thorenz, A.; Tuma, A. Review of metrics to assess resilience capacities and actions for supply chain resilience. Comput. Ind. Eng. 2024, 192, 110176. [Google Scholar] [CrossRef]
- Aladaileh, M.; Lahuerta-Otero, E.; Aladayleh, K. Mapping Sustainable Supply Chain Innovation: A Comprehensive Bibliometrical Analysis. Helyon 2024, 10, e29157. [Google Scholar] [CrossRef]
- Takayabu, H. Measuring performance of supply chains based on data envelopment analysis and multi-regional input-output analysis:An application to 18 manufacturing sectors in 43 countries. Helyon 2024, 10, e25881. [Google Scholar] [CrossRef]
- Heikinheimo, M.; Hautamäki, P.; Julkunen, S.; Kaponen, J. B2B service sales on a digital multi-sided platform: Transformation from value chains to value networks. Ind. Mark. Manag. 2024, 116, 23–39. [Google Scholar] [CrossRef]

| Link | RDI | Branding | Product Design | Inbound Logistics (Suppliers) | Production | Outbound Logistics | Marketing | Maintenance | |
|---|---|---|---|---|---|---|---|---|---|
| Industrial Ecosystem | |||||||||
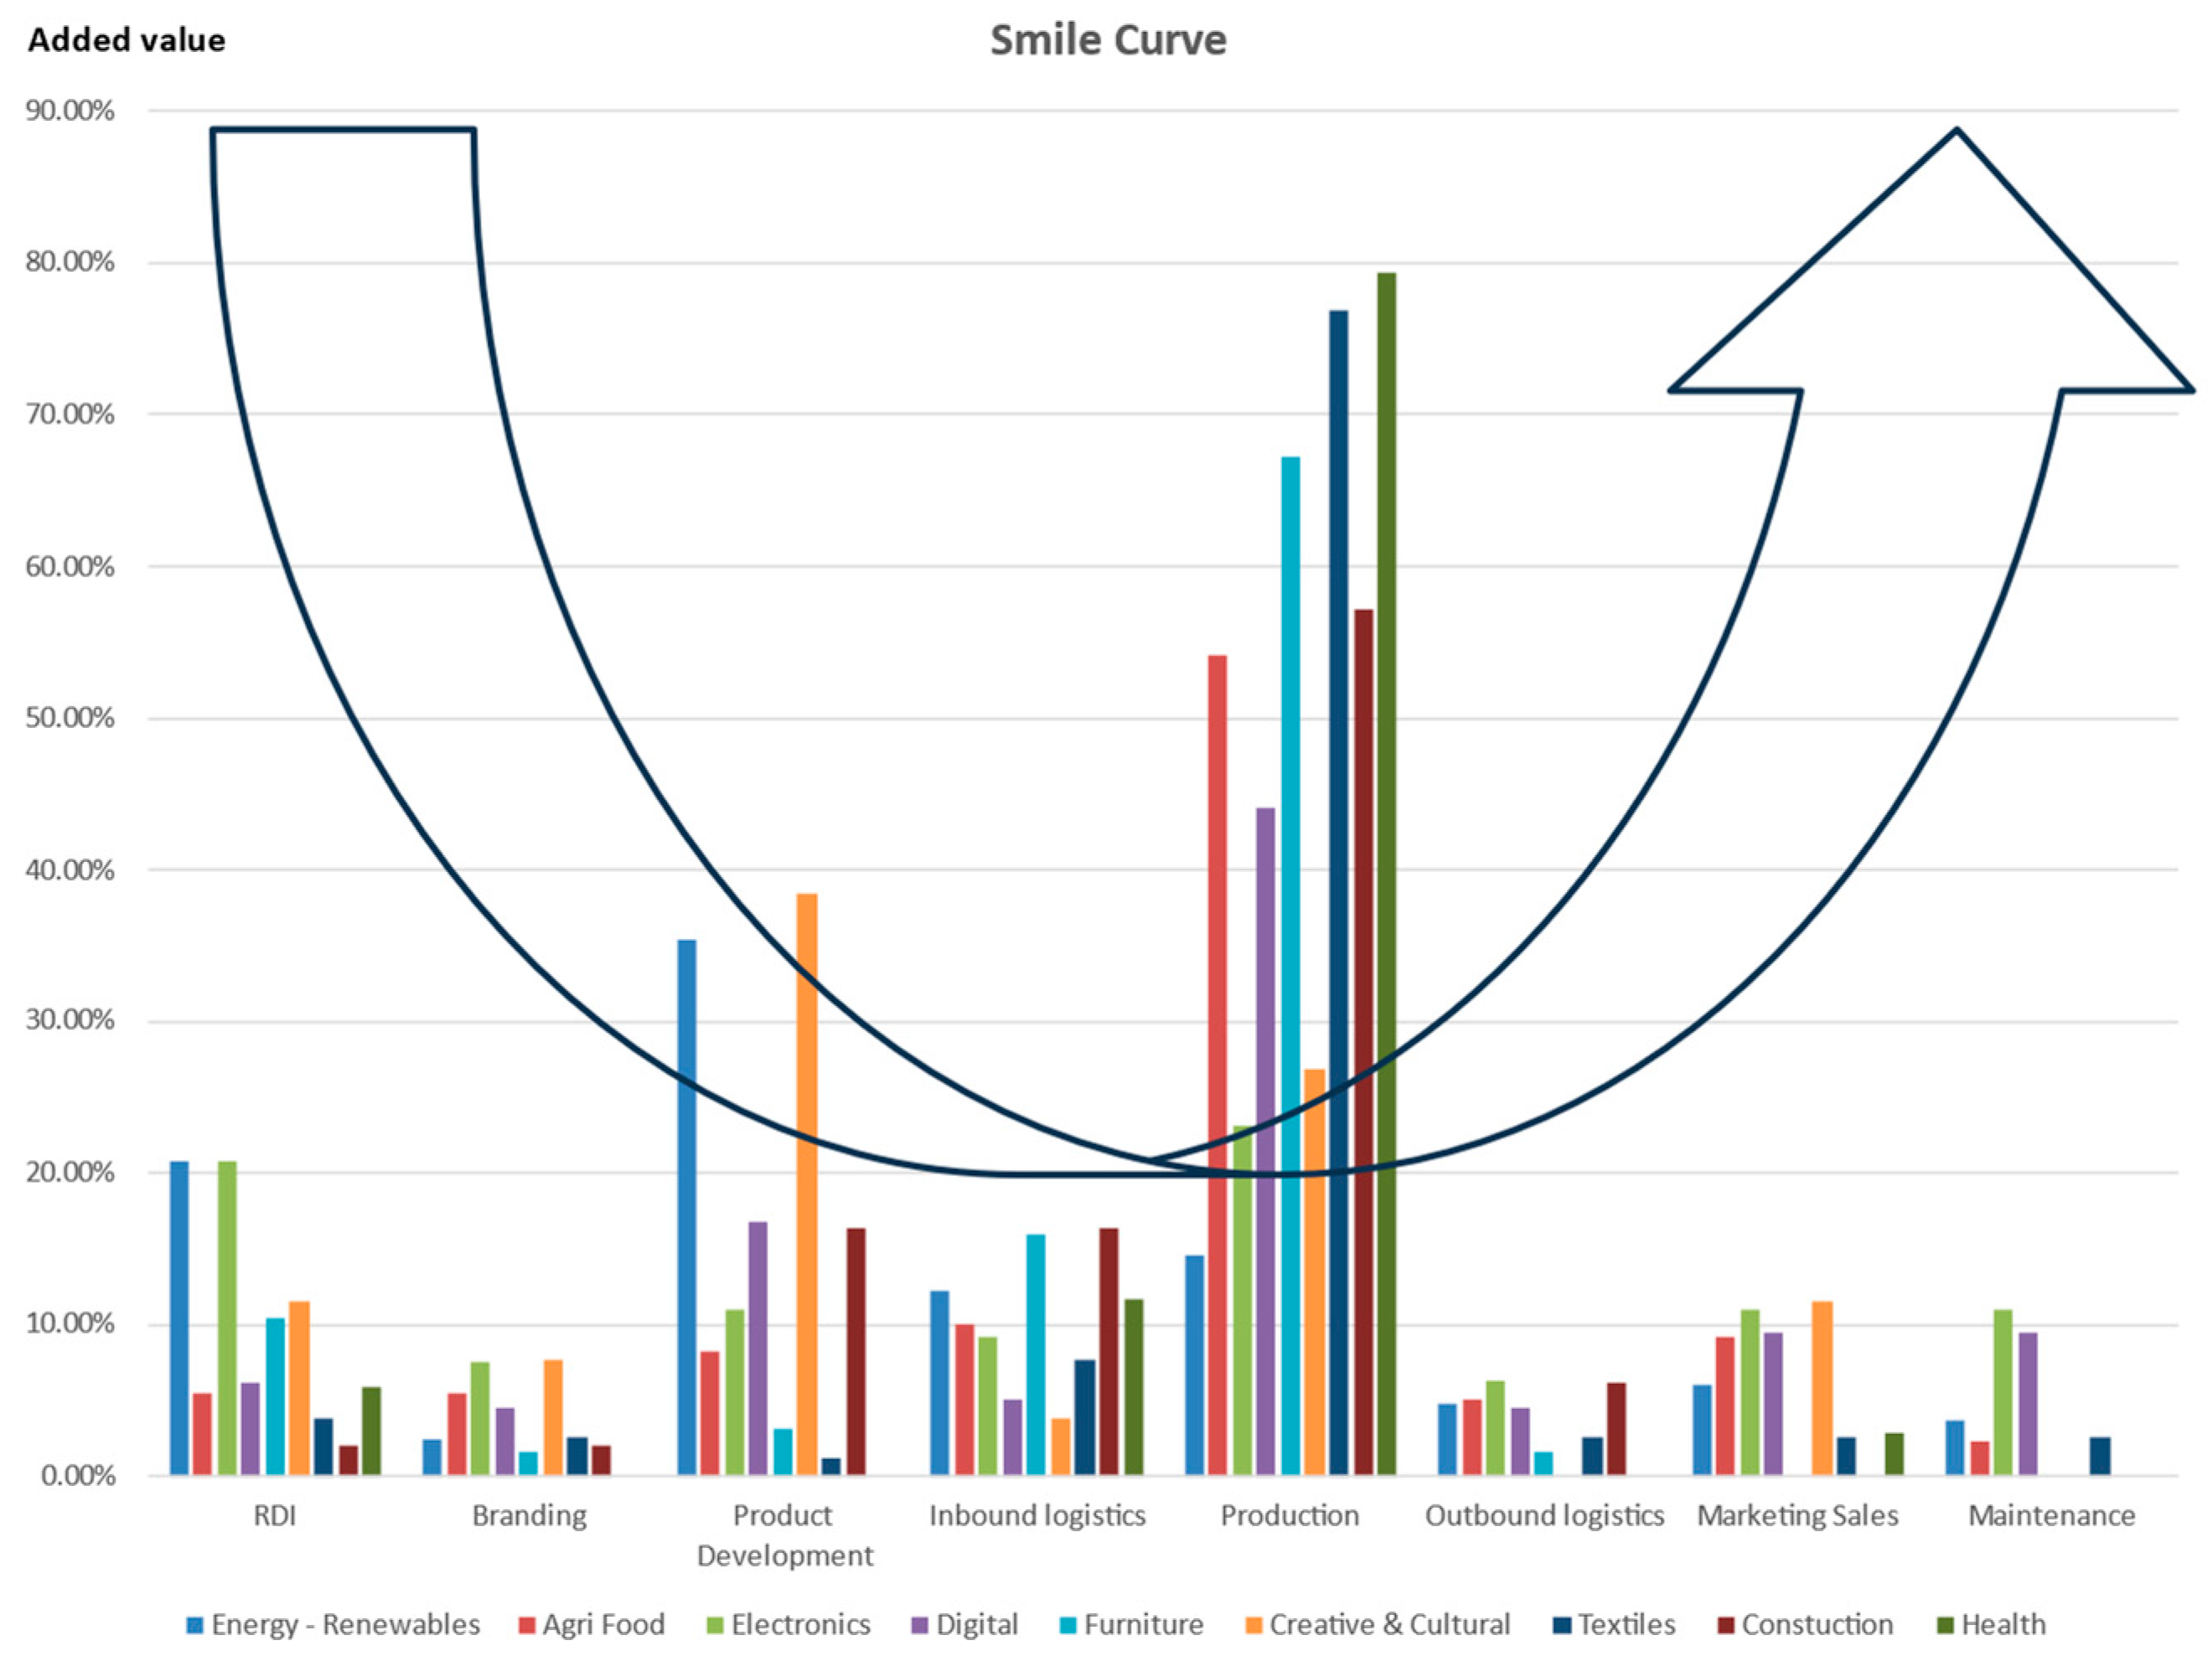
| Energy-Renewables | 20.73% | 2.44% | 35.37% | 12.20% | 14.63% | 4.88% | 6.10% | 3.66% | |
| Agri Food | 5.50% | 5.50% | 8.26% | 10.09% | 54.13% | 5.05% | 9.17% | 2.29% | |
| Electronics | 20.81% | 7.51% | 10.98% | 9.25% | 23.12% | 6.36% | 10.98% | 10.98% | |
| Digital | 6.15% | 4.47% | 16.76% | 5.03% | 44.13% | 4.47% | 9.50% | 9.50% | |
| Furniture | 10.40% | 1.60% | 3.20% | 16.00% | 67.20% | 1.60% | 0.00% | 0.00% | |
| Creative and Cultural | 11.54% | 7.69% | 38.46% | 3.85% | 26.92% | 0.00% | 11.54% | 0.00% | |
| Textiles | 3.85% | 2.56% | 1.28% | 7.69% | 76.92% | 2.56% | 2.56% | 2.56% | |
| Construction | 2.04% | 2.04% | 16.33% | 16.33% | 57.14% | 6.12% | 0.00% | 0.00% | |
| Health | 5.88% | 0.00% | 0.00% | 11.76% | 79.41% | 0.00% | 2.94% | 0.00% | |
| Link | RDI | Branding | Product Design | Inbound Logistics (Suppliers) | Production | Outbound Logistics | Marketing | Maintenance | |
|---|---|---|---|---|---|---|---|---|---|
| Industrial Ecosystem | |||||||||
| Energy-Renewables | 7.42% | 0.00% | 0.29% | 25.94% | 49.14% | 6.22% | 0.33% | 10.66% | |
| Agri Food | 1.51% | 0.06% | 0.56% | 1.45% | 80.61% | 2.02% | 13.31% | 0.49% | |
| Electronics | 3.43% | 0.03% | 0.04% | 10.79% | 81.95% | 2.14% | 0.24% | 1.38% | |
| Digital | 12.74% | 2.48% | 24.34% | 0.03% | 45.34% | 10.43% | 2.34% | 2.30% | |
| Furniture | 0.66% | 0.31% | 0.01% | 3.94% | 95.05% | 0.02% | 0.00% | 0.00% | |
| Creative & Cultural | 43.35% | 0.17% | 33.75% | 0.18% | 18.36% | 0.00% | 4.19% | 0.00% | |
| Textiles | 4.93% | 1.23% | 0.42% | 2.08% | 86.77% | 0.00% | 3.88% | 0.70% | |
| Construction | 1.91% | 0.08% | 70.96% | 10.44% | 16.30% | 0.30% | 0.00% | 0.00% | |
| Health | 0.88% | 0.00% | 0.00% | 8.73% | 89.50% | 0.00% | 0.89% | 0.00% | |
| Link | RDI | Branding | Product Design | Inbound Logistics (Suppliers) | Production | Outbound Logistics | Marketing | Maintenance | |
|---|---|---|---|---|---|---|---|---|---|
| Industrial Ecosystem | |||||||||
| Energy-Renewables | 47.50% | 0.00% | 25.00% | 0.00% | 27.50% | 0.00% | 0.00% | 0.00% | |
| Agri Food | 0.00% | 0.00% | 50.00% | 0.00% | 50.00% | 0.00% | 0.00% | 0.00% | |
| Electronics | 6.82% | 3.65% | 5.87% | 4.25% | 69.60% | 2.72% | 4.50% | 2.58% | |
| Digital | 30.75% | 6.13% | 28.69% | 0.05% | 28.62% | 0.01% | 5.64% | 0.10% | |
| Furniture | 0.90% | 0.82% | 0.72% | 5.33% | 92.20% | 0.03% | 0.00% | 0.00% | |
| Creative & Cultural | 10.00% | 0.00% | 50.00% | 0.00% | 40.00% | 0.00% | 0.00% | 0.00% | |
| Textiles | 3.14% | 0.92% | 0.18% | 0.00% | 95.58% | 0.00% | 0.00% | 0.18% | |
| Construction | 0.00% | 0.00% | 0.00% | 5.44% | 94.21% | 0.36% | 0.00% | 0.00% | |
| Health | 5.08% | 0.00% | 0.00% | 0.00% | 94.92% | 0.00% | 0.00% | 0.00% | |
| Link | RDI | Branding | Product Design | Inbound Logistics (Suppliers) | Production | Outbound Logistics | Marketing | Maintenance | |
|---|---|---|---|---|---|---|---|---|---|
| Industrial Ecosystem | |||||||||
| Austria | 6.72% | 5.04% | 7.98% | 23.53% | 47.48% | 0.42% | 0.84% | 7.98% | |
| Hungary | 6.56% | 0.00% | 23.77% | 12.30% | 24.59% | 20.49% | 8.20% | 4.10% | |
| Montenegro | 0.00% | 0.00% | 20.00% | 20.00% | 50.00% | 0.00% | 10.00% | 0.00% | |
| Romania | 4.27% | 0.85% | 6.84% | 11.11% | 64.10% | 4.27% | 3.42% | 5.13% | |
| Slovenia | 18.67% | 0.00% | 0.00% | 0.00% | 81.33% | 0.00% | 0.00% | 0.00% | |
| Croatia | 6.90% | 5.17% | 8.62% | 12.07% | 51.72% | 10.34% | 0.00% | 5.17% | |
| Total | 7.58% | 2.58% | 10.16% | 15.00% | 50.65% | 5.97% | 2.74% | 5.32% | |
| Link | RDI | Branding | Product Design | Inbound Logistics (Suppliers) | Production | Outbound Logistics | Marketing | Maintenance | |
|---|---|---|---|---|---|---|---|---|---|
| Industrial Ecosystem | |||||||||
| Austria | 5.22% | 0.00% | 12.17% | 24.35% | 46.09% | 4.35% | 0.00% | 7.83% | |
| Baden Wuerttemberg | 4.74% | 4.74% | 9.48% | 33.18% | 37.91% | 2.84% | 4.74% | 2.37% | |
| Hungary | 14.93% | 0.00% | 0.00% | 0.00% | 35.82% | 5.97% | 7.46% | 35.82% | |
| Romania | 24.06% | 5.26% | 15.04% | 0.00% | 19.55% | 0.75% | 18.80% | 16.54% | |
| Serbia | 8.00% | 0.00% | 9.14% | 6.29% | 38.29% | 2.29% | 5.71% | 30.29% | |
| Slovenia | 17.69% | 3.08% | 7.69% | 13.85% | 36.92% | 4.62% | 4.62% | 11.54% | |
| Total | 8.06% | 3.64% | 9.55% | 24.30% | 36.90% | 2.99% | 5.73% | 8.84% | |
| Link | RDI | Branding | Product Design | Inbound Logistics (Suppliers) | Production | Outbound Logistics | Marketing | Maintenance | |
|---|---|---|---|---|---|---|---|---|---|
| Industrial Ecosystem | |||||||||
| Austria | 12.26% | 0.00% | 24.76% | 14.62% | 27.12% | 4.72% | 0.00% | 16.51% | |
| Bavaria | 11.48% | 0.00% | 24.59% | 3.28% | 45.90% | 3.28% | 4.92% | 6.56% | |
| Baden Wuerttemberg | 1.00% | 5.00% | 10.00% | 10.00% | 49.00% | 10.00% | 5.00% | 10.00% | |
| Hungary | 9.38% | 0.00% | 13.54% | 15.63% | 23.96% | 4.17% | 9.38% | 23.96% | |
| Slovenia | 29.17% | 0.00% | 12.50% | 0.00% | 41.67% | 0.00% | 0.00% | 16.67% | |
| Romania | 15.13% | 3.36% | 13.45% | 10.08% | 20.17% | 11.76% | 11.76% | 14.29% | |
| Total | 9.38% | 1.86% | 17.77% | 11.82% | 33.89% | 6.84% | 4.00% | 14.45% | |
Disclaimer/Publisher’s Note: The statements, opinions and data contained in all publications are solely those of the individual author(s) and contributor(s) and not of MDPI and/or the editor(s). MDPI and/or the editor(s) disclaim responsibility for any injury to people or property resulting from any ideas, methods, instructions or products referred to in the content. |
© 2024 by the authors. Licensee MDPI, Basel, Switzerland. This article is an open access article distributed under the terms and conditions of the Creative Commons Attribution (CC BY) license (https://creativecommons.org/licenses/by/4.0/).
Share and Cite
Cosnita, D.A.; Iorgulescu, F.S.; Seghedin, N.E. Clusters as Tools to Measure Sustainable Value Chains. Sustainability 2024, 16, 8013. https://doi.org/10.3390/su16188013
Cosnita DA, Iorgulescu FS, Seghedin NE. Clusters as Tools to Measure Sustainable Value Chains. Sustainability. 2024; 16(18):8013. https://doi.org/10.3390/su16188013
Chicago/Turabian StyleCosnita, Daniel Alexandru, Flaviu Sabin Iorgulescu, and Neculai Eugen Seghedin. 2024. "Clusters as Tools to Measure Sustainable Value Chains" Sustainability 16, no. 18: 8013. https://doi.org/10.3390/su16188013
APA StyleCosnita, D. A., Iorgulescu, F. S., & Seghedin, N. E. (2024). Clusters as Tools to Measure Sustainable Value Chains. Sustainability, 16(18), 8013. https://doi.org/10.3390/su16188013