Article

Evolutionary Game Analysis of Collaborative Prefabricated Buildings Development Behavior in China under Carbon Emissions Trading Schemes

School of Business, Jiangnan University, Wuxi 214122, China
*
Author to whom correspondence should be addressed.
Sustainability 2024, 16(18), 8084; https://doi.org/10.3390/su16188084
Submission received: 22 July 2024 / Revised: 21 August 2024 / Accepted: 12 September 2024 / Published: 16 September 2024
(This article belongs to the Section Green Building)

Abstract

:
Prefabricated buildings (PBs) are considered a green way to reduce energy consumption and carbon emissions in the construction industry due to their environmental and social benefits. However, PBs have obstacles such as high construction costs, immature technology, and insufficient policy incentives, and developers’ willingness to develop them needs to be higher. Therefore, it is necessary to explore how to motivate more developers to develop PBs. In this paper, we first discuss the impact of the carbon emissions trading scheme (ETS) on the construction industry and then consider the heterogeneity of construction developers, introduce a collaborative mechanism to establish a three-party evolutionary game model between the government and the heterogeneous developers, and explore the evolution of the three-party dynamic strategies through numerical simulation. The results show that developers’ initial development probability affects the system’s evolutionary trend, and the developer who obtains more low-carbon benefits plays a dominant role. Further analyses show that critical factors such as market profitability, synergistic benefits, and carbon tax price positively influence the development of PBs, and the influence of synergistic cooperation mechanisms should be especially emphasized. This study provides practical insights into the sustainable development of the construction industry and the government’s development of a suitable carbon portfolio policy for it. Including the construction industry in the ETS is recommended when carbon prices reach 110 RMB/t. At this point, the government can remove the subsidy for PBs, but the behaviors of the developers who participate in the ETS still need to be supervised.

1. Introduction

China currently accounts for 35% of the global total CO2 emissions, and by 2020, China’s total CO2 emissions had exceeded those of all developed economies combined. This value increased by 15% in 2023, as evidenced by an increase of 5.65 million tons to 1.26 billion tons. People consider the construction industry a significant contributor to climate change, accounting for 21% of global CO2 emissions, and it is necessary to promote carbon emission reduction in the construction industry [1]. Compared to traditional buildings, prefabricated buildings (PBs) reduce carbon emissions by 12.45% during the construction phase, improve environmental benefits by 170.05% during the end-of-life phase, and achieve a 59.58% reduction in greenhouse gas emissions over their entire life cycle, making PBs a crucial strategy for promoting the green development of the construction industry [2]. However, the development of PBs is still facing many challenges, including a lack of modularization expertise and practice, leading to a high cost of adopting the transformation construction of PBs, a lack of government support and policy effects, and inconsistency in mastering the maturity of the technology, which causes the development of PBs to remain slow in many regions [3,4]. Therefore, it is necessary to explore how to transform the environmental benefits of PBs into economic benefits to promote the development of PBs [5].
Developers, as the most influential core stakeholder in the PB industry chain, are the drivers of the profit of the whole project, so it is crucial to enhance developers’ willingness to develop [6,7]. The growth rate of new areas of PB projects has decreased from 2021 to 2023, and most of these projects are led by the government, so the proportion of PB projects led by real estate developers still needs to grow [1]. That is because developers who seek to maximize profits refuse to bear the risk factors of high initial development costs, additional technology investment, and uncertain market demand [8]. In response to this, several scholars have comprehensively analyzed the factors that influence developers’ decisions and found that the most significant influences are the market environment and policy instruments [9,10,11]. Market factors within the field of PBs enhance market demand by establishing interactive behavior between developers and other stakeholders to increase the willingness of all parties to develop PBs [12]. Studies have confirmed that system profits are the most significant factor, and the incentive effect is most evident under corporate synergy and cooperation [13]. In addition, policy tools regulate the market environment at the macro level, thus affecting the costs and benefits brought by the behavior of developers in the industry chain [14,15]. It is, therefore, essential to explore the interconnections between policy and market factors and their impact on the development of PBs by heterogeneous developers.
However, previous studies have mainly discussed the effects of carbon policies, such as carbon taxes and subsidies, on the collaborative development of PBs among developers and other stakeholders [3], without considering the existence of heterogeneous developers and the effects of the carbon emissions trading scheme (ETS) on the interactive behaviors among heterogeneous developers. In contrast, the ETS aims to encourage more enterprises to choose energy-saving and emission-reducing behaviors by using the market mechanism as the basis, and it has been valued by several governments and scholars [16]. It increases the cost of carbon emission treatment for enterprises, leading them to strengthen their efforts in carbon emission reduction to reduce additional expenses [17], and so it seems to be a feasible tool to promote the cooperation of heterogeneous developers in developing PBs. However, factors such as carbon tax prices and carbon allowances in carbon trading schemes continue to directly affect the costs and benefits for developers joining the carbon trading market, leading to heterogeneous behaviors such as greenwashing as developers make different technological decisions due to differences in their own abatement capabilities and investment costs [18,19]. Therefore, it is necessary to explore the changes in behavior between the government and heterogeneous developers after the introduction of the ETS.
Researchers increasingly regard evolutionary game theory as a crucial approach for studying issues related to reducing low-carbon emissions. That is because it can analyze the dynamic evolutionary tendencies of multiple entities and address the equilibrium stability of different entities [20]. Analysis of equilibrium behavior between the government and developers through game models reveals that conflicts of interest among developers with varied goals, coupled with factors such as corporate environmental consciousness, low-carbon preferences, and random variables, as well as governmental policies significantly affect the adoption of low-carbon strategies and highlights the influence of prevailing interests and stochastic elements on establishing equilibrium conditions [21]. While most of the existing literature uses the traditional game to study the carbon emission reduction problems of the government and enterprises, in the actual carbon emission reduction process, due to the limitation of the information at hand, it is difficult for the government and enterprises to reach a strategic equilibrium in a single game. We need to achieve it by continuously repeating a dynamic game [22]. In this case, the evolutionary game model based on the assumption of limited rationality is more able to reflect the interaction between the government and real estate enterprises and the impact on their respective strategic choices for carbon emission reduction [23]. In this paper, we hope to explore the following questions through the study: Can the carbon policy after the introduction of an ETS promote the development of PBs? What factors influence how the carbon trading policy affects the behavioral strategies of the government and developers? How do they influence them? Does synergistic cooperation between heterogeneous developers impact the development of PBs?
To explore the above issues, this paper first considers that under the influence of market-oriented tools such as an ETS, heterogeneous developers will adjust their corporate strategies in the face of changes in the market structure. To further study the interactive decision-making between heterogeneous developers under the ETS, an evolutionary game model of synergistic co-operation between the government and heterogeneous developers is established accordingly to investigate the behaviors and mutual influences between the government and the heterogeneous developers under different scenarios. A numerical example simulates the evolutionary process of the evolving system based on this. The contributions and innovations of this paper are in the following three areas:
(1)
We are considering differences in the behavioral choices of developers facing an ETS with different low-carbon and investment levels. Therefore, by using the proportion of low-carbon investment to reflect the low-carbon level and dividing developers into two categories, the natural process of behavioral choices between heterogeneous developers can be better reflected.
(2)
By analyzing the stability and rate of evolution of the system and identifying the key factors influencing developers to develop PBs, it provides more flexible decision-making options for developers within the construction industry, as well as a reliable case study for the government to create a more targeted, feasible, and dynamic policy mix of tools. That is also very much in line with sustainable development in the construction industry and has a certain degree of foresight.
(3)
The results of this paper, based on numerical analysis, demonstrate to a certain extent the feasibility of an ETS in the field of PBs, which not only enriches the theoretical guidance in the field of PBs but also provides a market-based tool to internalize the environmental benefits of PBs into economic benefits, which provides a new research approach to promote the development of PBs effectively.
Following this section, Section 2 reviews the relevant literature. Section 3 develops a three-party evolutionary game model. Section 4 analyzes the evolutionary stabilization strategies of the evolutionary game model. Section 5 simulates and discusses the impact of critical factors that promote PB adoption. Based on the findings, Section 6 presents policy recommendations to promote developers’ adoption of PBs and the government’s development of carbon trading mechanisms and discusses limitations and future research.

2. Literature Review

Existing studies have shown that PBs are essential to support the construction industry’s green development because they have significant environmental benefits, especially positive impacts on carbon emission reduction [5]. Li et al. [24] demonstrated that BIM technology could reduce carbon emissions by about 15% per unit area over the whole life cycle. Xu et al. [25] confirmed that an increase in the prefabrication rate positively impacts the carbon reduction capacity of PBs. Based on the effect of green practices on PBs, many regions have formulated relevant policies to promote the development of PBs. He et al. [26] demonstrated that carbon taxes are pivotal in promoting carbon emission reduction.
Meanwhile, subsidy policies have been taken as the most incentivizing policy tool because they can directly reduce the incremental cost to enterprises adopting new carbon emission reduction technologies [27]. However, due to the differences in policy implementation, market demand, and technology diffusion in different regions, PBs only account for 20% of the area of new construction projects in China. The overall development level is still relatively low [1,3,4], so it is necessary to further explore the behaviors of different stakeholders in the industry chain and the key influencing factors.
The research confirms that developers, general contractors, and prefabricated component manufacturers are considered the core stakeholders in the PB industry chain, and developers, as the vital body of investment and construction, are considered the most critical stakeholders because of their significant influence on the decisions of other stakeholders [5,6]. Meanwhile, based on Luo, Zhang, and Wang et al.’s research, it has been shown that factors such as the market environment, the type of technology and its specification, the effectiveness of policy instruments, and the return on investment all positively affect developers’ construction of PBs. Among them, market and policy factors are considered to be the most crucial driving factors [8,9,10]. Within the field of PBs, market factors affect the costs and benefits to stakeholders such as developers through factors such as market environment, dynamics, and demand [11]. Furthermore, the current research on market factors mainly analyzes how to maximize the interests of all parties through the cooperative behaviors of different stakeholders [12,13]. For example, Zhang et al. [28] demonstrated through BIM technology that when supply chain enterprises collaborate, strengthening the degree of information sharing can positively increase the overall profit of the supply chain. Xue et al. [12] demonstrated that contractors and precast component manufacturers make the most significant system profits under the collaborative mechanism by building an intelligent management platform.
However, current policies mainly impose uniformity and fixed standards for carbon tax penalties or subsidies. This results in developers and stakeholders collaborating only to meet minimum environmental targets, without incentives for further action [29]. Furthermore, current research on synergistic cooperation mainly explores how it is carried out between developers and other stakeholders and does not consider whether synergistic cooperation can be carried out between heterogeneous developers, especially since heterogeneous developers may show “free-rider” and “greenwash” behaviors due to their ability to reduce emissions and transform themselves, the cost of their investment, and the market demand [18,30].
As a way of saving energy and reducing emissions, ETSs have been shown by scholars to be an emission reduction mechanism based on the operation law of the market itself and are an effective strategy for achieving sustainable development [31]. Researchers have begun to explore the effect of ETSs in the construction industry [15,16]. Liu et al. [32] verified that implementing an ETS reduced the total carbon emissions by about 101% in construction resource waste management. Du et al. [33] confirmed the crucial role of ETSs in carbon emission reduction through a study that explored the influence of numerous factors, including ETSs, on the carbon reduction decision-making choices of developers and contractors in construction projects under different decision-making scenarios. At the same time, the current literature considers that the introduction of an ETS while maintaining the existence of a carbon tax policy can form a reasonable policy combination, which can, to a certain extent, reduce factors such as heterogeneous behaviors and uncertainty of choices that may exist in different enterprises in the carbon emissions trading market, as well as the impacts of these factors on emission reduction technologies [26,27].
In the above study, the macro impact of ETSs on the existence of low-carbon behavior and the related decision-making of construction companies is first explored. However, it mainly focuses on the interactive behaviors between the government and stakeholders under the premise of the government’s introduction of relevant incentivizing policies to reveal the decision-making mechanism of green building incentives and interactions between various parties. Secondly, the synergistic effects of combining an ETS and other carbon-related policies are also further analyzed, showing that the most significant impact of promoting green building development occurs when all the factors work in tandem. In addition, the positive effects of ETSs on the diffusion of low-carbon technologies among construction firms have also been confirmed, and it has been pointed out that the maturity of the carbon trading market directly impacts the low-carbon choices of construction firms. However, current studies are limited to exploring the behavioral interactions and strategic adjustments between the government and developers, as well as developers and other stakeholders in the industry under the ETS, and they lack a research perspective and game framework for the low-carbon choices of heterogeneous developers. As a result, they lack consideration of the impacts of critical factors such as carbon taxes and carbon quotas on heterogeneous developers under the ETS model, and they fail to perform a systematic study and exploration of the interactions between the heterogeneous behaviors of developers and the ETS policy.
Therefore, considering the feasibility of evolutionary games for simulating the strategy changes and behavioral choices of all parties and the ability to reasonably perform quantitative analysis of the game of interests among different stakeholders in the construction industry, this paper proposes a new three-party evolutionary game model of an ETS. The proposed model is based on exploring the key influencing factors of developers’ low-carbon choices, combined with the cost–benefit differences arising from the differences in developers’ low-carbon levels, and it establishes a simulation of the heterogeneous behaviors of the developers. By introducing a coordination and cooperation mechanism in the context of the ETS and using the incentives and constraints of the synergistic effect to promote the collaborative development of PBs among heterogeneous developers, this paper constructs a tripartite evolutionary game analysis framework around the synergistic cooperation between the government and heterogeneous developers to explore the changes in the strategic choices of each party and the key influencing factors in the context of the ETS.

3. Three-Party Evolutionary Game Model

3.1. Description of Tripartite Behaviors

In the context of a low-carbon economy, developers will gradually lead the emergence of heterogeneous behaviors depending on their low-carbon levels. Therefore, this paper sets developers U and M as groups with different low-carbon levels. Given that developers obtain more market benefits with robust low-carbon levels than with weaker low-carbon levels when investing the same cost, developers U and M will invest in different proportions based on how their low-carbon levels impact market demand [6]. In addition, when developers all choose to develop assembled buildings, low-carbon synergies are created collaboratively. The synergy effect is mainly manifested in the dynamic interaction of developers’ economic behaviors, which brings additional financial benefits to developers, so this paper uses the additional financial benefits generated by the synergy effect by setting up a synergistic cooperation mechanism to promote the ability to collaboratively develop assembled buildings among heterogeneous developers [34].
Under China’s current carbon trading system, local governments allocate a specified number of free carbon allowances to building developers after verifying carbon emissions, and developers must purchase additional credits for any carbon emissions exceeding those allowances. Tools such as LCA and BIM can quantitatively analyze a developer’s carbon emissions, which the government can verify. The government also allocates free carbon credits to co-developed PB projects, and the carbon emissions of PBs are much lower than those of conventional buildings. For developers, constructing PBs can result in lower carbon tax payments to the government than those required for conventional buildings. When a developer reduces their carbon emissions below the carbon quota, the developer can sell the quota in the carbon emissions trading market for profit; even if the developer is unable to meet the standard of carbon emissions below the free quota by reducing the emissions within a certain period, the developer can still reduce the amount of carbon tax to pay. When the government actively promotes behavioral strategies, and the developer opts to develop conventional buildings, they must pay a carbon tax on top of the basic one. The additional payment is the government’s penalty for engaging in conventional building practices. Moreover, given the double externality between heterogeneous developers [18,30], when one party chooses to develop a PB, the other party who chooses to withdraw from the cooperation needs to pay the corresponding liquidated damages to compensate for the loss of the developer building the PBs. The government plays a guiding role throughout the evolutionary process using dynamically adjusted policy instruments, with the probability of engaging in the positive promotion of assembled buildings for performance awards and environmental benefits, as well as more relaxed and negative promotional behaviors with the expectation of reducing costs. On this basis, the game–behavior relationship between promotion and building development behaviors of the government and cooperating heterogeneous developers is shown in Figure 1.

3.2. Model Assumptions and Parameterization

Based on the roles and characteristics of the government and building developers in the PB market, the following model assumptions are proposed, and the related model parameters are shown in Table 1.
Assumption 1.
In the evolutionary game model of this paper, there are three game subjects, the local government and heterogeneous developers U and M, all of which are finitely rational and will choose the relevant strategies to maximize their interests in the continuous evolution.
Assumption 2.
Two strategies categorize the local government: active promotion and passive promotion. When the local government chooses positive promotion, it actively verifies the behavior of developers and dynamically adjusts its carbon policy; its cost is Cga. When the local government chooses the negative promotion strategy, its cost is Cgn, where only the necessary promotion work is carried out. As a result, the local government has a lower promotion cost but will be penalized by the central government for performance with a penalty of R.
Assumption 3.
Building developers U and M have two strategies: collaborative development of PBs or independent development of conventional buildings. When choosing the behavior of developing conventional buildings, due to the relative maturity of the conventional building market, developers U and M have comparable development capabilities, with carbon emissions of Li, development costs of Ci, and revenues of Bi (i = u, m). In the collaborative development of PBs, developers with different low-carbon levels of development will face different costs and returns [4]. Developers U and M denote the types of developers with different low-carbon levels in the PB market. They will make different proportions of investment choices due to their different low-carbon levels [6]. The investment proportion of developer U is k, and the investment proportion of developer M is (1 − k), (0 < k < 1).
Assumption 4.
When the developers collaborate on developing PBs, the carbon emissions are Lb, the cost is C, and the fixed and synergistic benefits obtained are B and v, respectively. At this point, when one party chooses to collaborate on the development and the other withdraws from the cooperation, the latter developer needs to bear the cost alone. Therefore, the mechanism of coordinated cooperation between heterogeneous developers consists of liquidated damages Di (i = u, m) as compensation for not withdrawing from the cooperative party. In addition, the government will lose the environmental benefits Ei (i = u, m) brought by the withdrawing party. It must pay the corresponding environmental governance cost ∆Ci (i = u, m). The government also pays an additional governance cost Cg for environmental governance when all developers choose conventional building behavior. In contrast, the government receives an additional environmental governance benefit E when developers collaborate to develop PBs.
Assumption 5.
After introducing the ETS, the local government will combine the carbon tax and allowances and set the initial carbon tax price P and free carbon allowances L. To encourage more developers to develop PBs, the carbon emissions of each strategy should meet the following conditions: Li > Lb > L (i = u, m); furthermore, developers need to purchase additional carbon allowances when the carbon emissions of the buildings they develop exceed the allowances. Moreover, the local government will gradually reduce the free carbon allowances, increase the price of the carbon tax, and charge an additional carbon tax as a penalty for developers who choose to develop conventional buildings, with the penalty ranging from g and increasing, with 0 < g < 1, to reduce the probability of double externality when the developer meets the minimum environmental target [18,30].
Assumption 6.
The government’s positive and negative promotion strategies are abbreviated as GA and GN, with corresponding probabilities of x and 1 − x; building developer U’s strategies of synergistic development of PBs and development of conventional buildings are abbreviated as UPS and UNS, with corresponding probabilities of y and 1 − y; and building developer M’s strategies of synergistic development of PBs and development of conventional buildings are abbreviated as MPS and MNS, with corresponding probabilities of size z and 1 − z (0 < x, y, <z < 1).

3.3. Model Payoff Matrix

According to the above model assumptions and the parameter setting table of the relevant participating subjects, the payoff matrix of the game subjects can be obtained, as shown in Table 2.

4. Analysis of Tripartite Evolutionary Model

4.1. Analysis of Three-Party Subject Evolutionary Strategies

Here, we analyze the strategy choices of the three participating subjects in the evolutionary game system using the replicated dynamic equations of the three parties.

4.1.1. Local Government

Assume that the local government adopting the positive promotion strategy of the expected return is E 11 , the negative promotion strategy of the expected return is E 12 , and the average expected return of the local government is E ¯ 1.
E 11 = E C g + S z g P L u L + C g + E u + C u S y + ( g P L m L + C g + E m + C m S ) z + g L m 2 L + L u P C g C g a C m C u + R
E 12 = ( ( E C g ) z + C g + E u + C u ) y + ( C g + E m + C m ) z C g C u R C g n C m
E ¯ 1 = x E 11 + ( 1 x ) E 12
The replication dynamic equation for local government extension behavior is as follows:
F ( x ) = d x d t = x ( E 11 E ¯ 1 ) = x ( 1 x ) ( ( ( L L u ) y + ( L L m ) z 2 L + L u + L m ) g P + S ( z 1 ) y z S C g a + C g n + 2 R )

4.1.2. Developer U

Assume that developer U has an expected return of E 21 if it chooses to collaborate and cooperate in the development of PBs, an expected return of E 22 if it chooses the behavioral strategy of developing conventional buildings, and that its average expected return is E ¯ 2 .
E 21 = ( ( k 1 ) ( L L b ) P + ( S x + B C + v ) ( k 1 ) D m ) z + P ( L L b ) + S x + B C + v + D m
E 22 = ( L L u ) ( g x + 1 ) P u z D u + B u C u
E ¯ 2 = y E 21 + ( 1 y ) E 22
The replication dynamic equation for constructing the developer’s U behavioral strategy is as follows:
F ( y ) = d y d t = y ( E 21 E ¯ 2 ) = y ( 1 y ) ( ( ( k 1 ) ( L b L ) P + ( S x + B C + v ) ( k 1 ) D m + D u ) z + ( g ( L u L ) x L b + L u ) P + S x + B B u + C u + D m C + v )

4.1.3. Developer M

Assume that developer M has an expected return of E 31 if it chooses to collaborate and cooperate in the development of PBs, an expected return of E 32 if it chooses the behavioral strategy of developing conventional buildings, and that its average expected return is E ¯ 3 .
E 31 = ( ( P ( L b L ) S x B + C v ) k D u ) y + P ( L L b ) + S x + B C + D u + v
E 32 = ( g x + 1 ) ( L L m ) P y D m + B m C m
E ¯ 3 = z E 31 + ( 1 z ) E 32
The replication dynamic equation for developer M’s behavioral strategy is as follows:
F ( z ) = d z d t = z ( E 31 E ¯ 3 ) = z ( z 1 ) ( ( k ( L L b ) P + ( S x + B C + v ) k D m + D u ) y + ( g ( L L m ) x + L b L m ) P S x B + B m C m D u + C v )

4.2. Stability Analysis of the Evolutionary Game Model

The possible game equilibrium points and the eigenvalues corresponding to each point are obtained by solving the replicated dynamic equations for the three participating game subjects, as shown in Table 3.
Although the ETS is a market mechanism-driven instrument, it is essentially government-led. Under the regulation of carbon trading policies, developers initially have insufficient incentives to participate in the carbon emissions trading market, and corporate performances tend to show negative growth after participation. Subsequently, constrained by market cooperation and competition, firms actively participate in the carbon emissions trading market, and corporate performances gradually transition to positive growth [35,36]. Combined with the decay phenomenon of carbon emissions in the life cycle of enterprises [37], the impact of the ETS is divided into the following four stages: the initial stage, the transformation stage, the growth stage, and the stability stage; these are combined with the eigenvalues of the equilibrium point to carry out the analysis of the stability of the evolution of different stages.
Initial stage: The government at this stage begins to promote the carbon emissions trading scheme, gaining the attention of the central government. The carbon tax collected is burdensome, making it difficult to offset the incremental costs needed for active promotion; there is g ( L u + L m 2 L ) P + 2 R < C g a C g n . The government tends to adopt the behavioral strategy of negative promotion. For developers, less government promotion at this point leads to a lower willingness on both sides of the business to develop PBs, the binding power of the liquidated damages agreement is weaker, and the transformational benefits brought about by developing PBs are much smaller than the incremental costs, with P ( L u L b ) + B B u + v + D u < C C u and P L m L b + B B m + v + D m < C C m . Thus, developers are inclined to adopt the behavioral strategy of developing conventional buildings among themselves.
Transformation stage: With the promotion of the concept of sustainable development, the central government gradually increases financial support to the local government; the local government continues to dynamically adjust the carbon policies of carbon tax price, penalty range, and subsidies so that the benefits gained from active promotion are more significant than the incremental costs, shown as g ( L u + L m 2 L ) P + 2 R > C g a C g n . At this time, the government tends to choose the behavioral strategy of active promotion. For developers, although they enjoy the subsidies issued by the government, due to the government’s lower carbon tax unit price and penalty range at this time, the incremental benefits and synergistic benefits brought about by the developers’ construction of PBs are low enough to offset the incremental costs brought about by the development. The developers are inclined to choose to bear the more minor losses brought about by violating the liquidated damages agreement and the government’s policy at this time. With P ( L u L b + g ( L u L ) ) + B + D m + S + v B u < C C u and P ( ( g + 1 ) L m g L L b ) + B + D u + S + v B m < C C m , developers are inclined to choose the behavioral strategy of developing conventional buildings.
Growth stage: The central government maintains its focus on local government performance while the local government continues to reduce free carbon allowances and increase penalties. Supported by subsidy policies, developers realize that the high initial costs and synergistic benefits can be shared through collaborative efforts. At this point, compared to developing conventional buildings, the benefits gained by developers from developing low-carbon emission PBs are more significant than the costs, and with P ( k ( L L b ) + ( L u L ) + k ( B + v ) B u + D u > k C C u and P ( L m k ( L L b ) L b ) + ( 1 k ) ( B + v ) B m + D m < ( 1 k ) C C m , developers tend to choose the behavioral strategy of collaborative development of PBs. However, at this time, for the government, the market-based synergistic partnership between developers tends to stabilize, and the government’s continued subsidies will increase the government’s financial pressure, making the benefits gained from the government’s active promotion smaller than the incremental costs paid, with 2 R S < C g a C g n , and the government will tend to choose the negative promotion behavioral strategy.
Stabilization stage: As cooperation between developers stabilizes, more and more PB projects are successfully developed. The central government, in order to reduce its pressure, no longer spends additional resources for support, and the local government maintains the adjustment of the carbon tax unit price and penalties at the same time and no longer issues subsidies to alleviate the government’s financial pressures, leading to 2 R S > C g a C g n . At this time, the government has actively promoted the behavior strategy. At the same time, there are more and more building developers under the government’s active promotion of carbon trading policies. The revenue gained in the carbon emissions trading market and the incremental revenue brought by the development of PBs can offset the incremental cost of development, with P ( ( 1 + g ) ( L u L ) k ( L b L ) + k ( B + v + S ) B u + D u > k C C u and P ( ( 1 + g ) L m ( 1 + g ) L ( 1 k ) L b L ( k + g ) ) + ( 1 k ) ( B + v + S ) B m + D m > ( 1 k ) C C m , and developers tend to choose the behavioral strategy of developing conventional buildings.

5. Numerical Analysis

5.1. Data Source

The empirical data about the incremental cost of PBs, carbon-free allowance credits, and annual carbon emission decline coefficients in this model were obtained from China’s Ministry of Housing and Urban-Rural Development, local government networks, and literature and research data on relevant carbon trading. In 2022, the carbon price in China ranged from about 4 RMB/t to 150 RMB/t [38]. Around the end of 2023, the average transaction price of carbon trading was about 56 RMB/t, calculated based on the cumulative carbon emission turnover quota and total turnover amount in the national carbon market [39]. The initial carbon tax price set in this paper is 50 RMB/t. According to the annual quota allocation plan for carbon emissions trading in the national thermal power industry from 2021 to 2022 and China’s expectation of tightening the annual carbon emission quota expectation, the free quota was set to account for 80% of the annual emissions [40]. According to the carbon emission quota allocation plan for the construction industry and other manufacturing industries issued by the Shenzhen Municipal Government, the historical emission method was adopted to set the annual target carbon intensity equal to the multiplication of the historical carbon intensity and the annual decrease factor, and the annual decrease factor of carbon emissions was calculated to be 4% [41]. At the same time, taking into account the game of the government and the stakeholders in the development of green buildings, the greater the probability of strict regulation adopted by the government, the more companies tend to follow the development of green standards; this paper, therefore, assumes that the magnitude of the penalty for carbon trading under the government’s active promotion strategy will continue to rise [42]. The penalty mechanism takes effect when the carbon emissions exceed the standard, and the penalty amount is the penalty magnitude coefficient multiplied by the number of carbon emissions exceeding the standard [43]. At the same time, the default penalty shall not exceed 30% of the loss cost, so this paper sets the maximum default penalty at 90 RMB/m2 [44].
In this paper, the carbon emission data about conventional buildings and PBs were derived from related literature research, and the whole life cycle carbon emission data of conventional buildings and PBs with different structures were compared and analyzed through LCA and BIM. It was found that in the operation and management stage, the carbon emissions of the building account for about 91% of the total amount, and compared with conventional buildings, physical and operational carbon emission reduction can be effectively carried out through the PBs [24]. In this paper, for the developer who is responsible for the operation and management phase, the examples taken are residential lightweight steel structure PBs and cast-in-place conventional buildings, whose carbon emissions are 2848.58 and 3055.11 kg CO2 eq./m2 over the whole life cycle and about 2593 and 2780 kg CO2 eq./m2 in the operation and management phase, respectively [2]. The cost of a light steel structure PB is about 3321 RMB/m2, and its incremental cost compared to a conventional building is 10–12%, which is set as 10% in this paper [45]. Meanwhile, the incremental benefit of enterprises developing PBs is calculated to be about 3–6%, and the synergistic incremental benefit is about 3% [1,46]. According to the subsidies of different local governments for the development of PBs, the minimum is not less than 10 RMB/m2, and the maximum is not more than 100 RMB/m2. The settings of each parameter are shown in Table 4, where the unit price of a carbon tax is RMB/kg, and the unit of carbon emission is kg CO2 eq./m2.

5.2. Analysis of Tripartite Evolution Results at Different Stages

Considering that the different low-carbon levels of heterogeneous developers will influence their willingness to invest in carbon emission reduction, this paper sets k = 0.1, 0.2, and 0.7 to simulate the investment ratio between developers with different low-carbon levels. It uses MATLAB2016b to perform the evolution of the 100-group strategy with the other parameters remaining stable to obtain the following results.
(1)
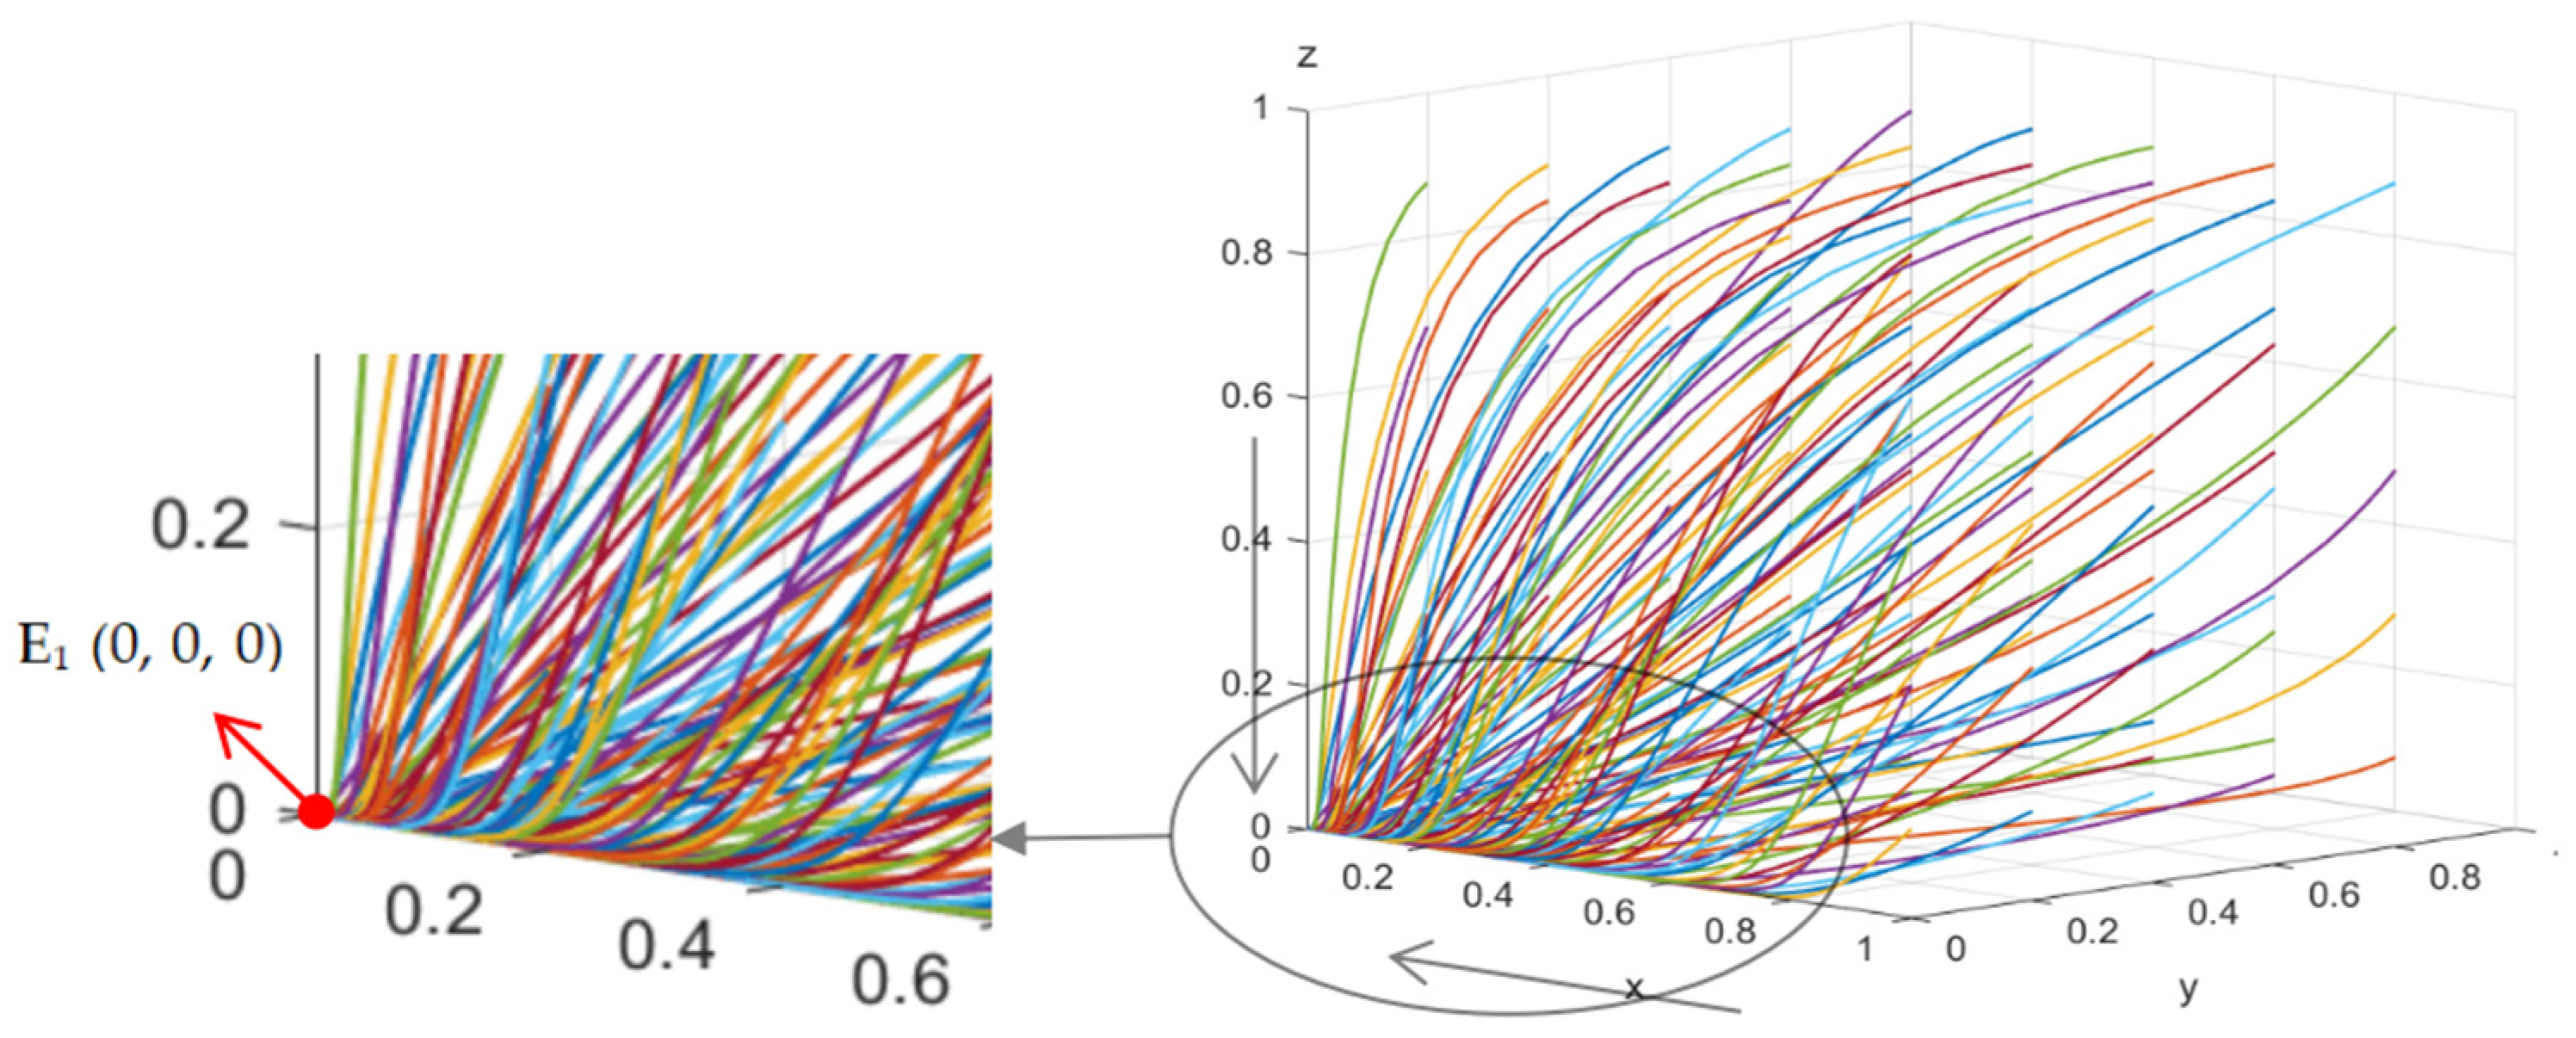
The initial stage of the three-party evolution results
The values given in Table 4 meet the initial stage stability condition, namely ( g ( L u + L m 2 L ) P + 2 R < C g a C g n , P ( L u L b ) + B B u + v + D u < C C u and P ( L m L b ) + B B m + v + D m < C C m . Using MATLAB2016b to simulate the evolution of 100 groups of strategies, with other parameters held constant, k is taken as 0.1, 0.2, and 0.7. After iteration, the results are obtained, as shown in Figure 2. All three strategies converge to the stable equilibrium point E1 (0, 0, 0), which indicates that E1 is the stable equilibrium point in this stage. In the initial stage, the local government shows negative promotion behavior, and the building developers all take the route of developing conventional buildings.
(2)
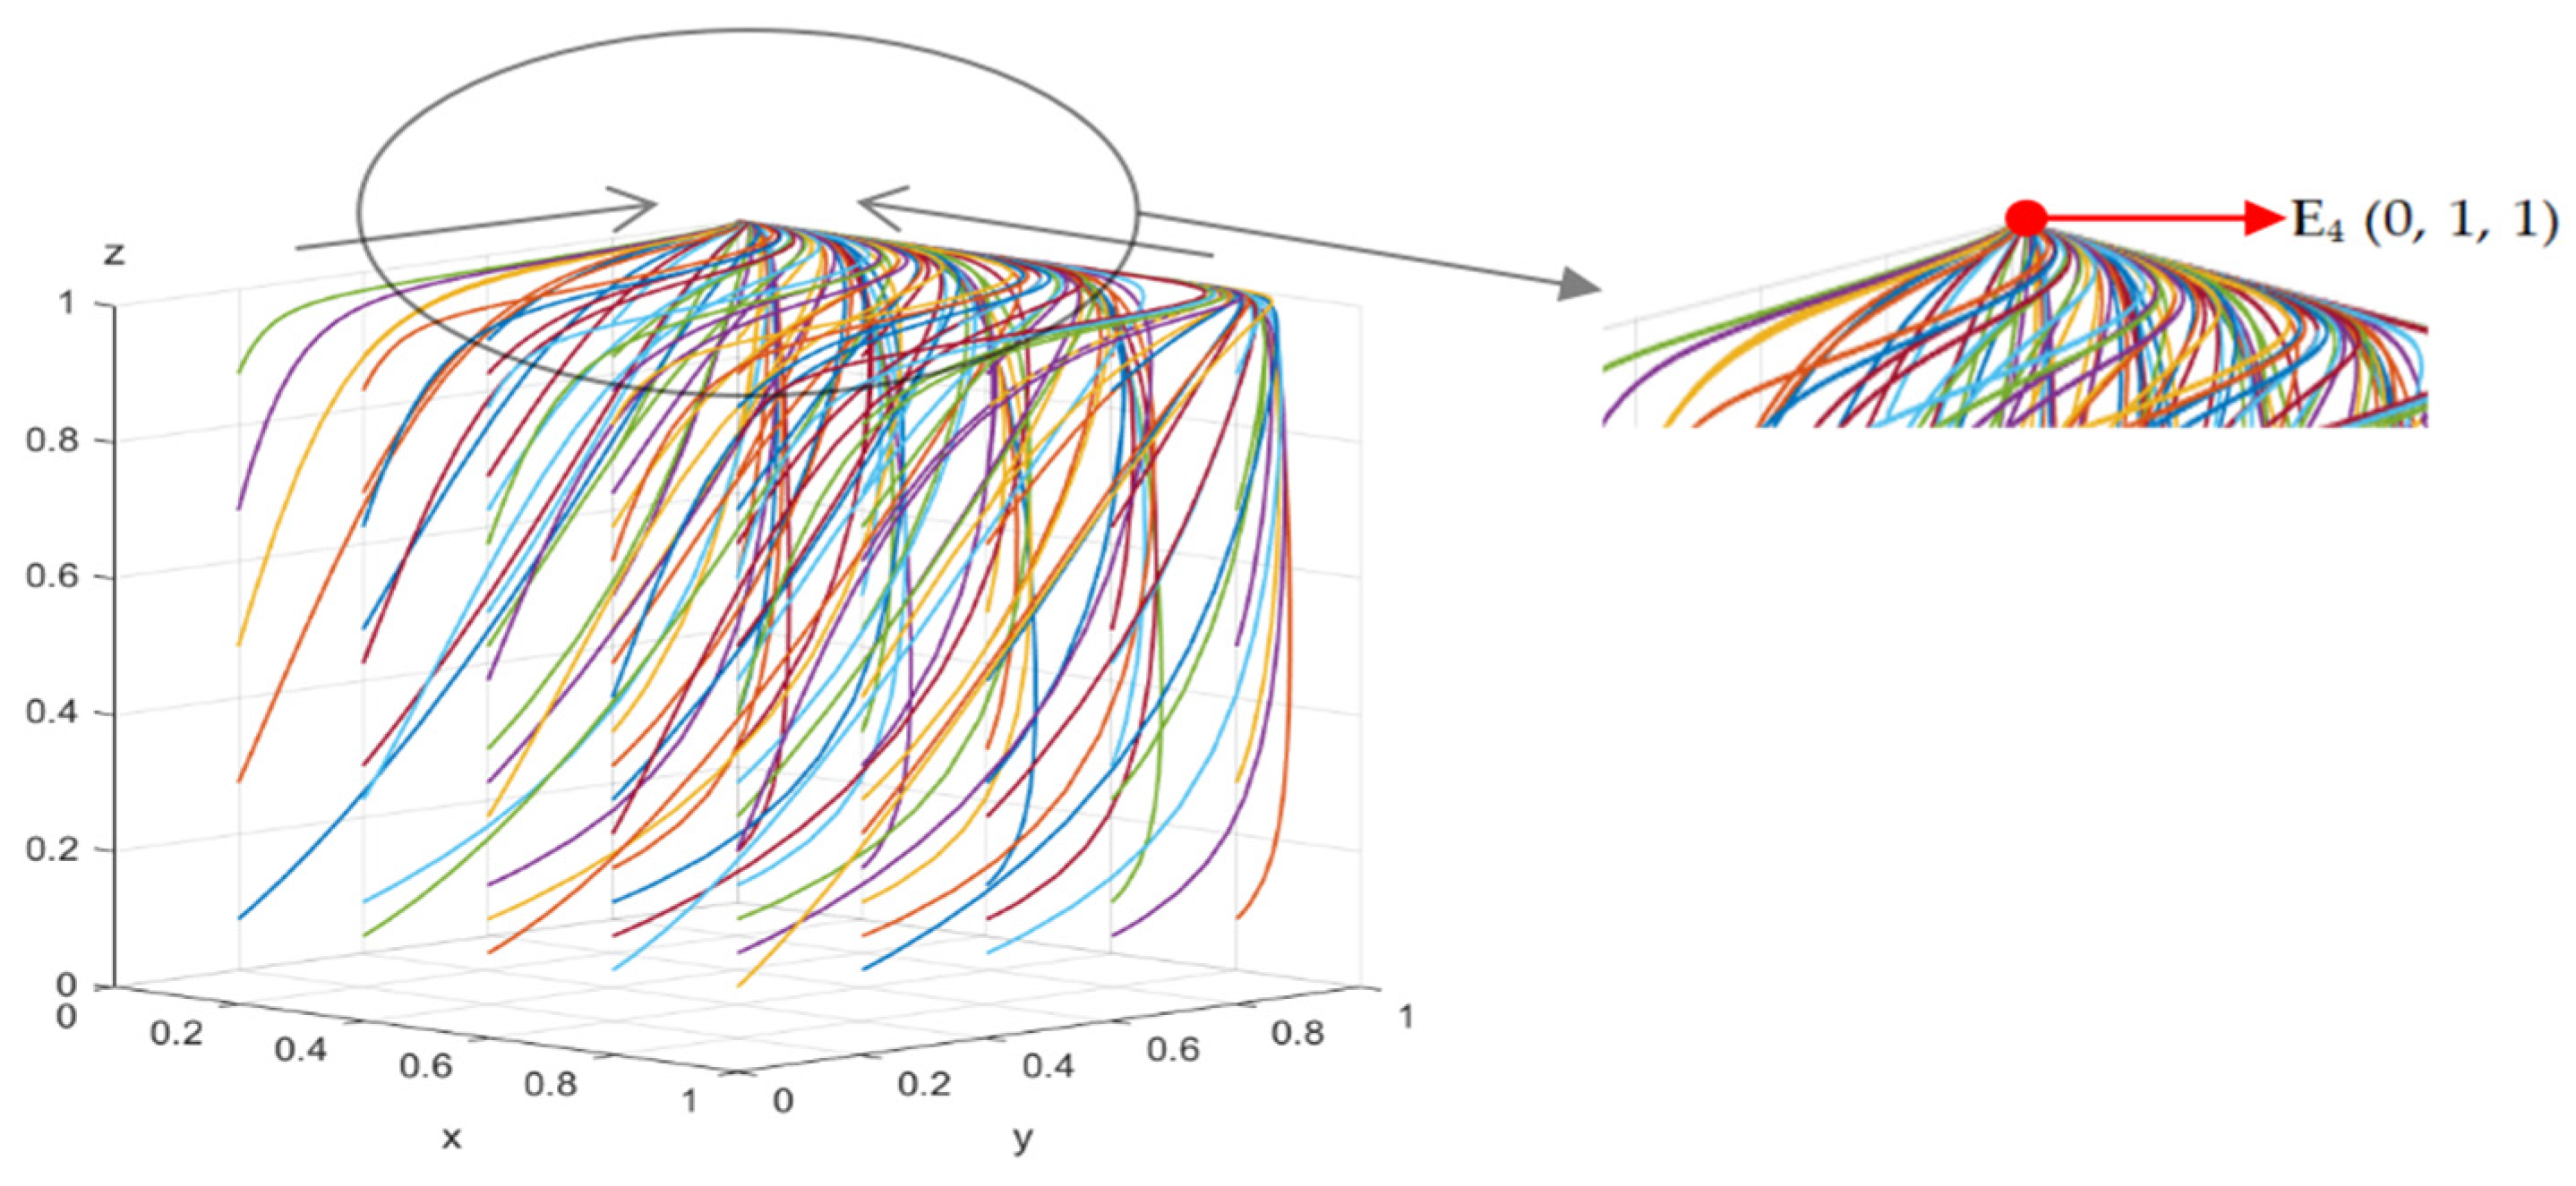
The three-party evolutionary results of the transition stage
The values of the transition stage in Table 4 meet the stability conditions. Using MATLAB2016b to simulate the evolution of 100 groups of strategies, with other parameters held constant, k is taken as 0.1, 0.2, and 0.7. After iteration, the results are obtained as shown in Figure 3. All three strategies converge to the stable equilibrium point E5 (1, 0, 0), which indicates that E5 is the stable equilibrium point in this stage. In the transition stage, the local government shows positive promotion behavior, and the building developers all take the route of developing conventional buildings.
(3)
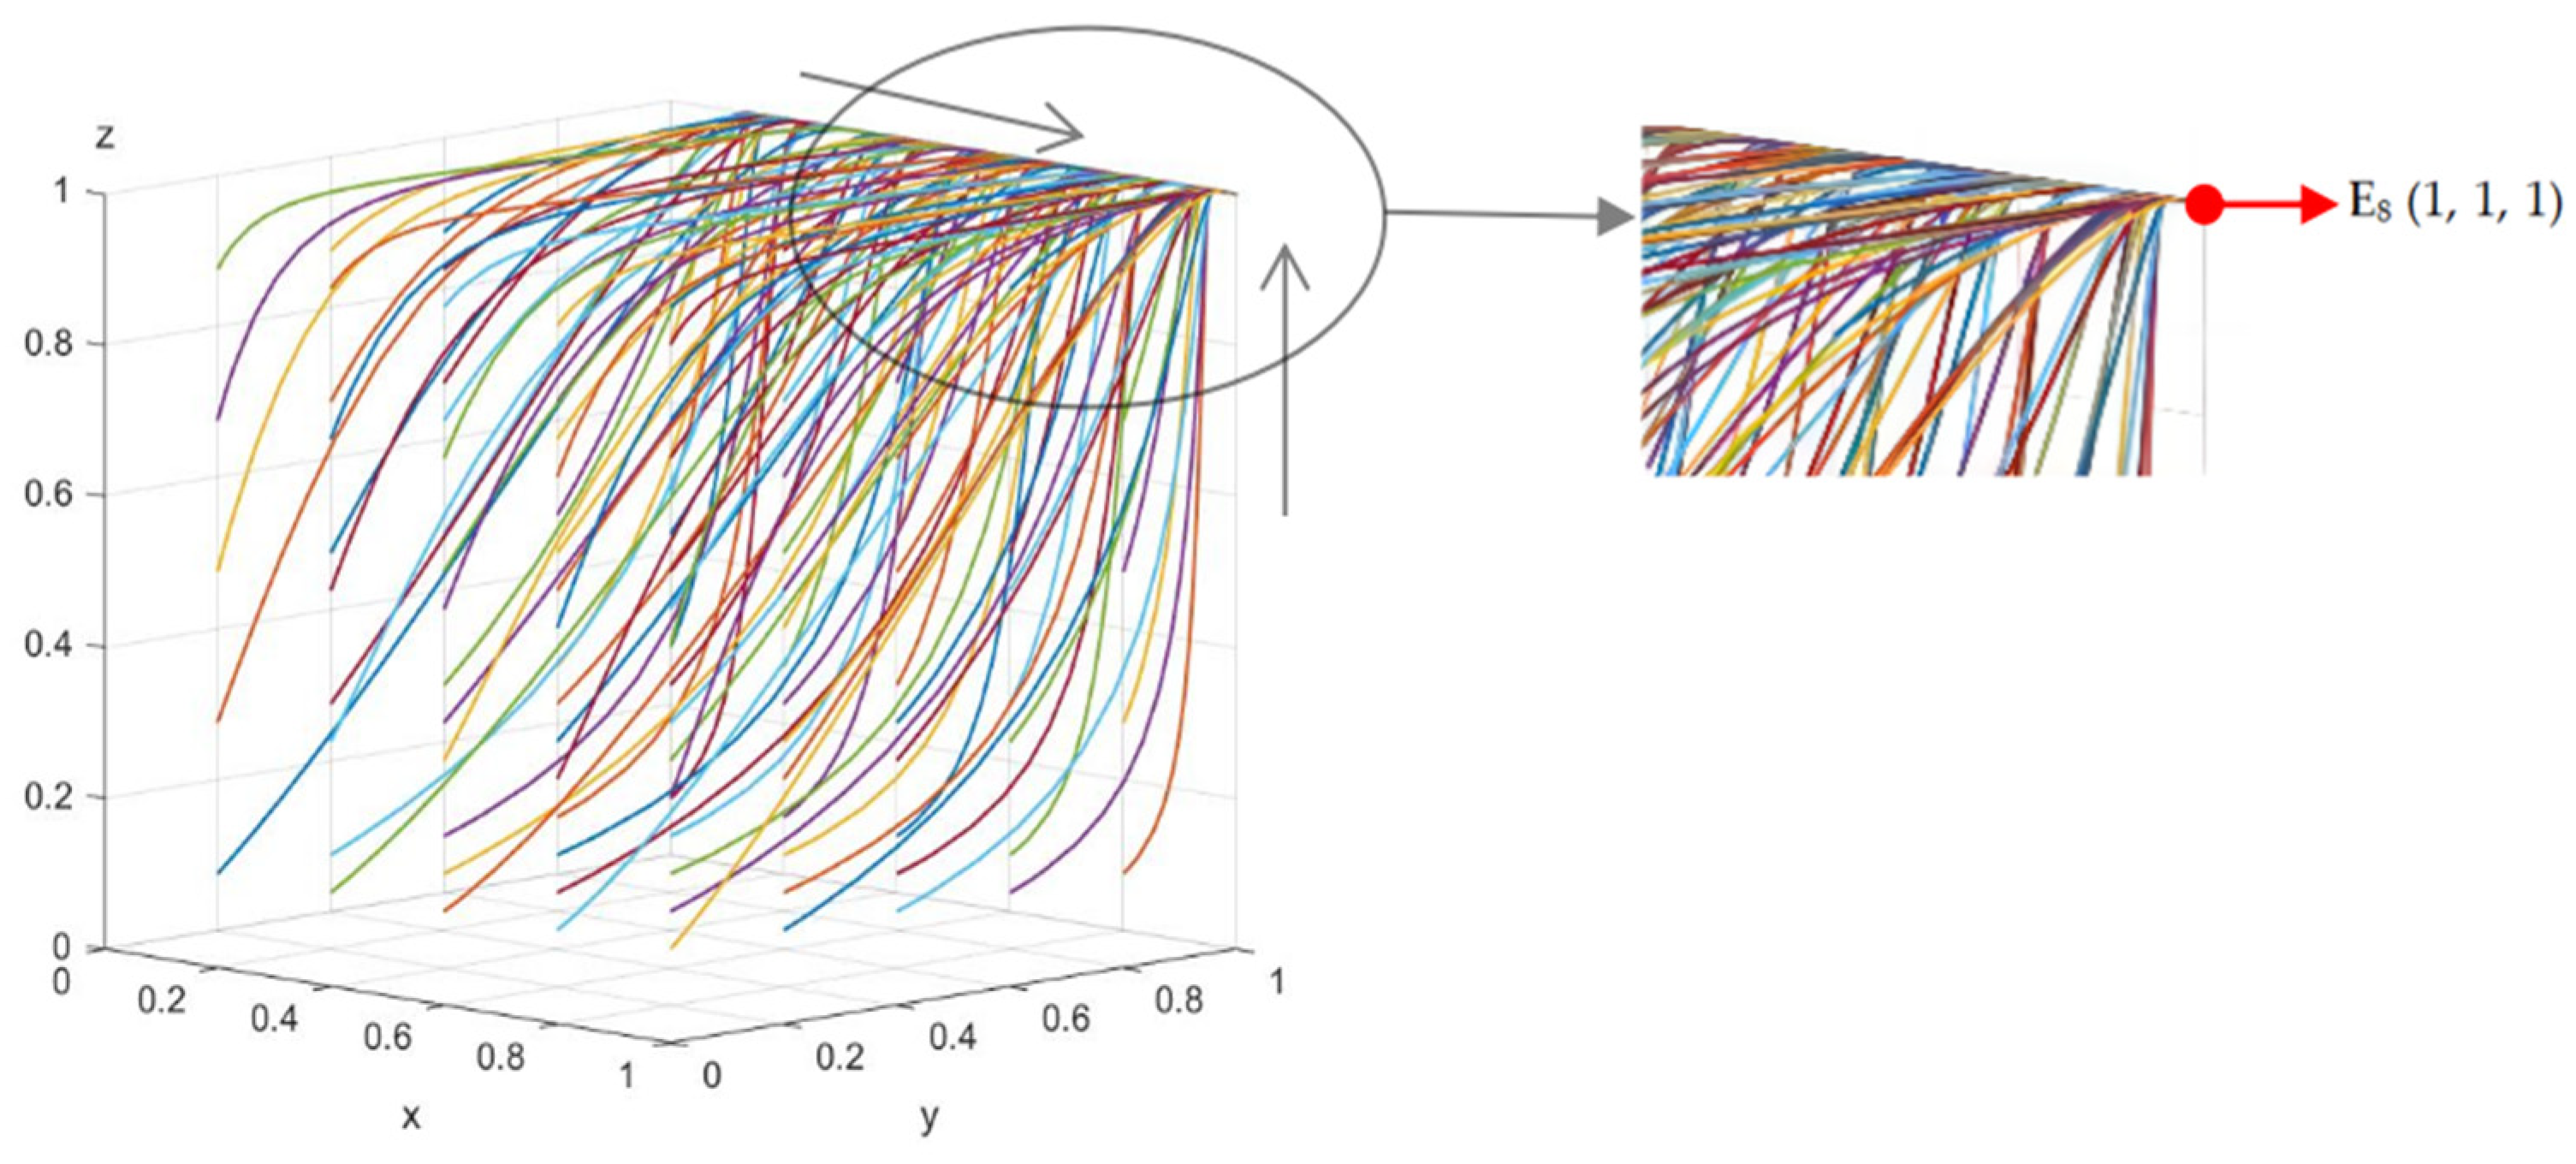
Tripartite evolution results for the growth stage
The values of the growth stage in Table 4 meet the stability conditions. Using MATLAB2016b to simulate the evolution of 100 groups of strategies, with other parameters held constant, k is taken as 0.1, 0.2, and 0.7. After iteration, the results are obtained as shown in Figure 4. All three strategies converge to the stable equilibrium point E4 (0, 1, 1), which indicates that E4 is the stable equilibrium point in this stage. At this stage, the local government adopts a negative promotional behavioral strategy, and the building developers are adopting a collaborative development behavioral strategy for PBs.
(4)
Three-party evolutionary results in the stabilization stage
The values of the growth stage in Table 4 meet the stability conditions. Using MATLAB2016b to simulate the evolution of 100 groups of strategies, with other parameters held constant, k is taken as 0.1, 0.2, and 0.7. After iteration, the results are obtained as shown in Figure 5. All three strategies converge to the stable equilibrium point E8 (1, 1, 1), which indicates that E8 is the stable equilibrium point in this stage. At this stage, the local government adopts a negative promotional behavioral strategy, and building developers are adopting a collaborative development behavioral strategy for PBs.
In order to compare the rate and stability of convergence of the tripartite evolution before and after the introduction of the ETS, the initial behavioral probabilities of the three parties were set to three types for evolutionary simulations (x = y = z = 0.2, x = y = z = 0.5, x = y = z = 0.7). The iteration was carried out using MATLAB2016b. The evolution results are shown in Figure 6, where the y-axis represents the probability of the developer and the policy chosen collaborating in the development of the PB and the probability of actively promoting behavioral strategies. Figure 6 shows that after introducing the ETS, the behavioral strategies between local governments and building developers can be stabilized towards active promotion and collaborative development of PBs. Therefore, introducing an ETS is conducive to the collaborative development of PBs between heterogeneous developers.

5.3. Sensitivity Analysis
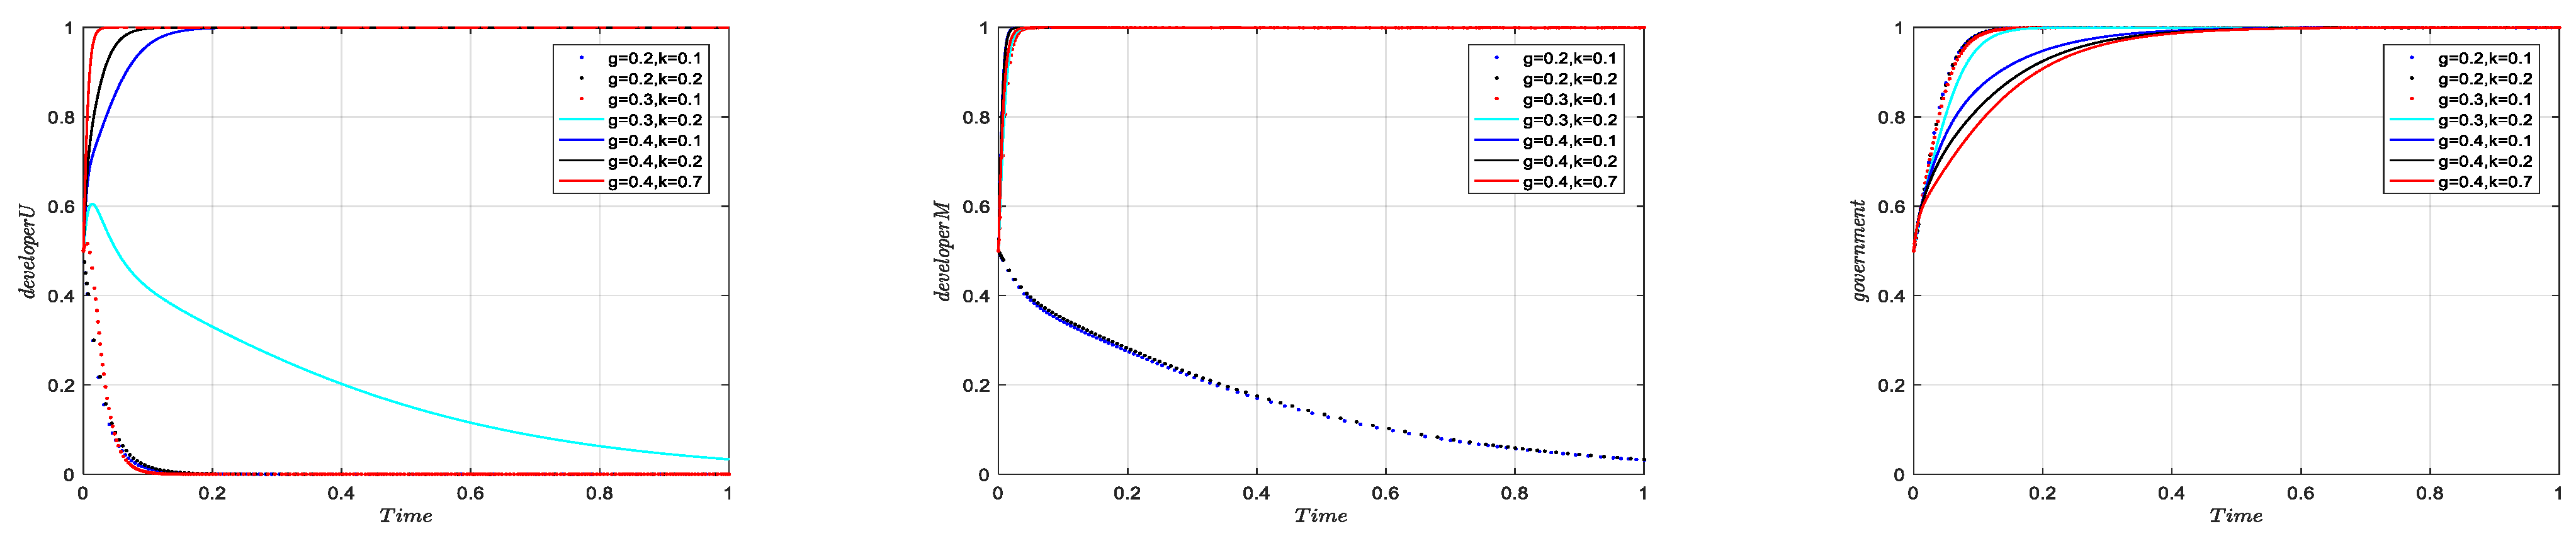
Based on the values of the stabilization stage, an analysis of the impact of critical factors on the three parties involved in the game was carried out, and the results of the analysis are as follows:
(1)
The influence of PB gain
The results of setting B = 2950, 3100, and 3150 are shown in Figure 7. It is known that when B ≥ 3100 RMB/m2, the government is steadily inclined to perform active promotion, and building developers are steadily inclined to develop PBs. At this time, a larger investment proportion of developers tends to stabilize the evolution rate slightly faster.
(2)
Effect of synergy gain
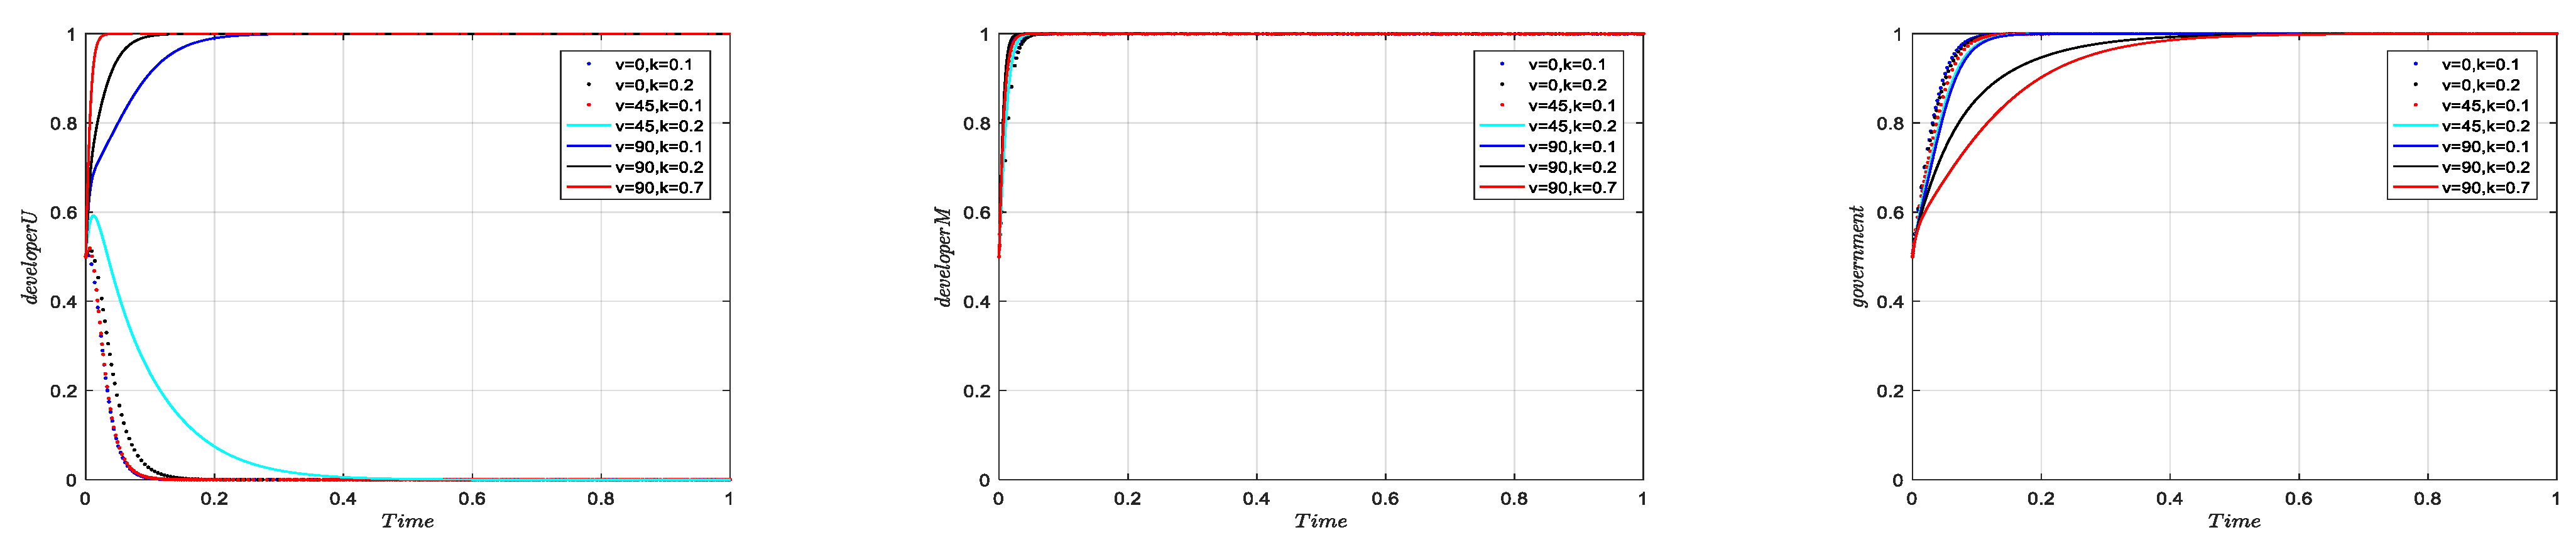
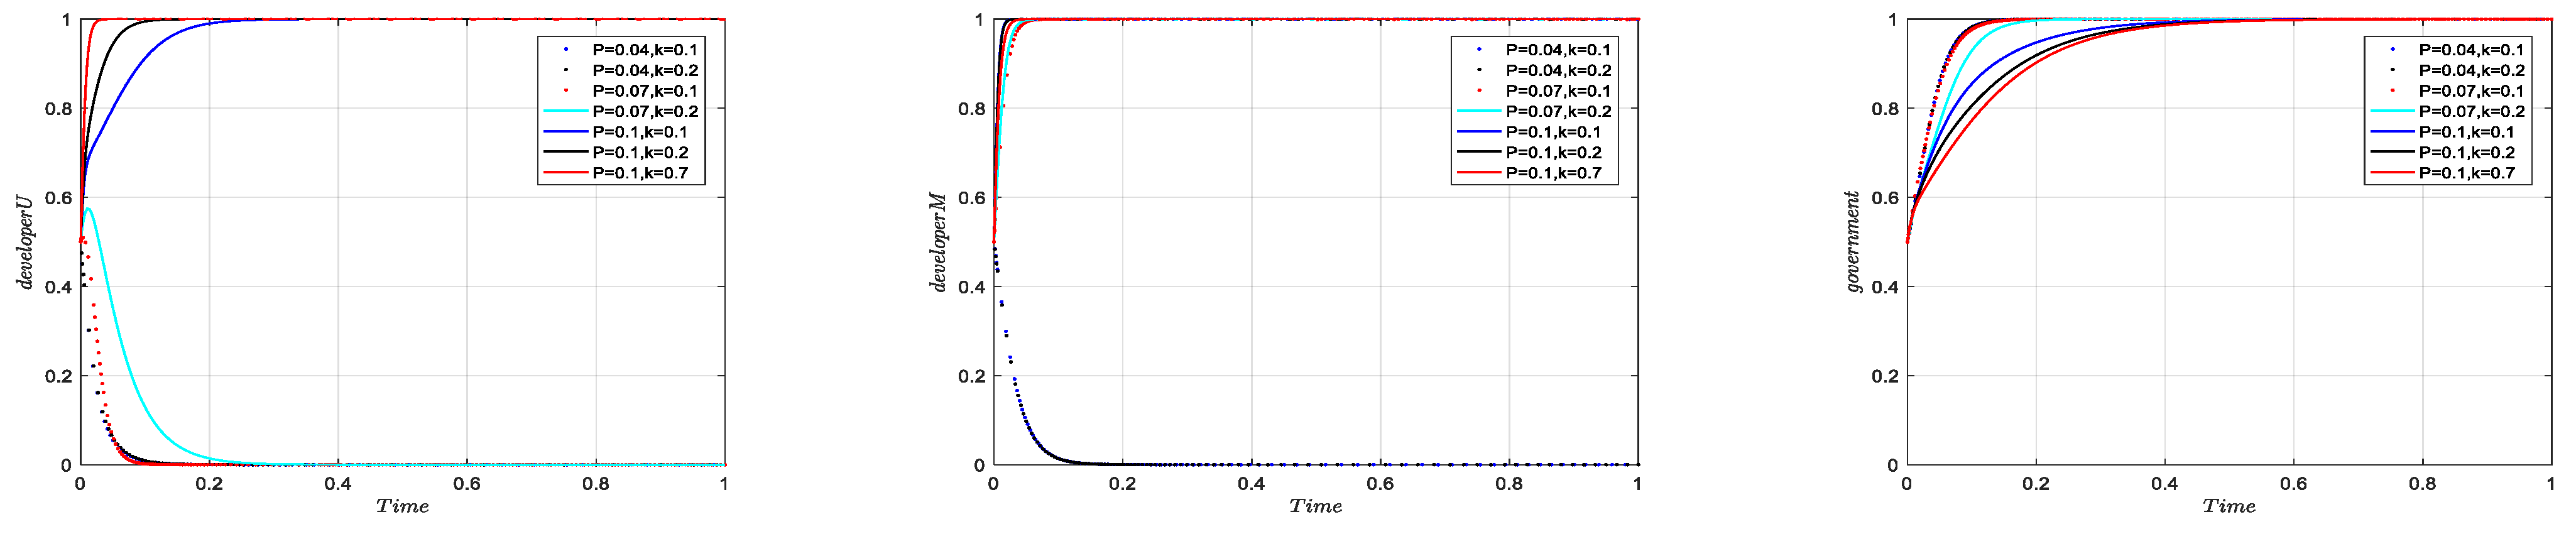
The results of setting synergy gain v = 0, 45, and 90 for evolution are shown in Figure 8. When v is small, the party with a smaller investment proportion will not be steadily inclined to develop PBs because fewer benefits will be gained. A value of v ≥ 90 RMB/m2 only has an effect on the evolution rate of the three parties.
(3)
The effect of carbon tax unit price
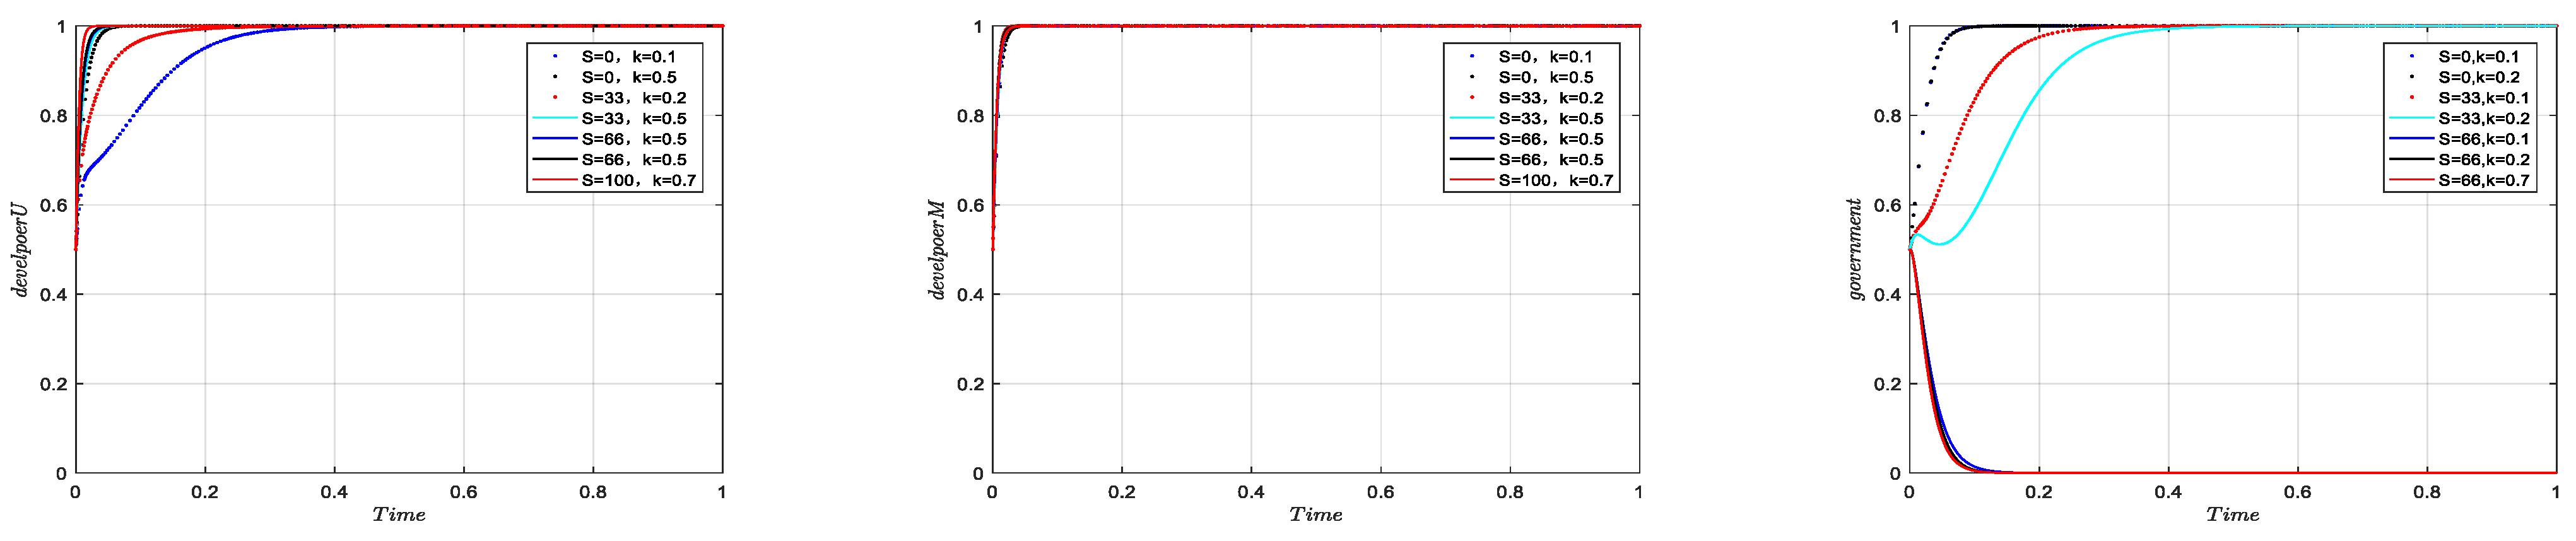
Different carbon tax prices were set in order to study the evolutionary trend between the government and enterprises, as shown in Figure 9. We set p = 0.04, 0.07, and 0.1 (in RMB/kg); when p = 0.1 RMB/kg, or 100 RMB/t, the stability and evolutionary rate of the three parties suggests that this point contributes to the stable convergence of all parties to the point E8.
(4)
Effect of subsidies
We set S = 0, 33, 66, and 100 to study the impact of subsidies on the three parties of the game. Figure 10 shows that that the maturity stage subsidy does not affect the convergence stability of the building developers who have already formed a stable cooperation. However, it significantly affects the government that issues the subsidy when S ≥ 33 RMB/m2, and the government will tend to choose negative promotion due to excessive subsidies.
(5)
The effect of the penalty range
The results of setting g = 0.2, 0.3, and 0.4 are shown in Figure 11. It can be seen that when g is 0.4 and p is 0.1 RMB/kg, the three parties reach an equilibrium point; at this time, the strategies of the three parties are as follows: the government follows an active promotion strategy and the building developers choose to develop PBs in order to achieve synergistic cooperation.
(6)
The effect of liquidated damages
Liquidated damages have the efficacy of guaranteeing the fulfillment of the corresponding responsibility and have the effect of punishing the defaulter and compensating the loss suffered by the party without fault when one party fails to fulfill the contract. The value of k was changed to explore the effect of the relationship between different investment ratios and liquidated damages on the progress of the tripartite evolution, with the results obtained shown in Figure 12. When the liquidated damages Di ≥ 90 RMB/m2, the tripartite evolution of the heterogeneous developers and government could be guaranteed to reach the stable equilibrium point E8.

6. Analysis and Discussion

6.1. Impact Analysis of ETS on Tripartite Strategies

Figure 6 shows that the ETS significantly positively affects the collaborative development of PBs among heterogeneous developers. Meanwhile, from the results of the equilibrium analysis at different stages, it can be seen that at the initial stage of the introduction of the ETS mechanism, the local government tends to choose negative promotion because the benefits of positive promotion are far outweighed by the costs due to the lower carbon tax and penalties, the higher free carbon allowances, and the high subsidies, while the developers, facing fewer regulations and many obstacles to the development of PBs, choose to pay a lower penalty to develop conventional buildings. Secondly, as the local government becomes more aware of the central government’s policy on assembled buildings, it becomes more aware of the need to promote them. Thus, with the central government’s support, it uses the ETS to dynamically adjust carbon trading policies to increase penalties and reduce free carbon allowances, and developers are guided to share the initial costs through collaborative efforts to reduce barriers to development further. Finally, as developers gradually and steadily form market-based synergies to develop PBs, the government can progressively reduce the subsidies it grants, which can significantly alleviate the financial pressure on the central and local governments and shift to negative reinforcement, which also has an incentivizing effect.
From the above analysis, it can be seen that local governments need to use financial subsidies, tax incentives, and penalties to regulate the process of low-carbon transition of enterprises under the premise of valuing the synergistic cooperation of enterprises and the behavioral motivation of local governments [26]. This is due to the need for the government to use policy tools to promote the selection of low-carbon buildings by enterprises and to guide enterprises that have not mastered the mature technology to go through the initial stage of low-carbon transition [18]. Additionally, the effects of subsidies or emissions trading schemes (ETSs) have shown that ETSs perform better for highly heterogeneous firms compared to the previous use of a carbon tax (CT) alone. A carbon tax regulates firms’ profits indirectly by affecting prices, while carbon allowances can achieve direct regulation through emission limits. Therefore, the effect of carbon trading policies that combine the two is more worthy of attention, and only when the price of carbon taxes, penalties, and free allowances continues to decrease will it be possible to provide a stronger incentive for the development of PBs [27].

6.2. Analysis of the Impact of Synergistic Cooperation Mechanisms on Tripartite Strategies

As shown in Figure 12, the synergistic cooperation mechanism is aimed at cooperative heterogeneous developers, and the impact on the government’s behavioral strategy is mainly reflected in the convergence rate. As the government policy guidance to the market continues to mature, the synergistic benefits of cooperative behavior are enhanced, and heterogeneous developers with different low-carbon technologies can gradually converge to stable cooperative cooperation [13,18]. However, after the magnitude of government penalties stabilizes, developers with lower input costs are prone to heterogeneous behaviors. This indicates that enterprises are prone to reduce their willingness to develop through low-cost technologies to meet the policy requirements [29,30]. By setting the cooperation default between stakeholders, mutual supervision between firms can be formed to control the micro-behavior of heterogeneous developers. Therefore, after the government introduces the policy combination tool, it needs to consider the impact of the synergistic cooperation mechanism further.

6.3. Analysis of the Impact of Critical Factors on the Tripartite Strategy

6.3.1. Market Benefits

The above results indicate that developers would steadily choose to develop assembled buildings when the benefits they obtain in the market through carbon emission reduction are satisfactory. Therefore, improving the obtained market benefits can accelerate the development process of assembled buildings, which is also consistent with the results of previous studies [16,17]. At the same time, as more enterprises carry out collaborative development of assembled buildings, it can better encourage stakeholders inside and outside the industry to work together for the development of assembled buildings. More importantly, it can reduce the obstacles to the development of assembled buildings to a certain extent through collaborative cooperation, especially the higher initial development costs. At the same time, it can produce additional synergistic benefits [33,35]. Moreover, enterprises with a more significant investment proportion share more benefits and have a higher willingness to develop PBs [47], so the government can use sufficient market gains to guide developers with more mature technologies to play their role in leading other developers with lower levels of low carbon to increase their investment and develop assembled buildings more proactively.

6.3.2. Government Policy

The government policies in this paper include a combination of critical factors such as the price of a carbon tax, the magnitude of penalties, and ETS carbon allowances. Based on the above sensitivity analysis, developers will tend to develop assembled buildings when these factors reach a particular stage. According to the above sensitivity analysis results, it is known that the implementation of an ETS needs to be led by the government; otherwise, it is difficult to ensure that the developers have enough willingness to develop at the beginning stage. When the carbon tax, ETS, and the magnitude of the penalties and other factors work in synergy, it has the most significant positive effect on developers’ collaboration for the development of PBs [26,27]. Previous studies with similar findings suggest that ETSs also positively promote technological innovation and diffusion [17]. Moreover, the best effect of the government’s policy is when the carbon tax price is 100 RMB/t, and the penalty range reaches 0.4, which is similar to the findings of Du et al. [6]. This is consistent with the results of other scholars but far higher than the average price of a carbon tax in China, indicating that the impact of the current carbon trading policy on the construction industry is still at a low level. Moreover, considering that the carbon emissions of buildings with different assembly rates are different, when the free quota is lower than the carbon emissions of enterprises, the carbon tax price is set at 100 RMB/kg or higher, and the additional penalty margin is 0.4 or higher, which helps to guarantee that heterogeneous developers have enough willingness to collaborate in the development of PBs.

6.3.3. Subsidies

In previous studies, subsidies were found to have the most positive impact on promoting the low-carbon behavior of developers [26]. However, in the above analysis, it can be seen that subsidies have the smallest influence on the convergence stability of developers who choose synergistic development and have a more significant influence on the government’s strategy choice. This outcome indicates that developers can progressively promote synergistic cooperation in developing PBs through the combined influence of carbon taxes, carbon quotas, and a synergy mechanism. This result is noteworthy. When the market for assembled buildings is mature, and factors such as carbon taxes and carbon allowances reach their ideal values, synergistic effects can bring greater profits to developers. Gradually, the market mechanism can replace the incentives of government subsidies, reducing the government’s financial pressure and enhancing its willingness to implement rigorous promotions [48]. Therefore, after the successful implementation of an ETS in the construction industry, the government can consider using the positive impacts of the mature ETS to gradually reduce direct subsidies for enterprises and use higher penalties to maintain the stability of heterogeneous developers’ cooperation in the development of assembled buildings [49].

6.3.4. Liquidated Damages

Costs can be reduced and synergy benefits increased through stable synergistic cooperation, which has a more direct impact on participating heterogeneous developers [13,17,18]. The above analyses show that while the carbon trading policy provides benefits, the synergy mechanism may be more effective in encouraging developers to choose to develop PBs. This is because heterogeneous developers are more likely to choose low-cost, low-emission technologies or engage in free-rider behavior to meet minimum environmental targets in the face of government environmental regulations [19,29,30]. Therefore, developers can reasonably set up default payment agreements to ensure practical synergistic cooperation for more substantial overall benefits and reasonable cost sharing. This fills some gaps in the research on synergistic cooperation between heterogeneous developers. When developers choose the same investment ratio, the size of the liquidated damages and their convergence speed are positively proportional; when they choose different investment ratios, liquidated damages of 90 RMB/m2 or more are significantly more helpful to maintain the convergence stability and accelerate the convergence speed of the government and heterogeneous developers to reach the equilibrium point E5.

6.4. Discuss

The sensitivity analysis proves that the market environment and policy instruments play a crucial role in driving the development of assembled buildings. Analyzing Figure 7, Figure 8, Figure 9, Figure 10 and Figure 11 shows that the positive impact of market factors is more evident than that of policy factors, and the synergistic effect of collaborative development of PBs should be given more attention. This is also consistent with the results of previous studies [9,11], which revealed that the importance of market factors is higher than that of policy factors in developing PBs. However, previous studies have not addressed the impact of the market environment and ETS on PB development, and the simulations in this paper help to fill this gap.
As shown in Figure 6, the higher the initial probability is of developers choosing the behavior of developing PBs, the more favorable it is for developing them. However, the varying maturity of development technologies mastered by different developers in China limits the developers’ willingness to construct PBs, resulting in a preference to develop conventional buildings in some parts of China or even in the same region [50]. As shown in Figure 7 and Figure 8, intra-industry collaboration brings more market profits for heterogeneous developers and favorable conditions for the development of PBs [34,51,52]; in particular, developers with a more significant proportion of investment can obtain more market benefits and have a more vital willingness to develop, and they can drive developers with a lower willingness to invest to collaborate in the development of the building through the reasonable setup of collaborative cooperation mechanisms. At the same time, it is necessary to encourage and guide some developers with lower carbon levels to choose to develop PBs, which is also conducive to further stimulating developers with higher carbon levels to play a leading role in promoting the generation of synergistic benefits in the construction field in China. Additionally, as shown in Figure 12, the set liquidated damages can increase the cost for developers to construct conventional buildings, which, to a certain extent, can effectively guarantee synergistic cooperation to develop PBs. Therefore, introducing an ETS into the field of PBs should be accompanied by a focus on the incentives and constraints brought about by the mechanism of synergistic cooperation between heterogeneous developers.
As shown in Figure 9, Figure 10 and Figure 11, as the carbon tax price increases, developers’ willingness to choose to develop PBs gradually increases, but it is worth mentioning that the degree of influence of subsidies gradually decreases, especially when S ≥ 33 RMB/m2, which makes the positive promotion behavior a disadvantageous strategy in comparison with the negative promotion behavior. This also suggests that as a carbon trading policy based on the carbon price, the carbon tax price in the ETS is the most critical factor influencing the development of PBs. When the carbon tax price is low, the carbon cost is much lower than the development cost of PBs, which is not favorable to the development of PBs; with the upward adjustment of the carbon tax price, the development cost is much lower than the carbon cost within the ETS, and developers will tend to develop PBs. Furthermore, in 2020, China’s carbon price ranged between 7.23 and 102.96 RMB/t, indicating that most regions prioritized conventional buildings as the preferred pricing strategy, with PBs receiving little or no attention. Therefore, in the practice of China’s PB sector, especially in the early stages of development, there is a need for the government to provide policy incentives for developers who adopt the behavior of developing PBs and to use the guiding role of policies to facilitate the creation of market synergies that will lead to the promotion of PBs. On the premise that developers with lower carbon emissions can obtain more market benefits by paying the same cost [6], the government can adjust the carbon tax price within an appropriate range in light of China’s actual situation to encourage more developers with a lower carbon level to actively choose the collaborative and cooperative approach to develop PBs, as well as to lead the market of such developers, to reduce collaborative developers’ excessive investment in PB technology, and avoid penalties arising from their excessive carbon emissions.

7. Summary and Policy Implications

7.1. Summary

As China’s construction sector accounts for a high share of emissions, developing low-carbon emission PBs is crucial. However, it also significantly increases the initial investment costs for developers. Thus, there is an urgent need to seek market-based policy instruments to internalize the environmental benefits that PBs have and their economic advantages for stakeholders. Given the current following of ETSs in the construction industry, they are an effective solution to this problem. Based on this, the current paper first described the possible behavioral decisions among heterogeneous developers under an ETS. On this basis, we established an evolutionary game model to analyze the strategic choices between the government and heterogeneous developers and used numerical analysis to prove the effectiveness of the theory. Through the analysis, it was found that four stability points, E1 (0, 0, 0), E5 (1, 0, 0), E4 (0, 1, 1), and E8 (1, 1, 1), can be achieved by adopting an ETS for assembled building development under the fulfillment of the relevant stability conditions. Analyzed from the perspective of sustainability theory, E8 (1, 1, 1) is a more appropriate choice. At this point, it is shown that the heterogeneous developers all choose to collaborate on the development of PBs in order to share additional synergistic benefits. Moreover, through the simulation of the dynamic evolution process, it can be seen that the overall evolution process of the system has a transition from the initial stage to maturity, and the initial probability of developers choosing to develop PBs impacts the overall evolution process.
In addition, this paper further analyzes the key factors that influence developers to develop PBs. Key factors such as market returns, synergies, and carbon tax prices positively impact the development of PBs. It is worth noting that the liquidated damages set in the cooperation mechanism increase with increasing market interest and can more effectively eliminate the heterogeneous behaviors among heterogeneous developers. This suggests that cooperation has more powerful constraints than incentives in specific scenarios, which have been less involved in previous studies. In addition, the numerical analysis found that policy factors play a guiding role, while market factors have a more apparent positive influence. Moreover, when the carbon tax price exceeds 100 RMB/t, the government can stop the subsidy policy and shift to a stricter supervision policy, thus reducing the financial pressure and promoting the development of PBs by building developers. However, in China’s specific practice, the number of PBs is highly concentrated in coastal cities in the eastern region, which leads to little knowledge of PBs among homebuyers in different regions. Significant differences exist in the development of PBs, which are unfavorable to China’s construction industry’s low-carbon and synergistic development. At the same time, China’s carbon tax price is unstable, and the carbon trading market involves fewer industries. Therefore, it is still necessary for the government to guide the maturation of the carbon trading market, increase the support and proliferation of PB technology, and use market benefits to attract more developers with a lower carbon level in China’s construction industry to take the lead and drive other developers with a higher level of carbon output to form a synergistic cooperation and jointly develop PBs.

7.2. Policy Implications

The following policy recommendations are proposed based on the above research analysis and discussion of the results.
(1)
The government can make use of various official channels to increase the publicity of the theory of sustainable development of buildings, enhance the understanding of the public and other stakeholders in different regions about PBs, and increase the green preference of the society for PBs. It should also focus on the combination of industry, academia, and research to promote the development of digital innovations and low-carbon technologies, to enhance the potential benefits of PBs, and especially to play its role in leading enterprises in the PB industry to encourage more enterprises to participate in the development of PBs.
(2)
The government can gradually guide the carbon trading market that matches the construction industry towards maturity according to the economic development of different types of construction markets in other regions and continuously improve the relevant carbon trading policies and carbon financial mechanisms to promote the complementarity of the ETS and PB markets. Meanwhile, at the initial stage of promoting the carbon trading policy, the government can appropriately issue subsidies to encourage the collaboration of developers. Then, as the policy matures and the co-development of enterprises gradually stabilizes, the subsidies can be gradually stopped to reduce the financial pressure on the government and relevant measures can be taken to adjust and stabilize the price of the carbon tax to maintain the market’s stability.
(3)
The government can introduce applicable legal provisions and specific utility ranges for different stakeholders in different regions or the same region and provide legal protection for the collaborative cooperation of enterprises upstream and downstream of the PB industry chain to promote the proliferation of different types of PB development technologies by using mature collaborative cooperation mechanisms. It can thus increase the number of enterprises mastering skilled technologies and reduce the occurrence of heterogeneous behaviors as well as enhance the interests of enterprises choosing to develop PBs. In addition, for regions that are lagging in development or are in the growth phase of development, feasible carbon finance mechanisms and matching legal mechanisms can be formulated to enhance the vitality of the carbon and construction markets healthily.

8. Limitations and Future Research

There are some limitations in this paper. Firstly, we calculated the data in the numerical analysis by combining government documents and research related to assembled buildings. However, since the data in the government documents and research are actual values, the numerical simulation calculations in this paper have some reference significance. Secondly, scenarios in which the carbon emissions of buildings are lower than the free allowances were not analyzed, so there are some limitations in analyzing the incentivizing effects of policy and market factors. To address this, in future research, with the gradual disclosure of data related to carbon emissions and development costs for more regions and more buildings with different assembled structures in China, consideration can be given to using assembled buildings with various structures in a particular area as a pilot for simulation to provide more accurate values for the carbon emissions trading scheme. In addition, more emerging technologies in the construction field, such as VR, AR, and AV [53], can be utilized to spread construction development technologies in the broader construction market through construction training, to expand the scale of collaborative development participation in the construction market, to formulate ETS policies in a more rational and targeted manner, and to promote the sustainable development of the construction industry.

Author Contributions

Conceptualization, W.C. and Y.S.; methodology, W.C.; software, Y.S.; validation, Y.S.; formal analysis, Y.S.; resources, W.C.; data curation, Y.S.; writing—original draft preparation, Y.S.; writing—review and editing, W.C.; supervision, W.C.; project administration, W.C. All authors have read and agreed to the published version of the manuscript.

Funding

This research received no external funding.

Institutional Review Board Statement

Not applicable.

Informed Consent Statement

Not applicable.

Data Availability Statement

All data that support the findings of this study are available from the corresponding author upon reasonable request.

Conflicts of Interest

The authors declare no conflict of interests.

References

  1. 2023 China Construction Industry PB Development Research Report. Available online: https://show.precast.com.cn/news/show.php?itemid=12431 (accessed on 6 May 2024).
  2. Cai, K.; Wang, H.; Wang, J.; Bai, J.; Zuo, J.; Chan, K.; Lai, K.; Song, Q. Mitigating lifecycle GHG emissions of building sector through prefabricated light-steel buildings in comparison with traditional cast-in-place buildings. Resour. Conserv. Recycl. 2023, 194, 107007. [Google Scholar] [CrossRef]
  3. Zhou, Z.; Syamsunur, D.; Wang, L.; Nugraheni, F. Identification of Impeding Factors in Utilising Prefabrication during Lifecycle of Construction Projects: An Extensive Literature Review. Buildings 2024, 14, 1764. [Google Scholar] [CrossRef]
  4. Chen, G.; Huang, J.; Wang, J.; Wei, J.; Shou, W.; Cao, Z.; Pan, W.; Zhou, J. Optimal procurement strategy for off-site prefabricated components considering construction schedule and cost. Autom. Constr. 2023, 147, 104726. [Google Scholar] [CrossRef]
  5. Aghasizadeh, S.; Tabadkani, A.; Hajirasouli, A.; Banihashemi, S. Environmental and economic performance of prefabricated construction: A review. Environ. Impact Assess. Rev. 2022, 97, 106897. [Google Scholar] [CrossRef]
  6. Du, Q.; Wang, Y.; Pang, Q.; Hao, T.; Zhou, Y. The dynamic analysis on low-carbon building adoption under emission trading scheme. Energy 2023, 263, 125946. [Google Scholar] [CrossRef]
  7. Liu, Y.; Chang, R.-D.; Zuo, J.; Xiong, F.; Dong, N. What leads to the high capital cost of prefabricated construction in China: Perspectives of stakeholders. Eng. Constr. Archit. Manag. 2022, 30, 805–832. [Google Scholar] [CrossRef]
  8. Luo, T.; Tan, Y.; Langston, C.; Xue, X. Mapping the knowledge roadmap of low carbon building: A scientometric analysis. Energy Build. 2019, 194, 163–176. [Google Scholar] [CrossRef]
  9. Zhang, L.; Li, Q.; Zhou, J. Critical factors of low-carbon building development in China’s urban area. J. Clean. Prod. 2017, 142, 3075–3082. [Google Scholar] [CrossRef]
  10. Wang, Y.; Mauree, D.; Sun, Q.; Lin, H.; Scartezzini, J.L.; Wennersten, R. A review of approaches to low-carbon transition of high-rise residential buildings in China. Renew. Sustain. Energy Rev. 2020, 131, 109990. [Google Scholar] [CrossRef]
  11. Du, Q.; Pang, Q.; Bao, T.; Guo, X.; Deng, Y. Critical factors influencing carbon emissions of PB supply chains in China. J. Clean. Prod. 2021, 280, 124398. [Google Scholar] [CrossRef]
  12. Xue, H.; Wu, Z.; Sun, Z.; Jiao, S. Effects of policy on developer’s implementation of off-site construction: The mediating role of the market environment. Energy Policy 2021, 155, 112342. [Google Scholar] [CrossRef]
  13. Yu, Z.; Sun, J. Green Cooperation Strategy of PB Supply Chain Based on Smart Construction Management Platform. Sustainability 2023, 15, 15882. [Google Scholar] [CrossRef]
  14. Wang, T.; Foliente, G.; Song, X.; Xue, J.; Fang, D. Implications and future direction of greenhouse gas emission mitigation policies in the building sector of China. Renew. Sustain. Energy Rev. 2014, 31, 520–530. [Google Scholar] [CrossRef]
  15. Zhang, X.; Xie, J.; Rao, R.; Liang, Y. Policy incentives for the adoption of electric vehicles across countries. Sustainability 2014, 6, 8056–8078. [Google Scholar] [CrossRef]
  16. Jung, H.; Song, C.K. Effects of emission trading scheme (ETS) on change rate of carbon emission. Sci. Rep. 2023, 13, 912. [Google Scholar] [CrossRef] [PubMed]
  17. Chen, Y.; Zhang, D.; Guo, K.; Ji, Q. Emission trading schemes and cross-border mergers and acquisitions. J. Environ. Econ. Manag. 2024, 124, 102949. [Google Scholar] [CrossRef]
  18. Zhu, R.; Wei, Y.; Tan, L. Low-carbon technology adoption and diffusion with heterogeneity in the emissions trading scheme. Appl. Energy 2024, 369, 123537. [Google Scholar] [CrossRef]
  19. He, Q.; Wang, Z.; Wang, G.; Zuo, J.; Wu, G.; Liu, B. To be green or not to be: How environmental regulations shape contractor greenwashing behaviors in construction projects. Sustain. Cities Soc. 2020, 63, 102462. [Google Scholar] [CrossRef]
  20. Wang, G.; Chao, Y.; Cao, Y.; Jiang, T.; Han, W.; Chen, Z. A comprehensive review of research works based on evolutionary game theory for sustainable energy development. Energy Rep. 2022, 8, 114–136. [Google Scholar] [CrossRef]
  21. Pan, X.; Pan, X.; Wu, X.; Jiang, L.; Guo, S.; Feng, X. Research on the heterogeneous impact of carbon emission reduction policy on R&D investment intensity: From the perspective of enterprise’s ownership structure. J. Clean. Prod. 2021, 328, 129532. [Google Scholar] [CrossRef]
  22. Li, J.; Gao, L.; Tu, J. Evolutionary Game Analysis of Governments’ and Enterprises’ Carbon-Emission Reduction. Sustainability 2024, 16, 4216. [Google Scholar] [CrossRef]
  23. Wang, J.; Qin, Y.; Zhou, J. Incentive policies for prefabrication implementation of real estate enterprises: An evolutionary game theory-based analysis. Energy Policy 2021, 156, 112434. [Google Scholar] [CrossRef]
  24. Li, X.-J.; Xie, W.-J.; Xu, L.; Li, L.-L.; Jim, C.Y.; Wei, T.-B. Holistic life-cycle accounting of carbon emissions of PBs using LCA and BIM. Energy Build. 2022, 266, 112136. [Google Scholar] [CrossRef]
  25. Xu, A.; Zhu, Y.; Wang, Z. Carbon emission evaluation of eight different prefabricated components during the materialization stage. J. Build. Eng. 2024, 89, 109262. [Google Scholar] [CrossRef]
  26. He, P.; Zhang, S.; Wang, L.; Ning, J. Will environmental taxes help to mitigate climate change? A comparative study based on OECD countries. Econ. Anal. Policy 2023, 78, 1440–1464. [Google Scholar] [CrossRef]
  27. Du, Q.; Yang, M.; Wang, Y.; Wang, X.; Dong, Y. Dynamic simulation for carbon emission reduction effects of the PB supply chain under environmental policies. Sustain. Cities Soc. 2024, 100, 105027. [Google Scholar] [CrossRef]
  28. Zhang, X.; Yang, Q.; Song, T.; Xu, Y. Collaborative Pricing of Green Supply Chain of Prefabricated Construction. Sustainability 2024, 16, 5579. [Google Scholar] [CrossRef]
  29. Popp, D.; Newell, R.G.; Jaffe, A.B. Energy, the Environment, and Technological Change. In Handbook of the Economics of Innovation; Elsevier B.V.: Amsterdam, The Netherlands, 2010; Volume 2, pp. 873–937. [Google Scholar]
  30. Wei, Y.; Liang, X.; Xu, L.; Kou, G.; Chevallier, J. Trading, storage, or penalty? Uncovering firms’ decision-making behavior in the Shanghai emissions trading scheme: Insights from agent-based modeling. Energy Econ. 2023, 117, 106463. [Google Scholar] [CrossRef]
  31. Zhang, Y.-J.; Wei, Y.-M. An overview of current research on EU ETS: Evidence from its operating mechanism and economic effect. Appl. Energy 2010, 87, 1804–1814. [Google Scholar] [CrossRef]
  32. Liu, J.; Li, J. Economic benefit analysis of the carbon potential of construction waste resource management based on a simulation of carbon trading policy. Environ. Sci. Pollut Res. Int. 2023, 30, 85986–86009. [Google Scholar] [CrossRef]
  33. Du, Q.; Zhu, H.; Huang, Y.; Pang, Q.; Shi, J. Profit allocation of carbon emission reduction in the construction supply chain. Environ. Dev. Sustain. 2024, 26, 20531–20560. [Google Scholar] [CrossRef]
  34. Liu, P.K.; Peng, H.; Wang, Z.W. Orderly-synergistic development of power generation industry: A China’s case study based on evolutionary game model. Energy 2020, 211, 118632. [Google Scholar]
  35. Zhang, M.; Li, H.; Song, Y.; Li, C. Study on the heterogeneous government synergistic governance game of haze in China. J. Environ. Manag. 2019, 248, 109318. [Google Scholar] [CrossRef]
  36. Zhang, Y.J.; Liu, J.Y. Does carbon emissions trading affect the financial performance of high energy-consuming firms in China? Nat. Hazards. 2018, 95, 91–111. [Google Scholar] [CrossRef]
  37. Zhao, S.; Song, Q.; Liu, L.; Li, J.; Zhao, D. Uncovering the lifecycle carbon emissions and its reduction pathways: A case study of petroleum refining enterprise. Energy Convers. Manag. 2024, 301, 118048. [Google Scholar] [CrossRef]
  38. Chang, C.-L.; Mai, T.-K.; McAleer, M. Establishing national carbon emission prices for China. Renew. Sustain. Energy Rev. 2019, 106, 1–16. [Google Scholar] [CrossRef]
  39. Wang, K.; Lu, C. Achievements and Prospects of Carbon Market Construction in China. 2024. Available online: https://ceep.bit.edu.cn//zxcg/ndycbg/8faf214eba0e481aa7af71880c22c7a3.htm (accessed on 7 February 2024).
  40. Implementation Plan for the Setting and Allocation of Total National Carbon Emission Trading Quotas in 2021 and 2022 (Power Generation Industry). Available online: https://www.gov.cn/zhengce/zhengceku/2023-03/16/content_5747106.htm (accessed on 13 March 2023).
  41. Shenzhen 2023 Carbon Emission Quota Allocation Plan. Available online: https://meeb.sz.gov.cn/gkmlpt/content/10/10652/post_10652376.html#3767 (accessed on 6 June 2023).
  42. Liu, D.; Feng, M.; Liu, Y.; Wang, L.; Hu, J.; Wang, G.; Zhang, J. A tripartite evolutionary game study of low-carbon innovation system from the perspective of dynamic subsidies and taxes. J. Environ. Manag. 2024, 356, 120651. [Google Scholar] [CrossRef]
  43. Song, X.; Lu, Y.; Shen, L.; Shi, X. Will China’s building sector participate in emission trading system? Insights from modelling an owner’s optimal carbon reduction strategies. Energy Policy 2018, 118, 232–244. [Google Scholar] [CrossRef]
  44. Interpretation of the Supreme People’s Court on Several Issues Concerning the Application of the General Rules of Contract Compilation in the Civil Code of the People’s Republic of China. Available online: https://www.chinacourt.org/article/detail/2023/12/id/7681709.shtml (accessed on 5 November 2023).
  45. Prefabricated Construction Project Investment Estimation Index. Available online: https://www.gov.cn/zhengce/zhengceku/202308/content_6901196.htm (accessed on 28 July 2023).
  46. China Statistical Yearbook 2023. Available online: https://www.stats.gov.cn/sj/ndsj/2023/indexch.htm (accessed on 12 November 2023).
  47. Zhao, T.; Liu, Z. A novel analysis of carbon capture and storage (CCS) technology adoption: An evolutionary game model between stakeholders. Energy 2019, 189, 116352. [Google Scholar] [CrossRef]
  48. Yuan, M.; Li, Z.; Li, X.; Li, L.; Zhang, S.; Luo, X. How to promote the sustainable development of prefabricated residential buildings in China: A tripartite evolutionary game analysis. J. Clean. Prod. 2022, 349, 131423. [Google Scholar] [CrossRef]
  49. Wu, Z.; He, Q.; Li, J.; Bi, G.; Antwi-Afari, M.F. Public attitudes and sentiments towards new energy vehicles in China: A text mining approach. Renew. Sustain. Energy Rev. 2023, 178, 113242. [Google Scholar] [CrossRef]
  50. Song, Y.; Li, C.; Zhou, L.; Huang, X.; Chen, Y.; Zhang, H. Factors affecting green building development atthemunicipal level: A cross-sectional study in China. Energy Build. 2021, 231, 116352. [Google Scholar] [CrossRef]
  51. Gao, Y.; Tian, X.L. Prefabrication policies and the performance of construction industry in China. J. Clean. Prod. 2022, 253, 120042. [Google Scholar] [CrossRef]
  52. Wang, Q.-C.; Yu, S.-N.; Chen, Z.-X.; Weng, Y.-W.; Xue, J.; Liu, X. Promoting additive construction in fast-developing areas: An analysis of policies and stakeholder perspectives. Dev. Built Environ. 2023, 16, 100271. [Google Scholar] [CrossRef]
  53. Li, S.; Wang, Q.-C.; Wei, H.-H.; Chen, J.-H. Extended Reality (XR) Training in the Construction Industry: A Content Review. Buildings 2024, 14, 414. [Google Scholar] [CrossRef]
Figure 1. The interactions between heterogeneous developers under an ETS.
Sustainability 16 08084 g001
Figure 2. The evolution process of the system in the initial stage.
Sustainability 16 08084 g002
Figure 3. The evolution process of the system in the transition stage.
Sustainability 16 08084 g003
Figure 4. The evolution process of the system in the growth stage.
Sustainability 16 08084 g004
Figure 5. The evolution process of the system in the stabilization stage.
Sustainability 16 08084 g005
Figure 6. Evolutionary convergence before and after the introduction of the ETS.
Sustainability 16 08084 g006
Figure 7. Effect of B on tripartite evolutionary processes.
Sustainability 16 08084 g007
Figure 8. Effect of V on tripartite evolutionary processes.
Sustainability 16 08084 g008
Figure 9. Effect of P on tripartite evolutionary processes.
Sustainability 16 08084 g009
Figure 10. Effect of S on tripartite evolutionary processes.
Sustainability 16 08084 g010
Figure 11. Effect of g on tripartite evolutionary processes.
Sustainability 16 08084 g011
Figure 12. Effect of Di on tripartite evolutionary processes.
Sustainability 16 08084 g012
Table 1. Parameters of the evolutionary game model.
ParametersDescriptions
CgaCosts of positive local government promotion
CgnCost of negative promotion by local government
SSubsidies granted by local government
BgRevenue to the government when developers all choose to proceed with the development of conventional buildings
RIncome or loss on local government performance
gThe magnitude of additional penalties for developers choosing to develop conventional buildings when actively promoted by the local government
LFree carbon credits allocated by local government
LbCarbon emissions from developers choosing to collaborate and cooperate in the development of PBs
PPrice of carbon tax charged to developers by local government
CiThe initial cost to the developer of developing a conventional building
BiInitial revenue to the developer when developing a conventional building
EiEnvironmental benefits to the government when developers collaborate to develop PBs
ΔCiAdditional environmental governance costs to the government when developers develop conventional buildings
kProportion of developer U’s investment in choosing to collaborate in the development of PBs
1 − kProportion of developer M’s investment in choosing to collaborate in the development of PBs
LiCarbon emissions when a developer chooses to develop a conventional building
EAdditional environmental benefits to the government if the developer chooses to collaborate on the development of the PB
CThe incremental cost to the developer in choosing to engage in PB behavior
BIncremental benefits to the developer of choosing to engage in PB behavior
vSynergistic benefits when developers choose to engage in PB behavior
xThe probability that the government chooses to promote the behavioral strategy actively
yThe probability that developer U chooses a collaborative and cooperative development behavioral strategy for PBs
zThe probability that developer M chooses the strategy of collaborative cooperation in developing PB behavior
Table 2. Payoff matrix of the three-party game model.
Local Government (G)Developer (u)Developer (m)
MPS (z)MNS (1 − z)
GA (x)UPS (y) G : C g a + B g + R + E + E u + E m S
U : k C + k B k P ( L b L ) + k ( v + S )
M : 1 k C + ( 1 k ) B ( 1 k ) P ( L b L ) + (1 − k ) ( v + S )
G : C g a + B g + R + E u + g P ( L m L ) C m S
U : C + B P ( L b L ) + v + S + D m
M : C m + B m ( 1 + g ) P ( L m L ) D m
UNS (1 − y) G : C g a + B g + R + E m + g P ( L u L ) C u S
U : C u + B u ( 1 + g ) P ( L u L ) D u
M : C + B P ( L b L ) + v + S + D u
G : C g a + B g + R + g P ( ( L u L ) + ( L m L ) ) C m C u C g
U : C u + B u ( 1 + g ) P u ( L u L )
M : C m + B m ( 1 + g ) P m ( L m L )
GA (1 − x)UPS (y) G : C g n + B g R + E + E u + E m
U : k C + k B + k P ( L u L b ) + k v
M : 1 k C + ( 1 k ) B + ( 1 k ) P ( L m L b ) + (1 − k ) v
G : C g n + B g R + E u C m S
U : C + B + P ( L u L b ) + v + D m
M : C m + B m P ( L m L ) D m
UNS (1 − y) G : C g n + B g R + E m C u
U : C u + B u P ( L u L ) D u
M : C + B + P ( L m L b ) + v + D u
G : C g n + B g R C m C u C g
U : C u + B u P u ( L u L )
M : C m + B m P m ( L m L )
Table 3. Equilibrium points and corresponding eigenvalues.
Equilibrium PointsEigenvalues
λ 1 , λ 2 , λ 3
E 1 (0, 0, 0) P ( L m + L u 2 L ) ) g C g a + C g n + 2 R , P ( L u L b ) + B B u + C u C + D m + v , D u + P ( L m L b ) + B B m + C m C + v
E 2 (0, 0, 1) P ( L u L ) g S C g a + C g n + 2 R , P ( L u L + k ( L L b ) ) + ( B C + v ) k B u + C u + D u , P ( L b L m ) B + B m C m D u + C v
E 3 (0, 1, 0) g P ( L m L ) S C g a + C g n + 2 R , P ( L b L u ) B + B u C u + C D m v , P ( L m L b + k ( L b L ) ) + ( k 1 ) ( C B v ) B m + C m + D m
E 4 (0, 1, 1) 2 R S C g a + C g n , P ( L L u + k ( L b L ) ) + k ( C B v ) + B u D u C u , P ( L b L m + k ( L L b ) ) + ( 1 k ) ( C B v ) + B m D m C m
E 5 (1, 0, 0) ( 2 L L m L u ) P g + C g a C g n 2 R , ( L u L b + g ( L u L ) ) P + B + D m + S C B u + C u + v , ( ( g + 1 ) L m g L L b ) P + B + D u + S C B m + v + C m
E 6 (1, 0, 1) P g ( L u L ) + S + C g a C g n 2 R , ( k ( L L b ) + ( g + 1 ) ( L u L ) ) P + ( B + S C + v ) k B u + D u + C u , C + ( g L ( 1 + g ) L m + L b ) P + B m D u S C m B v
E 7 (1, 1, 0) P ( L L m ) g + S + C g a C g n 2 R ( g ( L u L ) L b + L u ) P + B u D m + C S B C u v , ( ( k 1 ) L b + ( 1 + g ) L m L b ( g + k ) L ) P + ( B C + S + v ) ( 1 k ) + D m B m + C m
E 8 (1, 1, 1) S + C g a C g n 2 R , ( C B S v ) k + ( k ( L b L ) ( L u L ) ( 1 + g ) ) P C u D u + B u , ( B C + S + v ) ( k 1 ) + ( L ( k + g ) + L b ( 1 k ) ( g + 1 ) L m ) P C m D m + B m
Table 4. Parameter values at different stages.
Parameters/StageInitial StageTransformation StageGrowth StageStabilization Stage
B 2900295031003150
v 40409090
B u 3100310031003100
B m 3100310031003100
C 3300320031003000
C u 2989298929892989
C m 2989298929892989
D u 20309090
D m 20309090
L 2224213520501968
L b 2780270026202593
L u 2780278027802780
L m 2780278027802780
C g a 180150120120
C g n 20303030
B g 15151515
R 501005050
S 10060300
P 0.010.040.070.1
g 0.10.20.30.4
E 20202020
E u 50505050
E m 50505050
C g 25252525
C u 60606060
C m 60606060
Disclaimer/Publisher’s Note: The statements, opinions and data contained in all publications are solely those of the individual author(s) and contributor(s) and not of MDPI and/or the editor(s). MDPI and/or the editor(s) disclaim responsibility for any injury to people or property resulting from any ideas, methods, instructions or products referred to in the content.

