Article

Mechanism of Carbon Monoxide (CO) Generation and Potential Human Health Hazard during Mechanized Tunnel Driving in Organic-Rich Rocks: Field and Laboratory Study

1
Institute of Applied Geosciences, Graz University of Technology and NAWI Graz Geocenter, Rechbauerstraße 12, 8010 Graz, Austria
2
Department of Geology, University of Vienna, Althanstraße 14, 1090 Vienna, Austria
3
Institute of Technology and Testing of Building Materials (IMBT-TVFA), Graz University of Technology, Inffeldgasse 24, 8010 Graz, Austria
*
Author to whom correspondence should be addressed.
Sustainability 2024, 16(18), 8107; https://doi.org/10.3390/su16188107
Submission received: 12 August 2024 / Revised: 12 September 2024 / Accepted: 13 September 2024 / Published: 17 September 2024
(This article belongs to the Section Environmental Sustainability and Applications)

Abstract

:
The monitoring of carbon emissions is increasingly becoming a sustainability issue worldwide. Despite being largely unnoticed, the toxic gas carbon monoxide (CO) is ubiquitous in mechanized tunnel driving, but the individual sources, release and enrichment mechanisms are often unknown. In this study, the generation of CO from organic matter containing sedimentary rocks was investigated during mechanized tunnel driving and by reacting claystone and sandstone with 10 mM NaCl solutions for 2 months at 70 °C and 140 °C. The mineralogical and geochemical evolution of the solids and fluids was assessed by CO measurements and the XRD, DTA, TOC, IC and ICP-OES methods. The CO concentration in the atmosphere reached up to 1920 ppm (100 ppm on average) during tunnel driving, which is more than three times higher than the legal daily average dose for tunnellers, thus requiring occupational safety operations. Mineral-specific dissolution processes and the rapid decomposition of labile organic matter upon thermal alteration contributed to the liberation of CO and also carbon dioxide (CO2) from the host rocks. In mechanized tunnel driving, frictional heat and ‘cold’ combustion with temperatures reaching 50–70 °C at the drill head is an important mechanism for increased CO and CO2 generation, especially during drilling in sedimentary rocks containing significant amounts of OM and when the ventilation of the tunnel atmosphere and air mixing are limited. Under such conditions, human health damage due to CO exposure (HHDCO) can be 30 times higher compared to tunnel outlets, where CO is emitted from traffic.

1. Introduction

The global carbon cycle and its most important reservoirs in the atmo-, bio-, cryo-, hydro-, litho- and pedosphere are generally well described, both qualitatively and quantitatively [1,2,3,4,5,6,7,8]. However, anthropogenic carbon emissions are currently increasing, especially since the beginning of industrialization in the 19th century [5]. This trend has led to a change in thinking about the sustainable use of clean energy, traffic and transportation and the modernization of the mining and quarrying industries, among others. Consequently, the reduction of the emissions of potentially hazardous greenhouse gases has been the focus of current research across several fields [7]. For example, the assessment and subsequent reduction of the carbon footprint of various types of human activities is becoming an increasingly significant factor in protecting Earth’s climate. Nevertheless, there are considerable knowledge gaps regarding the generation and accumulation dynamics of the toxic gases carbon monoxide (CO) and carbon dioxide (CO2) in underground construction systems, especially during mechanized tunnel driving through sedimentary formations that contain organic matter [9]. To date, forecasts and potential prevention strategies for geogenic gas development during mechanized tunneling usually refer to the on-site measurement of the CO2, methane (CH4) and hydrogen sulfide (H2S) concentrations in the tunnel atmosphere [10,11]. Significantly enriched CO2 concentrations (up to several vol.%) were also documented in tunnel drainage systems when applying the continuous monitoring of air and water by data loggers. The occurrence of elevated CH4 and CO2 concentrations in deep groundwater or drainage water was also related to increased bacterial activity and subsequent biomass degradation based on case-specific elemental and redox cycles and chemoautotrophic metabolism [3,10]. If on-site measurements of these gases reveal no health risks, no further protection and sustainability strategies are realized with regard to potential CO and CO2 evolution, eventually causing a health risk to tunnellers at active underground tunneling sites.
Thus far, only a few tunneling projects have documented the significant accumulation of CH4 and CO during underground tunneling works (denoting an example of inside air pollution), such as in the Kaiser Wilhelm Tunnel (Germany), but the reasons for the release and enrichment of these toxic gases were not pursued further [12]. Recently, CO concentrations of >1000 ppm in the air have been calculated to occur for a few minutes during drill-and-blast excavations [13], but the results were based on numerical modeling, without direct measurements of the CO concentration in the air. The monitoring of the CO concentrations inside and outside road tunnels in Guanajuato City (Mexico) yielded ~50 ppm of CO on average during a 30 min exposure period, leading to the recommendation of ventilation systems in these passageways [14]. Similar conclusions have been drawn by Liu et al. [15] and Yang et al. [16], who demonstrated that CO emissions in the atmosphere in road tunnels (<~40 ppm) were linked mainly to anthropogenic transportation activities (denoting an example of outside air pollution). However, to the best of our knowledge, no study yet exists in which the CO concentrations in the tunnel atmosphere have been systematically monitored during active mechanized tunnel driving.
Indoor air pollution by dangerous chemicals, gases and other (in)organic substances is becoming an increasing health and sustainability issue worldwide [17,18,19,20]. Importantly, if adequate ventilation systems are absent or air mixing is temporarily limited, such as is the case in many tunnels under construction and in inspection tunnels, indoor air pollution can be up to 10 times worse than outside air pollution, which is caused by, e.g., traffic, transportation, construction, agriculture and industry [21]. Such activities can release hazardous pollutants, such as polycyclic aromatic hydrocarbons, volatile (in)organic compounds, black carbon, sulfur and nitrous oxides, as well as CO and CO2, to the environment [22,23,24]. With regard to the CO and CO2 systematics often met in (semi-)closed settings, such as in underground construction sites, the incomplete combustion of fossil fuels or biomass by operating tunneling machines with combustion engines and, more rarely, during tunnel fires are the main reasons for CO and CO2 emissions [25,26,27,28]. These can cause negative effects on the human cardiovascular and neurobehavioral systems at low concentrations and may lead to unconsciousness or even death at high concentrations [29].
The typical CO2 concentration in today’s air is ~400 ppm, but temporal exposure to >3000 ppm CO2 can lead to, e.g., headaches and tiredness and reduce the ability to concentrate. The specific reaction, however, is strongly individual. For comparison, clean air frequently contains less than 10 ppm of the colorless, non-irritant, odorless and tasteless toxic gas CO [17], but the negative impact on human health is significantly increased if the CO concentration in the air exceeds only 60 ppm, which marks the short-term average value for 15 min exposure to CO in Austria, according to the Austrian limit value ordinance [30]. The latter value is permitted four times during an individual work shift. In severe cases, CO inhalation can result in arterial hypoxemia, because gaseous CO rapidly dissolves in the blood and subsequently competes equivocally with oxygen (O2) for hemoglobin-binding sites [17,31]. While the nature of the major indoor air pollutants, their dominant emission sources, the magnitude and mechanisms of toxicity and the health impacts to human bodies are generally well known [21], both the causes and consequences of geogenic gas emissions during mechanized tunnel driving have been poorly investigated.
In this combined field and experimental study, the principal release mechanisms of carbon in organic-rich sedimentary rocks and the subsequent enrichment of its gaseous and oxidized forms, i.e., CO and CO2, in the tunnel atmosphere were investigated for the first time through (i) on-site measurements of CO enrichment in an Austrian tunnel during active mechanized tunnel driving and (ii) experimental laboratory testing of CO and CO2 liberation from organic matter containing sedimentary rocks (claystone and sandstone) through which the tunnel boring machine (TBM) was cross-cutting. The potential reasons for the documented temporarily highly increased concentrations of CO in the excavation chamber and the surrounding areas of the TBM are discussed in this paper.

2. Materials, Experimental Set-Up and Methods

2.1. Materials

Two types of organic-rich sedimentary rock samples, namely claystone and sandstone, were collected from the tunnel site under construction and experimentally investigated with regard to their thermal stability and their potential to release CO during the thermal decay of particulate organics or organic inclusions. The materials cover a broad spectrum in terms of the sedimentary depositional environment, mineralogy and total organic carbon (TOC) content. In addition, quartz sand (≥98.5 wt.% SiO2; CELPURE(R) P100, from Riedel-de Haen AG, Charlotte, NC, USA) and anhydrous D(+)-glucose (≥99.5 wt.% C6H12O6; from Carl Roth GmbH + Co. KG, Karlsruhe, Germany) standards were used as reference materials to ensure direct comparison with the CO liberation dynamics of approximately organic-free and organic-rich materials, respectively.
The experimental solutions were prepared from the dissolution of adequate amounts of sodium chloride (≥99 wt.% NaCl; Carl Roth GmbH + Co. KG, Karlsruhe, Germany) in ultrapure water (Milli-Q Plus UV, 18.2 MΩ at 25 °C) [32].

2.2. Experimental Set-Up

Batch alteration experiments were carried out in Teflon-lined steel reactors to determine the thermal stability of different types of organic-containing samples. For this purpose, 20 g of each of the samples was finely ground in a micronizing mill (XRD mill; from The McCrone Group Inc., Westmont, IL, USA). Subsequently, 2.5 g of powdered material was mixed with 25 mL of a 10 mM NaCl solution (as a background electrolyte) at pH 7 ± 0.03 and 23 ± 2 °C. This experimental solution represents ‘natural’, moderately mineralized meteoric water, i.e., analogous to the mountain waters found at many Austrian (~near-surface) underground sites [33,34,35,36]. The hydrothermal reactors were sealed and placed in laboratory ovens at two different temperature levels (70 °C and 140 °C, ±5 °C each) over a period of 2 months [32]. The experiments run at 70 °C corresponded to the highest temperature measured at the drill head during mechanized tunnel driving, whereas the experiments run at 140 °C were intended to accelerate the conversion rates of the organic-containing samples to within the ‘crude oil/natural gas window’ [37,38,39]. At the end of the experiments, the reactors were cooled down, and, subsequently, the altered samples were filtered through a suction filtration unit using 0.45 µm cellulose acetate filters (Sartorius AG, Göttingen, Germany) to separate the reacted solid and fluid phases [32]. The solids remaining on the filters were dried at 40 °C in a drying oven until weight consistency was reached (~2–3 days). The dried material was stored under an argon atmosphere for subsequent mineralogical and geochemical analysis. Aliquots of the filtered fluids were either acidified with ultrapure nitric acid (69% HNO3; ROTIPURAN®, Carl Roth GmbH + Co. KG, Karlsruhe, Germany) to a 2% HNO3 matrix or diluted with ultrapure water for geochemical composition analysis.
All alteration experiments were run in duplicate and the collected fluid samples were analyzed in triplicate. Data reproducibility and accuracy were verified by standard mathematical procedures, i.e., averages and standard deviations of concentration data were calculated for each experiment [22,40], yielding ≤ 5% deviation among all experimental sets. In the following, only the average values are reported.

2.3. Analytical Methods

2.3.1. Solid-Phase Characterization

The mineralogical composition of all unreacted and reacted samples was determined by powder X-ray diffraction (P-XRD) using a PANalytical X’Pert Pro device (Malvern Panalytical, Almelo, The Netherlands) operated at 40 kV and 40 mA (Co-Kα; λ = 1.79 nm) and outfitted with a sample changer, spinner stage, 0.5° antiscattering slit, 1° divergence slit, primary and secondary Soller and high-speed Scientific X’Celerator detector. The specimens were prepared using the top loading technique and examined in the 4–65° 2θ range using a step size of 0.02° 2θ and 10 s count time per step. The P-XRD patterns were then processed using Rietveld refinement with the PANanalytical X’Pert Highscore Plus software package (version 3.0.5) and its implemented PDF-4 database [36,41]. The analytical uncertainty was ≤5 wt.% [32].
Fourier transform infrared (FTIR) spectroscopy analyses of all samples were carried out using the attenuated total reflectance (ATR) mode of a Frontier FTIR (PerkinElmer, Waltham, MA, USA). Mid-infrared (MIR) spectra were acquired in the 4000–650 cm–1 range at a spectral resolution of ≤2 cm–1 [42]. FTIR data processing was realized via the Spekwin32 software (version 1.71.6.1).
The elemental composition of all samples was analyzed with a PANalytical PW2404 (Malvern Panalytical, Almelo, The Netherlands) wavelength-dispersive X-ray fluorescence (XRF) spectrometer. Glass tablets were prepared in a PANalytical Perl’X 3 bead preparation system via the fusion of 0.5 g pre-dried material (at 40 °C) with 6.0 g lithium tetraborate (99% Li2B4O7; Thermo Fisher Scientific, Waltham, MA, USA) at around 1200 °C. The loss on ignition (LOI) was obtained through the gravimetric analysis of the sample residues (at 1050 °C). The analytical uncertainty was ≤0.5 wt.% for the major elements [43].
The TOC content was analyzed by the catalytical combustion of the powdered samples and the subsequent measurement of the liberated CO2 concentration by a non-dispersive IR detector using a TOC-VcPH + ASI-V Analyser (Shimadzu, Kyoto, Japan). The analytical error and the detection limit were ≤5% and ~0.01 wt.% TOC, respectively [44].
The thermal stability of the organic-containing samples was investigated using combined thermogravimetry (TG), differential scanning calorimetry (DSC) and IR spectroscopy, performed on a Simultaneous Thermal Analyzer (STA 8000; PerkinElmer, Waltham, MA, USA) connected to a Frontier FTIR. About 30–100 mg of the sample (depending on the TOC content) was heated from 25 °C to 1000 °C at a constant heating rate of 10 °C/min under a nitrogen flow (20–30 mL/min) [42].

2.3.2. Fluid-Phase Characterization

The temperature, electric conductivity (EC) and pH of the experimental solution before and after reaction with the organic-containing samples were measured with WTW LF/pH 330i multi-meters connected to TetraCon 325 and SenTix41 probes. The pH electrode was calibrated against NIST buffer standard solutions (National Institute of Standards and Technology, Gaithersburg, MD, USA) at pH 4.01, 7.00 and 10.01 at 25 °C at the analytical precision of ≤0.03 pH units [33]. The carbonate alkalinity (expressed as HCO3) was measured by automatic titration with a 0.02 M HCl solution using a Schott TA20plus titrator (Schott AG, Jena, Germany) at the analytical uncertainty of <3% [33].
About 5 mL of the filtered and diluted experimental solutions was subjected to ion chromatography (IC) analysis using a Dionex IC-S 3000 device (Thermo Fisher Scientific, Waltham, MA, USA) equipped with IonPac, AS19 and CS16 columns to obtain the chemical composition of the major cations and anions in the reacted fluids. The analytical uncertainty of the IC measurements was ±3% [45].
The minor and trace elemental composition of the reacted fluids was analyzed by an Optima 8300 DV (PerkinElmer, Waltham, MA, USA) inductively coupled plasma optical emission spectrometer (ICP-OES) on acidified sample aliquots. NIST 1640a, in-house and SPS-SW2 Batch 130 standards were analyzed within repeated sample sequences and the analytical uncertainty determined as ±3% [46].
The ion charge balance (ICB), ionic strength, activities, aqueous speciation and mineral saturation indices (SI) of relevant phases were calculated using the PHREEQC computer code (version 2.18) [47] together with its Lawrence Livermore National Laboratory (LLNL) database [48] at the experimental pH and temperature. The SI is defined as the ion activity product in relation to a solubility product on a logarithmic scale, i.e., SI = log[IAP/Ksp], whereby SI = 0 means saturation, SI > 0 indicates oversaturation and SI < 0 implies the undersaturation of a mineral phase with respect to a fluid phase [36].

3. Results

3.1. Field Study: Geology, Mechanized Tunnel Driving and CO Concentration in the Air

3.1.1. Geological Background

Austria’s longest railway tunnel (~32.8 km length) is currently under construction and will connect the cities of Graz (Styria) and Klagenfurt (Carinthia) (Figure 1a) [49,50]. The tunnel traverses the Koralpe mountain range through a variety of the Middle Austro Alpine crystalline (Paleozoic-aged gneisses, mica schists, amphibolites and marbles) and Neogene sedimentary rocks (mostly claystone, sandstone and gravel) (Figure 1b,c) [33]. The sedimentary and crystalline rock units are separated by two major fault zones and several minor fault systems (Figure 1c). The older crystalline rock units do not pose a significant health risk due to CO release and accumulation in the tunnel atmosphere (i.e., most CO values were <30 ppm, even though some graphite-containing sections yielded CO concentrations up to 190 ppm). This is because these igneous and typically highly metamorphosed units (up to eclogitic facies) do not contain significant organic matter (OM) content (apart from some graphite layers being documented) that could be altered into gaseous CO. In contrast, elevated concentrations of CO and CO2 in the tunnel atmosphere have been detected during mechanized tunneling in the partially organic-rich sedimentary rock units of the Neogene, which are described below (Figure 1b,c).
The Neogene units comprise low to slightly consolidated and fragile claystone–siltstone–sandstone–conglomerate alternations, as well as well-bedded sand and well-graded gravel beds that generally have low grain cohesion [51]. All Neogene units have varying proportions of OM. Occasionally, pieces of charcoal, greyish black organic-rich layers (e.g., lignite), bituminous inclusions (but without graphite) and fossil remnants can be found. The dark color and the bituminous smell (when struck with a hammer) of the sedimentary units (Figure 1c) suggest moderate to high total organic carbon (TOC) content. Representative samples of the OM-bearing rocks (claystone and sandstone) were taken on-site and subsequently stored in glass vessels under an argon atmosphere for further laboratory testing. The locally high OM content and the presence of water-bearing beds, in combination with the abundant fault zones and fractures near and within the Neogene units, often cause the destabilization of the working face during mechanized tunneling, which requires specific safety measures [49].

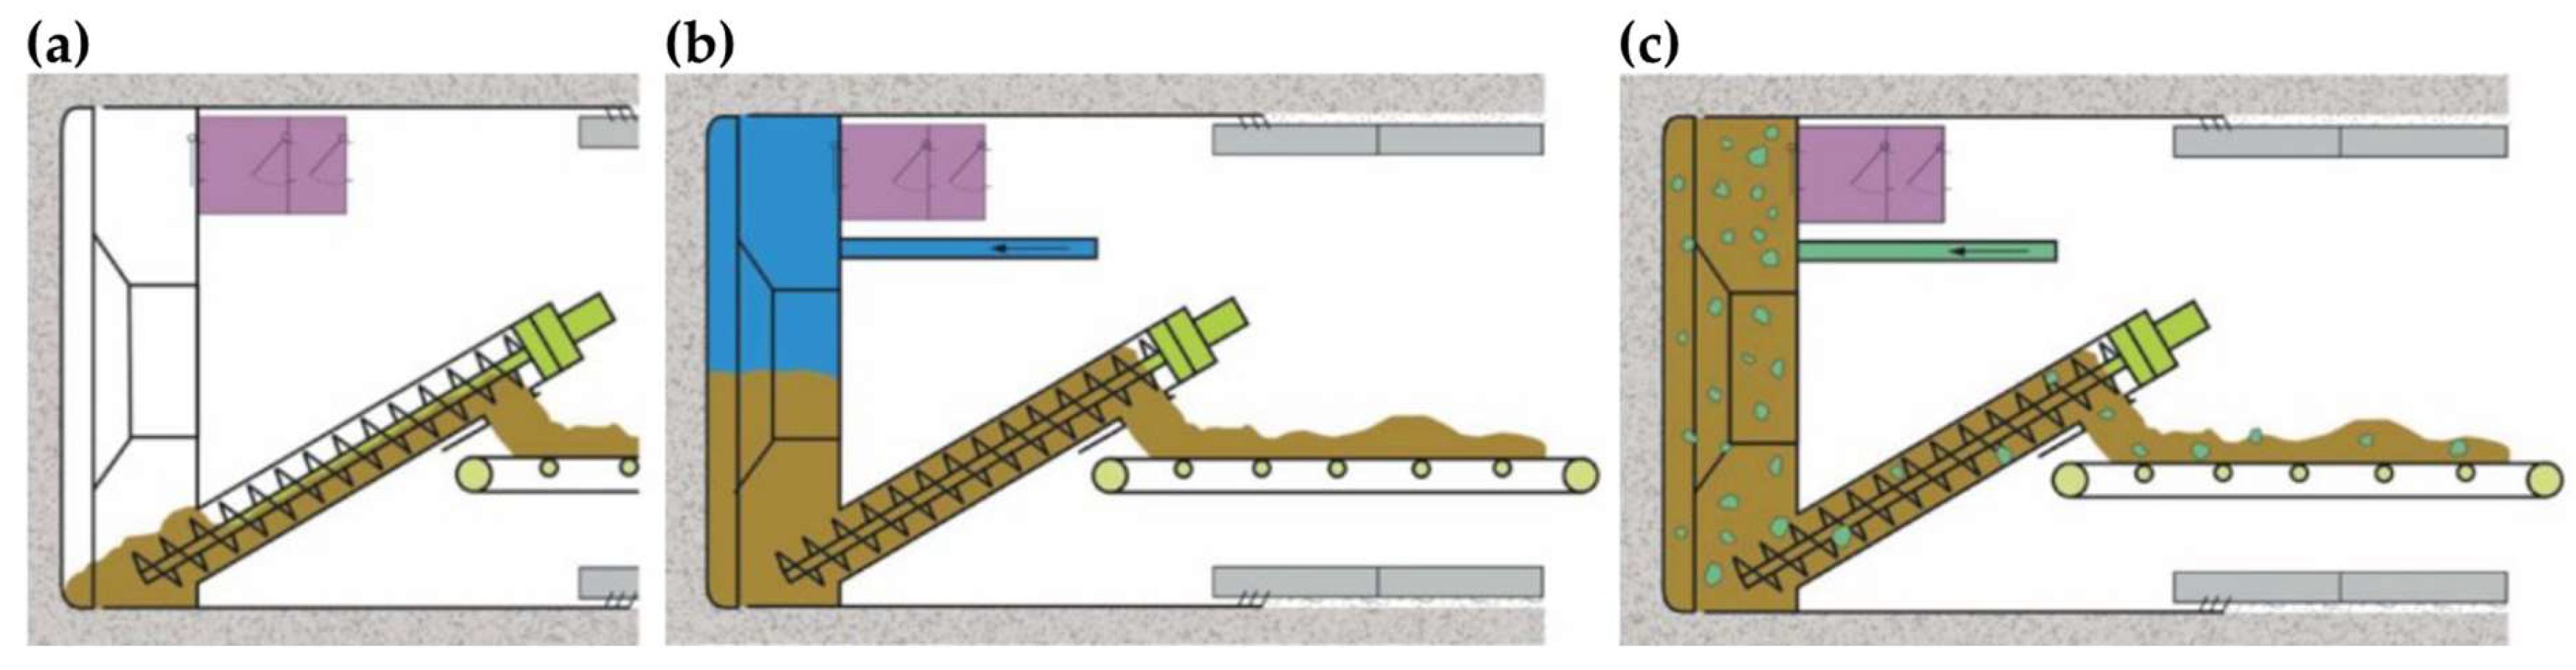
3.1.2. Mechanized Tunnel Driving

In the present tunnel project, a shield-based TBM with earth pressure support (EPS) was used to counteract the challenging geological conditions [52] occurring within the Neogene sedimentary units, such as rock instability and recurring water inflow [50]. The flexible tunneling methods provided by this TBM were suitable to adapt to the locally changing underground conditions and to ensure safe and sustainable operation. Three excavation modes can be generally distinguished (Figure 2a–c).
  • The ‘open mode’ is used in the case of a rock with a mechanically stable working face and hence does not require the active support of the working face (Figure 2a).
  • In the ‘semi-open mode’, the additional support of the working face is provided by the supply of excavated material, such as conditioned earth slurry or rock material, as well as compressed air to hold back water ingress from the surrounding host rocks (Figure 2b).
  • The ‘closed mode’ is used when the working face is not stable or unclear geological conditions exist (e.g., presence of fault zones). In this case, the excavation chamber is completely filled with a mix of earth and slurry, which acts as working face support and ensures a closed environment during the tunneling process (Figure 2c).
Routinely, maintenance works have to be carried out on the TBM, which include the inspection and the timewise replacement of the main tunneling tools, the drill head and the rock cuttings (for the purpose of geological documentation). These can be performed under ‘normal’ atmospheric conditions prevailing in the tunnel if the working face is stable. During atmospheric entry, all hatches to the extraction chamber are opened so that sufficient air ventilation is ensured and subsequently CO concentrations below the limit values can be achieved. In the case of rather unstable geological conditions, entry for the tunnellers with compressed air support has to be guaranteed. Here, the excavation chamber and the working chamber have to be separated from the otherwise atmospheric part of the tunnel. Consequently, access to the TBM is then only possible through a compressed air lock and after the continuous monitoring of the atmospheric CO and CO2 concentrations (e.g., with Dräger X-am, MultiRAE Lite or Gas-Pro hand-held meters). This situation is much more critical compared to compressed air access, because only limited air ventilation can be achieved, leading to higher CO concentrations in the air and making it necessary to wear respiratory protection equipment during maintenance works in the excavation chamber.

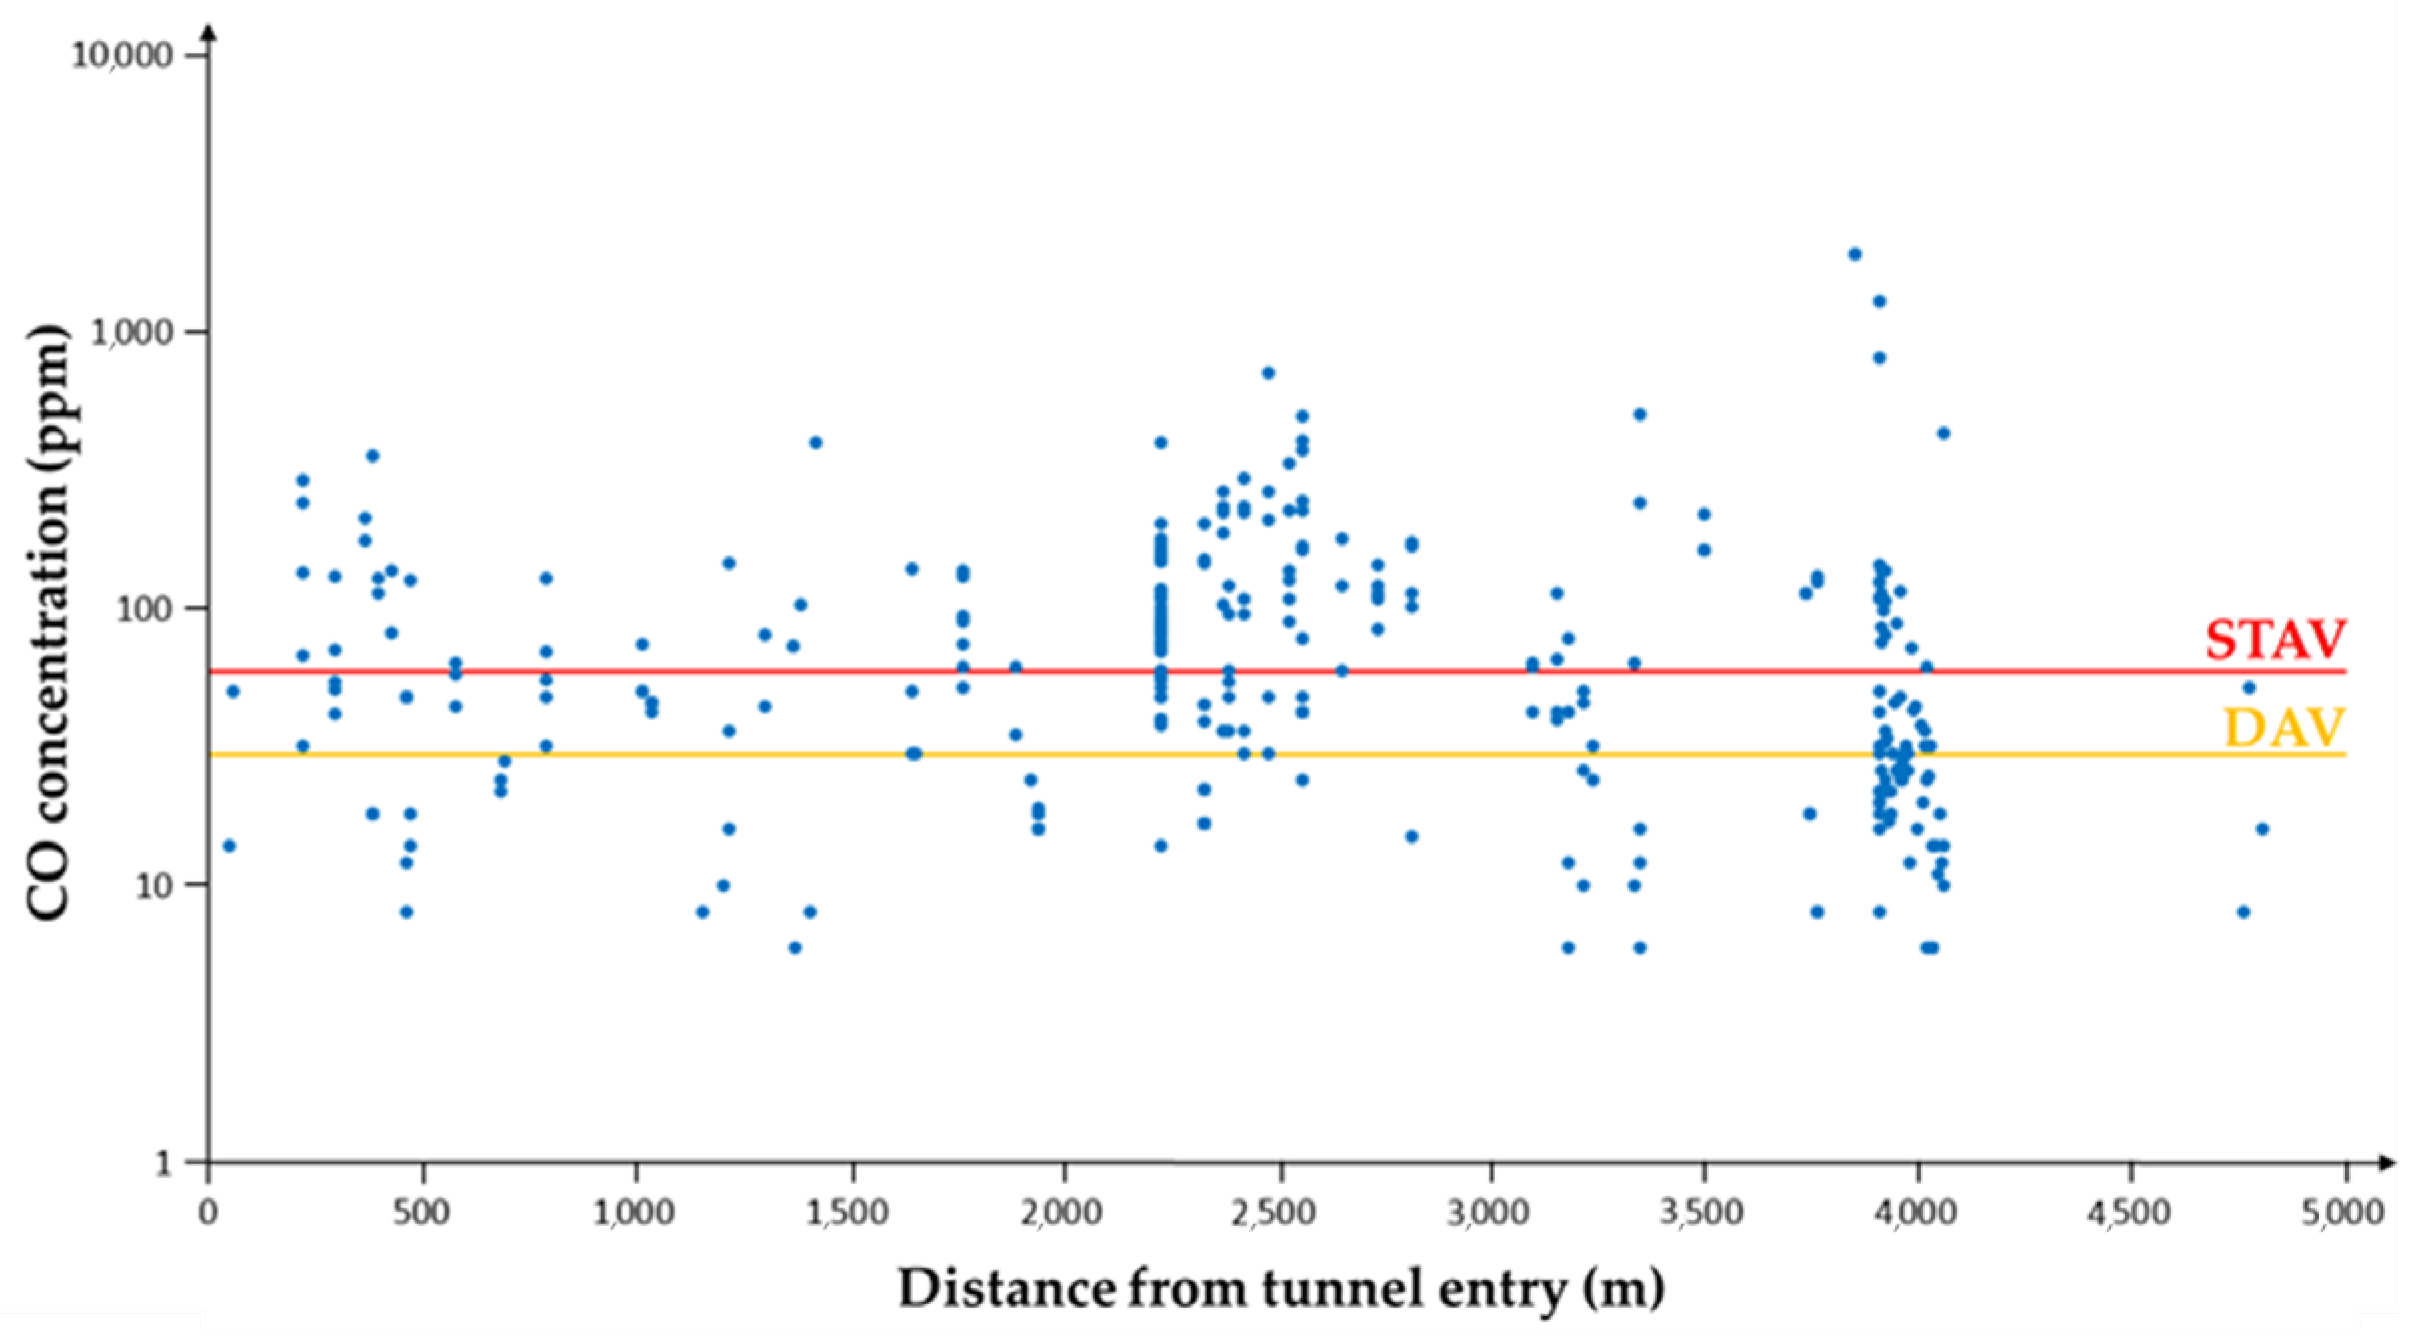
3.1.3. CO Concentration in the Tunnel Atmosphere

During the cross-cutting of the Neogene sedimentary units containing high OM content, temperatures of up to 70 °C were reached at the drill head of the TBM (mainly frictional heat and some geothermal contribution), and simultaneously high CO and CO2 concentrations were measured within the extraction chamber (up to 1923 ppm of CO; average: 100 ppm) and the adjacent area of the conveyor belts (up to 200 ppm of CO; up to ~5 vol.% of CO2; cf. Figure 3). Thus, the CO concentration measured in the air exceeded the occupational daily health and safety limit values by up to ~64 times. In Austria, the daily average value (i.e., the maximum concentration to which a tunneller can be exposed for up to 8 h) and the short-term average value (i.e., the maximum concentration to which a tunneller can be exposed for up to 15 min) of CO are limited to 30 ppm and 60 ppm, respectively, according to the Austrian limit value ordinance [30]. However, in the extraction chamber and surrounding areas, the concentration of CO in the air very often exceeded both the daily average value by >three times (~95 ppm) and the short-term average value by ~five times (~296 ppm) during almost every measurement. Maximum concentrations of up to 1923 ppm of CO were measured at some places during mechanized tunneling (Figure 3). The factors leading to the liberation of CO and CO2 from the Neogene sedimentary rocks and their subsequent accumulation in the tunnel atmosphere remain actively debated at this time. Considering some of the highest measured CO concentrations, however, the geological documentation of little consolidated clay- and sandstone with some mm-scale charcoal fragments and thin OM layers seemed to be of potential relevance.
To verify this assertion, an experimental approach, described in the following sections, was adopted that aimed at testing whether the degradation or release of primary particulate OM in weakly consolidated sedimentary rocks can liberate CO to the atmosphere.

3.2. Laboratory Study: CO Generation in Organic-Rich Sedimentary Rocks

3.2.1. Host Rock Composition

The mineralogical composition of the investigated sedimentary rocks is listed in Table 1. The claystone samples (n = 6) have high phyllosilicate content (montmorillonite, muscovite, kaolinite and chlorite; 61 wt.%), moderate quartz content (31 wt.%) and low content of feldspar (orthoclase and plagioclase; 5 wt.%) and carbonates (calcite and dolomite; 2 wt.%). The sandstone samples (n = 5) contain comparatively higher amounts of quartz (57 wt.%), carbonates (14 wt.%) and feldspar (7 wt.%), but significantly lower phyllosilicate content (22 wt.%). These mineral assemblages are typical for Neogene-aged sedimentary rocks in the Koralpe mountain range [51] and agree well with the corresponding chemical compositions (Table 2). Originally, the claystone and sandstone contained 0.1–0.4 wt.% TOC (average: 0.3 wt.%) and 0.3–1.1 wt.% TOC (average: 0.7 wt.%), respectively, which is equivalent to average OM content of 0.6 and 1.5 wt.%, assuming a conversion factor of 2.1 between TOC and OM (Table 1) [44].

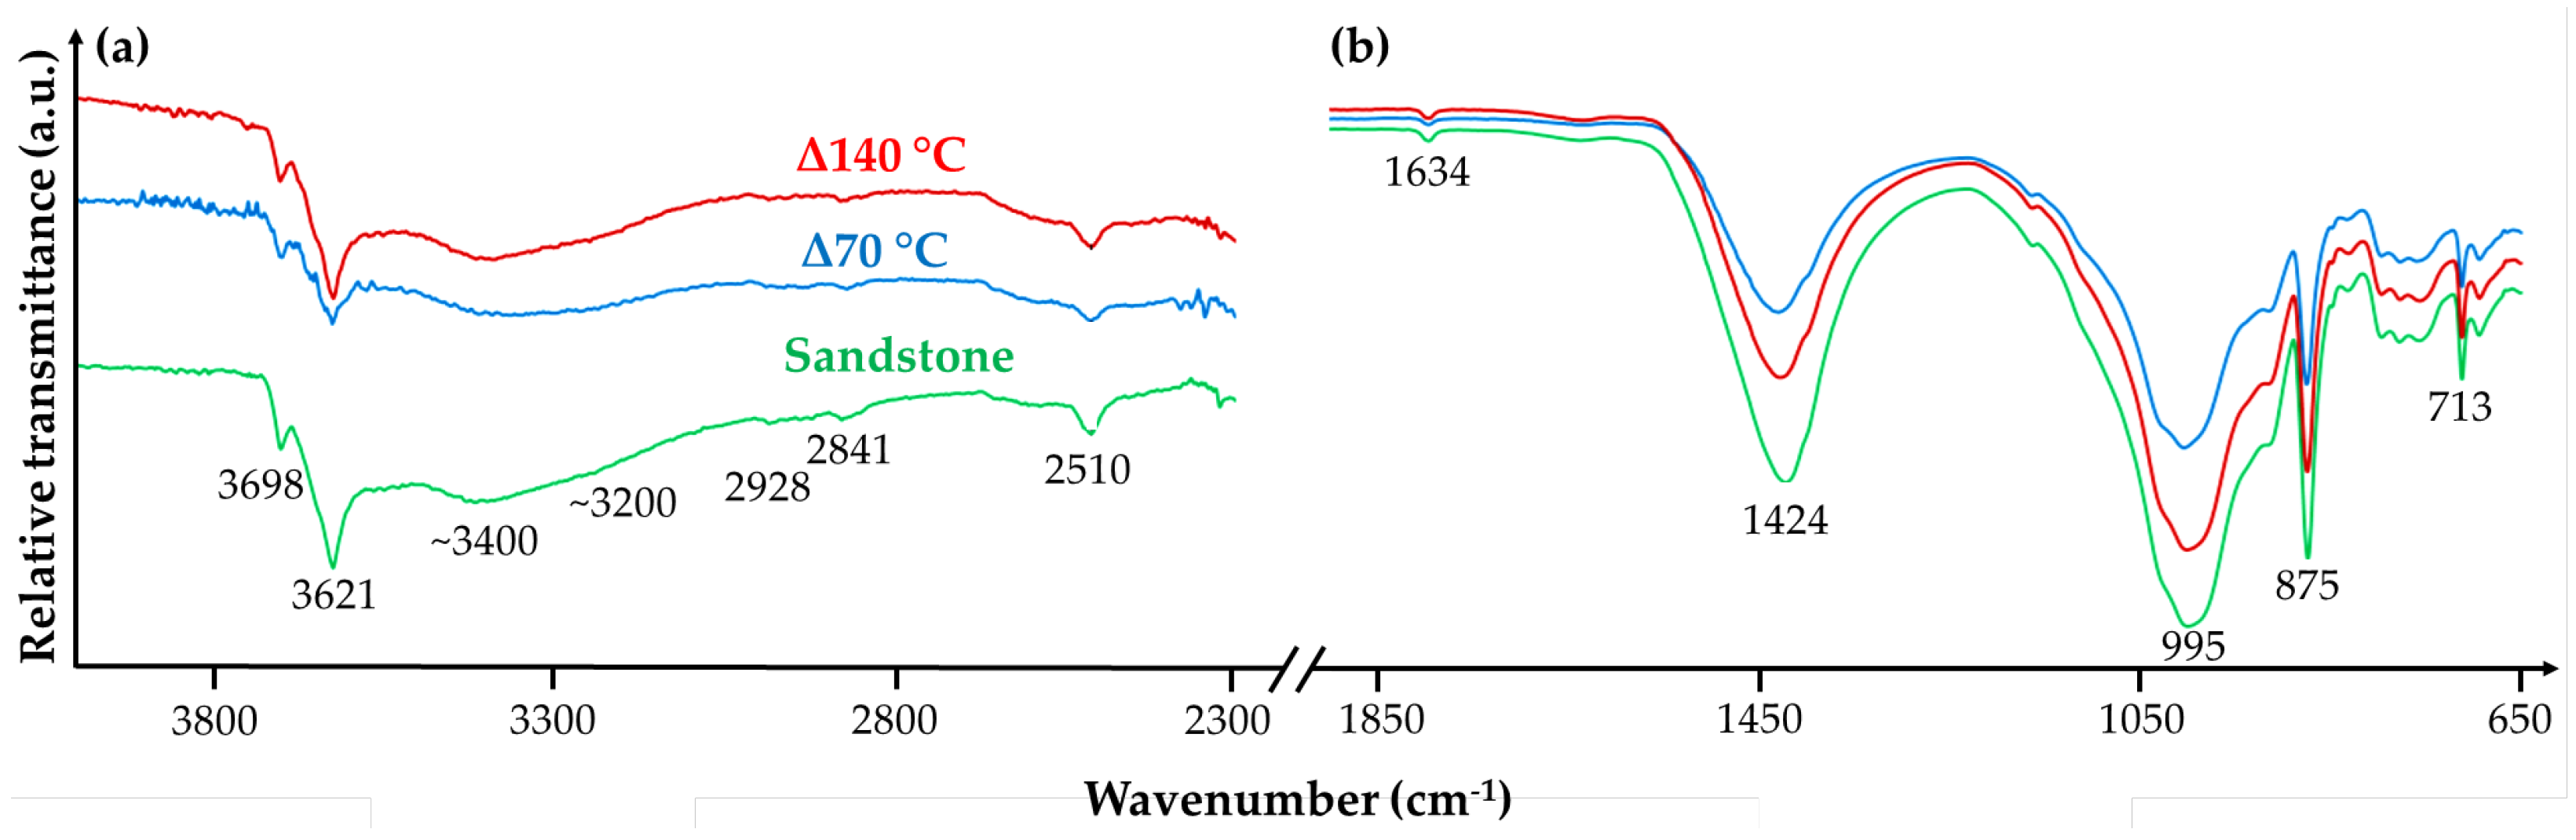
3.2.2. Alteration of Host Rocks upon Thermal Treatment

The mineralogical and geochemical changes of the claystone and sandstone upon heat treatment and fluid–rock interaction are tabularized in Table 1 and Table 2. Mass differences are expressed as the Δoriginal-altered obtained at 70 °C and 140 °C, respectively, where positive values indicate mineralogical or chemical enrichment trends and negative values suggest mineral dissolution and element loss into the solution after 2 months of reaction time. It becomes evident that quartz, muscovite and dolomite were comparatively stable phases under the given experimental conditions, while orthoclase, plagioclase, kaolinite, smectite (here: montmorillonite), calcite and chlorite dissolved preferentially, with the degree of chemical and mineralogical alteration depending mainly on the reaction temperature.
These observations are consistent with the evolution of the chemical composition of the reactive fluids (Table 3) and with the corresponding hydrochemical modeling results (Table 4). Accordingly, the experimental solutions were, at any time, undersaturated with respect to feldspar, calcite, chlorite, smectite and quartz, but supersaturated with respect to illite and muscovite, as well as hematite and gibbsite, the latter denoting potential (yet unidentified by XRD) poorly crystalline alteration products. However, it is worth mentioning that chemical steady-state conditions were not reached at the end of the laboratory experiments, so that the observed alteration vs. neo-formation reactions will continue further depending on the mineral-specific reaction kinetics [53,54,55]. Notably, the pH values of all solutions were in the slightly acidic range (Table 3), which is attributable to the progressive decay of OM (and the generation of, e.g., humic and fulvic acids) upon thermal treatment and fluid–rock interaction [56,57]. This resulted in the further acceleration of silicate mineral (mostly feldspar and poorly crystallized phyllosilicates) and carbonate mineral dissolution (mostly calcite), which is reflected by the sudden increase in the carbonate alkalinity (here: HCO3) and the dissolved concentrations of especially Ca, K, Na, Al, Si and Sr with the increasing reaction temperature (Table 3). Gaseous CO and CO2 were not detected in these experiments, as the reactor headspace could not be sampled.
A significant reduction in the TOC content was recognized after the thermal treatment of the samples, ranging between ~−0.2 wt.% and ~−0.5 wt.% for the claystone and sandstone altered at 70 °C and between ~−0.2 wt.% and ~−0.6 wt.% for the same sample sets treated at 140 °C (Table 1). This corresponds to a total loss of OM of about −67% for the claystone and of approximately −73% to −87% for the sandstone at the end of the experiments. The MIR spectra of the untreated and thermally altered sandstone samples, shown in Figure 4, confirm these results (note that the claystone samples reveal the same trends but with much lower intensity and are therefore not shown): IR bands characteristic for OM are recognizable at 2928 cm–1, 2841 cm–1 and 2510 cm–1, which correspond, e.g., to aliphatic C–H stretching in CH2/CH3 and C=O stretching in carboxylic groups [58]. Upon thermal treatment, these IR bands decline slightly in intensity due to the progressive decay of OM (Figure 4), corroborating the TOC data (Table 1). Likewise, the absorption intensities at 3698 cm–1, 3621 cm–1, ~3400–3200 cm–1, 1634 cm–1, 1424 cm–1, 995 cm–1, 875 cm–1 and 713 cm–1 slightly decreased after the thermal treatment of the sandstones (Figure 4), indicating a certain degree of mineralogical and chemical alteration of phyllosilicates, feldspar and carbonates, corroborating the XRD and XRF data (Table 1 and Table 2).
To summarize, the alteration experiments provide direct evidence for the intense OM decay and mineral dissolution reaction in the temperature range between 70 °C and 140 °C after 2 months of reaction time (i.e., used to ensure a sufficient conversion rate of OM), but they do not allow for robust constraints on potential CO or CO2 liberation systematics in aquatic media (see section below for experimental proof).

3.2.3. CO and CO2 Liberation from Host Rocks

Physically mildly crushed but chemically untreated claystone and sandstone samples were subjected to combined TG-DSC and FTIR analysis to (i) determine the resistance of the Neogene rocks against thermal degradation and (ii) detect the nature of the potential gas phases that are released during progressive OM decay. Four stages of thermal alteration were recognized as a function of the increasing temperature (Figure 5): (i) the loss of weakly bound water (e.g., surface-adsorbed or interlayer water) during phyllosilicate dehydration (30 °C ≤ T ≤ ~200 °C) [59], (ii) the loss of strongly bound structural water during phyllosilicate dehydroxylation (350 °C ≤ T ≤ ~800 °C) [59] coupled to OM decomposition (200 °C ≤ T ≤ 600 °C) [60], (iii) the structural breakdown of minerals (~500 °C ≤ T ≤ ~950 °C) [61] and (iv) thermal decay and mineral recrystallization, with the latter following stage (iii) [42].
Four intervals of significant weight loss with corresponding endothermic reactions were observed in the range of ~50–500 °C, at ~550 °C, in the range of ~600–800 °C and at ~920 °C, for both the claystone (Figure 5a) and sandstone (Figure 5b), which can be attributed mainly to smectite dehydration and OM decomposition (stages i–ii), kaolinite dehydroxylation (stages ii–iii), chlorite dehydroxylation and the decarbonation of calcite and dolomite (stages ii–iii) and muscovite dehydroxylation (stage iii), following the rapid recrystallization of the calcined components into high-temperature phases (stage iv), such as spinel, pyroxene and/or mullite [62]. The weight losses were attributable to the liberation of water and hydroxyl groups from phyllosilicates, CO2 release during decarbonation and, most importantly for this study, CO and CO2 generation during the (in)complete conversion of OM, which started at around 50–70 °C and terminated significantly below 600 °C (Figure 5a,b). Direct proof for the latter reactions comes from the temperature-dependent FTIR measurements of the released volatile phases (Figure 5c,d): IR bands typical of gaseous CO (ν1 C=O: 2166 cm–1 and 2124 cm–1) and gaseous CO23 C=O: 2344 cm–1; ν1+ ν2 combination band: ~3700 cm–1; 2ν23 combination band: ~3600 cm–1), together with water vapor (ν13 stretching: ~4000–3500 cm–1; ν2 bending:~1800–1300 cm–1), were detected already at ~70 °C [63], justifying that gaseous CO can arise from decaying OM at ‘low’ temperatures (e.g., by frictional heat).

4. Discussion

4.1. CO and CO2 Release Mechanisms

During mechanized tunnel driving through the Koralpe mountain range (Austria), significantly elevated concentrations of CO in the air (up to 1923 ppm; average: ~100 ppm) were temporarily measured during the excavation of the Neogene sedimentary units that contained significant amounts of primary particulate OM (Figure 1 and Figure 3; Table 1). Long-term CO measurements within the extraction chamber and in the adjacent area of the conveyor belts yielded values that by far exceeded the national safety standards (Figure 3). This situation led to (i) the implementation of stationary measuring devices on the TBM, (ii) the equipment of the tunneling personnel with hand-held CO and CO2 measuring devices and (iii) an expanded safety instruction to increase the awareness of the tunnellers of any potential health risks caused by CO accumulation in the tunnel atmosphere [21,25,64]. Four main reasons for such high CO concentrations in the air have been debated shortly after the time of active mechanized tunnel driving.
  • The interaction of the TBM drill head (when operated in ‘closed’ mode; cf. Section 3.1.2) with the organic-rich Neogene sedimentary units (TOC: ~0.3 up to ~0.7 wt.%) could have caused particulate OM to incompletely decompose into CO and CO2 [65,66,67]. Such a thermal alteration process could have proceeded via frictional heat and ‘cold combustion’ at ~70 °C measured at the working face.
  • The occurrence of CO in ‘dead gas’ inclusions encapsulated within the host rocks [68] and its subsequent release during the drilling process could have resulted in elevated CO concentrations in the tunnel atmosphere, especially during tunnel driving in closed mode (Figure 2c).
  • Gaseous CO could have been temporarily generated during tunnel fires during the incomplete conversion of sedimentary OM into CO2 [13].
  • The formation of CO-rich exhaust gases could have originated from tunneling machines with combustion engines [16].
In this tunnel project, the release of CO via mechanisms (3) and (4) can be completely ruled out, as fires did not occur during active mechanized tunnel driving and exhaust gases were not released into the atmosphere in this tunnel section, as, e.g., tunneling machines, wheel loaders and excavators with combustion engines were not deployed at this time of operation. Furthermore, although the liberation of CO from ‘dead gas’ inclusions within the Neogene-aged sedimentary units is possible (Figure 1c), following mechanism (2), this scenario is considered to be highly unlikely. This is because (i) significantly elevated CO concentrations in the air would require unrealistically high concentrations of CO ‘dead gas’ inclusions within the overall porous and typically weakly consolidated host rocks (Figure 1b) and (ii) carbon isotope measurements of the atmospheric CO and CO2 concentrations in the tunnel identified an isotopic signature that was far too heavy to have originated from CO gas inclusions (pers. comm. Austrian Federal Railways (ÖBB) office). For these reasons, we consider mechanism (1) to be the most likely, i.e., CO and CO2 were generated from claystone and sandstone during the thermal alteration and incomplete conversion of sedimentary particulate OM through the mechanic (frictional) interaction with the TBM drill head at ~70 °C. This assertion is supported by the laboratory results obtained in this study, where the CO and CO2 production was experimentally verified to occur already at ~50–70 °C (Figure 5c,d), with a corresponding decrease in the TOC content by ~70% for the claystone and sandstone altered in a NaCl solution at 70 °C (Table 1). We note, however, that the thermal and microbial decomposition of OM (e.g., charcoal and graphitic beds documented in some areas), as well as the local rise in CO and CO2 from the deep-seated groundwaters in the areas of fault zones, may have also contributed to the measured gas content in the tunnel atmosphere—processes that require further investigation.
Future studies should aim at testing whether a principle relation between the type and properties of sedimentary host rocks, OM content, composition and maturation and depositional environment exists in order to develop site- or case-specific risk assessment strategies during the exploration and planning phases of tunneling projects. Further, on-site, long-term measurements of CO (in addition to CO2, CH4 and H2S) in the air should be carried out routinely to ensure a safe working environment, to allow efficient mechanized tunnel driving and to maintain the current sustainability and durability standards. This is also important for inspection tunnels, where long-term accumulation zones of CO during tunnel operation can form.

4.2. Human Health Damage Assessment

The UNEP/SETAC Life Cycle Initiative developed a comprehensive model (named USEtox) that allows one to assess the impact of various hazardous substances (e.g., gases, heavy metals and organic pollutants) on the eco-toxicological response of the human body [69,70]. The human health damage (HHD) index can be calculated as follows [16]:
H H D i = C i · I R · Δ t i m · E F r e s p , i + E F c a r d , i
where C i is the concentration of CO measured in the tunnel atmosphere (in µg/m³) at an air temperature of 30 ± 2 °C, IR denotes an inhalation rate of air of 13 m3/24 h, Δ t i refers to the exposure time to the polluted air (in h), m is an air mixing ratio of 1 and E F r e s p , i and E F c a r d , i are defined as the effect factors (EFs) for the respiratory and cardiopulmonary systems of the human body (in DALYs: Disability Adjusted Life Years/kg COinhaled). Here, the EF was assumed to be 133 DALYs/kg COinhaled [16].
Considering the CO concentrations measured in the tunnel atmosphere during mechanized tunnel driving (Figure 3) and setting Δ t i to 8 h, which refers to a normal working shift for tunnellers in Austria, the HHDCO values ranged between 0.01 and 3.0 DALYs, with an average of 0.15 DALYs. For comparison, for people living and working close to the Shanghai tunnel outlet (China), a HHDCO of 4.77·10−3 DALYs was calculated for exposure to CO emitted from vehicles for 8 h [16]. It becomes evident that the conversion of OM bound to sedimentary rocks into CO during mechanized tunnel driving via frictional heat and cold combustion can increase the HHDCO value by up to 630 times (~30 times on average), as compared to traffic. Consequently, safe and sustainable tunnel driving relies on (i) adequate ventilation and air mixing, as well as (ii) continuous gas measurements of the tunnel atmosphere, especially if work activities are carried out in confined spaces, such as in some areas of a TBM [71]. In a severe case, the accumulation of gaseous CO from the reaction of organic-rich pyritic shales with limestones in the Carsington Dam drainage tunnel (United Kingdom) caused the deaths of four workers during an inspection in 1984 [72]. This event demonstrates that distinct geochemical processes pose a serious health risk to tunnel personnel during the construction and maintenance of geotechnical structures.
To date, only a few tunnel projects are known that have faced problems with CO enrichment in the air, which is why future underground construction projects should be sensitized to the potential development of such a toxic gas. Paying particular attention to sedimentary units that contain pieces of charred wood, mature coal or graphite, highly organic-rich layers or fossil beds is key to ensure safe and sustainable mechanized tunnel driving. In this context, the use of tailored drilling fluids during mechanized tunnel driving to remove CO immediately at the working face deserves further investigation [73,74].

5. Conclusions

The release and accumulation mechanisms of CO and CO2 in the tunnel atmosphere at an active underground construction site in Austria were investigated by on-site gas measurements and the laboratory testing of organic-rich sedimentary rocks using alteration experiments. Our results can be summarized as follows.
  • Sedimentary OM started to decompose at 50–70 °C and was subsequently converted into CO (5–1923 ppm) and then CO2 during mechanized tunnel driving.
  • Frictional heat, cold combustion and the incomplete conversion of OM under oxygen-depleted, (semi-)closed conditions can act as important mechanisms for the release of CO to the tunnel atmosphere, especially if the OM is immature.
  • Higher temperatures favor the maturation of OM and its thermal conversion into CO and CO2, as indicated by the thermal alteration of claystone and sandstone that were locally enriched in OM, but graphitic layers that are exposed in crystalline rocks can also bear a risk of CO liberation (up to ~200 ppm as documented in this tunnel).
  • Further investigations, which may include the on-site monitoring of the tunnel atmosphere (e.g., using continuous data logging or remote transmission) and the analysis of the δ13C isotope signatures of host rock-associated OM and atmospheric CO and CO2 at selected hot spots, are necessary to quantify the carbon mass balances.
  • Comparative studies with environmental and air monitoring on the complex enrichment mechanisms of CO in other tunnel projects under construction are required in order to achieve secure working conditions for tunnellers at exposed sites and to maintain the current sustainability and economic standards.
  • The relevance of OM decomposition and gas phase developments (e.g., CO2, CO and CH4) in the course of tunneling should also not be underestimated with regard to the sustainable use of subsurface infrastructure, potentially causing unwanted mineral and biomass deposition in the drainage system or construction material alterations.

Author Contributions

Conceptualization, A.B.; methodology, A.B. and C.B.; software, A.B.; validation, A.B., R.B. and V.R.; formal analysis, A.B.; investigation, A.B. and C.B.; data curation, A.B.; writing—original draft preparation, A.B.; writing—review and editing, A.B., R.B., V.R. and C.B.; visualization, A.B.; project administration, A.B.; funding acquisition, A.B. All authors have read and agreed to the published version of the manuscript.

Funding

This research was partly funded by the NAWI Graz Geocenter (Graz University of Technology) and supported further by the TU Graz Open Access Publishing Fund.

Institutional Review Board Statement

Not applicable.

Informed Consent Statement

Not applicable.

Data Availability Statement

All raw data will be made available upon request to A.B.

Acknowledgments

We highly appreciate the technical support provided by F. Rümmele, J. Jernej, M. Hierz, A. Wolf and S. Perchthold from the Institute of Applied Geosciences (Graz University of Technology). The Austrian Federal Railways (ÖBB) office is acknowledged for providing access to the tunnel site and CO monitoring data. Open Access Funding by the Graz University of Technology.

Conflicts of Interest

The authors declare no conflicts of interest.

References

  1. Tissot, B.P.; Welte, D.H. Petroleum Formation and Occurrence; Latest ed.; Springer: Berlin/Heidelberg, Germany, 1984; pp. 1–702. [Google Scholar] [CrossRef]
  2. Berger, W.H.; Smetacek, V.S.; Wefer, G. Productivity of the Oceans: Present and Past; Latest ed.; Wiley-Interscience: New York, NY, USA, 1989; pp. 1–471. [Google Scholar] [CrossRef]
  3. Meyers, P.A. Preservation of elemental and isotopic source identification of sedimentary organic matter. Chem. Geol. 1994, 114, 289–302. [Google Scholar] [CrossRef]
  4. Hansell, D.A.; Carlson, C.A. Deep-ocean gradients in the concentration of dissolved organic carbon. Nature 1998, 395, 263–266. [Google Scholar] [CrossRef]
  5. Falkowski, P.; Scholes, R.J.; Boyle, E.; Canadell, J.; Canfield, D.; Elser, J.; Gruber, N.; Hibbard, K.; Högberg, P.; Linder, S.; et al. The global carbon cycle: A test of our knowledge of earth as a system. Science 2000, 290, 291–296. [Google Scholar] [CrossRef] [PubMed]
  6. Schulz, H.D.; Zabel, M. Marine Geochemistry, 2nd ed.; Springer: Berlin/Heidelberg, Germany, 2006; pp. 1–574. [Google Scholar] [CrossRef]
  7. Regnier, P.; Resplandy, L.; Najjar, R.G.; Ciais, P. The land-to-ocean loops of the global carbon cycle. Nature 2022, 603, 401–410. [Google Scholar] [CrossRef] [PubMed]
  8. Hilton, R.G.; West, A.J. Mountains, erosion and the carbon cycle. Nat. Rev. Earth Environ. 2020, 1, 284–299. [Google Scholar] [CrossRef]
  9. Galan, I.; Baldermann, A.; Kusterle, W.; Dietzel, M.; Mittermayr, F. Durability of shotcrete for underground support—Review and update. Constr. Build. Mater. 2019, 202, 465–493. [Google Scholar] [CrossRef]
  10. Maie, N.; Anzai, S.; Tokai, K.; Kakino, W.; Taruya, H.; Ninomiya, H. Using oxygen/ozone nanobubbles for in situ oxidation of dissolved hydrogen sulfide at a residential tunnel-construction site. J. Environ. Manag. 2022, 302, 114068. [Google Scholar] [CrossRef]
  11. Zhu, Y.; Wang, D.; Shao, Z.; Xu, C.; Li, M.; Zhang, Y. Characteristics of methane-air explosions in large-scale tunnels with different structures. Tunn. Undergr. Space Technol. 2021, 109, 103767. [Google Scholar] [CrossRef]
  12. Luschnik, A. Bau des neuen Kaiser-Wilhelm-Tunnels unter schwierigen Verkehrsbedingungen. Bauportal 2011, 123, 17–21. [Google Scholar]
  13. Menéndez, J.; Merlé, N.; Fernández-Oro, J.M.; Galdo, M.; de Prado, L.Á.; Loredo, J.; Bernardo-Sánchez, A. Concentration, Propagation and Dilution of Toxic Gases in Underground Excavations under Different Ventilation Modes. Int. J. Environ. Res. Public Health 2022, 19, 7092. [Google Scholar] [CrossRef]
  14. Zamorategui-Molina, A.; Gutiérrez-Ortega, N.L.; Baltazar-Vera, J.C.; Del Ángel-Soto, J.; Tirado-Torres, D. Carbon Monoxide and Particulate Matter Concentrations inside the Road Tunnels of Guanajuato City, Mexico. Aerosol Air Qual. Res. 2021, 21, 1–17. [Google Scholar] [CrossRef]
  15. Liu, W.; Chen, J.; Luo, Y.; Shi, Z.; Ji, X.; Zhu, H. Study on the Annual Reduction Rate of Vehicle Emission Factors for Carbon Monoxide: A Case Study of Urban Road Tunnels in Shenzhen, China. Adv. Civ. Eng. 2020, 1686753, 1–17. [Google Scholar] [CrossRef]
  16. Yang, Q.; Shen, H.; Liang, Z. Analysis of particulate matter and carbon monoxide emission rates from vehicles in a Shanghai tunnel. Sustain. Cities Soc. 2020, 56, 102104. [Google Scholar] [CrossRef]
  17. World Health Organization (WHO). WHO Guidelines for Indoor Air Quality: Selected Pollutants; Latest ed.; University of California: Berkeley, CA, USA, 2010; pp. 1–454. [Google Scholar]
  18. Fuller, R.; Landrigan, P.J.; Balakrishnan, K.; Bathan, G.; Bose-O’Reilly, S.; Brauer, M.; Caravanos, J.; Chiles, T.; Cohen, A.; Corra, L.; et al. Pollution and health: A progress update. Lancet Planet Health 2022, 6, 535–547. [Google Scholar] [CrossRef]
  19. Balakrishnan, K.; Cohen, A.; Smith, K.R. Addressing the Burden of Disease Attributable to Air Pollution in India: The Need to Integrate across Household and Ambient Air Pollution Exposures. Environ. Health Perspect. 2014, 122, 1–2. [Google Scholar] [CrossRef]
  20. United States Environmental Protection Agency (EPA). 2020 National Emissions Inventory (NEI) Technical Support Document (TSD); Latest ed.; EPA: Washington, DC, USA, 2020; Section 1–37.
  21. Kumar, A.; Malyan, V.; Sahu, M. Air Pollution Control Technologies for Indoor Particulate Matter Pollution: A Review. Aerosol Sci. Eng. 2023, 7, 261–282. [Google Scholar] [CrossRef]
  22. Grba, N.; Baldermann, A.; Dietzel, M. Novel green technology for wastewater treatment: Geo-material/geopolymer applications for heavy metal removal from aquatic media. Int. J. Sediment Res. 2023, 38, 33–48. [Google Scholar] [CrossRef]
  23. Chen, R.; Yin, P.; Meng, X.; Liu, C.; Wang, L.; Xu, X.; Ross, J.A.; Tse, L.A.; Zhao, Z.; Kan, H.; et al. Fine Particulate Air Pollution and Daily Mortality. Am. J. Respir. Crit. Care Med. 2017, 196, 73–81. [Google Scholar] [CrossRef]
  24. Ni, K.; Carter, E.; Schauer, J.J.; Ezzati, M.; Zhang, Y.; Niu, H.; Lai, A.M.; Shan, M.; Wang, Y.; Yang, X.; et al. Seasonal variation in outdoor, indoor, and personal air pollution exposures of women using wood stoves in the Tibetan Plateau: Baseline assessment for an energy intervention study. Environ. Int. 2016, 94, 449–457. [Google Scholar] [CrossRef]
  25. Levy, R.L. Carbon monoxide pollution and neurodevelopment: A public health concern. Neurotoxicol. Teratol. 2015, 49, 31–40. [Google Scholar] [CrossRef]
  26. Seo, H.J.; Chung, Y.H.; Song, T.J. An Experimental Study for Deriving Fire Risk Evaluation Factors for Cables in Utility Tunnels. Fire 2023, 6, 342. [Google Scholar] [CrossRef]
  27. Li, L.; Zhu, D.; Gao, Z.; Xu, P.; Zhang, W. A study on longitudinal distribution of temperature rise and carbon monoxide concentration in tunnel fires with one opening portal. Case Stud. Therm. Eng. 2021, 28, 101535. [Google Scholar] [CrossRef]
  28. Kwiecień, J.; Szopińska, K. Mapping Carbon Monoxide Pollution of Residential Areas in a Polish City. Remote Sens. 2020, 12, 2885. [Google Scholar] [CrossRef]
  29. Ali, M.U.; Yu, Y.; Yousaf, B.; Munir, M.A.M.; Ullah, S.; Zheng, C.; Kuang, X.; Wong, M.H. Health impacts of indoor air pollution from household solid fuel on children and women. J. Hazard. Mater. 2021, 416, 126127. [Google Scholar] [CrossRef] [PubMed]
  30. Grenzwerteverordnung 2021, BGBL. II Nr. 253/2001 (vgl. RIS—Rechtsinformationssystem des Bundes) Siehe v.a. Anhang I Stoffliste inkl. MAK-Werte und TRK-Werte. Available online: https://www.ris.bka.gv.at/Dokumente/BgblPdf/2001_253_2/2001_253_2.pdf (accessed on 10 September 2024).
  31. Coburn, R.F. The partial pressure of carbon monoxide in human tissues calculated using a parallel capillary-tissue cylinder model. J. Appl. Physiol. 2018, 124, 761–768. [Google Scholar] [CrossRef]
  32. Painer, F.; Baldermann, A.; Gallien, F.; Eichinger, S.; Steindl, F.; Dohrmann, R.; Dietzel, M. Synthesis of Zeolites from Fine-Grained Perlite and Their Application as Sorbents. Materials 2022, 15, 4474. [Google Scholar] [CrossRef]
  33. Eichinger, S.; Boch, R.; Leis, A.; Baldermann, A.; Domberger, G.; Schwab, C.; Dietzel, M. Green inhibitors reduce unwanted calcium carbonate precipitation: Implications for technical settings. Wat. Res. 2022, 208, 117850. [Google Scholar] [CrossRef]
  34. Kralik, M.; Zieritz, I.; Grath, J.; Vincze, G.; Philippitsch, R.; Pavlik, H. Hydrochemische Karte Österreichs—Oberflächennaher Grundwasserkörper und Fließgewässer; Mittelwerte von Wassergüteerhebungsdaten (WGEV-DATEN) 1991–2001; 2. Überarbeitete Auflage, Umweltbundesamt: Wien, Austria, 2005; pp. 1–19. [Google Scholar]
  35. Pfleiderer, S.; Reitner, H.; Leis, A. Availability, dynamics and chemistry of groundwater in the Bucklige Welt region of Lower Austria. Austrian J. Earth Sci. 2017, 110, 1–13. [Google Scholar] [CrossRef]
  36. Baldermann, A.; Dietzel, M.; Reinprecht, V. Chemical weathering and progressing alteration as possible controlling factors for creeping landslides. Sci. Total Environ. 2021, 778, 146300. [Google Scholar] [CrossRef]
  37. Pepper, A.S.; Dodd, T.A. Simple kinetic models of petroleum formation. Part II: Oil-gas cracking. Mar. Petrol. Geol. 1995, 12, 321–340. [Google Scholar] [CrossRef]
  38. Adegoke, A.K.; Hakimi, M.H.; Abdullah, W.H.; Ibrahim, E.-K.; Yandoka, B.M.S.; Faifi, H.A.; Lashin, A. Geochemistry and oil-gas generation modeling of the Late Cretaceous shales from the Chad (Bornu) Basin, Northeast Nigeria. J. Nat. Gas Sci. Eng. 2020, 79, 103341. [Google Scholar] [CrossRef]
  39. Stockhausen, M.; Galimberti, R.; Elias, R.; Di Paolo, L.; Schwark, L. Expulsinator assessment of oil/gas generation and expulsion characteristics of different source rocks. Mar. Petrol. Geol. 2021, 129, 105057. [Google Scholar] [CrossRef]
  40. Baldermann, A.; Stamm, F.M.; Farkaš, J.; Löhr, S.; Ratz, B.; Letofsky-Papst, I.; Dietzel, M. Precipitation of short-range order hydroxy aluminosilicate (HAS) and hydrous ferric silicate (HFS) at ambient temperature: Insights into mineral formation pathways, crystal chemistry and solubility-stability relationships. Chem. Geol. 2024, 646, 121911. [Google Scholar] [CrossRef]
  41. Han, S.; Löhr, S.C.; Abbott, A.N.; Baldermann, A.; Farkaš, J.; McMahon, W.; Milliken, K.L.; Rafiei, M.; Wheeler, C.; Owen, M. Earth system science applications of next-generation SEM-EDS automated mineral mapping. Front. Earth Sci. 2022, 10, 956912. [Google Scholar] [CrossRef]
  42. Baldermann, A.; Dohrmann, R.; Kaufhold, S.; Nickel, C.; Letofsky-Papst, I.; Dietzel, M. The Fe-Mg-saponite solid solution series—A hydrothermal synthesis study. Clay Miner. 2014, 49, 391–415. [Google Scholar] [CrossRef]
  43. Grba, N.; Grengg, C.; Petronijević, M.; Dietzel, M.; Baldermann, A. Substantial Copper (Cu2+) Uptake by Metakaolin-Based Geopolymer and Its Resistance to Acid Leaching and Ion Exchange. Polymers 2023, 15, 1971. [Google Scholar] [CrossRef]
  44. Oberhollenzer, S.; Hauser, L.; Baldermann, A.; Marte, R.; Tschuchnigg, F.; Schweiger, H.F.; Nachtnebel, M.; Dietzel, M. Microstructure development in lacustrine, fine-grained sediments traced by in situ and laboratory testing. Int. J. Environ. Sci. Technol. 2024, 21, 1–16. [Google Scholar] [CrossRef]
  45. Pettauer, M.; Baldermann, A.; Eder, S.; Dietzel, M. Hydration of MgO: Reaction Kinetics and pH Control on Brucite Crystal Morphology. Cryst. Growth Des. 2024, 24, 3085–3092. [Google Scholar] [CrossRef]
  46. Baldermann, A.; Mittermayr, F.; Bernasconi, S.M.; Dietzel, M.; Grengg, C.; Hippler, D.; Kluge, T.; Leis, A.; Lin, K.; Wang, X.; et al. Fracture dolomite as an archive of continental palaeo-environmental conditions. Commun. Earth Environ. 2020, 1, 35. [Google Scholar] [CrossRef]
  47. Parkhurst, D.L.; Appelo, C.A.J. Description of input and examples for PHREEQC version 3-A computer program for speciation, batch-reaction, one-dimensional transport, and inverse geochemical calculations. US Geol. Surv. Tech. Methods 2013, 6, 497. [Google Scholar]
  48. Voigt, M.; Pearce, C.R.; Fries, D.M.; Baldermann, A.; Oelkers, E.H. Magnesium isotope fractionation during hydrothermal seawater-basalt interaction. Geochim. Cosmochim. Acta 2020, 272, 21–35. [Google Scholar] [CrossRef]
  49. Sellner, P.; Janotta, M.; Koinig, J. Systematic Drainage Measures in the Tunnel Construction—Experiences in the Neogene Sections of the Investigation Tunnels for the Koralm Tunnel. Geomech. Tunn. 2008, 1, 287–293. [Google Scholar] [CrossRef]
  50. Moritz, B.; Wagner, H.; Mussger, K.; Handke, D.; Harer, G. Criteria for the selection of tunnelling method through the example of the Koralm Tunnel. Geomech. Tunn. 2011, 4, 305–315. [Google Scholar] [CrossRef]
  51. Herg, A.; Stüwe, K. Tectonic interpretation of the metamorphic field gradient south of the Koralpe in the Eastern Alps. Austrian J. Earth Sci. 2018, 111/2, 155–170. [Google Scholar] [CrossRef]
  52. Wehrmeyer, G. Multi-Mode-TBM—Flexible Maschinentechnik für stark variierende Baugründe. In Innovationen im Spezialtiefbau: Fachseminar am 05. Dezember 2013 an der Technischen Universität Berlin; Universitätsverlag der TU Berlin: Berlin, Germany, 2013; pp. 55–74. Available online: https://api-depositonce.tu-berlin.de/server/api/core/bitstreams/e773622c-39e2-4a86-9dfc-1b3b4df1e2b9/content (accessed on 10 September 2024).
  53. Lasaga, A.C. Chemical kinetics of water-rock interactions. J. Geophys. Res. Solid Earth 1984, 89, 4009–4025. [Google Scholar] [CrossRef]
  54. Tutolo, B.M.; Luhmann, A.J.; Kong, X.-Z.; Saar, M.O.; Seyfried, W.E., Jr. CO2 sequestration in feldspar-rich sandstone: Coupled evolution of fluid chemistry, mineral reaction rates, and hydrogeochemical properties. Geochim. Cosmochim. Acta 2015, 160, 132–154. [Google Scholar] [CrossRef]
  55. Qin, F.; Beckingham, L.E. The impact of mineral reactive surface area variation on simulated mineral reactions and reaction rates. Appl. Geochem. 2021, 124, 104852. [Google Scholar] [CrossRef]
  56. Rossel, P.E.; Stubbins, A.; Rebling, T.; Koschinsky, A.; Hawkes, J.A.; Dittmar, T. Thermally altered marine dissolved organic matter in hydrothermal fluids. Org. Geochem. 2017, 110, 73–86. [Google Scholar] [CrossRef]
  57. Seewald, J.S.; Seyfried, W.E., Jr.; Thornton, E.C. Organic-rich sediment alteration: An experimental and theoretical study at elevated temperatures and pressures. Appl. Geochem. 1990, 5, 193–209. [Google Scholar] [CrossRef]
  58. Zhou, Z.; Cao, X.; Schmidt-Rohr, K.; Olk, D.C.; Zhuang, S.; Zhou, J.; Cao, Z.; Mao, J. Similarities in chemical composition of soil organic matter across a millennia-old paddy soil chronosequence as revealed by advanced solid-state NMR spectroscopy. Biol. Fertil. Soils 2014, 50, 571–581. [Google Scholar] [CrossRef]
  59. Derkowski, A.; Kuligiewicz, A. Rehydroxylation in smectites and other clay minerals observed in-situ with a modified thermogravimetric system. Appl. Clay Sci. 2017, 136, 219–229. [Google Scholar] [CrossRef]
  60. Barros, N.; Salgado, J.; Feijόo, S. Calorimetry and soil. Thermochim. Acta 2007, 458, 11–17. [Google Scholar] [CrossRef]
  61. Földvári, M. Handbook of Thermogravimetric System of Minerals and Its Use in Geological Practice; Occasional Papers of the Geological Institute of Hungary: Budapest, Hungary, 2011; pp. 1–180. [Google Scholar]
  62. Che, C.; Glotch, T.D.; Bish, D.L.; Michalski, J.R.; Xu, W. Spectroscopic study of the dehydration and/or dehydroxylation of phyllosilicate and zeolite minerals. J. Geophys. Res. 2011, 116, E05007. [Google Scholar] [CrossRef]
  63. Azzolina-Jury, F.; Thibault-Starzyk, F. Mechanism of Low Pressure Plasma-Assisted CO2 Hydrogenation Over Ni-USY by Microsecond Time-resolved FTIR Spectroscopy. Top Catal. 2017, 60, 1709–1721. [Google Scholar] [CrossRef]
  64. Abelsohn, A.; Sanborn, M.D.; Jessiman, B.J.; Weir, E. Identifying and managing adverse environmental health effects: 6. Carbon monoxide poisoning. Can. Med. Assoc. J. 2002, 166, 1685–1690. [Google Scholar] [PubMed] [PubMed Central]
  65. Zuo, Y.; Jones, R.D. Photochemistry of natural dissolved organic matter in lake and wetland waters—Production of carbon monoxide. Wat. Res. 1997, 31, 850–858. [Google Scholar] [CrossRef]
  66. Koppmann, R.; von Czapiewski, K.; Reid, J.S. A review of biomass burning emissions, part I: Gaseous emissions of carbon monoxide, methane, volatile organic compounds, and nitrogen containing compounds. Atmos. Chem. Phys. Discuss. 2005, 5, 10455–10516. [Google Scholar] [CrossRef]
  67. Hellebrand, H.J.; Schade, G.W. Carbon Monoxide from Composting due to Thermal Oxidation of Biomass. J. Environ. Qual. 2008, 37, 592–598. [Google Scholar] [CrossRef]
  68. Barker, C.; Smith, M.P. Mass Spectrometric Determination of Gases in Individual Fluid Inclusions in Natural Minerals. Anal. Chem. 1986, 58, 1330–1333. [Google Scholar] [CrossRef]
  69. Fantke, E.P.; Bijster, M.; Guignard, C.; Hauschild, M.; Huijbregts, M.; Jolliet, O.; Kounina, A.; Magaud, V.; Margni, M.; Mckone, T.; et al. UNEP/SETAC scientific consensus model for characterizing human toxicological and ecotoxicological impacts of chemical emissions in life cycle assessment. In USEtox® 2.0 Documentation; Version 1.1; USEtox®; International Center Hosted at the Technical University of Denmark: Lyngby, Demark, 2017. [Google Scholar]
  70. Du, C.; Kulay, L.; Cavalett, O.; Dias, L.; Freire, F. Life cycle assessment addressing health effects of particulate matter of mechanical versus manual sugarcane harvesting in Brazil. Int. J. Life Cycle Assess. 2018, 23, 787–799. [Google Scholar] [CrossRef]
  71. Yan, Q.; Yang, K.; Wu, W.; Wang, F.; He, F. Prevention and control of gas hazards in a tunnel under construction: A case study. Environ. Earth Sci. 2020, 79, 317. [Google Scholar] [CrossRef]
  72. Reid, J.M.; Cripps, J.C. Geochemical lessons from Carsington Dam failure of 1984 and reconstruction. Q. J. Eng. Geol. Hydrogeol. 2019, 52, 414–424. [Google Scholar] [CrossRef]
  73. Chen, Z.; Chen, Z.; Yin, F.; Wang, G.; Chen, H.; He, C.; Xu, Y. Supercritical water oxidation of oil-based drill cuttings. J. Hazard. Mater. 2017, 332, 205–213. [Google Scholar] [CrossRef] [PubMed]
  74. Mao, H.; Yang, Y.; Zhang, H.; Zhang, J.; Huang, Y. A critical review of the possible effects of physical and chemical properties of subcritical water on the performance of water-based drilling fluids designed for ultra-high temperature and ultra-high pressure drilling applications. J. Petrol. Sci. Eng. 2020, 187, 106795. [Google Scholar] [CrossRef]
Figure 1. (a) Overview of the study site showing the railway tunnel under construction (red line) between the cities of Graz and Klagenfurt (Austria). (b) Low to slightly consolidated and fragile conglomerate–sandstone–claystone alternations rich in organic matter (from left to right). (c) Cross-section through the mountain range Koralpe showing the locations of major fault systems at the contact between Paleozoic-aged metamorphic/crystalline and Neogene-aged sedimentary rocks [50].
Sustainability 16 08107 g001
Figure 2. Tunneling modes of a conventional TBM with the active working face being located on the left side. (a) Open (atmospheric) mode; (b) semi-open (earthy) mode; (c) closed (earthy) mode [52].
Sustainability 16 08107 g002
Figure 3. Semi-logarithmic plot of the CO concentration in the air measured over a tunnel section of ~5000 m within Austria’s longest railway tunnel (Neogene sedimentary units). A maximum concentration of 1923 ppm of CO (average: 96 ppm) was measured during mechanized tunnel driving. The yellow line represents the legal daily average value (DAV: 30 ppm) and the red line denotes the legal short-term average value (STAV: 60 ppm) of CO to which tunnellers are allowed to be exposed.
Sustainability 16 08107 g003
Figure 4. FTIR spectra of the sandstones obtained in the original state (green curve) and after thermal treatment in 10 mM NaCl solution at 70 °C (blue curve) and 140 °C (red curve) for 2 months (i.e., used to ensure the high conversion of OM). (a) Hydroxyl stretching region; (b) lattice vibration region. Note the decreasing intensity in the 3000–2500 cm–1 range, which is due to the progressive decomposition of OM.
Sustainability 16 08107 g004
Figure 5. TG-DSC curves of the investigated organic-rich rocks with the FTIR spectra of the released volatiles. (a) TG-DSC curves of claystone; (b) TG-DSC curves of sandstone; (c) FTIR spectrum of claystone at 70 °C; (d) FTIR spectrum of sandstone at 70 °C. All FTIR data reveal CO2, CO and H2O in the gas phase.
Sustainability 16 08107 g005
Table 1. Mineralogical composition (in wt.%), TOC content (in wt.%) and OM content (in wt.%) of claystone and sandstone in original states and after experimental treatment at 70 °C and 140 °C (Δ70 °C and Δ140 °C are expressed as difference, Δoriginal-altered).
ComponentClaystoneΔ70 °CΔ140 °CSandstoneΔ70 °CΔ140 °C
Quartz31235713
Muscovite2114623
Orthoclase20−210−1
Plagioclase30060−1
Kaolinite100−14−1−1
Smectite25−2−38−1−1
Calcite10090−1
Dolomite100500
Chlorite5−1−14−1−1
SUM100Δ0Δ0100Δ0Δ0
TOC0.30.10.10.70.20.1
OM0.60.20.21.50.40.2
Table 2. Chemical composition and LOI content (both in wt.%) of claystone and sandstone in original states and after experimental treatment at 70 °C and 140 °C (Δ70 °C and Δ140 °C are expressed as difference, Δoriginal-altered).
ComponentClaystoneΔ70 °CΔ140 °CSandstoneΔ70 °CΔ140 °C
SiO248.6−0.9−1.258.6−0.8−1.4
Al2O324.1−0.1−0.27.6−0.1−0.2
Fe2O311.3−0.9−1.12.1−0.1−0.2
MgO2.4<0.1<0.11.0<0.1<0.1
K2O2.30.40.50.90.40.3
CaO1.0−0.1−0.115.7−0.1−1.0
Na2O0.3<0.1<0.10.7<0.1<0.1
P2O5<0.1<0.1<0.1<0.1<0.1<0.1
SO3<0.1<0.1<0.1<0.1<0.1<0.1
TiO2<0.1<0.1<0.1<0.1<0.1<0.1
MnO0.1<0.1<0.1<0.1<0.1<0.1
LOI9.91.62.213.40.72.5
SUM100.0Δ0.0Δ0.0100.0Δ0.0Δ0.0
Table 3. Chemical composition, pH value and electric conductivity (EC) of the experimental solutions obtained after the thermal alteration of claystone and sandstone at 70 °C and 140 °C (F, Br, NO3, PO4 and B concentrations were below 0.1 mg/L). Note that the original fluid contained 10 mM NaCl at pH 7 and 23 °C. ICB = ion charge balance.
ClaystoneSandstone
ComponentΔ70 °CΔ140 °CΔ70 °CΔ140 °C
Na (mg/L)233.4296.7240.0263.3
K (mg/L)15.115.713.719.4
Mg (mg/L)5.95.62.33.2
Ca (mg/L)36.650.625.834.2
Cl (mg/L)354.3458.4360.1459.2
HCO3 (mg/L)223.4433.8 242.4
SO4 (mg/L)5.116.01.02.2
Al (µg/L)318350175225
Ba (µg/L)171397824
Co (µg/L)1111
Cr (µg/L)11717
Cu (µg/L)1111
Fe (µg/L)228018111
Li (µg/L)2606332347
Mn (µg/L)8945435
Ni (µg/L)1156
Si (µg/L)3465547646876789
Sr (µg/L)3494916669
Zn (µg/L)1421313
pH (-)6.55.86.65.8
EC (mol/kg)1.38·10−21.64·10−21.31·10−21.48·10−2
ICB (%)1.452.61−0.990.22
Table 4. Saturation indices (SI) of relevant mineral phases calculated for fluid–rock interactions at 70 °C and 140 °C. Model input parameters are listed in Table 3.
ClaystoneSandstone
SI (-)Δ70 °CΔ140 °CΔ70 °CΔ140 °C
Albite–2.3–2.7–2.1–2.7
Anorthite–3.7–3.6–3.9–4.1
Calcite–0.6–1.2–0.7–1.5
Clinochlore–5.4–8.3–6.9–10.3
Gibbsite1.91.81.61.5
Hematite13.615.413.615.6
Illite1.20.61.00.2
K-Feldspar–1.3–2.0–1.1–2.0
Montmorillonite–0.3–0.8–0.3–1.1
Muscovite4.33.63.93.1
Quartz–0.9–0.9–0.8–0.8
Disclaimer/Publisher’s Note: The statements, opinions and data contained in all publications are solely those of the individual author(s) and contributor(s) and not of MDPI and/or the editor(s). MDPI and/or the editor(s) disclaim responsibility for any injury to people or property resulting from any ideas, methods, instructions or products referred to in the content.

