Abstract
Securing ever-increasing energy demands while reducing resilience on fossil fuels is a major task of modern society. Fuel cells are devices in which the chemical energy of various fuels can be converted into clean electricity. Direct ethanol fuel cells (DEFC) are increasingly popular for their eco-friendliness and significantly easier liquid fuel manipulation compared to hydrogen-fed fuel cells. Carbon-supported Pt nanoparticles are considered reference catalysts for fuel oxidation in DEFCs. Several challenges hinder DEFC commercialization: high Pt-loading, Pt poisoning by CO intermediates, and the instability of the Pt and carbon supports. This work demonstrates an efficient electrocatalyst for ethanol oxidation reaction (EOR) composed of Pt nanoparticles supported on electrochemically exfoliated graphene (Pt/el-rGO). Graphene was obtained through anodic electrochemical exfoliation using graphitic tape as the anode, while Pt nanoparticles were synthesized using chemical reduction with formic acid. As-obtained Pt/el-rGO with only 7.5 wt.% Pt was characterized using TEM, SEM, and XPS. Pt/el-rGO exhibited notably higher EOR catalytic activity in an alkaline electrolyte than the Pt/C benchmark. This enhancement can be linked with the functional groups present on the graphene support, which facilitate ethanol dehydrogenation as the first step in the EOR mechanism and thus enhance reaction kinetics on Pt-active sites.
1. Introduction
Since the Industrial Revolution, energy demands have been constantly growing to catch up with the pace of global development. The majority of the energy needs are supplied by burning fossil fuels, which is hardly sustainable from different points of view. Depleting reserves of fossil fuels are unevenly distributed across the globe, which leads to significant geopolitical crises, market disruptions, and compromised supply chains [1,2]. More importantly, increasing usage of fossils significantly impacts environmental deterioration, climate changes, and human health issues, which need to be urgently addressed by switching towards renewable energy solutions. Electrochemical energy conversion devices, such as fuel cells, can convert the chemical energy of different fuels into electricity, with minimal to no emissions [3,4]. Direct alcohol fuel cells, fed by liquid fuels such as ethanol and methanol, are promising alternatives to hydrogen-fed fuel cells, as fuel handling, manipulation, and transport are significantly easier [5,6]. Ethanol is more economical than methanol for large-scale production, and also less toxic and easier to handle [7,8], thus direct ethanol fuel cells (DEFC) hold great promise for application in many sectors. The cores of these devices are electrocatalytic materials used to run electrochemical ethanol oxidation reaction (EOR), as they largely determine the overall efficacy of DEFCs.
Currently, carbon-supported Pt-based nanomaterials are among the state-of-the-art catalysts for EOR [7,9,10,11]. Despite their good performance, Pt catalysts are challenged by the deactivation due to the poisoning by strongly adsorbed intermediates formed during EOR, mostly CO. The high price and scarcity of Pt impose the need for sustainable usage of Pt in DEFCs with maximum mass utilization. This can be achieved by downsizing Pt nanoparticles and combining them with different conductive substrates to increase the surface-to-volume ratio, such as high-surface-area carbon, which is commonly used in fuel cells. Support materials can offer more than just conductivity and dispersion of metallic nanoparticles, and can help to improve the performance of the active sites [12]. In that context, graphene has garnered significant attention due to its exceptionally high specific surface area, outstanding electrical conductivity, excellent chemical stability, and the presence of various functional groups [13,14]. These properties make it a promising candidate for catalyst support in fuel cell applications, including DEFCs [15]. It has been shown that Pt nanoparticles supported on graphene show better EOR performance than Pt supported on graphite and carbon black, clearly pointing out the support effect [16,17,18]. Many of these studies used high loading of Pt of around 20–50 wt.%, which increases the cost of the catalyst [19,20]. In the case of low-loaded Pt catalysts, impediment comes from the need for complicated and expensive techniques for the synthesis of low-loaded Pt catalysts, such as atomic layer deposition [21] or chemical vapor deposition [22]. Likewise, the synthesis of graphene can be a problematic, costly, energy-demanding, and time-consuming process, which then hinders the large-scale production of this material. Electrochemical exfoliation offers a straightforward and efficient approach for the large-scale production of graphene materials [15,23,24]. This method allows for exfoliation without the use of strong oxidants, and the properties of the resulting graphene can be tailored by adjusting factors such as the applied potential, the type and concentration of the electrolyte, and the type of carbon electrode used. Controllable properties include structural defects, oxygen-containing functional groups, the number of graphene layers, and the lateral size of graphene sheets. These characteristics are crucial for designing an effective electrocatalyst support [12].
This work demonstrates a new approach for producing an excellent catalyst containing a low amount of Pt nanoparticles on electrochemically exfoliated reduced graphene oxide (further denoted Pt/el-rGO). We modified an already known, simple method for electrochemical exfoliation [25] using a graphite tape gasket as electrodes for dual exfoliation in a two-electrode system, and obtained very thin reduced graphene oxide sheets with excellent characteristics. This approach combines the benefits of both anodic and cathodic exfoliation on each electrode. Anodic exfoliation offers a high production rate, yielding thin-layer graphene with a significant amount of oxygen groups due to the high anodic potential. Conversely, the reduction that occurs during exfoliation minimizes structural damage, producing graphene sheets with fewer defects. Such features of graphene support are advantageous for enhancing the activity and durability of the electrocatalyst, as well as minimizing carbon corrosion, a key factor in electrocatalyst degradation. As-obtained el-rGO was decorated with low-loaded Pt nanoparticles (7.5 wt.%) using a facile chemical reduction approach. The resulting Pt/el-rGO catalyst was thoroughly characterized using transmission and scanning electron microscopy, and X-ray photoelectron spectroscopy, which revealed successful synthetic approaches. Small-sized Pt nanoparticles were evenly distributed over support featured with very thin rGO sheets. Pt/el-rGO significantly outperformed the Pt/C benchmark in terms of EOR activity in alkaline media, which was ascribed to the effect of the el-rGO support, which is featured with different functional groups that help initiate EOR at lower overpotentials, while its structure improves the dispersion and utilization of Pt-active sites. The presented Pt/el-rGO catalysts can be regarded as a platform for further upgrade and development of catalysts for (not only) fuel oxidation in DEFCs.
2. Materials and Methods
2.1. Chemicals
Working solutions were made with potassium hydroxide pellets (Sigma-Aldrich, St. Louis, MO, USA), ethanol (Fisher Chemicals, Pittsburgh, PA, USA), and ultrapure water, and deaerated with nitrogen gas (Messer Tehnogas, Belgrade, Serbia). Sulfuric acid (Carlo Erba Reagents, Emmendingen, Germany), formic acid (Honeywell, Charlotte, NC, USA), and chloroplatinic acid hydrate (Sigma-Aldrich, St. Louis, MO, USA) were used for the synthesis of graphene sheets and the catalyst powder. The isopropanol (Centrohem, Stara Pazova, Serbia), 5% Nafion (Sigma-Aldrich), and 10 wt.% Pt/C powder (Sigma-Aldrich) was used to prepare the catalyst inks.
2.2. Materials Preparation
2.2.1. Synthesis of Graphene Sheets
Graphene was produced by electrochemically exfoliating a 10 mm wide graphite tape (Burgmann, Wolfratshausen, Germany) in a 0.3 M H2SO4 solution, representing a modification of a previously reported method [25]. Two graphite tapes were connected to opposite poles of a DC power supply, functioning as the anode and cathode, with a gap of around 5 cm between them. Initially, a voltage of 1.0 V was applied for 5 min, which was then increased to 5.0 V and held for 10 min. After this, the polarity of the power supply was reversed every 10 min, alternating the roles of the anode and cathode.
After exfoliation, the resulting solution was filtered, and the filtrate was rinsed with ultrapure water. The filtrate was then dried at 115 °C for several hours to yield electrochemically reduced graphene oxide (el-rGO). This powder was subsequently used to prepare Pt/el-rGO.
2.2.2. Synthesis of Pt/el-rGO
A 250 mL beaker was used to prepare 250 mL of 0.1 M formic acid, to which 75 mg of previously synthesized el-rGO was added. The mixture of el-rGO and formic acid was then subjected to ultrasonic treatment for 30 min. Following this, 5 mL of an H2PtCl6∙xH2O solution (with a concentration of 1.38 mg(Pt)/L, as determined by ICP) was gradually introduced into the beaker. The beaker was placed in a drying oven set at 80 °C, and the H2PtCl6∙xH2O solution was added at a rate of 1 mL every 10 min, with mixing occurring every 5 min. After 5 mL had been added, the mixture was left in the drying oven at 80 °C for an additional hour and then allowed to sit overnight at room temperature. The resulting precipitate was filtered and dried at 80 °C to yield Pt/el-rGO. After drying, the sample mass was 74 mg, and ICP analysis revealed that the catalyst contained 7.5 wt.% of Pt.
2.3. Materials Characterization
The morphologies and microstructure of the pristine el-rGO and Pt-doped el-rGO have been analyzed by transmission electron microscopy (TEM) on a Talos F200X microscope (Thermo Fisher Scientific, Waltham, MA, USA) equipped with an X-FEG source and a maximum accelerating voltage of 200 keV. These studies were carried out utilizing conventional TEM, high-resolution TEM (HR-TEM), and high-angle annular dark-field (HAADF) imaging on a CCD camera supplied with the microscope with a resolution of 4096 × 4096 pixels by the User Interface software package (version 4.17 SP1). The Super-X energy-dispersive X-ray spectrometry (EDS) system with four silicon detectors integrated into the Talos microscope was used in scanning transmission (STEM) mode to perform spatially resolved EDS analysis. For the investigation of the crystalline structure of the samples, the results of the selected area diffraction (SAED) method were combined with the Fast Fourier Transform (FFT) analysis of selected HR-TEM micrographs. Electron-transparent samples for TEM examination were prepared by a standard procedure, where the solid powder was first dispersed into ethanol and then ultrasonicated for 60 min. Thereafter, a droplet of the suspensions was placed on the lacey carbon-support Cu grids, which were allowed to dry in the air.
X-ray diffraction (XRD) measurements were performed using a high-resolution PANalytical X’Pert PRO MPD X-ray powder diffractometer (PANalytical B.V., Almelo, The Netherlands) equipped with an alpha1 configuration (CuKα1 radiation, λ = 1.5406 Å). The diffractograms were collected with a step size of 0.034° and an integration time of 100 s, covering a 2θ range from 5° to 90°, utilizing a fully open X’Celerator scanning detector.
Field emission scanning electron microscopy (FESEM, SCIOS 2 Dual Beam, Thermo Fisher Scientific, Waltham, MA, USA) was used for the characterization of the Pt/el-rGO sample in order to obtain insight into the surface morphology. High-resolution SEM images were recorded at the pressure of 8 × 10⁻⁵ Pa from the chosen micro-areas of the sample surface, using the 6 kV acceleration voltage.
XPS analysis was carried out by SPECS Systems (Berlin, Germany) with XP50M X-ray source for Focus 500 X-ray monochromator and PHOIBOS 100/150 analyzer. The AlKα (1486.74 eV) source at 12.5 kV and 32 mA was used for obtaining spectra. The survey spectrum (1000–0 eV binding energy range) was recorded with a constant pass energy of 40 eV, step size 0.5 eV, and dwell time of 0.2 s in the FAT mode. High-resolution spectra of C1s, O1s, and Pt4f were recorded at a constant pass energy of 20 eV, step size of 0.1 eV, and dwell time of 2 s in the FAT mode. During the analysis, pressure in the chamber was kept at 8 × 10⁻⁹ mbar. All the peak energies are referenced to C1s at 284.8 eV.
2.4. Electrochemical Measurements
Gamry PCI4/300 potentiostat (Gamry Instruments, Warminster, PA, USA) was used to perform electrochemical measurements in a three-electrode cell with a Pt wire as the counter electrode, and a Ag/AgCl (3M KCl) as the reference electrode. All potentials in the manuscript are reported with respect to the used reference electrode. The catalyst ink was prepared by adding 10 mg of the catalyst powder (Pt/el-rGO or Pt/C) with a solvent containing 0.76 mL of water, 0.2 mL of isopropanol, 9 mL of ethanol, and 0.04 mL of Nafion. ICP analysis was conducted on the catalyst ink to precisely determine Pt concentration. The prepared catalyst ink was ultrasonicated for 60 min to fully disperse the catalyst. Finally, all working electrodes, Pt/el-rGO or a benchmark Pt/C electrode, were prepared by drop-casting 20 μL of catalyst ink on a glassy carbon (GC) disc (0.196 cm2) electrode housed in a Teflon holder and dried at room temperature.
All electrochemical measurements were conducted at room temperature in oxygen-free 0.1 M KOH, or in the same solution with the addition of 1 M C2H5OH for ethanol activity and stability measurements. Before each experiment, 10 cyclic voltammograms were recorded on working electrodes from −0.85 V to 0.60 V in 0.1 M KOH. Chronoamperometry (CA) measurements were performed by holding the potential at −0.15 V for 1 h, on both Pt/el-rGO and Pt/C electrodes.
3. Results and Discussion
3.1. TEM Characterization of Pristine el-rGO and Pt/el-rGO Powder
To obtain detailed information on the morphology, microstructure, and dopant incorporation, the pristine el-rGO and Pt-doped el-rGO have been investigated using transmission electron microscopy. The micrographs were captured at low-magnification TEM and high-resolution TEM (HR-TEM), along with the corresponding selected area electron diffraction patterns, and Fast Fourier Transform images.
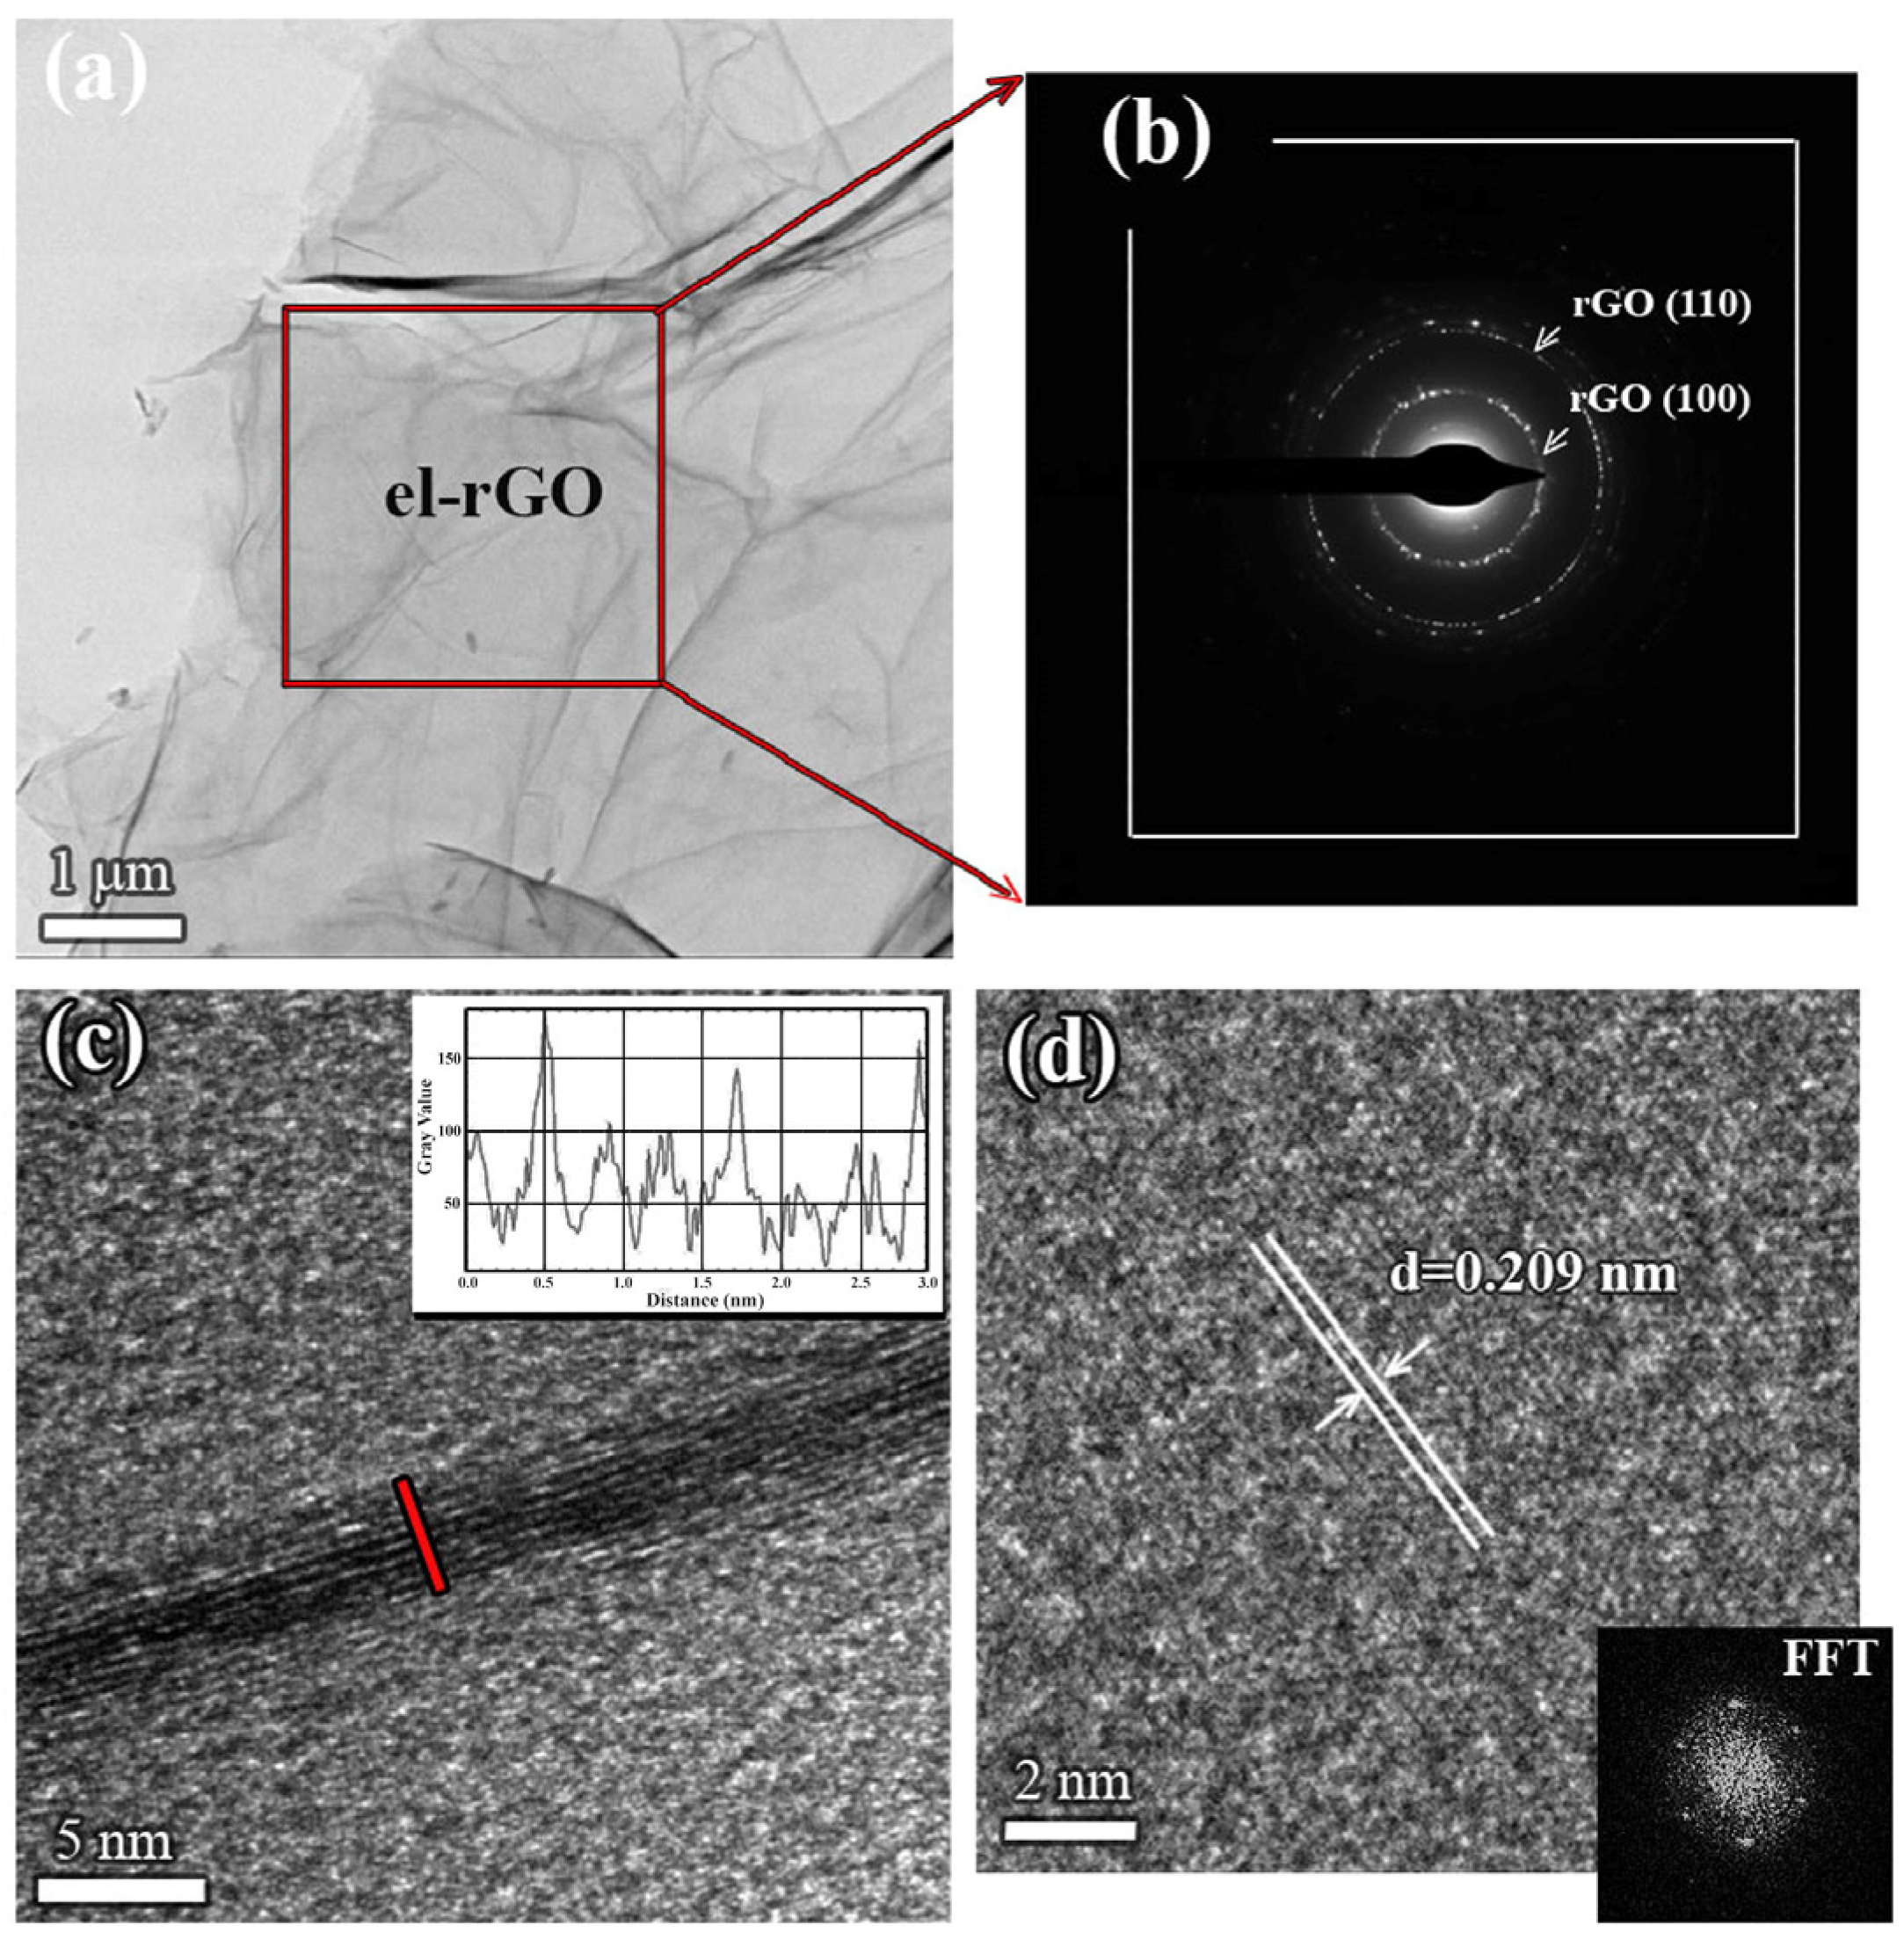
Figure 1a–d presents results obtained for the pristine el-rGO sample. From the low-magnification TEM micrograph, shown in Figure 1a, one observes a large area of very thin el-rGO sheets. The sample is characterized by wrinkles, lateral corrugations, and scrolled morphology, indicating the presence of a predominantly multi-layered structure. The SAED pattern taken from the selected area of the sheet is shown in Figure 1b. The well-defined spots in the diffraction rings of the pattern confirm the crystalline structure of the few-layered el-rGO. From the radii of the rings, we have calculated crystal plane spacings and found the values of 0.209 nm and 0.122 nm, which could be assigned to (100) and (110) planes of the hexagonal carbon lattice structure (PDF card no. 00-041-1487). Although the diffraction peak positions of el-rGO are indistinguishable from those of graphene, the values given above are typically found in the literature [26].

Figure 1.
TEM analysis of pristine el-rGO: (a) low-magnification TEM micrograph of the sample; (b) corresponding SAED pattern taken from the area marked in (a); (c) HR-TEM micrograph presenting the edge of an exemplarily el-rGO sheet showing 8 distinctive mono-layers (marked with the red line), with the line profile given in the inset; and (d) in-plane HR-TEM micrograph of an isolated el-rGO sheet with the measured d-spacing, also showing corresponding FFT pattern in the bottom side of the image.
A closer analysis of the microstructure was performed at higher magnifications. Figure 1c shows an exemplary high-resolution TEM image of the pristine el-rGO sheet. In principle, the flat reduced graphene oxide layers are highly electron transparent and could not be seen by HR-TEM, but one can observe the edges of the sheets, which appear as black fringes in the image. The micrograph reveals bunches of crystalline el-rGO nanosheets, with the sheet’s lateral dimension being significantly larger than its thickness. Based on the contrast imaging, eight separated mono-layers could be easily distinguished, with an average interlayer spacing of 0.355 nm, following previously reported data [27]. This result is supported by the line profile, given in the inset, which was taken across the edge of the multi-layer el-rGO sheet (red line in Figure 1c). From the profile, we were able to determine the thickness of the single layer, which was measured to be ~0.32 nm. Further, to determine the crystalline structure of reduced graphene oxide itself, an in-plane HR-TEM micrograph of one isolated layer was acquired and presented in Figure 1d. The ordered lattice stripes are observable, thus confirming the high crystallinity of the pristine el-rGO. The measured interplanar spacing of 0.209 nm agrees well with (100) planes of the hexagonal carbon lattice structure, as already seen and stated in the SAED pattern above (see Figure 1b). Corresponding FFT analysis taken from the HR-TEM micrograph of a single el-rGO sheet was presented in the inset of the image. Like graphene, the sample exhibits a diffraction pattern of the regular atomic arrangement with the hexagonal crystal structure typical for the honeycomb lattice [28].
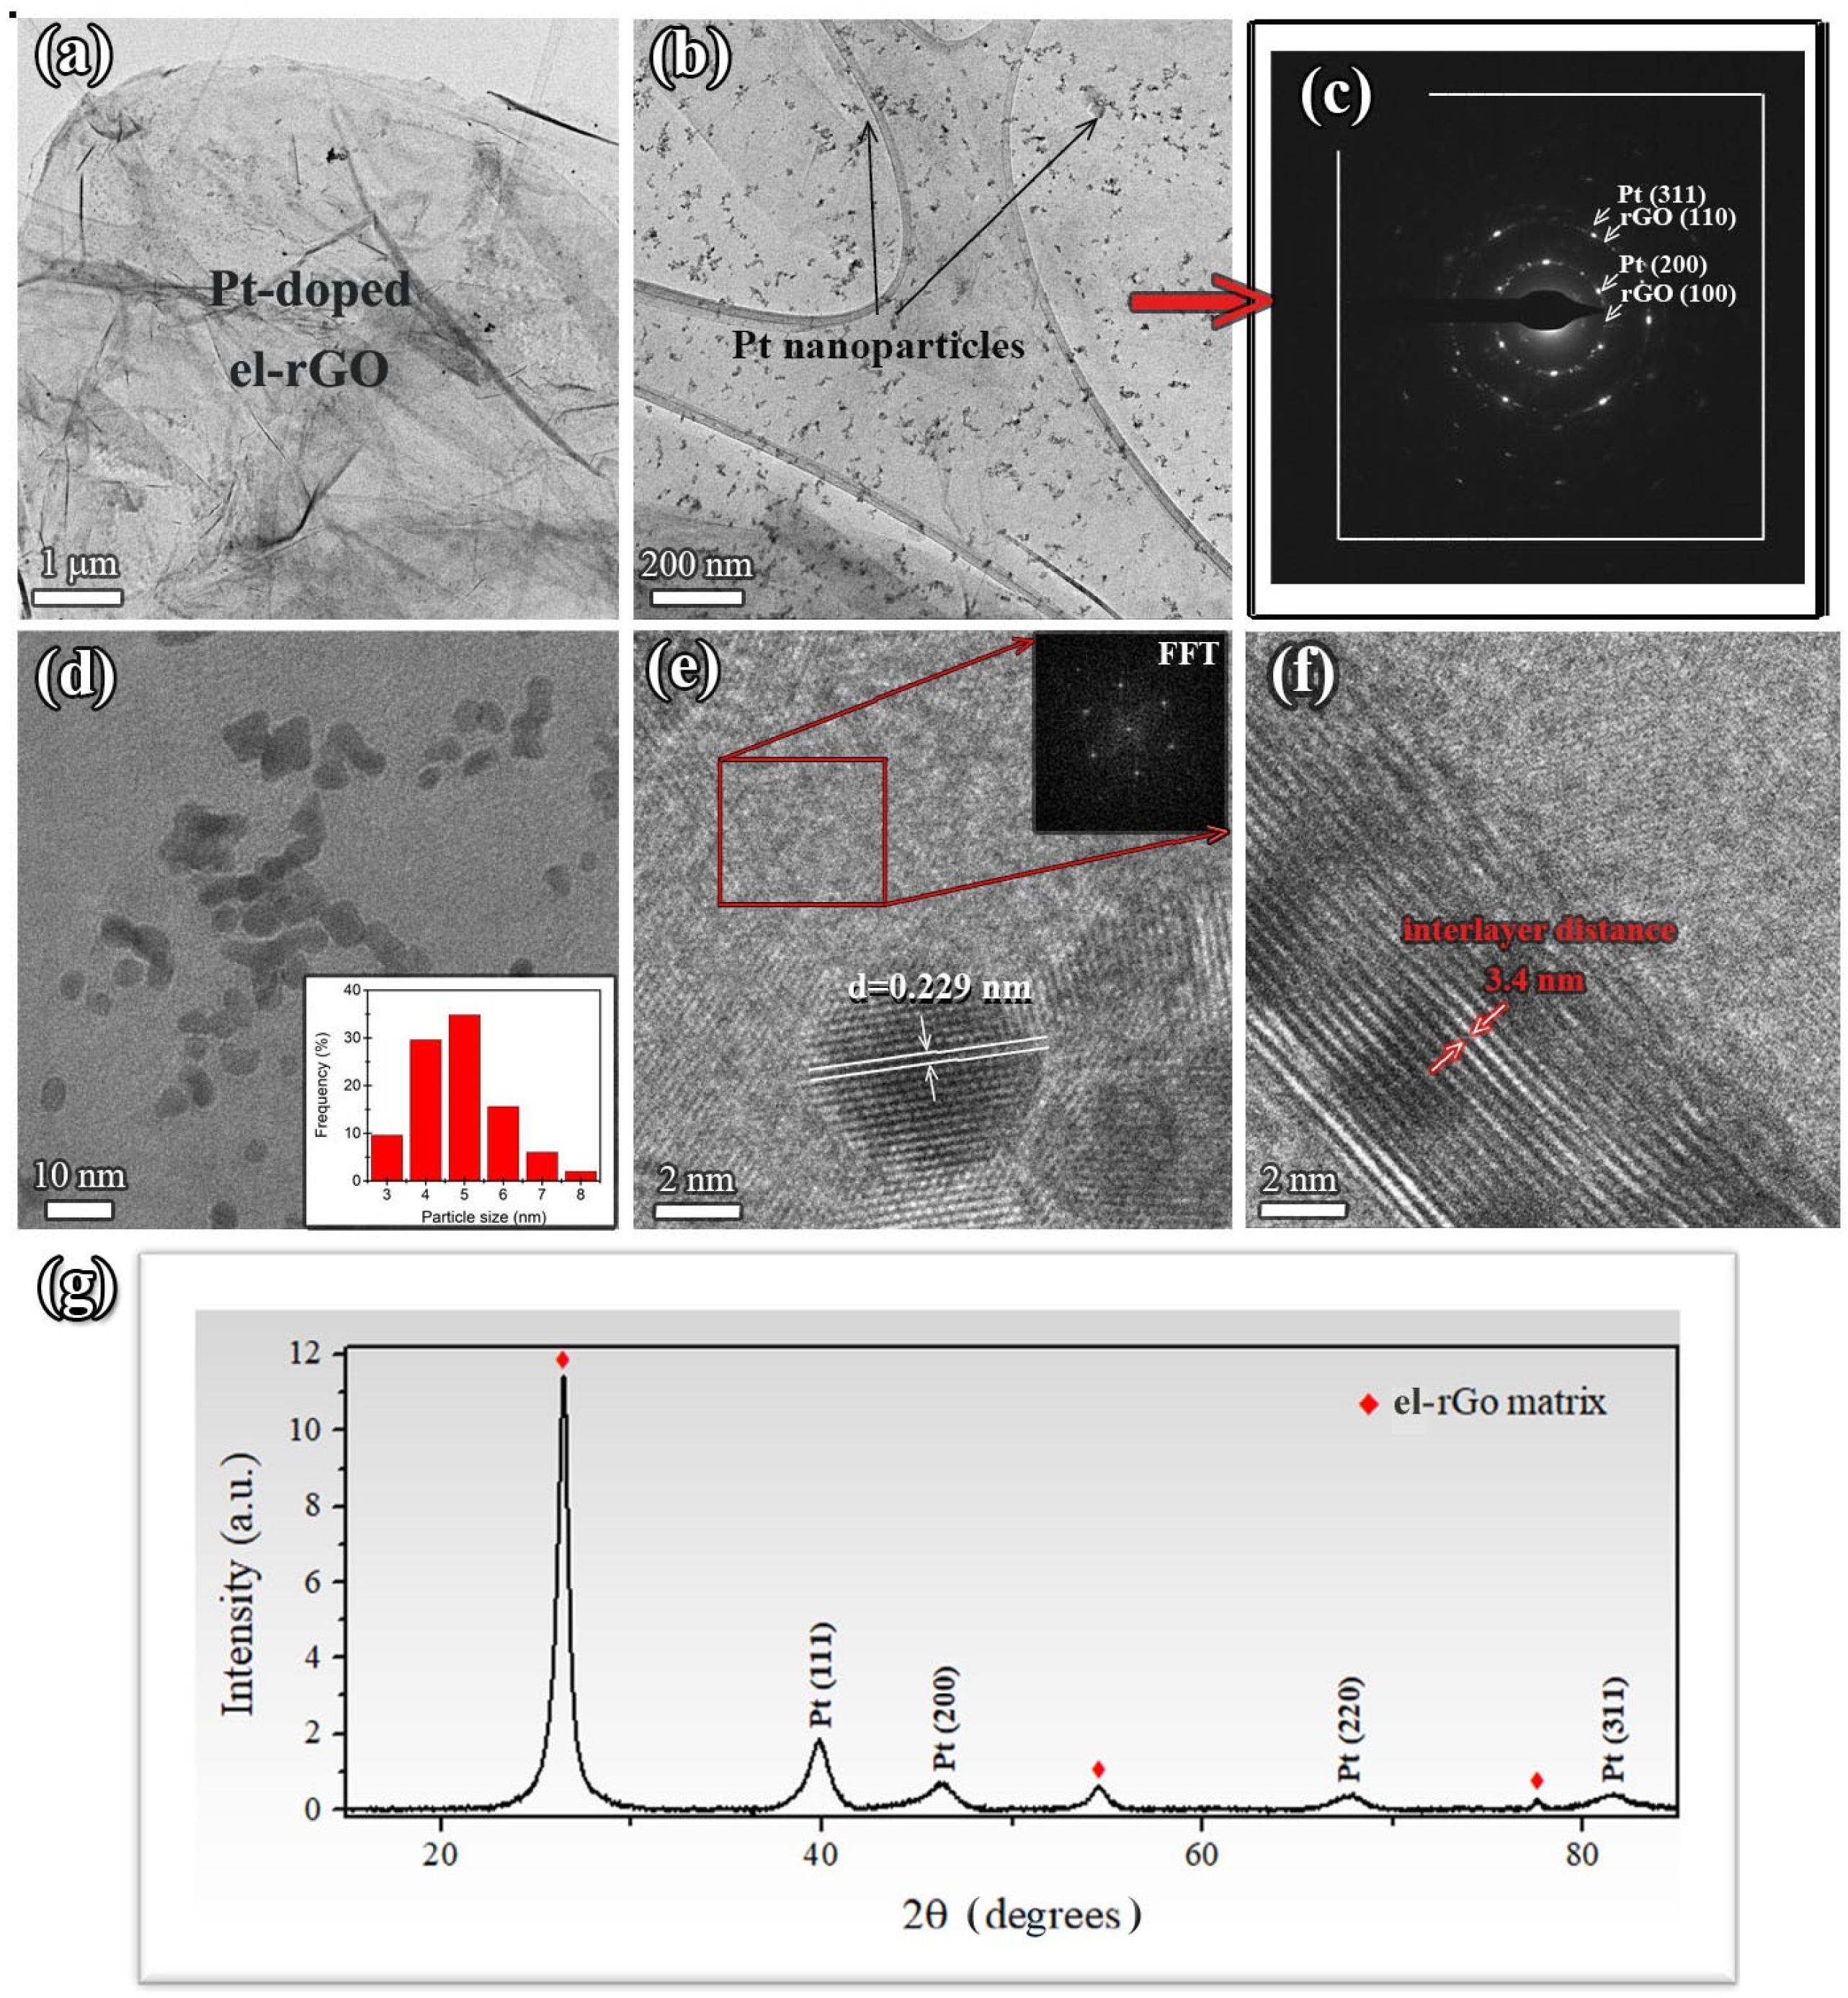
The TEM results of the platinum-doped el-rGO sample are presented in Figure 2. In the low- and high-magnification TEM images (Figure 2a,b), it is seen that the flattened Pt-doped el-rGO sheets are randomly stacked together, displaying a multi-layered structure similar to the pristine sample. This suggests that Pt doping has little influence on the el-rGO surface morphology. Under the conditions used here, one observes dark spots in the sample (see Figure 2b), presenting Pt particles dispersed on the sheets’ surface. Indeed, the presence of metal nanoparticles is confirmed by the electron diffraction analysis, as shown in Figure 2c. Apart from the spots that originate from the crystalline structure of the el-rGO matrix, extra reflections with d-spacing 0.194 nm and 0.115 nm are observable, which are characteristic of (200) and (311) crystal planes of face-centered cubic (FCC) crystal structure of Pt (PDF-2 card no. 01-070-2057).

Figure 2.
Microstructural analysis of Pt-doped el-rGO: (a–c) low- and high-magnification TEM micrographs of the sample with corresponding SAED pattern (Pt particles are seen as dark spots in (b) distributed over the el-rGO surface); (d) an enlarged section of the sample presenting a large number of Pt nanoparticles with histogram of particle size distribution in the inset; (e) HR-TEM micrograph with measured d-spacing of one isolated nanoparticle and FFT image presenting crystal structure of the surrounding matrix; (f) HR-TEM micrograph of the edge of the respective el-rGO sheet with the measured interlayer distance; and (g) a representative XRD diffractogram of the sample.
The particle size distribution was determined and presented in a histogram in Figure 2d. As can be seen, the particles are fairly monodispersed with a very narrow size distribution, ranging in diameter from 3.5 nm to 5.5 nm, on average. The representative HR-TEM micrograph of the el-rGO matrix with the metal nanoparticles is presented in Figure 2e. Well-defined lattice fringes are visible in particles, thus confirming they are crystalline. For this particular case, the measured value of d-spacing of 0.229 nm corresponds to interplanar distances of (111) crystal planes, typically found for FCC structure of metallic platinum. In addition, from the FFT image (inset in Figure 2e), one can observe that the hexagonal crystal structure of the el-rGO matrix was preserved, where the measured d-spacings for characteristic (100) and (110) crystal planes of 0.208 nm and 0.121 nm, respectively, were similar to those found for the pristine el-rGO. In addition, from the HR-TEM image in Figure 2f, the distance between adjacent layers of el-rGO was measured and found to be 0.34 nm, which is very close to the interlayer spacing of graphene (0.335 nm) [29]. Similar behavior was observed and reported earlier by Duan et al. [30] in their experiment on S and N co-doping of rGO. The authors stated that the reduction in spacing between separate mono-layers comes from the stronger stacking of graphene basal planes due to the removal of some oxygen groups during the incorporation of dopants. Figure 2g presents the representative XRD diffractogram of the platinum-doped rGO sample. The diffractogram displays intense peaks characteristic of the rGO matrix (PDF card no. 00-041-1487), indicating its highly crystalline nature. Additionally, peaks corresponding to the (111), (200), (220), and (311) crystal planes of Pt (PDF-2 card no. 01-070-2057) are observed at 2θ angles of 39.80°, 46.26°, 67.65°, and 81.44°, confirming the formation of platinum nanocrystals within the sample.
In addition to TEM imaging of the Pt-doped el-rGO sample, an alternative analysis by scanning transmission electron microscopy was also provided, together with EDS microanalysis of the same sample, as shown in Figure 3.

Figure 3.
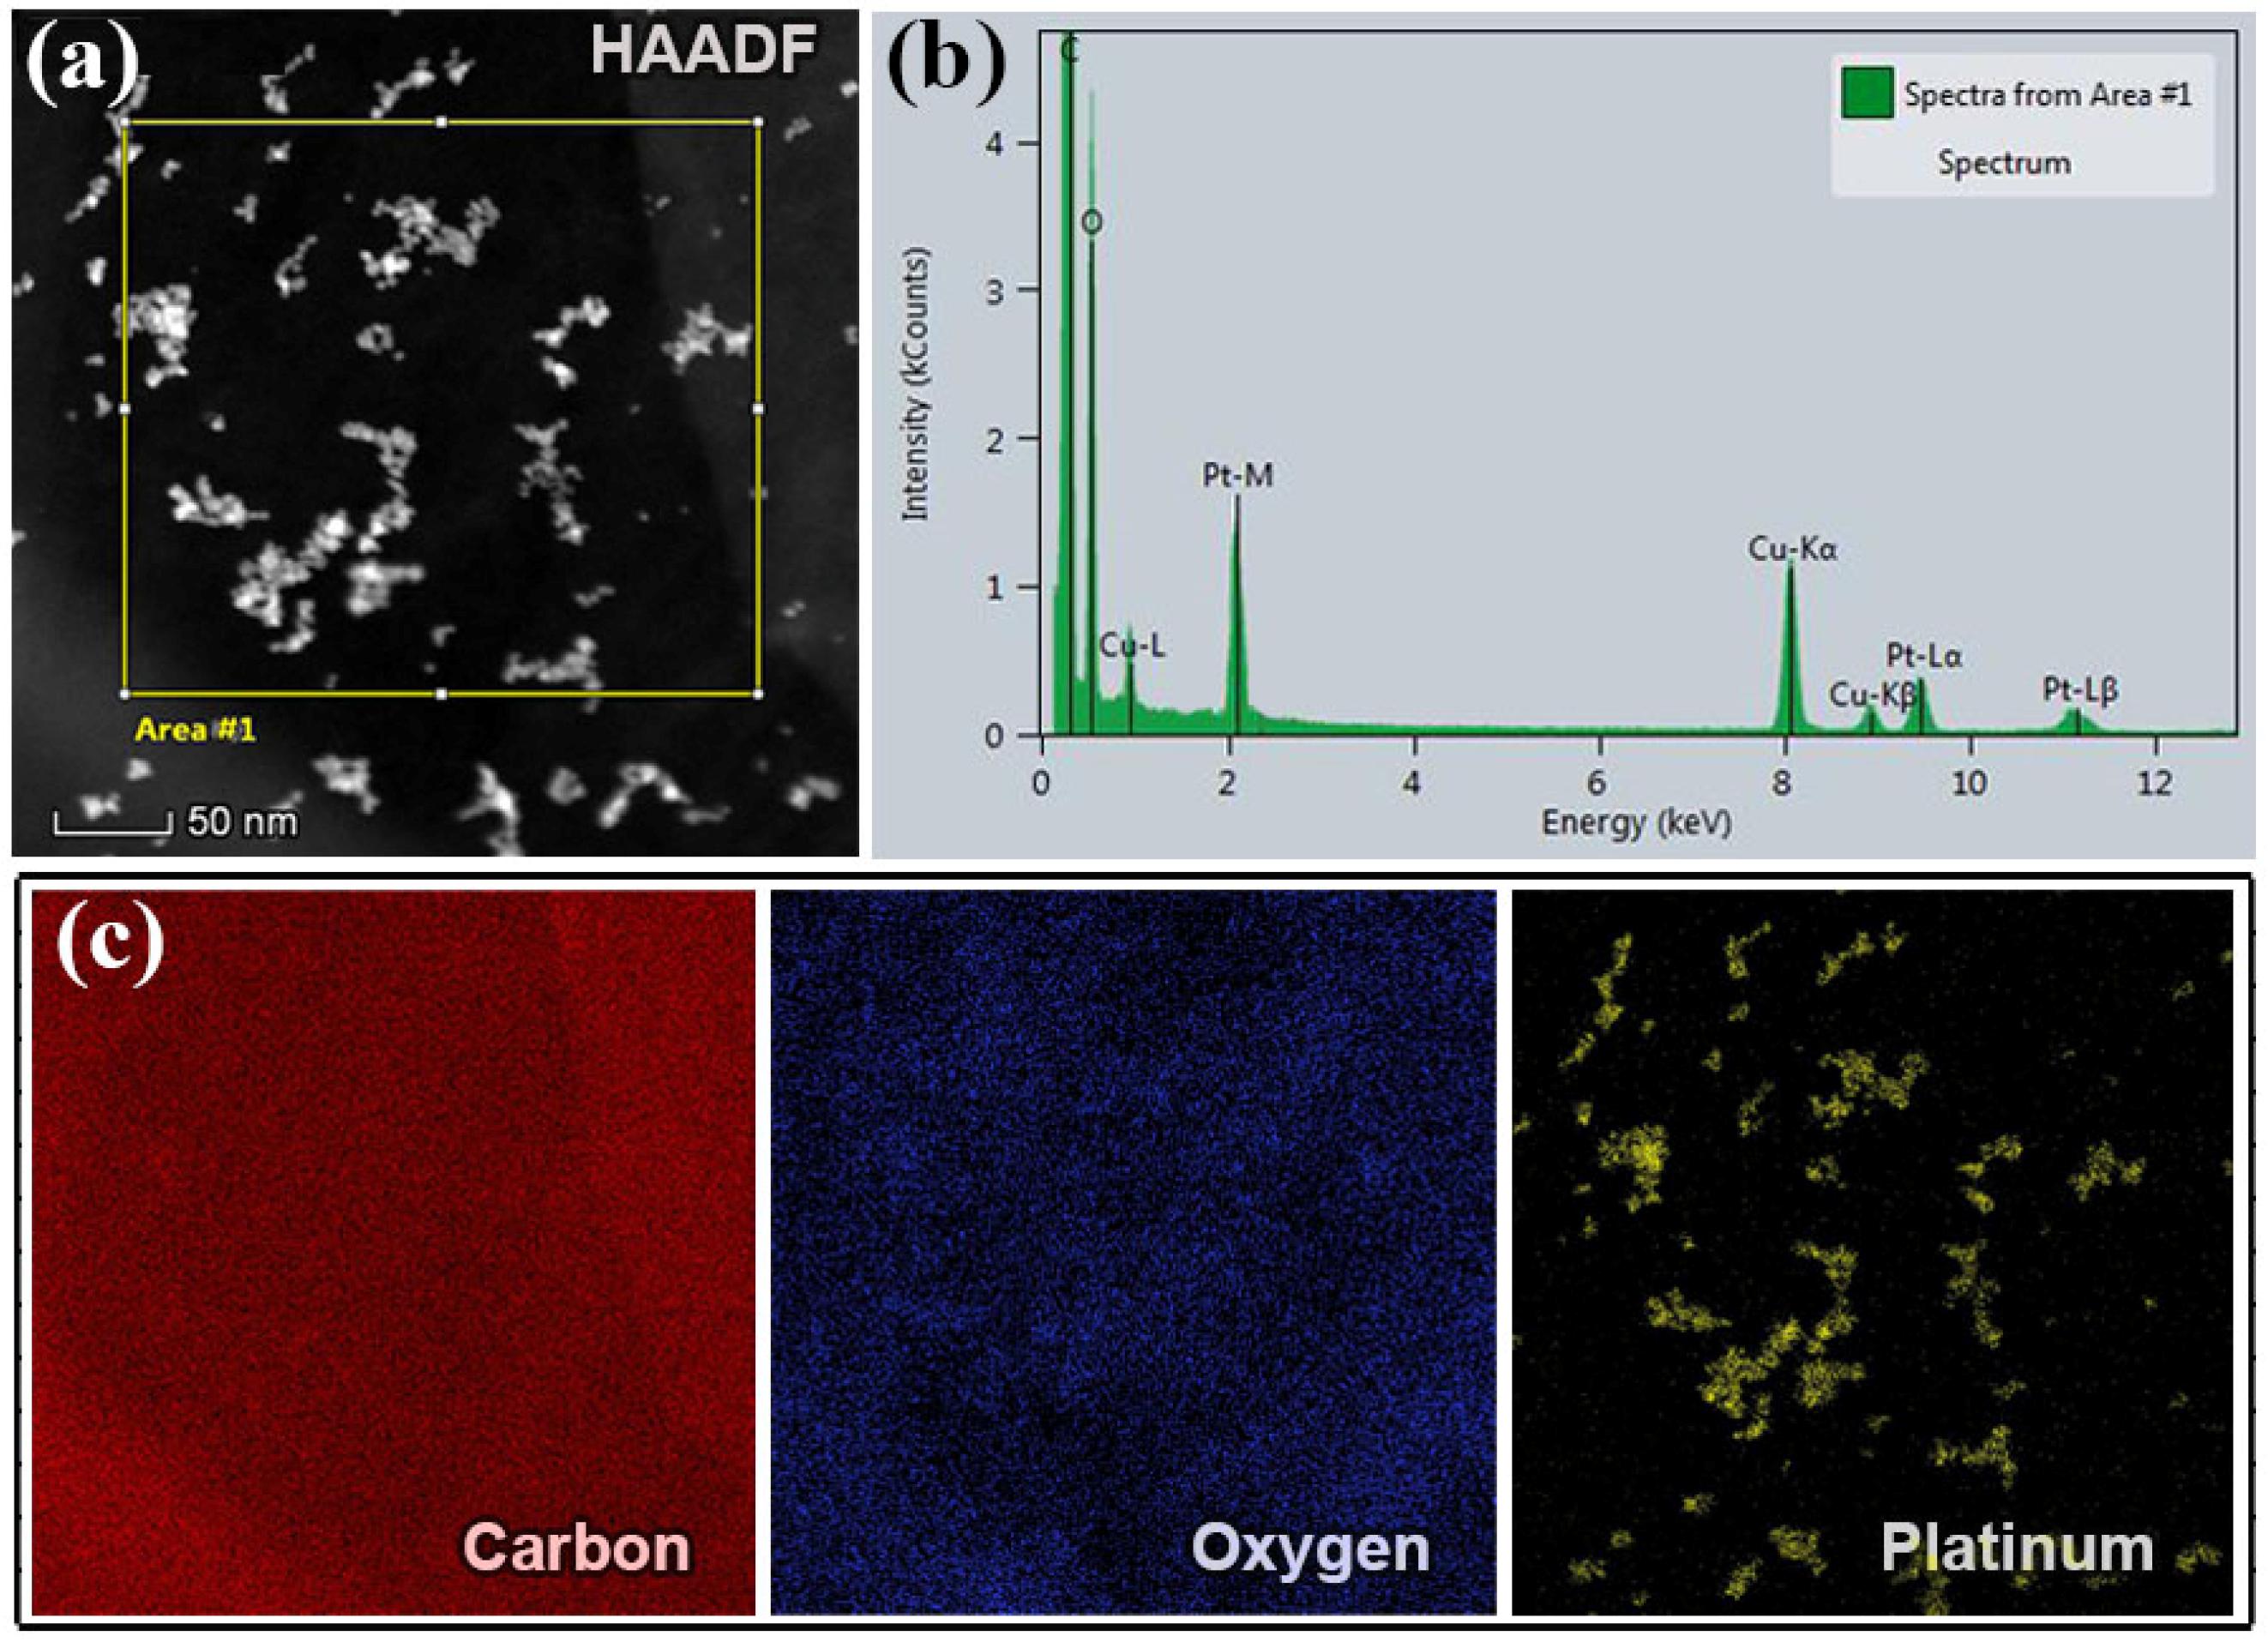
STEM analysis of Pt-doped el-rGO: (a) STEM-HAADF image presenting Pt particles as bright spots surrounded by a dark matrix; (b) respective EDS spectrum of the sample corresponding to the sample’s area marked with a rectangular in the HAADF image; and (c) EDS maps of carbon, oxygen, and platinum highlighted with red, blue, and yellow colors, respectively.
Figure 3a shows an exemplary STEM-HAADF micrograph acquired from a large area of one respective el-rGO sheet. Due to the strong Z-contrast Pt nanoparticles in the HAADF image appeared as very bright spots, surrounded by a dark matrix. The presence of Pt was confirmed by the results of energy-dispersive X-ray spectrometry measurements. A typical EDS spectrum taken from the area marked with rectangular in the HAADF image in (a) was presented in Figure 3b. The most intense maximum at 280.0 eV belongs to the characteristic K line of carbon, whereas the peak at 524.0 eV originates from the K line of oxygen. Furthermore, three additional maxima at positions of 2.05 keV, 9.44 keV, and 11.07 keV came from different K, L, and M lines of platinum, respectively (note that the extra peaks in the spectrum that belong to copper came from the TEM grid and could be excluded). From the STEM-EDS analysis, it was found that the sample contained 95.28 at.% (87.59 wt.%) C and 4.24 at.% (5.19 wt.%) O, while platinum was doped with 0.48 at.% (7.22 wt.%) in the sample, which is very close to the loading determined using ICP-MS (7.5 wt.%). The elemental maps given in Figure 3c were acquired by using K and L line spectra, where different colors were associated with different elements. The red, blue, and yellow color micrographs correspond to C, O, and Pt elements, respectively. According to the EDS mapping images, it is visible that Pt particles are evenly distributed over the el-rGO sheets.
3.2. SEM Characterization of Pt/el-rGO Electrode
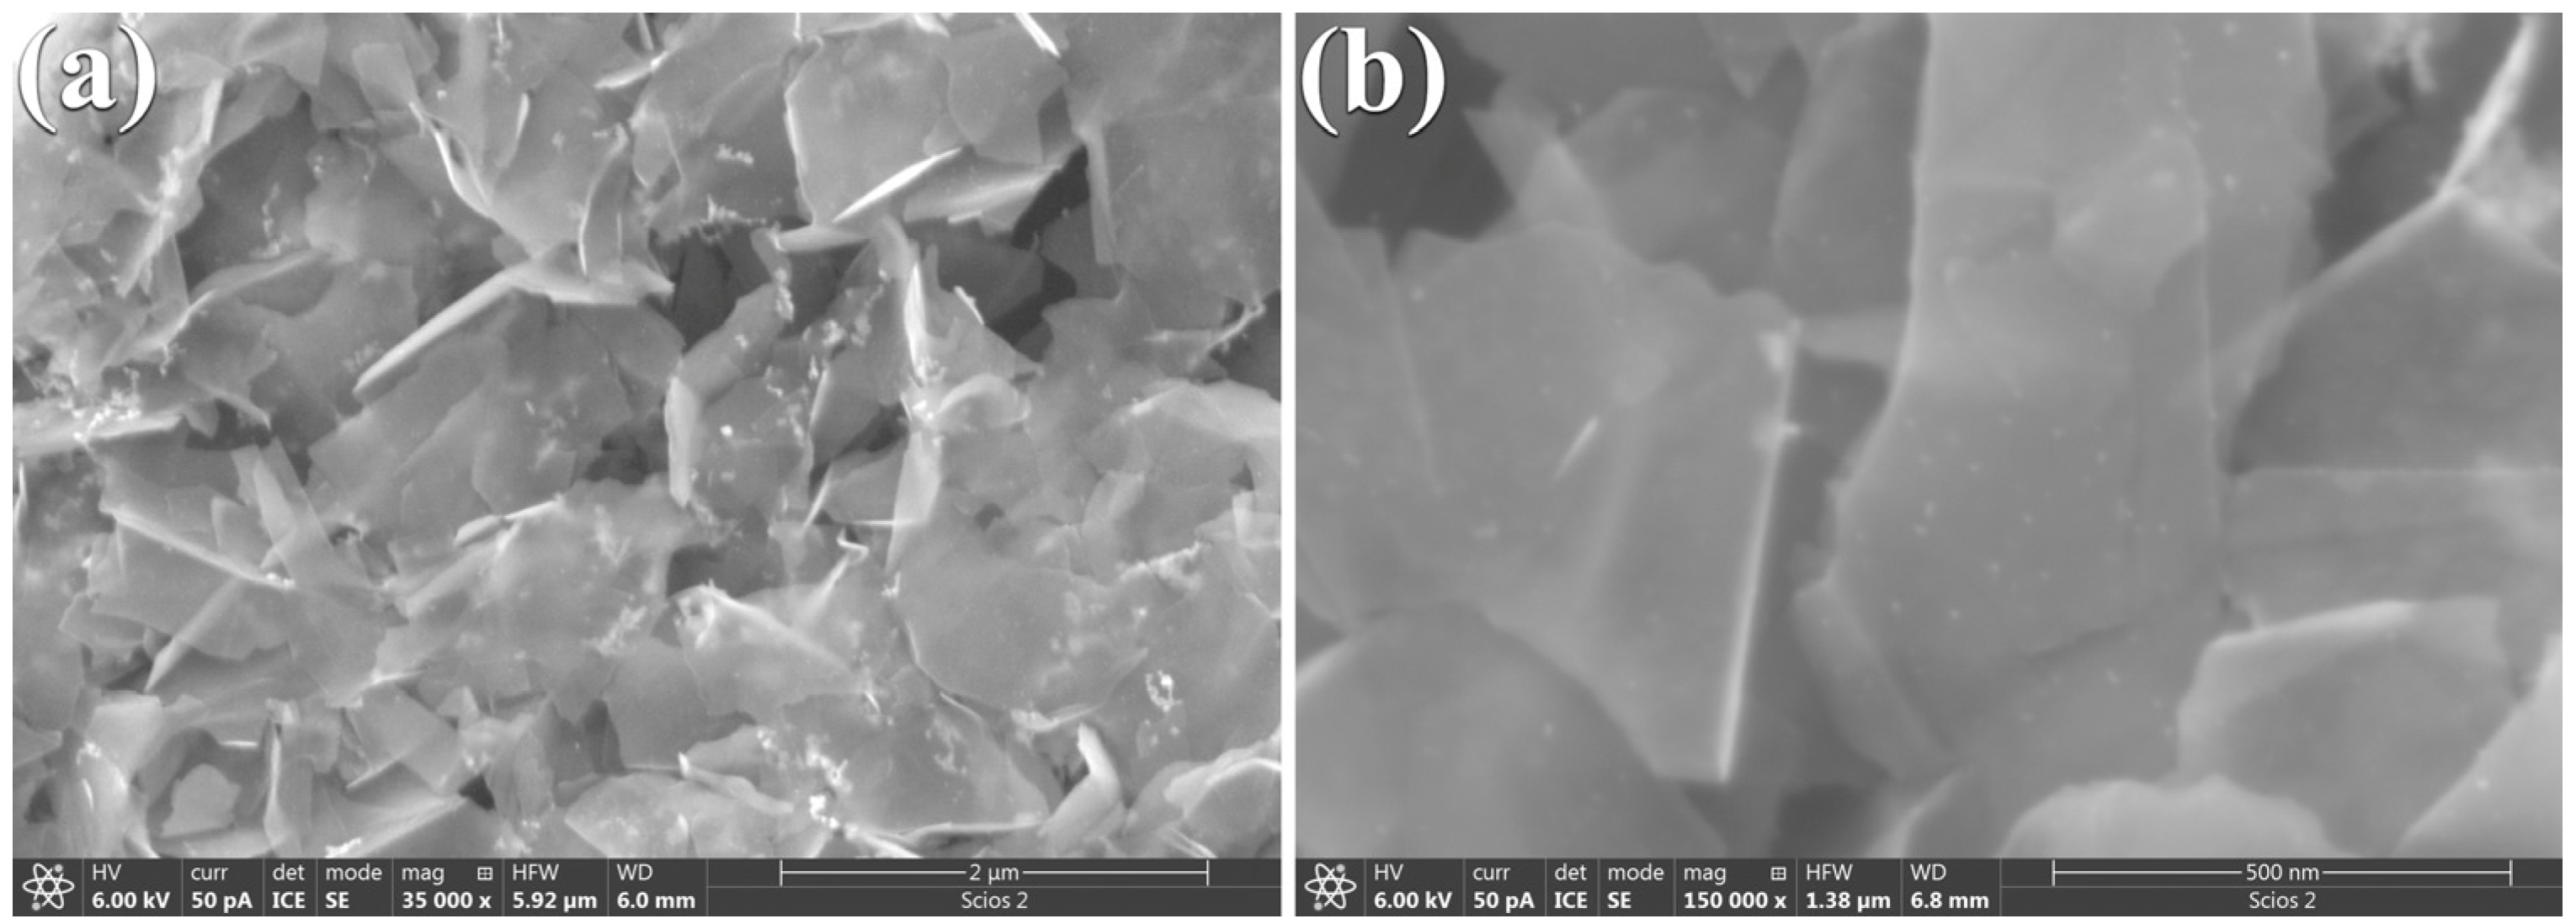
The morphology of the freshly prepared Pt/el-rGO electrode was examined using FESEM microscopy, and the resulting high-resolution micrographs are displayed in Figure 4. These images show that the synthesized graphene (el-rGO) is present in the form of sheets of various sizes, with widths and heights reaching up to 500 nm and 1.3 μm, respectively. As can be seen from Figure 4a graphene sheets are highly transparent, indicating that they are composed of only a few layers of graphene. Additionally, the sheets appear wrinkled with no significant stacking. In addition, bright spots in the images can be noticed as well, suggesting the reduction of Pt nanoparticles on el-rGO sheets, forming agglomerated structures, as shown in Figure 4a. A closer inspection of the analyzed sample, as shown in Figure 4b, reveals that Pt nanoparticles are finely dispersed across the graphene surface, alongside the agglomerated formations.

Figure 4.
FESEM micrographs of Pt/el-rGO obtained at different magnifications: (a) 35 kx and (b) 150 kx.
3.3. XPS Characterization of Pt/el-rGO Electrode
XPS spectra recorded for the Pt/el-rGO sample are shown in Figure 5. The survey spectrum (Figure 5a) confirms the presence of C, O, and Pt originating from Pt/el-rGO, as well as F, K, and N, which come from Nafion used to prepare the catalyst ink. On the other hand, advanced study of the main photoelectron lines offers more information about the chemical properties of the sample. In that sense, high-resolution XPS spectra of C1s, O1s, and Pt4f lines are recorded and shown in Figure 5b–d, along with the results of the related fits.
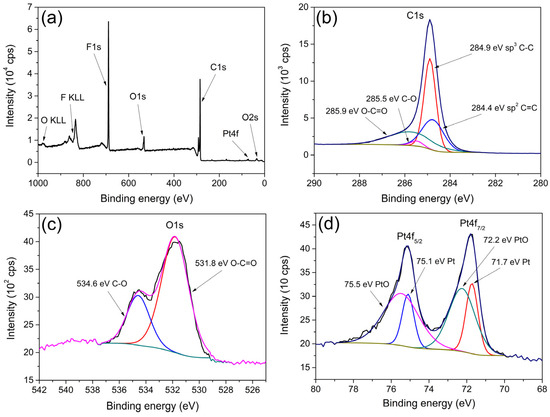
Figure 5.
XPS spectra of Pt/el-rGO: (a) survey spectrum; high-resolution spectra of (b) C1s, (c) O1s, and (d) Pt4f.
The C1s line (Figure 5b) has been resolved into four contributions that are typical for graphene. Peaks at 284.4 eV, 284.9 eV, 285.5 eV, and 285.9 eV can be assigned to sp2 C=C, sp3 C-C, C-O, and O-C=O bonds, respectively [31,32]. A low amount of oxygen-containing components and a low percentage of oxygen present in the sample indicate that the graphene is highly reduced. The high-resolution spectrum of the O1s line, together with the fitting results, is depicted in Figure 5c. As can be observed, two contributions at 531.8 eV and 534.6 eV are related to O-C=O and C-O, respectively. The Pt4f spectrum (Figure 5d) shows characteristic doublet peaks corresponding to Pt4f7/2 and Pt4f5/2 and is deconvoluted into four contributions originating from two different components. Peaks at 71.7 eV and 75.1 eV come from metallic Pt, while peaks at 72.2 eV and 75.5 eV are from oxidized PtO [31,32]. The ratio of metallic to oxidized Pt is 29.3% to 70.7%, indicating that the majority of Pt is in the oxide Pt2+ state.
3.4. Ethanol Oxidation Reaction at Pt/el-rGO Electrode
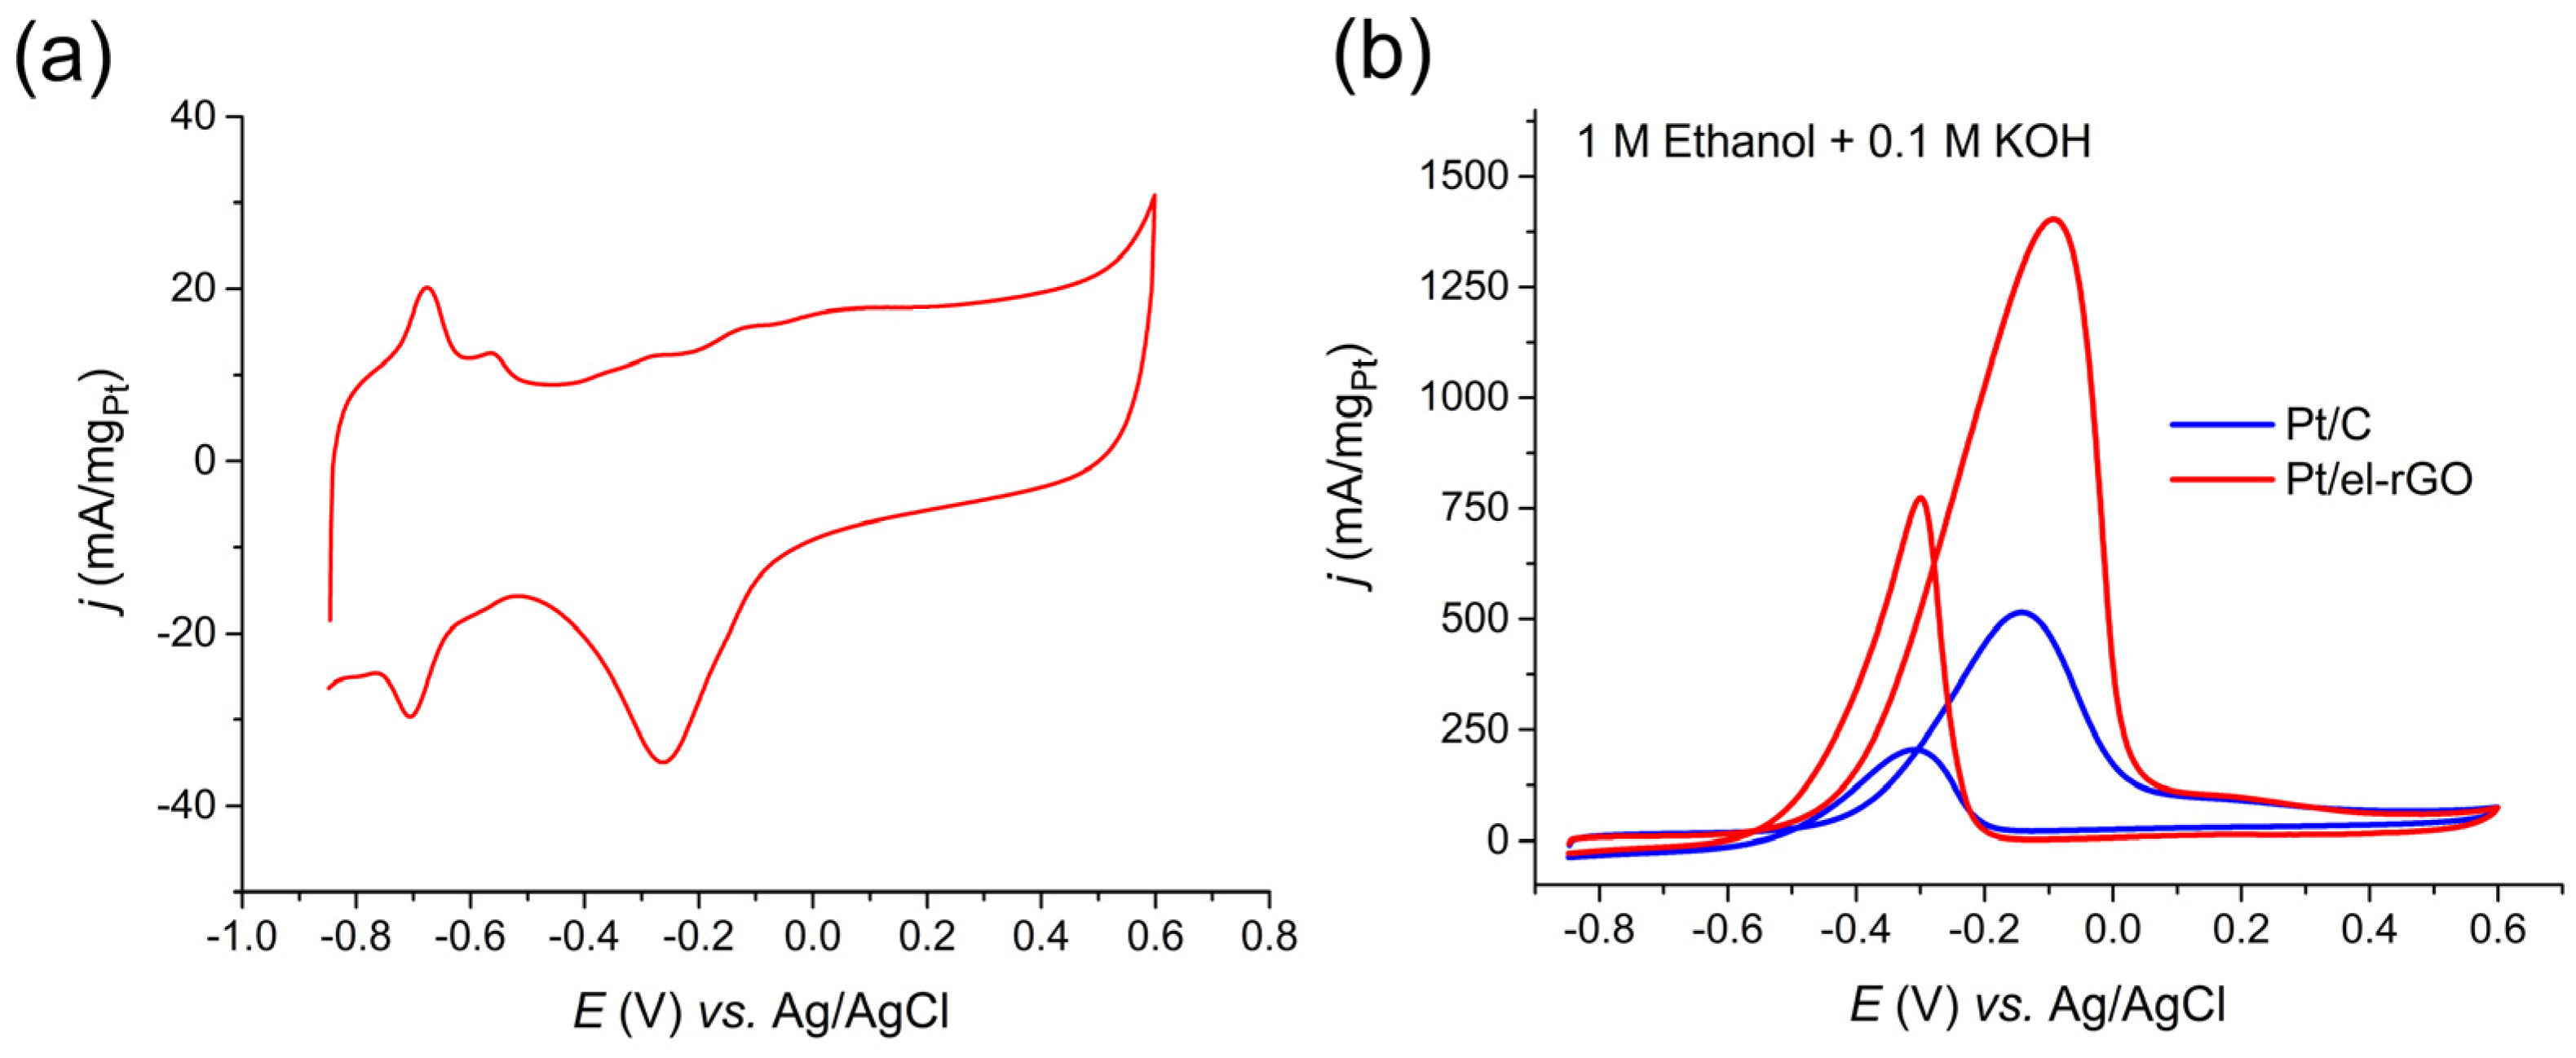
Electrochemical characterization and EOR activity tests on Pt/el-rGO catalyst are presented in Figure 6. Cyclic voltammetry of obtained Pt/el-rGO was recorded in 0.1 M KOH solution at 50 mV/s in the potential range from −0.85 V to 0.6 V. Typical Pt-based catalyst processes, such as hydrogen adsorption/desorption, reversible OH- adsorption/desorption, and irreversible Pt surface oxidation/reduction, can be observed. A similar CV curve was obtained in our previous paper on Pt(poly) electrode in the same electrolyte [33]. In the potential window of the hydrogen adsorption/desorption process, two pairs of peaks at approximately −0.58/−0.56 V and −0.70/−0.68 V are evident in the cathodic/anodic scan direction originating from hydrogen adsorption/desorption on the Pt(100) and Pt(110) planes, respectively [34]. According to the CV curve of the Pt/el-rGO electrode, the reversible OH- adsorption begins at approx. −0.50 V, and continues with Pt oxide formation on higher potentials. The oxide reduction peak appears at −0.26 V.

Figure 6.
(a) Electrochemical characterization of Pt/el-rGO by cyclic voltammetry recorded in 0.1 M KOH solution at 50 mV/s; (b) CV curves of EOR on Pt/el-rGO (red line) and Pt/C (blue line) catalysts recorded in 1 M C2H5OH + 0.1 M KOH solution at 50 mV/s.
EOR activity of Pt/el-rGO was investigated using cyclic voltammetry in 1 M C2H5OH + 0.1 M KOH solution and compared with Pt/C benchmark with similar loading (10 wt.%), as shown in Figure 6b. It can be observed that the EOR on the Pt/el-rGO catalyst begins around the potential of −0.67 V, which is 70 mV more negative than the initial potential obtained for the commercial Pt/C catalyst used as reference material in this study. Also, the maximum EOR current for the Pt/el-rGO catalyst is around 2.7 times higher than for the Pt/C reference and is placed at the potential of around −0.1 V. According to the CV from Figure 6a, this potential corresponds to the region where reversible OH- adsorption and PtO formation ends and the formation of higher Pt oxides begins. Notably higher mass utilization of supported Pt was obtained in the case of el-rGO support, which is very important keeping in mind the high price and low abundance of Pt.
It is established that the presence of adsorbed OH- species at the Pt surface is crucial in initiating and facilitating EOR [35,36]. As discussed in connection to Figure 6a, the cyclic voltammogram of the Pt/el-rGO electrode indicates the existence of Pt(100) and Pt(110) planes, on which the reversible adsorption of OH- ions may start at more negative potentials, even in the Hupd potential region [34], which corresponds to the onset EOR potential at the Pt/el-rGO catalyst. The influence of the el-rGO substrate should be also considered, as OH- functional groups on rGO could contribute to facilitating EOR. The presence of OH- species on the catalyst’s surface helps promote ethanol dehydrogenation in the first step of the reaction mechanism and reduces CO poisoning susceptibility [35,36]. In addition, the presence of other functional groups on graphene could induce electronic interaction with supported Pt sites leading to improved ethanol dehydrogenation step [35].
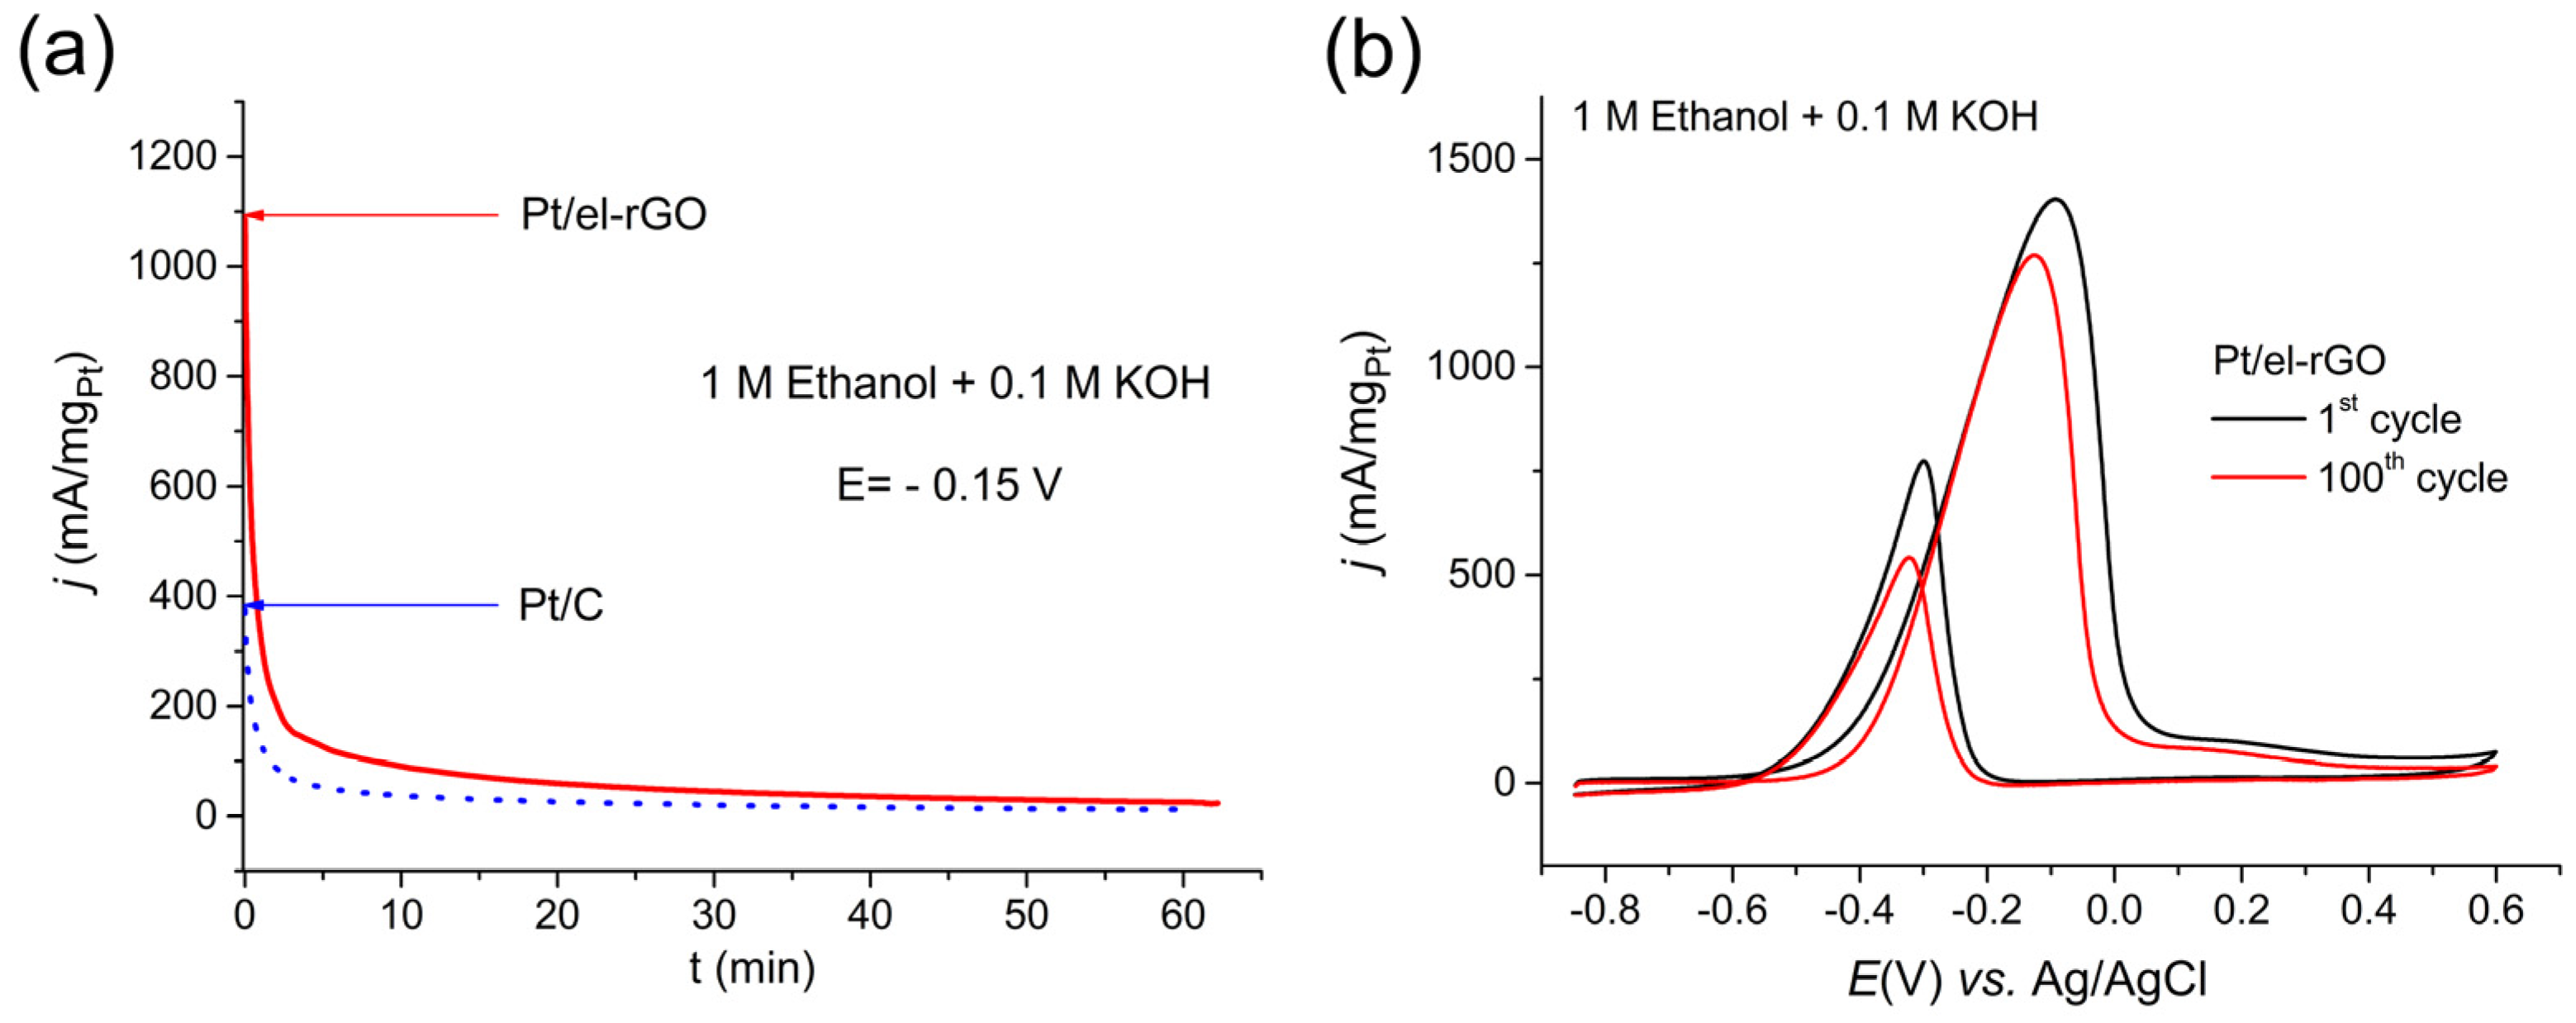
The stability of the Pt/el-rGO catalyst was tested in two different experimental approaches, namely by recording the chronoamperometric curve at a constant potential and by recording multiple CV curves, as shown in Figure 7. Along with the CA curve for the Pt/el-rGO catalyst in Figure 7a, a curve for the Pt/C catalyst is also shown for comparison. Even on these CA curves, looking at the initial values of the obtained currents, an enhanced EOR catalysis on the Pt/el-rGO electrode is evident compared to the Pt/C benchmark. Although the current values of the catalysts are different, the shapes of the curves, i.e., the behavior of the catalysts are similar. In the first few minutes, a rapid drop in current values can be observed, which then slows down after around 10 min. The decrease in current values on both catalysts is expected due to the “poisoning” of electrode surfaces, which is one of the biggest issues in the development of catalysts for DEFCs [5,35]. Namely, Pt catalysts suffer from the strong adsorption of the carbonaceous EOR intermediates, with CO being the most problematic one. The adsorbed CO blocks the catalyst surface and decreases the number of active sites for further reaction enrolling. Applied potential hold led to the production of strongly adsorbed CO (and possibly other intermediates) on both Pt catalysts in a similar fashion, leading to the evident decay of EOR activity. For practical application, the poisoning issues must be addressed, for instance, by adding foreign metals to Pt catalysts to improve CO tolerance. A well-known strategy that can be used to address the poisoning is the addition of foreign metals (like Ru, Pd, Sn, Au, etc.) to improve Pt CO tolerance [35,36,37,38]. On the other hand, only a slight decrease in the activity of the Pt/el-rGO catalyst occurred after the potentiodynamic degradation test, as shown in Figure 7b. This can be explained by the fact that strongly adsorbed CO (and other reaction intermediates) is effectively completely removed from the Pt sites during the backward voltammetric scan (as evident by the existence of the backward peak during EOR), restoring the initial EOR activity. Overall, it can be concluded that the Pt/el-rGO composite outperformed Pt/C in terms of EOR activity, while in terms of CO tolerance, these materials performed similarly. Intrinsically, the EOR activity of the Pt/el-rGO composite remained preserved over the potentiodynamic degradation test.

Figure 7.
(a) Chronoamperometric curves of Pt/el-rGO (red line) and Pt/C (blue line) electrodes recorded in 1 M C2H5OH + 0.1 M KOH solution at a constant potential of −0.15 V; (b) CV curves for EOR on Pt/el-rGO catalyst, before (black line) and after (red line) electrode cycling in 1 M C2H5OH + 0.1 M KOH solution at 50 mV/s.
In the end, it should be mentioned that the common materials used to run EOR in DEFCs are based on Pt (and Pd) alloys with more oxophilic metals, such as Ru, Sn, Bi, etc. [39,40]. These bimetallic catalysts benefit from the reduced adsorption strength of CO on Pt sites and the lower potential of OH- adsorption on the more oxophilic foreign metal sites, which together improve the EOR activity. Having that in mind, our future work will focus on the synthesis and investigations of various bimetallic catalysts for EOR, based on the Pt/el-rGO catalyst presented in this work.
4. Conclusions
This work demonstrates a feasible approach for the preparation of a composite consisting of Pt nanocatalysts supported on electrochemically exfoliated graphene oxide with high EOR activity. Bare el-rGO support and Pt/el-rGO catalyst were thoroughly characterized using TEM, XRD, XPS, and SEM techniques to obtain insights into their morphology, microstructure, and composition. TEM imaging revealed the multi-layered crystalline structure of the rGO and demonstrated the successful incorporation and uniform dispersion of Pt nanoparticles on the el-rGO sheets, which was additionally confirmed by XRD analysis. SEM further supported these findings, showing well-dispersed Pt nanoparticles on the graphene surface. XPS analysis indicated that the graphene is highly reduced, with a significant proportion of Pt present in the oxidized state. These results collectively confirm the effective synthesis and doping of Pt on el-rGO, highlighting the material’s potential for electrocatalytic applications. The electrochemical characterization and EOR tests demonstrated that the Pt/el-rGO catalyst exhibits superior catalytic activity compared to the commercial Pt/C benchmark. The Pt/el-rGO catalyst not only initiated EOR at a more negative potential but also achieved 2.7 times higher mass normalized currents, indicating improved mass utilization of supported Pt sites. The stability tests revealed that both Pt/el-rGO and Pt/C catalysts suffer from CO poisoning, a well-known issue with Pt catalysts in DEFCs. On the other hand, the Pt/el-rGO composite showed only a slight decrease in EOR activity after extended potential cycling, suggesting good intrinsic durability and ability to recover CO-blocked active sites at cathodic potentials. Overall, the Pt/el-rGO catalyst outperforms the Pt/C benchmark in EOR activity, making it a promising candidate for fuel cell applications. The presented methodology to produce electrochemically exfoliated graphene and to decorate it with low amounts of Pt can be extended to a variety of other electrocatalytic processes and thus presents a platform with versatile potential applications.
Author Contributions
Conceptualization, I.S., A.M. and M.S. methodology, I.S. and A.M.; investigation, I.S., A.M., L.R., M.N., J.P. and S.Ž.; resources, I.S. and A.M.; data curation, I.S., A.M., J.P., L.R. and S.Ž.; writing—original draft preparation, I.S., M.S., M.N. and J.P. writing—review and editing, I.S., A.M. and M.S.; visualization, I.S. and M.S.; supervision, I.S. and M.S.; project administration, I.S. and A.M.; funding acquisition, I.S. and A.M. All authors have read and agreed to the published version of the manuscript.
Funding
This research was funded by the Ministry of Science, Technological Development and Innovation of the Republic of Serbia (contract no. 451-03-66/2024-03/200017).
Institutional Review Board Statement
Not applicable.
Informed Consent Statement
Not applicable.
Data Availability Statement
The original contributions presented in the study are included in the article, further inquiries can be directed to the corresponding authors.
Conflicts of Interest
The authors declare no conflict of interest.
References
- Berdysheva, S.; Ikonnikova, S. The Energy Transition and Shifts in Fossil Fuel Use: The Study of International Energy Trade and Energy Security Dynamics. Energies 2021, 14, 5396. [Google Scholar] [CrossRef]
- Jacobs, M. Global Fossil Fuel Economy: Historical Trajectories and Future Challenges. In Affordable and Clean Energy; Leal Filho, W., Marisa Azul, A., Brandli, L., Lange Salvia, A., Wall, T., Eds.; Springer International Publishing: Cham, Swizterland, 2021; pp. 709–719. ISBN 978-3-319-95864-4. [Google Scholar]
- Carrette, L.; Friedrich, K.A.; Stimming, U. Fuel Cells—Fundamentals and Applications. Fuel Cells 2001, 1, 5–39. [Google Scholar] [CrossRef]
- Ong, B.C.; Kamarudin, S.K.; Basri, S. Direct Liquid Fuel Cells: A Review. Int. J. Hydrogen Energy 2017, 42, 10142–10157. [Google Scholar] [CrossRef]
- Antolini, E.; Gonzalez, E.R. Alkaline Direct Alcohol Fuel Cells. J. Power Sources 2010, 195, 3431–3450. [Google Scholar] [CrossRef]
- Antolini, E. Pt-Ni and Pt-M-Ni (M = Ru, Sn) Anode Catalysts for Low-Temperature Acidic Direct Alcohol Fuel Cells: A Review. Energies 2017, 10, 42. [Google Scholar] [CrossRef]
- Yaqoob, L.; Noor, T.; Iqbal, N. A Comprehensive and Critical Review of the Recent Progress in Electrocatalysts for the Ethanol Oxidation Reaction. RSC Adv. 2021, 11, 16768–16804. [Google Scholar] [CrossRef]
- Roschger, M.; Wolf, S.; Genorio, B.; Hacker, V. Effect of PdNiBi Metal Content: Cost Reduction in Alkaline Direct Ethanol Fuel Cells. Sustainability 2022, 14, 15485. [Google Scholar] [CrossRef]
- Eigler, S.; Hirsch, A. Chemistry with Graphene and Graphene Oxide—Challenges for Synthetic Chemists. Angew. Chem. Int. Ed. 2014, 53, 7720–7738. [Google Scholar] [CrossRef]
- Bai, J.; Liu, D.; Yang, J.; Chen, Y. Nanocatalysts for Electrocatalytic Oxidation of Ethanol. ChemSusChem 2019, 12, 2117–2132. [Google Scholar] [CrossRef]
- Rizo, R.; Pérez-Rodríguez, S.; García, G. Well-Defined Platinum Surfaces for the Ethanol Oxidation Reaction. ChemElectroChem 2019, 6, 4725–4738. [Google Scholar] [CrossRef]
- Smiljanić, M.; Srejić, I.; Georgijević, J.P.; Maksić, A.; Bele, M.; Hodnik, N. Recent Progress in the Development of Advanced Support Materials for Electrocatalysis. Front. Chem. 2023, 11, 1304063. [Google Scholar] [CrossRef] [PubMed]
- Ren, F.; Wang, H.; Zhai, C.; Zhu, M.; Yue, R.; Du, Y.; Yang, P.; Xu, J.; Lu, W. Clean Method for the Synthesis of Reduced Graphene Oxide-Supported PtPd Alloys with High Electrocatalytic Activity for Ethanol Oxidation in Alkaline Medium. ACS Appl. Mater. Interfaces 2014, 6, 3607–3614. [Google Scholar] [CrossRef] [PubMed]
- Li, L.; Chen, M.; Huang, G.; Yang, N.; Zhang, L.; Wang, H.; Liu, Y.; Wang, W.; Gao, J. A Green Method to Prepare Pd–Ag Nanoparticles Supported on Reduced Graphene Oxide and Their Electrochemical Catalysis of Methanol and Ethanol Oxidation. J. Power Sources 2014, 263, 13–21. [Google Scholar] [CrossRef]
- Antolini, E. Graphene as a New Carbon Support for Low-Temperature Fuel Cell Catalysts. Appl. Catal. B Environ. 2012, 123–124, 52–68. [Google Scholar] [CrossRef]
- Dong, L.; Gari, R.R.S.; Li, Z.; Craig, M.M.; Hou, S. Graphene-Supported Platinum and Platinum–Ruthenium Nanoparticles with High Electrocatalytic Activity for Methanol and Ethanol Oxidation. Carbon 2010, 48, 781–787. [Google Scholar] [CrossRef]
- Shen, Y.; Xiao, K.; Xi, J.; Qiu, X. Comparison Study of Few-Layered Graphene Supported Platinum and Platinum Alloys for Methanol and Ethanol Electro-Oxidation. J. Power Sources 2015, 278, 235–244. [Google Scholar] [CrossRef]
- Vu, T.H.T.; Nguyen, T.T.; Nguyen, T.H.; Nguyen, M.D.; Nguyen, Q.M. A New Method for Synthesizing High Performance Few-Layer Graphene Supported Pt Electrocatalysts in Methanol and Ethanol Oxidation. Electrochim. Acta 2021, 380, 138258. [Google Scholar] [CrossRef]
- Arukula, R.; Vinothkannan, M.; Kim, A.R.; Yoo, D.J. Cumulative Effect of Bimetallic Alloy, Conductive Polymer and Graphene toward Electrooxidation of Methanol: An Efficient Anode Catalyst for Direct Methanol Fuel Cells. J. Alloys Compd. 2019, 771, 477–488. [Google Scholar] [CrossRef]
- Ruiz-Camacho, B.; Medina-Ramírez, A.; Villicaña Aguilera, M.; Minchaca-Mojica, J.I. Pt Supported on Mesoporous Material for Methanol and Ethanol Oxidation in Alkaline Medium. Int. J. Hydrogen Energy 2019, 44, 12365–12373. [Google Scholar] [CrossRef]
- Sun, S.; Zhang, G.; Gauquelin, N.; Chen, N.; Zhou, J.; Yang, S.; Chen, W.; Meng, X.; Geng, D.; Banis, M.N.; et al. Single-Atom Catalysis Using Pt/Graphene Achieved through Atomic Layer Deposition. Sci. Rep. 2013, 3, 1775. [Google Scholar] [CrossRef]
- Berghian-Grosan, C.; Radu, T.; Biris, A.R.; Dan, M.; Voica, C.; Watanabe, F.; Biris, A.S.; Vulcu, A. Platinum Nanoparticles Coated by Graphene Layers: A Low-Metal Loading Catalyst for Methanol Oxidation in Alkaline Media. J. Energy Chem. 2020, 40, 81–88. [Google Scholar] [CrossRef]
- Su, C.-Y.; Lu, A.-Y.; Xu, Y.; Chen, F.-R.; Khlobystov, A.N.; Li, L.-J. High-Quality Thin Graphene Films from Fast Electrochemical Exfoliation. ACS Nano 2011, 5, 2332–2339. [Google Scholar] [CrossRef] [PubMed]
- Abdelkader, A.M.; Cooper, A.J.; Dryfe, R.a.W.; Kinloch, I.A. How to Get between the Sheets: A Review of Recent Works on the Electrochemical Exfoliation of Graphene Materials from Bulk Graphite. Nanoscale 2015, 7, 6944–6956. [Google Scholar] [CrossRef] [PubMed]
- Munuera, J.M.; Paredes, J.I.; Villar-Rodil, S.; Ayán-Varela, M.; Pagán, A.; Aznar-Cervantes, S.D.; Cenis, J.L.; Martínez-Alonso, A.; Tascón, J.M.D. High Quality, Low Oxygen Content and Biocompatible Graphene Nanosheets Obtained by Anodic Exfoliation of Different Graphite Types. Carbon 2015, 94, 729–739. [Google Scholar] [CrossRef]
- Shalaby, A.; Nihtianova, D.; Markov, P.; Staneva, A.D.; Iordanova, R.S.; Dimitriev, Y.B. Structural Analysis of Reduced Graphene Oxide by Transmission Electron Microscopy. Bulg. Chem. Commun. 2015, 47, 291–295. [Google Scholar]
- Hayes, W.I.; Joseph, P.; Mughal, M.Z.; Papakonstantinou, P. Production of Reduced Graphene Oxide via Hydrothermal Reduction in an Aqueous Sulphuric Acid Suspension and Its Electrochemical Behaviour. J. Solid State Electrochem. 2015, 19, 361–380. [Google Scholar] [CrossRef]
- Li, X.; Fan, L.; Li, Z.; Wang, K.; Zhong, M.; Wei, J.; Wu, D.; Zhu, H. Boron Doping of Graphene for Graphene–Silicon p–n Junction Solar Cells. Adv. Energy Mater. 2012, 2, 425–429. [Google Scholar] [CrossRef]
- Dresselhaus, M.S.; Dresselhaus, G.; Eklund, P.C. Science of Fullerenes and Carbon Nanotubes; Academic Press: Cambridge, MA, USA, 1996; ISBN 978-0-12-221820-0. [Google Scholar]
- Duan, X.; O’Donnell, K.; Sun, H.; Wang, Y.; Wang, S. Sulfur and Nitrogen Co-Doped Graphene for Metal-Free Catalytic Oxidation Reactions. Small 2015, 11, 3036–3044. [Google Scholar] [CrossRef]
- Rakočević, L.; Simatović, I.S.; Maksić, A.; Rajić, V.; Štrbac, S.; Srejić, I. PtAu Nanoparticles Supported by Reduced Graphene Oxide as a Highly Active Catalyst for Hydrogen Evolution. Catalysts 2022, 12, 43. [Google Scholar] [CrossRef]
- Golubović, J.; Rakočević, L.; Vasiljević Radović, D.; Štrbac, S. Improved Oxygen Reduction on GC-Supported Large-Sized Pt Nanoparticles by the Addition of Pd. Catalysts 2022, 12, 968. [Google Scholar] [CrossRef]
- Maksic, A.; Rakocevic, Z.; Smiljanic, M.; Nenadovic, M.; Strbac, S. Methanol Oxidation on Pd/Pt(Poly) in Alkaline Solution. J. Power Sources 2015, 273, 724–734. [Google Scholar] [CrossRef]
- Schmidt, T.J.; Ross, P.N., Jr.; Markovic, N.M. Temperature Dependent Surface Electrochemistry on Pt Single Crystals in Alkaline Electrolytes Part 2. The Hydrogen Evolution/Oxidation Reaction. J. Electroanal. Chem. 2002, 524–525, 252–260. [Google Scholar] [CrossRef]
- Chen, Z.; Liu, T.; Zhang, H.; Pang, B.; Sun, Y.; Hu, L.; Luo, Q.; Liu, X.; Cao, L.; Yao, T. Laser-Assisted Synthesis of PtPd Alloy for Efficient Ethanol Oxidation. Nano Res. 2024, 17, 6032–6037. [Google Scholar] [CrossRef]
- Tang, M.; Sun, M.; Chen, W.; Ding, Y.; Fan, X.; Wu, X.; Fu, X.-Z.; Huang, B.; Luo, S.; Luo, J.-L. Atomic Diffusion Engineered PtSnCu Nanoframes with High-Index Facets Boost Ethanol Oxidation. Adv. Mater. 2024, 36, 2311731. [Google Scholar] [CrossRef]
- Bastos, T.L.; Gelamo, R.V.; Colmati, F. Carbon-Graphene Hybrid Supporting Platinum–Tin Electrocatalyst to Enhance Ethanol Oxidation Reaction. J. Appl. Electrochem. 2024, 54, 1225–1237. [Google Scholar] [CrossRef]
- Liu, C.; Tang, Q.; Fan, P.; Wei, Y.; Yu, Y.; Wen, X.; Li, X.; Li, L.; Qu, Q. Interface Engineering of PdPt Ultrafine Ethanol Electro-Oxidation Nanocatalysts by Bacterial Soluble Extracellular Polymeric Substances (s-EPS) to Break through Sabatier Principle. Small 2024, 20, 2308283. [Google Scholar] [CrossRef] [PubMed]
- Zhang, Z.; Fu, H.; Chen, C.; Huang, Z.; Guan, L.; Li, H.; Zhang, N.; Liu, T. Defect-Rich Pt-Ru Metallic Aerogels for Highly Efficient Ethanol Oxidation Reaction. Appl. Surf. Sci. 2024, 652, 159277. [Google Scholar] [CrossRef]
- Eswaraditya Reddy, L.; Gollapudi, D.; Mahnot Jain, G.; Kolluru, S.; Ramesh, G.V. Recent Progress in the Development of Platinum-Based Electrocatalysts for the Oxidation of Ethanol in Fuel Cells. Mater. Today Proc. 2023, 92, 636–641. [Google Scholar] [CrossRef]

Disclaimer/Publisher’s Note: The statements, opinions and data contained in all publications are solely those of the individual author(s) and contributor(s) and not of MDPI and/or the editor(s). MDPI and/or the editor(s) disclaim responsibility for any injury to people or property resulting from any ideas, methods, instructions or products referred to in the content. |
© 2024 by the authors. Licensee MDPI, Basel, Switzerland. This article is an open access article distributed under the terms and conditions of the Creative Commons Attribution (CC BY) license (https://creativecommons.org/licenses/by/4.0/).