Abstract
The digital transformation of organizations has propelled the widespread adoption of mobile platforms. Extended availability and prolonged engagement with platform-mediated work have blurred boundaries, making it increasingly difficult for individuals to balance work and life. Criticism of mobile platforms has intensified, precluding digital transformation towards a sustainable future. This study examines the complex relationship between mobile platforms and work–life imbalance using a comprehensive data-driven methodology. We employed a co-occurrence network technique to extract relevant features based on previous findings. Subsequently, we applied an explainable AI framework to analyze the nonlinear relationships underlying technology-induced work–life imbalance and to detect behavior patterns. Our results indicate that there is a threshold for the beneficial effects of availability demands on integration behavior. Beyond this tolerance range, no further positive increase can be observed. For organizations aiming to either constrain or foster employees’ integration behavior, our findings provide tailored strategies to meet different needs. By extending the application of advanced machine learning algorithms to predict integration behaviors, this study offers nuanced insights that counter the alleged issue of technology-induced imbalance. This, in turn, promotes the sustainable success of digital transformation initiatives. This study has significant theoretical and practical implications for organizational digital transformation.
1. Introduction
As digital transformation progresses in the workplace, employees engage intensively with mobile platform-mediated work, reshaping how work activities are executed. The omnipresence of smart devices, such as mobile phones and tablets, has driven the development of mobile versions of work-related systems, making work more flexible, autonomous, and porous. The widespread adoption of mobile platforms exemplifies successful digital transformation within organizations, as evidenced by their high popularity and extensive user coverage across various industries. By the end of 2022, DingTalk amassed 600 million users worldwide and over 23 million enterprise organization accounts [1]. Similarly, Slack had an estimated 35 million active users in 2022 [2].
In the digital era, the increasing integration of work and life has become apparent, with employees finding it challenging to maintain a clear boundary between the two. Consequently, mobile platforms face criticism for allowing work to encroach on personal lives. These concerns burden organizations striving for sustainable digital transformation and make decision-makers more apprehensive about implementing new technology.
As described in [3], the mobile platforms in this research refer to digital platforms that support remote working, particularly by facilitating communication and collaboration. Examples include Slack, DingTalk, and Microsoft Teams. Mobile platforms enable individuals to work from anywhere at any time. However, despite their positive influences on productivity, the increased connectivity and flexibility afforded by these platforms are often criticized in academic scholarship for leading to adverse health effects [4,5], work–life imbalance [6], and work exhaustion [7]. These documented negative consequences raise public concerns about the sustainability of these technologies and whether the gains in productivity come at the cost of personal well-being [8]. Moreover, these platforms render work more intrusive, causing individuals to be perpetually surrounded by work activities, ultimately fostering a perception that technology is detrimental. These narratives predominantly emphasize the negative impacts of mobile platforms, thereby supporting the assertion that technology is the primary culprit behind work–life imbalance (WLI).
Work–life imbalance (WLI) can be conceptualized as the phenomenon of working excessive hours, where work encroaches upon personal lives [9]. Empirical studies indicate that the working population in Asia, including China, is typically subjected to a long-hour work culture. China in particular has garnered significant attention for the “996” working schedule—working from 9 a.m. to 9 p.m., six days a week—which has become a contentious issue among both employees and scholars.
This pervasive work culture significantly impacts work–life balance (see [10,11]). Coupled with the rapid pace of organizational digital transformation, it can be inferred that Chinese employees experience a technology-induced imbalance between their work and personal lives. Notably, this imbalance is often primarily attributed to the ubiquity of mobile platforms, which are seen as a main culprit in engendering employee work–life imbalance. This prompts us to consider the actual role that mobile platforms play in causing WLI in the Chinese workplace.
In many real-world situations, the relationships between variables are complex and often follow nonlinear patterns resulting from interactions between variables and threshold effects. Nevertheless, existing studies frequently examine the linkage between mobile platforms and work–life imbalance using linear regression methods. This raises doubts. Are the results sufficient to explain human behavior by several variables with linear assumptions? Ignoring nonlinearities in data can lead to inaccurate models and predictions, thereby missing opportunities to uncover critical insights. Human behavior is inherently more complex; however, to date, few studies have employed alternative methods such as machine learning algorithms to address this topic.
As workplaces increasingly integrate Artificial Intelligence (AI), it becomes imperative that techniques for user behavior detection and prediction employ advanced methodologies consistent with AI-driven practices. To adeptly navigate this transformative trend towards a sustainable future, it is essential to apply AI-related methods to comprehensively understand the role of technology in shaping individuals’ work–life integration behaviors. Given the complexity of technology-influenced human behavior and the relative paucity of AI techniques employed in predicting work–life imbalance, our objective is to employ the explainable AI framework to elucidate how various determinants affect work–life imbalance, particularly when employees engage with pervasive mobile platforms.
Our research questions are straightforward:
- What are the complex nonlinear relationships between mobile platforms and work–life imbalance, and should technology be held entirely accountable for invading private lives? Are there other associated factors?
- How does the application of the explainable AI framework enhance our understanding of the role of mobile platforms in shaping employees’ work behavior?
- How can the obtained evidence provide actionable guidance for the sustainable success of mobile platforms?
This paper extends the research frontier and makes several significant contributions. First, it contributes to the literature by examining the role of mobile platforms in influencing individuals’ integration behaviors through the lens of explainable AI. This approach supports decision-making processes and promotes a sustainable future amidst the digital transformation. Second, building on the extensive discussions in existing studies on the causes of work–life imbalance, we identify the input features for our predictive model using the co-occurrence network. This methodology allows us to derive conclusions without relying on prior hypotheses, thus revealing intricate facts free from knowledge bias. Third, the proposed hybrid method, which integrates the co-occurrence network with the explainable AI framework, not only provides robust conclusions with deeper insights but also introduces a novel methodological scheme. This advances the intersection of management and AI applications.
The remainder of this paper is structured as follows: In Section 2, we review the related background. Our methodology encompasses two sub-studies. Section 3 presents the first sub-study, including feature extraction and corresponding results. In Section 4, we discuss the second sub-study, which includes the explainable AI framework and its results. Section 5 offers a discussion of the findings and contributions. Finally, Section 6 provides conclusions and suggestions for further research.
2. Related Background
2.1. Work–Non-Work Integration and Boundary Theory
Boundary theory is central to a wide range of work–life integration (WLI) publications that explore its causes and consequences. According to boundary theory, individuals are boundary crossers who switch roles between work and family domains, incorporating both psychological states and physical environments [12]. When individuals continue to engage in work-related activities within the family domain (e.g., thinking about work-related matters), they are unable to effectively perform their roles in the family domain (e.g., cultivating personal interests and hobbies) [13,14]. This process is referred to as boundary permeation.
Conceptually, boundary permeation occurs when an individual participates in a role within one domain under physical conditions while simultaneously engaging in a role in another domain under psychological conditions or through actual behavior [15]. As this phenomenon has directionality, it can be represented as unidirectional (work permeating into life or life permeating into work) or bidirectional (work permeating into life and life permeating into work) [16].
Undoubtedly, mobile platforms break down the boundaries between work and life domains, enabling individuals to integrate their work into their private lives in an extremely convenient manner. In this context, technology-induced integration behavior is defined as the behavior of integrating from work to non-work domains, rather than the reverse. The most significant function of mobile platforms is their strengthened connection with work. Following this logic, existing studies argue that increased use of mobile platforms correlates with increased platform-mediated work demands [17,18], extending regular work hours and subsequently leading to work–non-work integration behaviors.
2.2. Explainable AI Framework for Behavior Prediction
Artificial Intelligence encompasses a wide array of disciplines, with machine learning being one of the most prominent tools for addressing complex problems and enhancing predictive accuracy. Although conventional machine learning algorithms effectively solve complex issues, their results often lack interpretability due to the opacity of their processes. To address this challenge, Shapley Additive Explanations (SHAPs) have been introduced as a powerful tool to enhance the transparency of algorithmic outcomes. SHAPs provide “shapley values” to assess the importance of features contributing to integration behavior. The integration of machine learning algorithms with SHAP techniques establishes an explainable AI framework [19,20]. Following existing literature, we apply this framework to our context to uncover the true relationship between determinants and work–life imbalance. This explainable AI framework not only enables the identification of nonlinear effects behind technology-induced imbalances but also helps differentiate patterns of integration from non-integration behaviors.
Machine learning (ML) possesses advanced predictive capabilities, providing profound insights and facilitating decision-making across a wide range of areas. For instance, XGBoost has proven effective for earthquake prediction and warning [21,22]. In study [23], the authors employed the explainable AI framework for real-time accident detection. Another study utilized ML to predict driver fatigue, aiding the transition from manual to automated driving [24]. Additional applications include predicting choices related to electric vehicle charging stations [25] and intercity travel preferences [26]. These studies, embracing the advances in artificial intelligence and machine learning, offer nuanced insights and solutions for real-world problems. There is widespread consensus that ML excels in detecting complex non-linear relationships and uncovering hidden patterns in data, unlike traditional statistical models such as linear regression and generalized linear models, which rely on prior assumptions about the data.
2.3. Breaking away from Linear Regression Method
We present Figure 1 to illustrate the complexity of human behavior in real-world scenarios, emphasizing the necessity of employing machine learning techniques to predict employee integration behavior. Given the intricate nature of human actions, the function that most accurately captures behavior dynamics is likely quadratic or trigonometric, as depicted in the central section of Figure 1. The determinants of behavioral decisions, specifically in the context of work–life integration, encompass heterogeneous factors from various dimensions, including organizational and personal levels. Outliers may exist among numerous observations, and the relationships between independent and dependent variables are often nonlinear, manifesting in curved influence patterns, as shown in Figure 1.
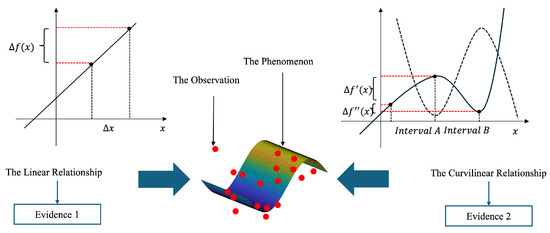
Figure 1.
On the inference of nonlinear pattern detection.
Evidence 1 is derived from linear assumptions among variables, whereas Evidence 2 stems from curvilinear assumptions. By comparison, it is evident that Evidence 2 more closely approximates real human behavior, as it models human behavior as a dynamic system with multiple peaks and troughs over different intervals. This suggests that, within interval A, the relationship may exhibit a stable upward trend, whereas in interval B, it may shift to a downward trend. A substantial body of existing research employs traditional linear assumptions toward employee behavior; however, recommendations based solely on this method are likely to be misrepresented, failing to reveal the true nature of employee behavior and providing inaccurate decisions to support digital transformation.
In summary, we propose that work–life integration behavior is likely to be intricate and dynamic, which cannot be adequately addressed by linear regression methods, as illustrated in Figure 1. During an organization’s digital transformation, understanding the subtle impacts of smart platforms and work–life integration is critical. The existing paucity of curvilinear behavior exploration, combined with the limitations of linear regression methods, compels us to develop a novel approach to thoroughly revolutionize the understanding and prediction of employee behavior in the digital era.
As previously discussed, machine learning techniques hold significant promise for addressing complex behaviors and aiding decision-making processes. To this end, we propose a novel data-driven method comprising two sub-studies. In Study 1, our objective was to consider as many potential influencing factors as possible without theoretical biases. Specifically, by calculating the co-occurrence frequency in the existing literature, we identified potential determinants co-appearing with work–life integration behavior. Once the relevant features were confirmed, we distilled each feature into specific constructs with measurable items and subsequently converted them into input variables for behavioral prediction.
In Study 2, we developed a predictive model based on machine learning algorithms to forecast work–life integration behavior. We used survey data as the input for the predictive model and employed the SHAP (Shapley Additive Explanation) technique to elucidate the underlying mechanisms of work–life integration behaviors. In addition to the results obtained from machine learning and SHAPs, we meticulously conducted scale validation and statistical assessments before generating the machine learning models. To the best of our knowledge, the combination of survey data and machine learning has seldom been verified, underscoring the novelty and contribution of our study.
3. Study 1: Feature Extraction Based on Co-Occurrence Network
3.1. Methodology
We commence our investigation with a comprehensive literature search using the Web of Science database. Employing the keywords “work–life boundary”, “work–life conflicts”, and “work–life integration”, we identified 578 articles published between 2018 and 2023. Our review was meticulously focused on the determinants of integration behaviors rather than their consequences. Additionally, given our interest in technology-induced work–life imbalances, we excluded general topics that did not explicitly address mobile technologies or ICTs. Ultimately, 73 highly relevant articles were retained for feature extraction. To illustrate our procedure, we selected a pertinent example article (e.g., [27]) that discusses technology-mediated interruptions and their impact on employees’ work–life boundary experiences for subsequent content analysis.
Following the selection of articles, Atlas.ti (version 8.4.3) was utilized to identify key phrases. This software is widely used in qualitative research for text analysis [28] and was therefore adopted to extract features from the retrieved articles. While the standard procedure for employing Atlas.ti in qualitative analysis involves coding, conceptualization, and network analyses [29], we primarily used the software to extract key phrases from the introduction and literature review (or theoretical background) sections. Given that the selected articles are well-organized empirical analyses that often explicitly state relevant concepts or factors, we extracted key phrases directly from the authors’ arguments. For instance, in a sentence from [27], “Some individuals prefer to segment work and non-work domains through thicker boundaries, whereas others may prefer more porous boundaries that integrate work and non-work domains”, we identified and coded key phrases: “preferences”, “porous boundaries”, “thicker boundaries”, and “work–non-work domains”.
In the subsequent phase, the co-occurrence network technique was utilized to construct the network. A co-occurrence network is a critical tool in text mining and Natural Language Processing (NLP), capturing the frequency with which pairs of phrases appear together within our lexical dataset. Each entry in this network indicates the frequency of a particular pair of phrases co-occurring in the predefined context, providing a structured method to analyze textual data. The Python software (Python 3.8.19 in Spyder IDE 5.5.1) was used to visualize the co-occurence network. The pseudocode for drawing the co-occurrence network and the mathematical expression of calculating the co-occurrence matrix are provided in Algorithm A1 in Appendix A and Equation (A1) in Appendix D, respectively. In essence, this method allows us to identify and quantify the frequency of phrase co-occurrence, facilitating the process of determining the key factors influencing work–non-work integration behavior.
3.2. Results
3.2.1. Potential Influencing Features
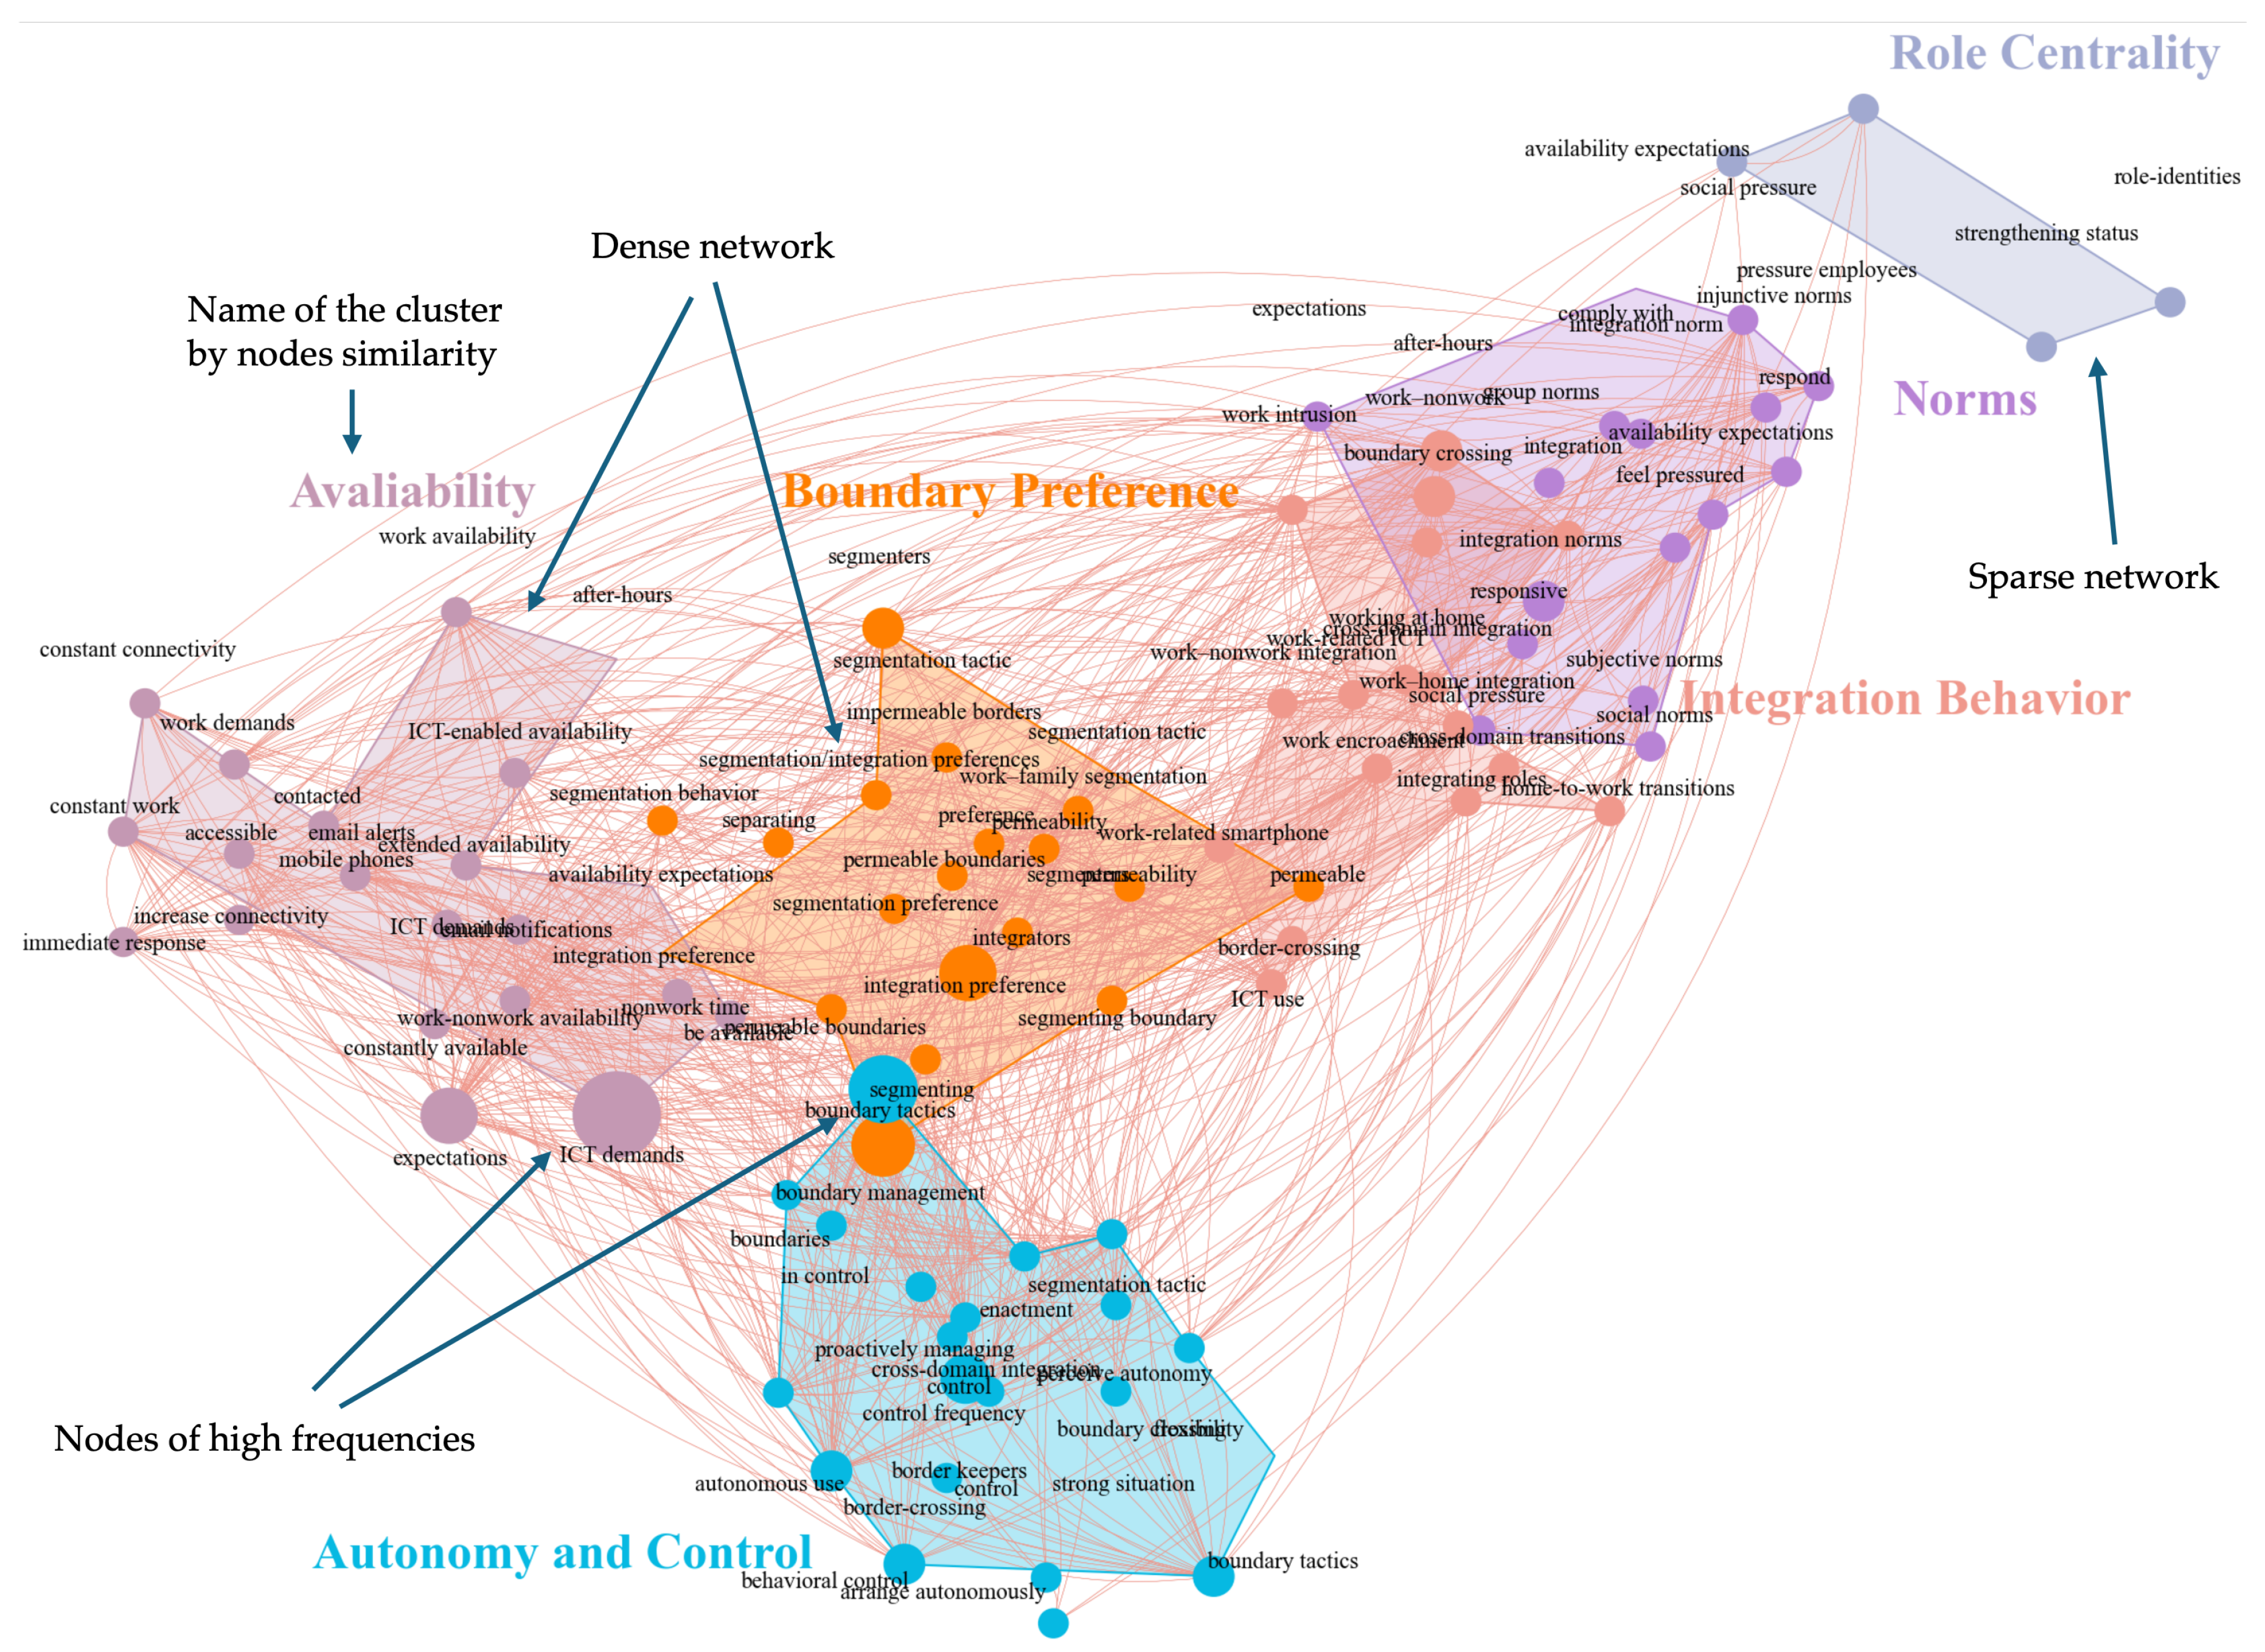
Figure 2 depicts the nodes representing frequencies and the top five clusters detected in the co-phrase network. The node size reflects the frequency of phrase appearances in the lexical dataset. Notably, constructs such as ICT-enabled availability and constant connectivity are frequently mentioned in discussions on work–life integration behavior, aligning with prior findings. Boundary tactics also emerge as potential influencers of integration behavior. In consultation with information science experts and supported by the literature, we manually restructured and color-coded these clusters. The identified clusters include Availability, Autonomy and Control, Boundary Preference, Norms, Role Centrality, and Integration Behavior. The explanations for each cluster are detailed in Table 1.
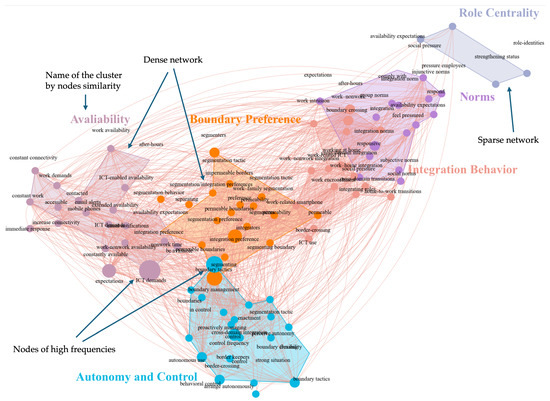
Figure 2.
Co-occurrence network graph.

Table 1.
Mapping from key phrases to clusters.
Based on Table 1, we identified key features influencing work–non-work integration and mapped them into measurable variables for data collection and model training. We selected 16 relevant articles that provide measurements of variables and examine their relationships with the target variable. This process enabled us to refine clusters from the literature into specific variables that serve as input features for machine learning models. The mapping from clusters to variables and their definitions are detailed in Table 2.
Table 2.
Mapping from clusters to variables.
3.2.2. Survey Administration and Data Collection
Upon completing the feature extraction process, we identified the variables necessary for constructing the predictive model and measures for data collection. We emphasize that the survey method employed in this study significantly differs from traditional hypothesis-driven linear regression approaches. First, we do not propose any hypotheses; instead, we identify factors that may influence the results. Second, we consider all these factors as input features for predicting the target variable and disregard mediation, moderation, or direct linkages commonly used in traditional survey-based research. We focus solely on whether a factor increases or decreases the behavior and in which direction.
Consequently, our method, although survey-based, is inherently a hybrid approach that bridges traditional managerial studies with machine learning techniques. During the survey stage, measurement model validation is necessary; hence, statistical examinations were conducted to ensure that the survey items accurately reflect the latent variables. For structural model validation, coefficients of the path estimates are discarded. Since the data are primarily used for ensemble learning techniques, it is redundant to test whether the constructs are theoretically discriminant or related, which are the main purposes of convergent and discriminant validity. For details on the advantages of ensemble learning, please refer to existing articles in Computer Science applications [35,36]. In the machine learning stage, the research design adheres to paradigms established in CS applications by presenting the algorithms used in the Section 3.1. This is followed by model comparison, model selection, hyperparameter tuning, and SHAP interpretation [37,38]. Details regarding this are explained in Sub-study 2.
The entire data collection process was meticulously conducted following established behavioral science research paradigms. To ensure content validity, measures were adapted from existing literature. A rigorous translation/back-translation procedure was employed to ensure semantic equivalence in both Chinese and English. The input variables included Available Demands on Mobile Communication Platforms (AVD), Segmentation Preferences (SEPs), Boundary Control (BOC), Work Identity (WOI), and Integration Norms (INNs). The dependent variable is Work–Non-Work Integration (WWIN). These measures demonstrated robust psychometric properties in previous research. Detailed items for the measure are provided in Table A1 in Appendix B.
The preliminary investigation was carried out in May 2023, during which we recruited a small set of participants through a summer training campaign tailored for public employees. While we did not prioritize specific industries, we expected participants to be familiar with various mobile platforms to ensure they had direct experience with technology-related work–life (im)balance. The professional backgrounds of the participants included public officials with long-term appointments, employees of third-party social welfare organizations, and members of state-owned financial agencies, among others. The preliminary investigation indicates that these participants worked in front-line positions heavily utilizing digital tools, which is well aligned with our research objectives, thus affirming their representativeness.
We continued to use the convenient sampling method to collect a larger dataset. From May to August 2023, questionnaires were disseminated to a broader pool of participants, also from the training courses, ultimately reaching 840 employees. Academic rigor and ethical standards were strictly adhered to throughout the procedure. Socioeconomic factors were collected using parsimonious rules. First, anonymity was guaranteed, and the purpose of the survey was clearly communicated to all participants both verbally and through written explanations on the questionnaire. We emphasized that the collected personal information would only be used for statistical and research purposes, with no inclusion of sensitive private data. Second, participation was entirely voluntary, with full respect for each individual’s willingness. Third, participants were required to be familiar with mobile technologies, such as work apps; otherwise, they would not satisfy the research criteria.
Out of the 834 responses obtained, 176 were excluded due to incomplete answers, the same propensity for all answers, or inattention. Consequently, 658 valid responses were included in the subsequent analysis, resulting in a valid response rate of 79%.
4. Study 2: An Explainable AI Framework for Predicting Nonlinear Behavior Patterns
4.1. Methodology
4.1.1. Linear Regression, Random Forest, LightGBM, and XGBoost
To predict the integration behavior, we start with the simplest algorithm known as Linear Regression (LR). LR employs ordinary least squares to estimate the linear relationships between the variables. We let be a feature mapping from the input space to and consider the family of linear hypotheses:
Linear regression consists of seeking a hypothesis in with the smallest empirical mean squared error.
Although LR is easy to implement and understand, it lacks a robust generalization guarantee. This is because it focuses solely on minimizing empirical error without regulating the weight vector’s norm or incorporating other forms of regularization. LR suffers from various statistical restrictions, such as endogeneity and multicollinearity; thus, its performance is typically poor in most applications.
Random Forest (RF) operates on an ensemble learning paradigm, first proposed in [39]. In the RF model, a variety of decision trees are developed using different subsets of the data, and each decision tree is trained using the bootstrap strategy. For regression, the RF model averages the predictions of all B decision trees. The final prediction for an input x is given by
For classification, the RF model aggregates the predictions of all B decision trees by majority voting. The final prediction for an input x is given by
The RF excels in mitigating the potential overfitting issues, with high prediction accuracy and stability.
The LightGBM (Light gradient boosting machine) is a highly efficient and scalable implementation of gradient boosting decision tree (GBDT) algorithms, designed for fast training speed and high efficiency [40]. GBDT is an ensemble learning method that combines the predictions of multiple weak learners, typically decision trees, to produce a strong learner. The objective of GBDT is to minimize a loss function by iteratively adding decision trees to the model. The prediction at iteration m is given by
where is the prediction from the previous iteration, is the learning rate, and is the new decision tree added at iteration m. Two main important features of LightGBM are gradient-based one-side sampling (GOSS) and exclusive feature bundling (EFB), which contribute to the computational efficiency with an acceptable level of accuracy. LightGBM is particularly well suited for large datasets and can handle high-dimensional data with ease. Therefore, processing a small dataset via LightGBM might cause overfitting. More detailed explanations of GOSS and EFB techniques and applications of LightGBM can be found in [41,42].
XGBoost (Extreme Gradient Boosting) is an advanced implementation of gradient boosting algorithms designed to be highly efficient, flexible, and portable. It provides parallel tree boosting that solves many data science problems in a fast and accurate way [43]. The core idea behind XGBoost is to use a gradient boosting framework, which builds models sequentially, each new model correcting errors made by the previous ones. The effectiveness and efficiency of XGBoost have made it a popular choice in various machine learning competitions and practical applications [44]. The objective function to be minimized in XGBoost is composed of a convex loss function L that measures the difference between the prediction and the target , and a regularization term that penalizes the complexity of the model:
where represents the parameters of the model, n is the number of data points, K is the number of trees, and represents the individual trees. is a regularization term to reduce overfitting, which can be expressed as Equation (6),
where T represents the number of leaf nodes in the kth decision tree, and can decide penalty strength together, is the score of the ith leaf node.
XGBoost is one of the most popular and powerful machine learning algorithms given its robustness and accuracy in both small and large datasets [45,46]. In additon, we emphasize that XGBoost is not impacted by multicollinearity [47], which is a common concerning issue in utilizing surveys as data sources. Reflecting on our case, even if the two variables in the survey are in resemblance and capture similar perceptions, both can be kept and would not conflate the significance of different features. Prediction performance based on these algorithms is shown in the following sections.
All these algorithms are implemented through the Python programming software (Python 3.8.19 in Spyder IDE 5.5.1).
4.1.2. Hyparameter Tunning
Hyperparameter tuning is performed using K-Fold Cross-Validation (CV), a traditional search strategy employed in various stages of the machine learning process, including hyperparameter tuning, feature selection, and model building. In K-Fold CV, the training dataset is randomly divided into K equal-sized complementary subsets. These subsets are used in rotation to train the model, with one subset held out for validation in each iteration. Common choices for the value of K are 5 or 10, although no formal rule dictates this selection. The “GridSearchCV” function in the “sklearn” package provides an effective grid search algorithm for identifying optimal hyperparameters. In this study, the training dataset is partitioned into ten folds (), as recommended by previous research [48]. Random subsampling is employed to isolate the data from the entire sample by dividing it into K subsets. For each data split, a fixed number of observations from the sample are retained as experimental data without replacement. Subsequently, for each split K, the predictive model is trained from scratch on the training data, and the prediction error for each test set is calculated. The example below demonstrates the implementation of K-Fold CV using Python (Python 3.8.19 in Spyder IDE 5.5.1). For brevity, the hyperparameter settings and model training steps are omitted.
          kf = KFold(n_splits=10, shuffle=True, random_state=42)
          grid_search = GridSearchCV(
              estimator=model,
              param_grid=hyperparameters,
              cv=kf,
              scoring=’accuracy’,
              verbose=2
              )
4.1.3. Shapley Additive Explanations
SHAP is a unified framework for interpreting machine learning models. The combined effect of multiple independent and dependent variables can be explained and quantified by employing the Shapley value. The core concept behind the Shapley value is to calculate the mean value of the marginal contribution of a feature to the model prediction results. The Shapley value for feature i is defined as the weighted average of the marginal contributions of feature i to all possible coalitions S of features:
where is the contribution of feature i, N is the set of all features, S is a subset of N not containing feature i, and is the value function, representing the model prediction for the subset S. A linear function of binary features is defined based on the following additive feature attribution method:
where is the mean value of all the training samples; M is the number of input features; and . When a feature is observed, ; otherwise, . We use the SHAP technique to evaluate the significance of each input feature and its contribution to the predicted result.
4.1.4. Performance Indices
In this study, the prediction results of the four models are evaluated using well-established statistical criteria. Specifically, these criteria include the Root Mean Square Error (RMSE), Mean Absolute Error (MAE), Coefficient of Determination (), and Mean Squared Error (MSE). These metrics are crucial as they analyze the relationship between predicted and actual outputs. Higher values, which is Approach 1, indicate a good correlation, while lower RMSE, MAE, and MSE values indicate higher model prediction performance. The mathematical formulas of these indices are presented in Equations (A2)–(A5) in Appendix D.
4.2. Results
4.2.1. Scale Validation and Statistics Assessment
The statistic examinations are completed using R software (R 4.3.1 Version), and the packages used include lavaan, ltm, and metan packages. The input variables are AVD, WOI, BOC, INNs, and SEPs, all derived from Sub-study 1. Additionally, common covariates such as years of work experience, educational level, age, and gender are considered. Previous studies have indicated that these factors may also influence employees’ boundary management strategies [49,50,51]. Hence, socio-demographic characteristics are incorporated into the final predictive model. Unlike most machine learning-based predictive models that use directly measured variables as input features, this study employs a survey method for data collection. Therefore, a rigorous statistical examination is essential for enhancing prediction robustness. Following the data cleaning procedures mentioned earlier, we now proceed to a comprehensive statistical analysis.
The first step involves performing an exogenous model check. For each construct (e.g., AVD, WOI, etc.), we employ a series of items to measure the corresponding construct. We validate the scale to ensure that all items are suitable for measuring the construct and that the model fits the data well. The item loadings and Cronbach’s alpha are satisfactory (see Table A1 in Appendix B), indicating that the measurement used has sufficient reliability.
A Confirmatory Factor Analysis (CFA) is conducted using the lavaan package with the cfa() function in R (R 4.3.1 Version). The syntax is as follows:
			mymodel <- cfa(model, data=mydata, std.lv=TRUE)
			summary(mymodel)
The results demonstrate satisfactory fit indices, including CFI = 0.901, TLI = 0.887, RMSEA = 0.067 with a 90% CI [0.063, 0.071], and SRMR = 0.076. These results indicate that the survey instrument is both valid and reliable for measuring the latent constructs.
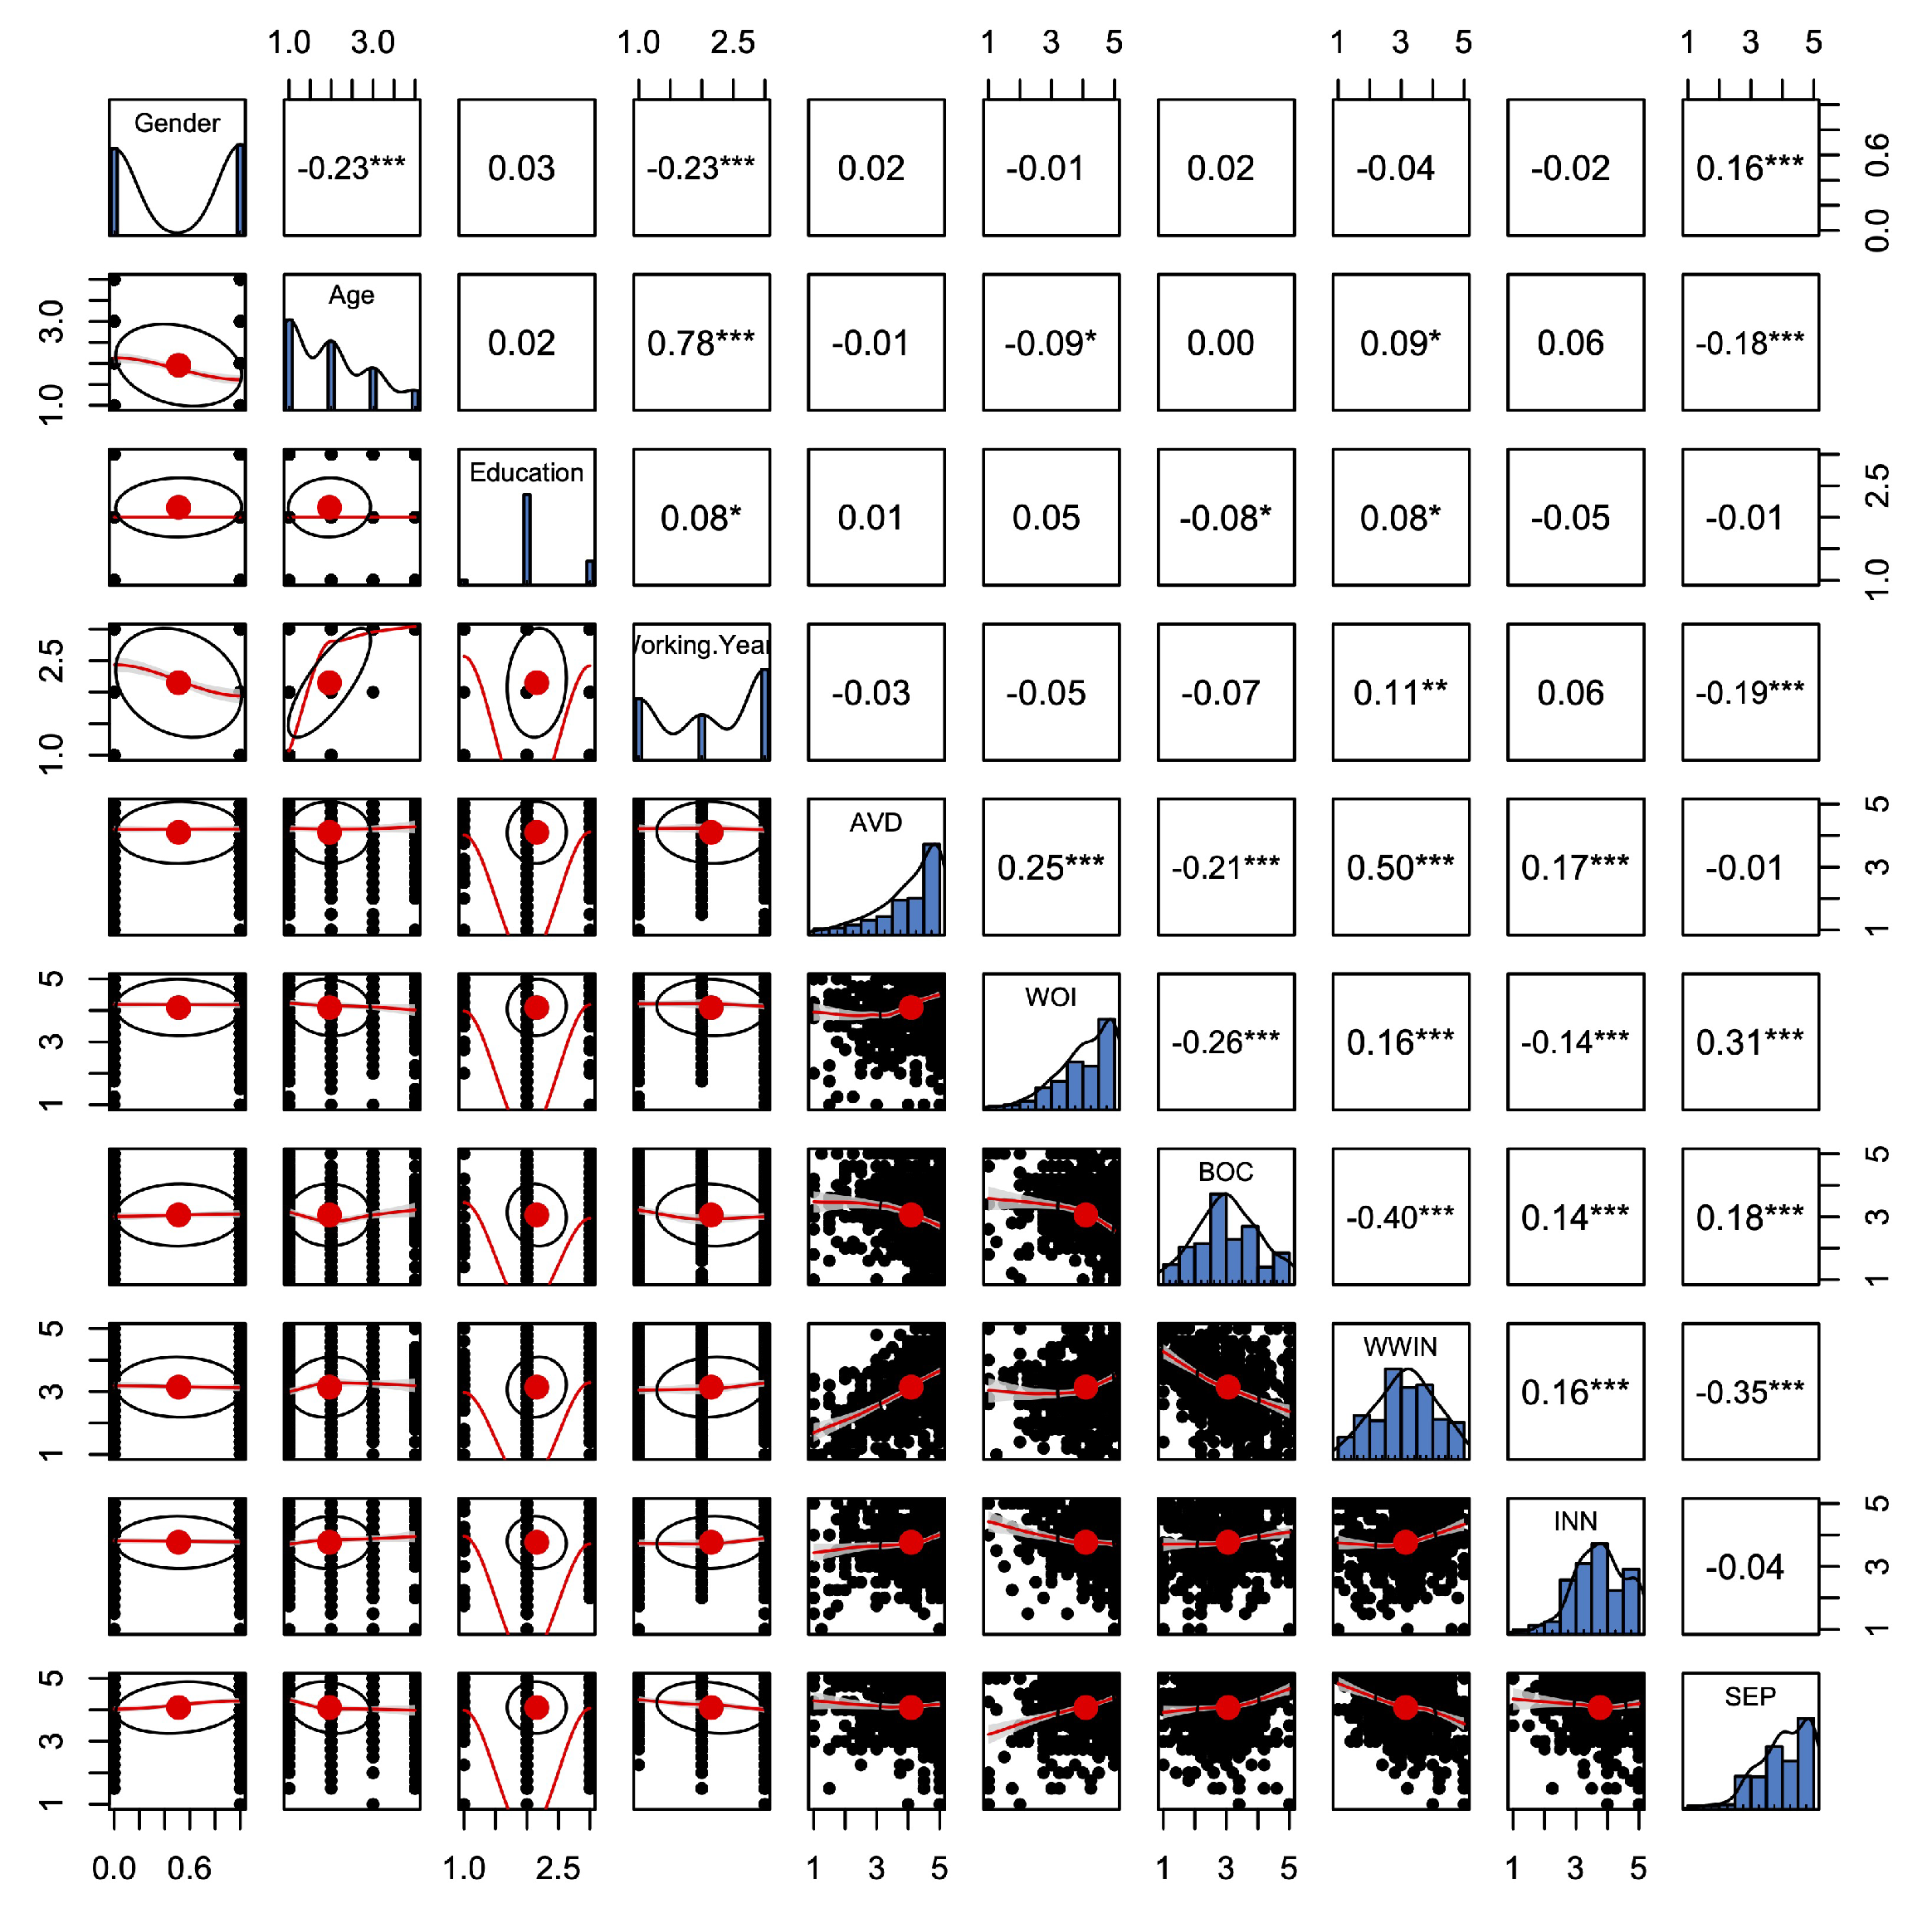
Second, we utilize plotting libraries in R to visualize the results from the Pearson coefficient. This analysis is executed using the metan package. The mathematical expression of the Pearson correlation coefficient is shown in Equation (A6) in Appendix D. The result is presented in Figure 3, where AVD represents Availability Demands, WOI denotes Work Identity, SEPs stands for Segmentation Preferences, BOC signifies Boundary Control, INNs indicates Integration Norms, and WWIN refers to Work–Non-Work Integration. The values in the upper diagonal are Pearson’s correlation coefficients. The target variable, WWIN, shows significant correlations with all independent variables. Additionally, the diagonal in Figure 3 displays the frequency distributions of each variable, whereas the plots below the diagonal represent scatterplots showing relationships between variable pairs.
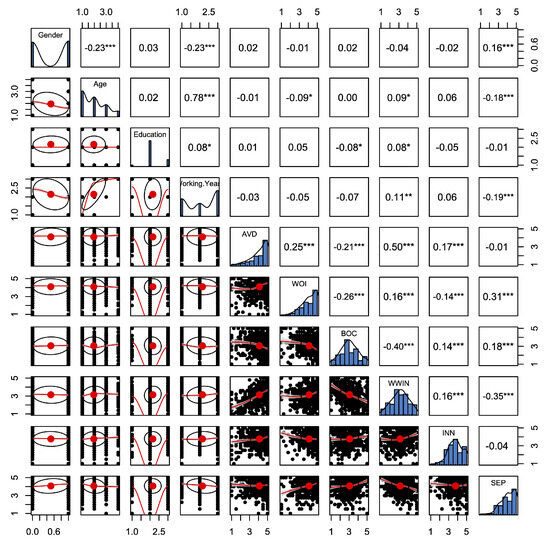
Figure 3.
Correlation matrix. * 0.05, ** 0.01, *** 0.001.
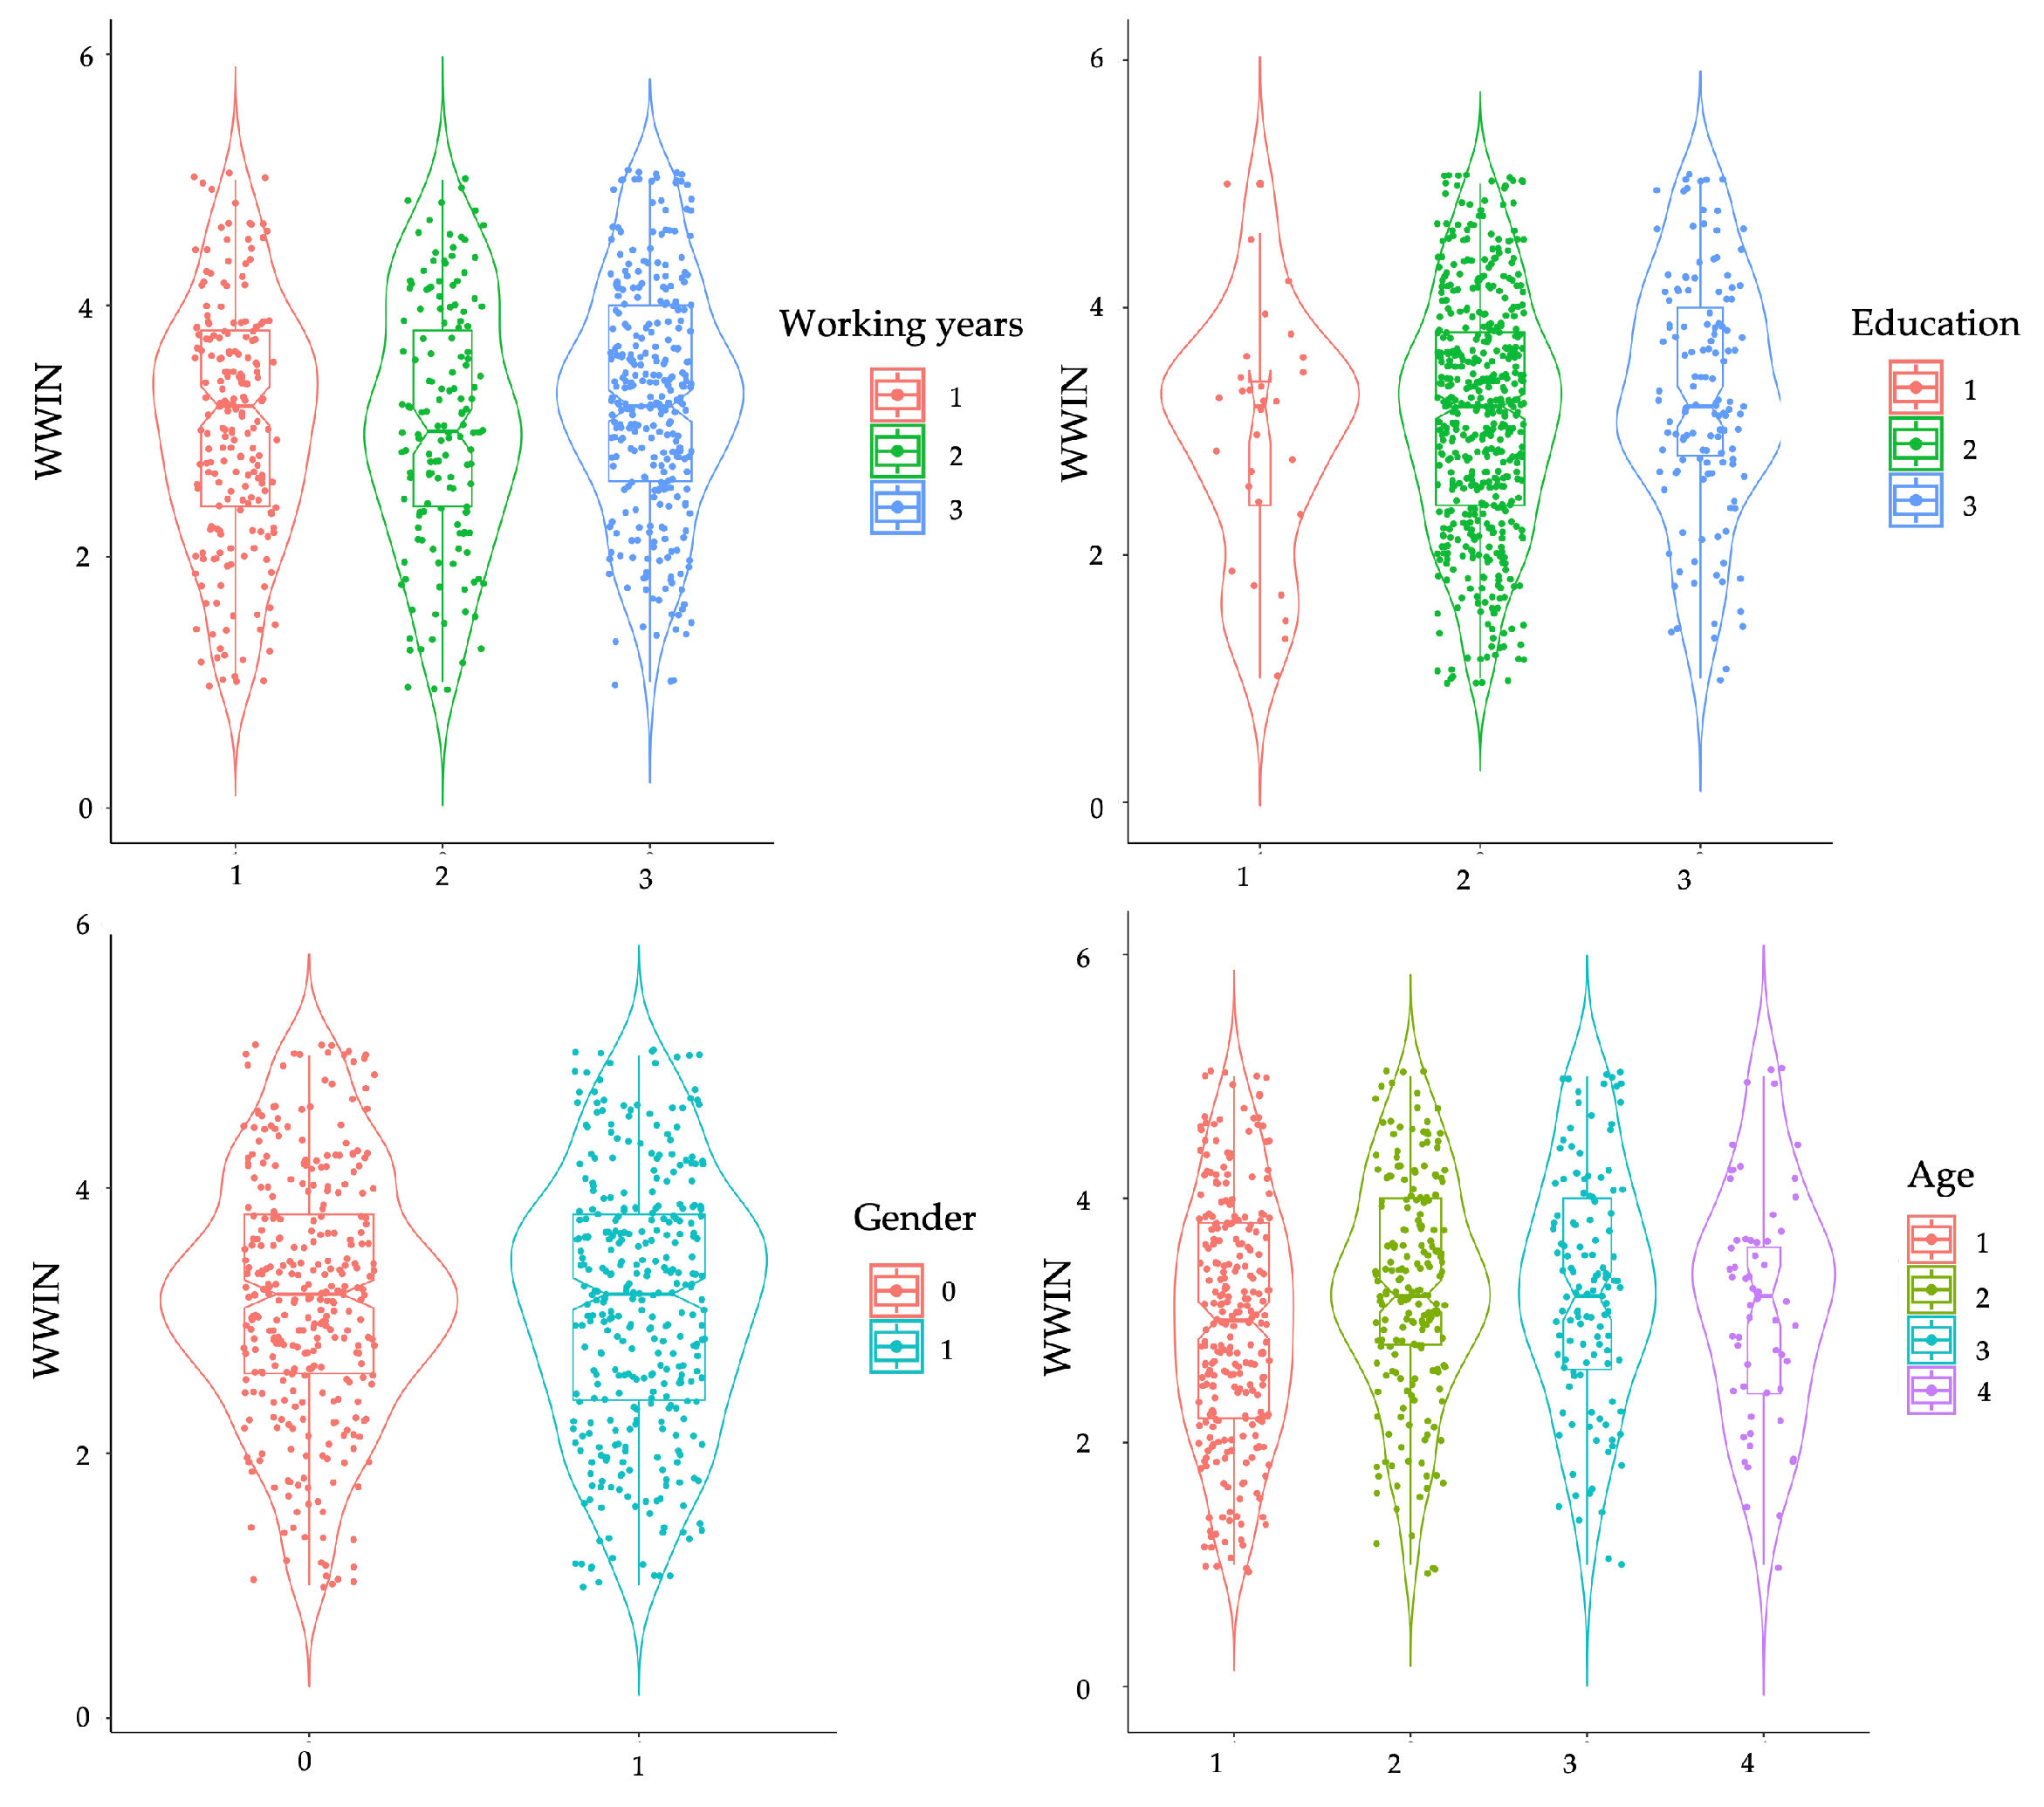
Third, for all covariates, the boxplot function is used to analyze their relationships with the target variable. As depicted in Figure 4, employees from all age groups experience WWIN, with those aged between 30 and 40 years exhibiting higher median values of WWIN behavior. Moreover, employees with higher educational levels are more prone to experience increased WWIN. Employees with fewer than 5 years or more than 10 years of work experience are also more likely to encounter WWIN. There is no discernible relationship between gender and WWIN. The descriptive statistics of all variables are shown in Table A2 in Appendix C.
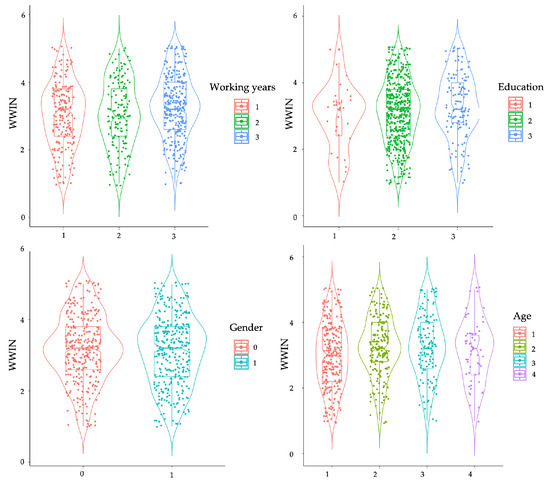
Figure 4.
WWIN by social-demographic characteristics.
4.2.2. Model Selection
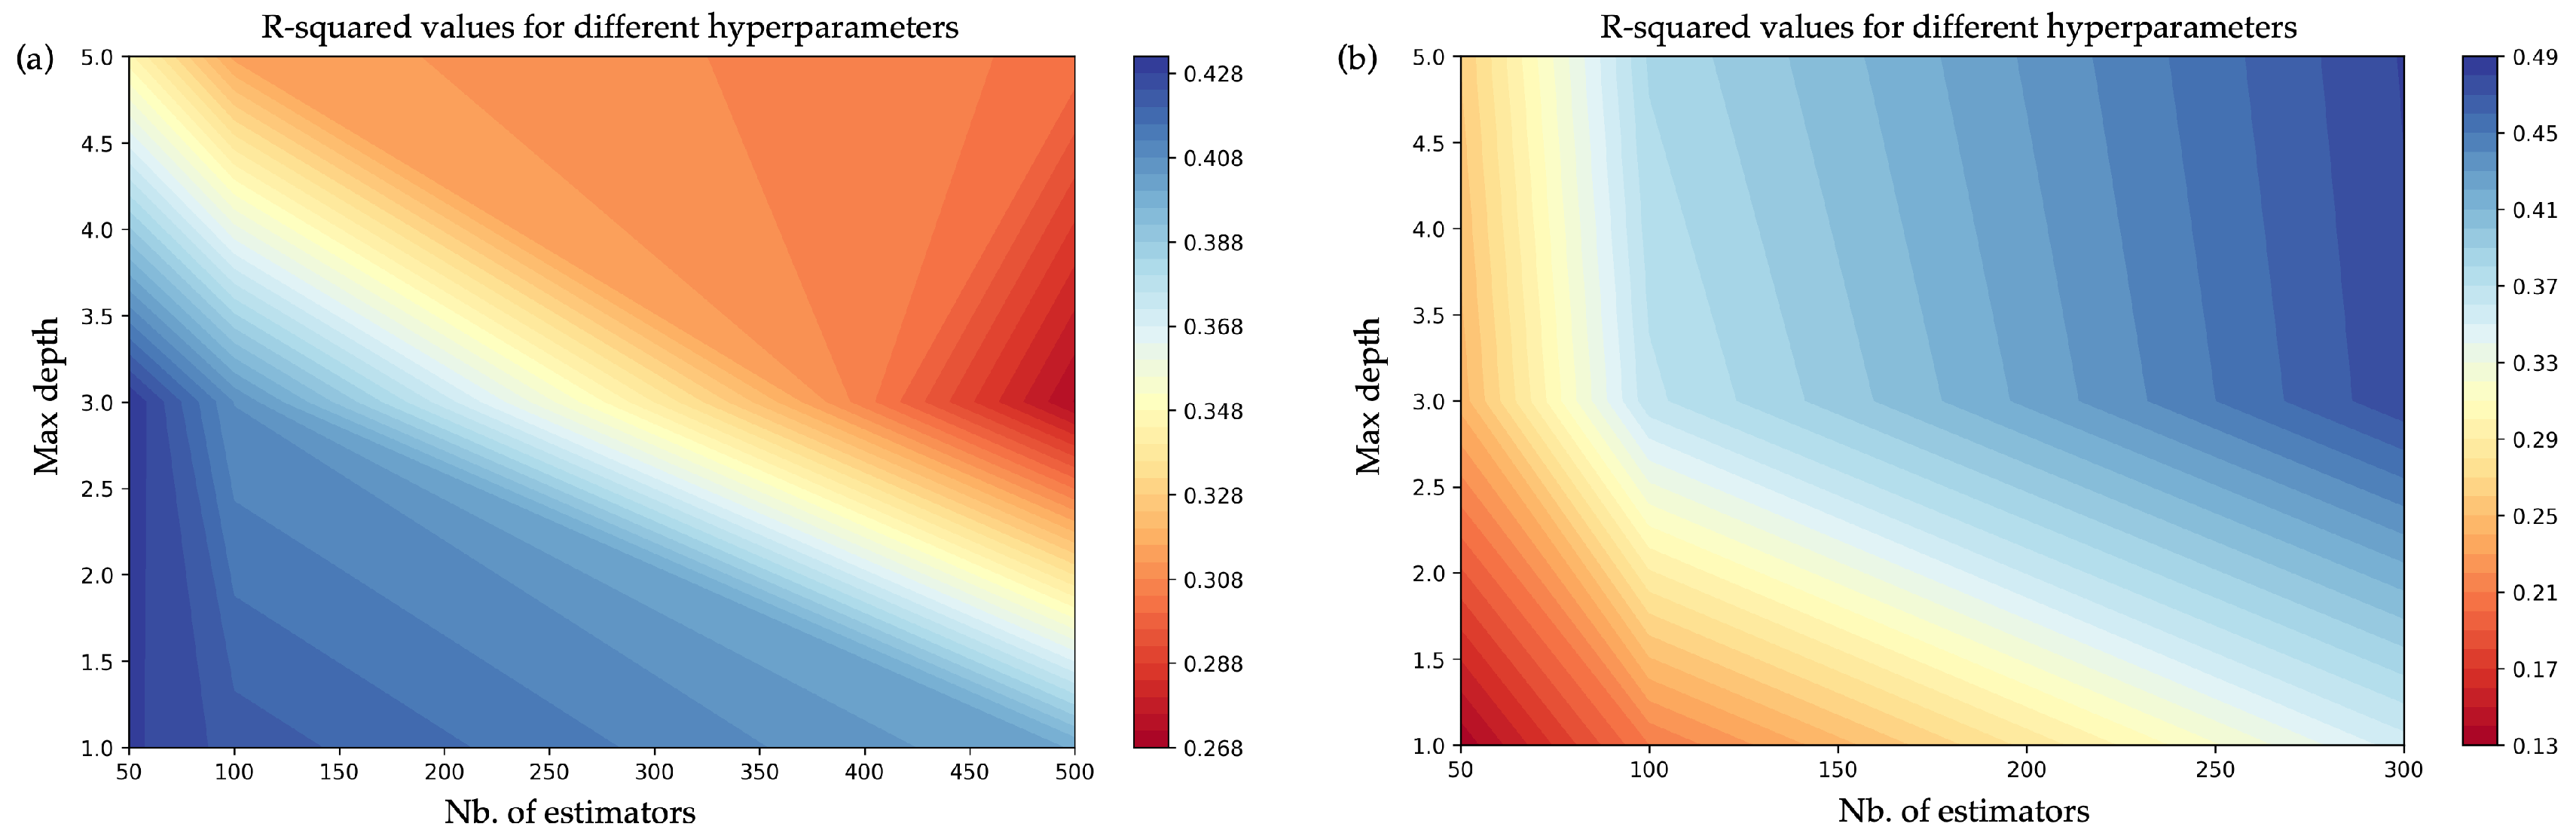
In ensemble learning techniques, hyperparameter optimization is crucial for enhancing prediction accuracy, especially in bagging-based approaches. Taking the XGBoost as an example, by manually specifying the key hyperparameters and , we are able to visualize the R-squared values in the contour plots in Figure 5. It can be seen that the R-squared values improve when is relegated to below 300, resulting in almost all R-squared values being above approximately 0.4, irrespective of variations in . Nevertheless, this manual manipulation only displays the effects of two hyperparameters at a time and can be arduous. Instead, the K-Fold CV is more efficient for simultaneously tuning multiple hyperparameters. To this end, we use the aforementioned technique for hyperparameters optimization. The results of the model performance are shown in Table 3.
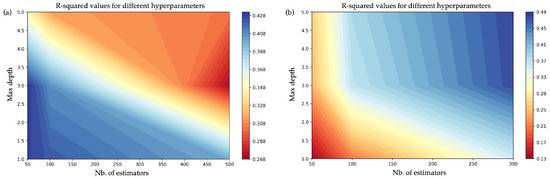
Figure 5.
Contour plots of R-squares with default hyperparameters configuration. (a) The number of estimators is limited to 500. (b) The number of estimators is limited to 300.
Table 3.
Model performance comparison.
It can be observed that both LightGBM and XGBoost models yield acceptable results, with values exceeding 0.5. XGBoost provides the highest value, coupled with the lowest RMSE, MSE, and MAE among all models considered in this study, thereby outperforming the other models. The performance metrics for the RF model are slightly inferior compared to those of LightGBM, while the LR model exhibits the poorest results. The average of the squares of the errors (MSE), which are the differences between the observed values and the values predicted by the model, is significantly reduced in the XGBoost model. These findings indicate that XGBoost holds significant advantages in forecasting WWIN behavior. The superior performance of machine learning models suggests that the relationships between the input features and WWIN are likely intricate and nonlinear.
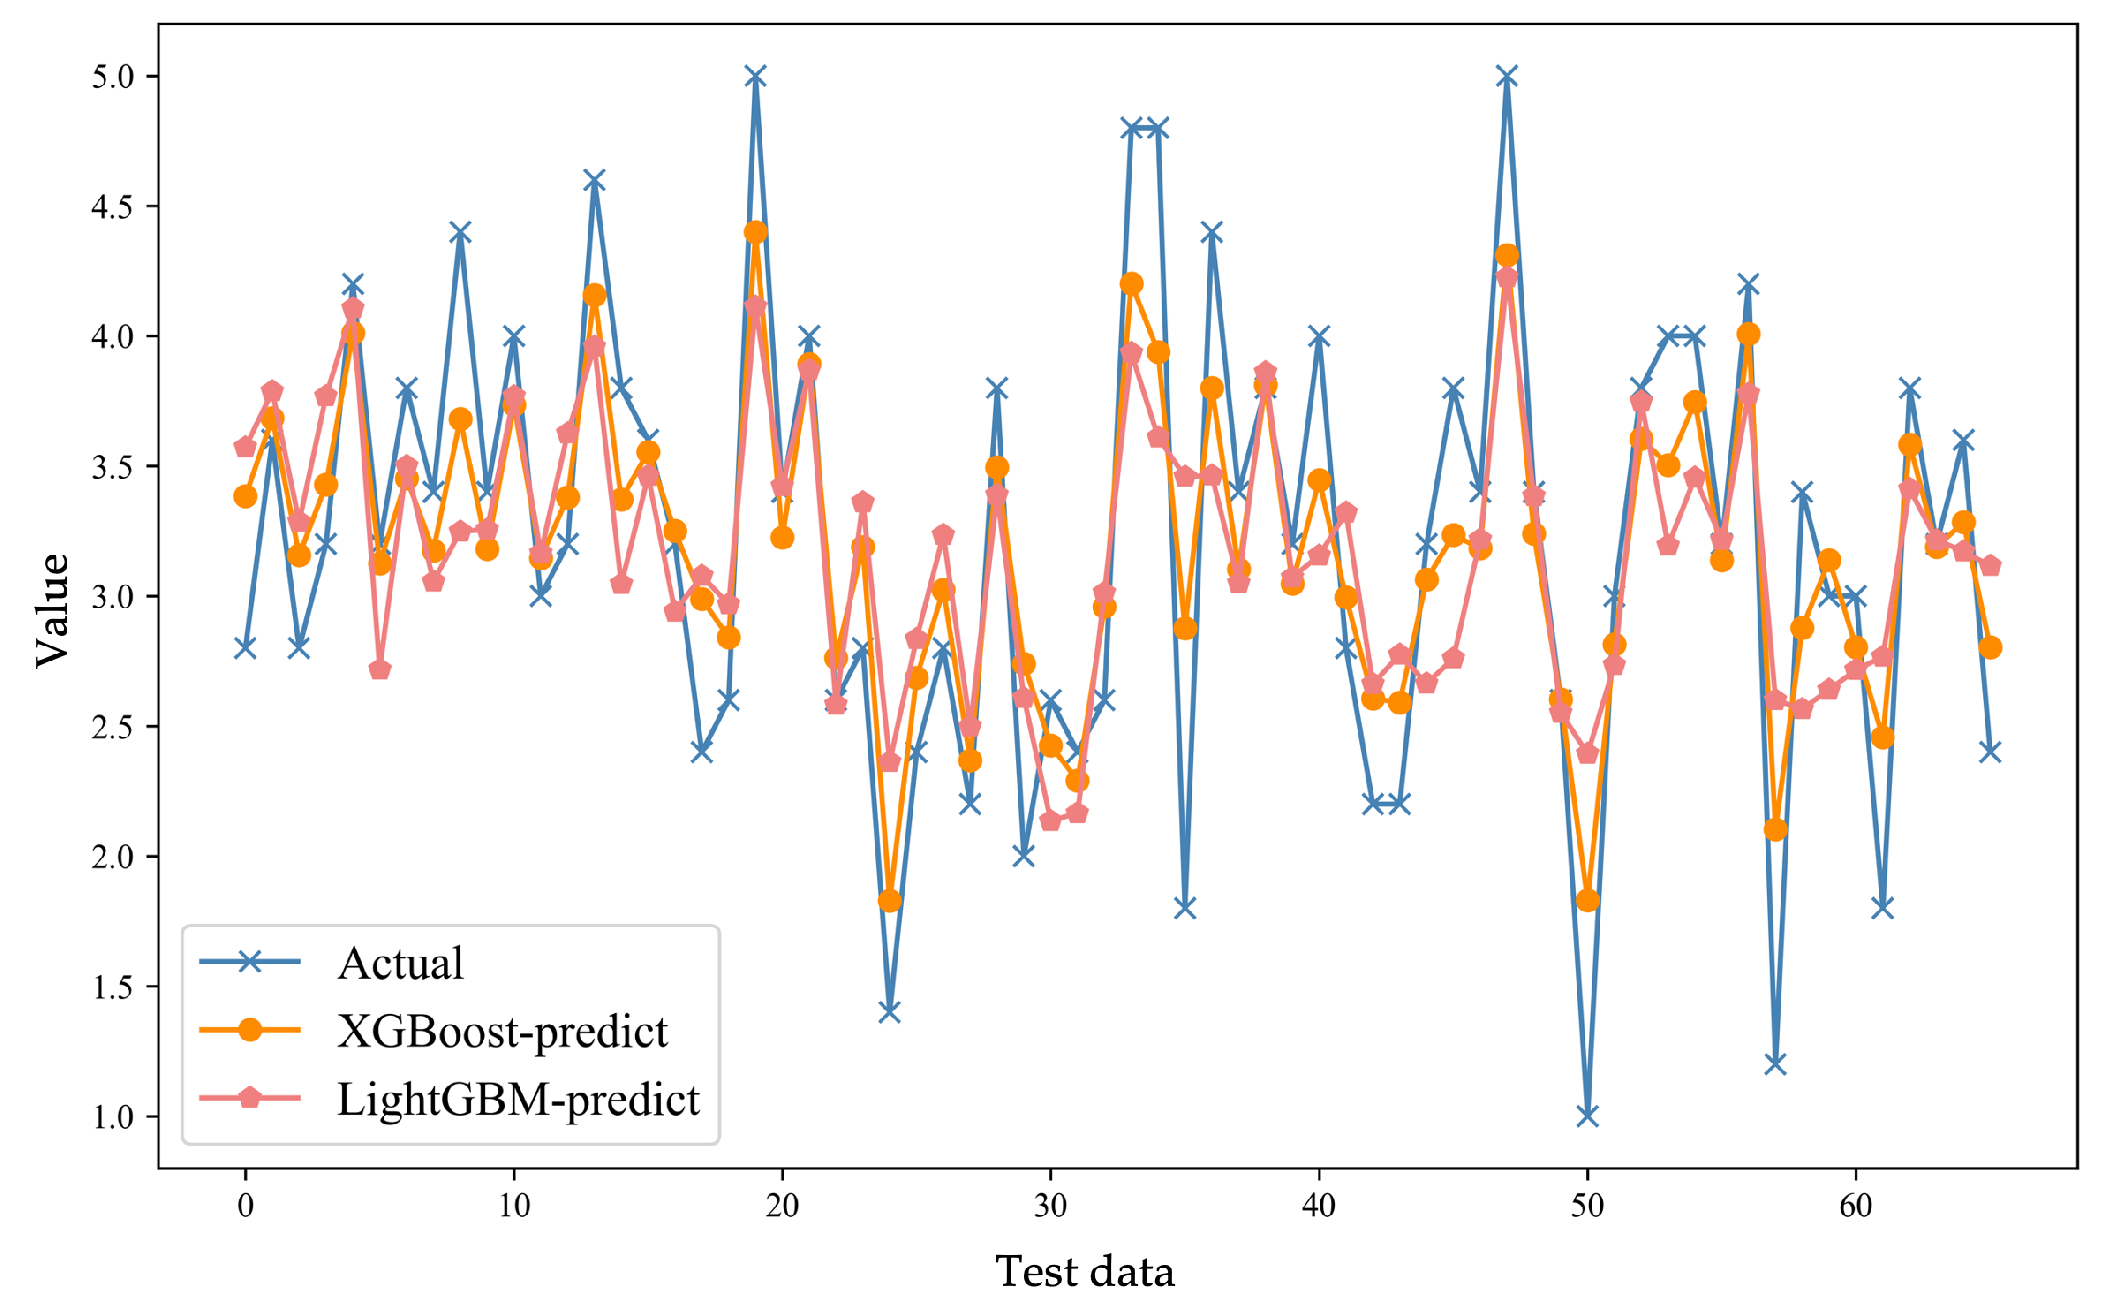
To assess the predictive power of our analysis, we illustrate the top two superior models in Figure 6, which depicts the prediction accuracy using R-squared values based on the 10% testing data. The orange line represents the predictive power of XGBoost, and it can be observed that the predictions are extremely close to the actual values in the test dataset. The effectiveness of the XGBoost algorithm has been validated in numerous existing studies across a wide range of subjects [23,52,53,54]. Our study corroborates these prior findings and further demonstrates its robust effectiveness for predicting human behavior in a managerial context.
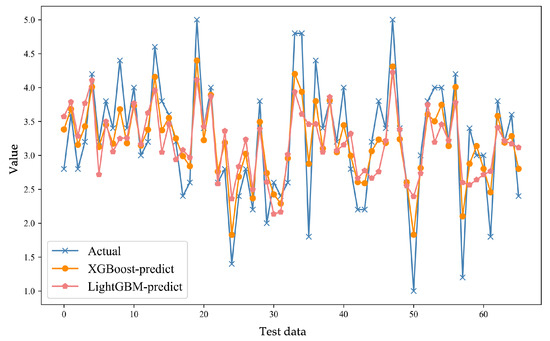
Figure 6.
Prediction accuracy.
4.2.3. SHAP Values Analysis
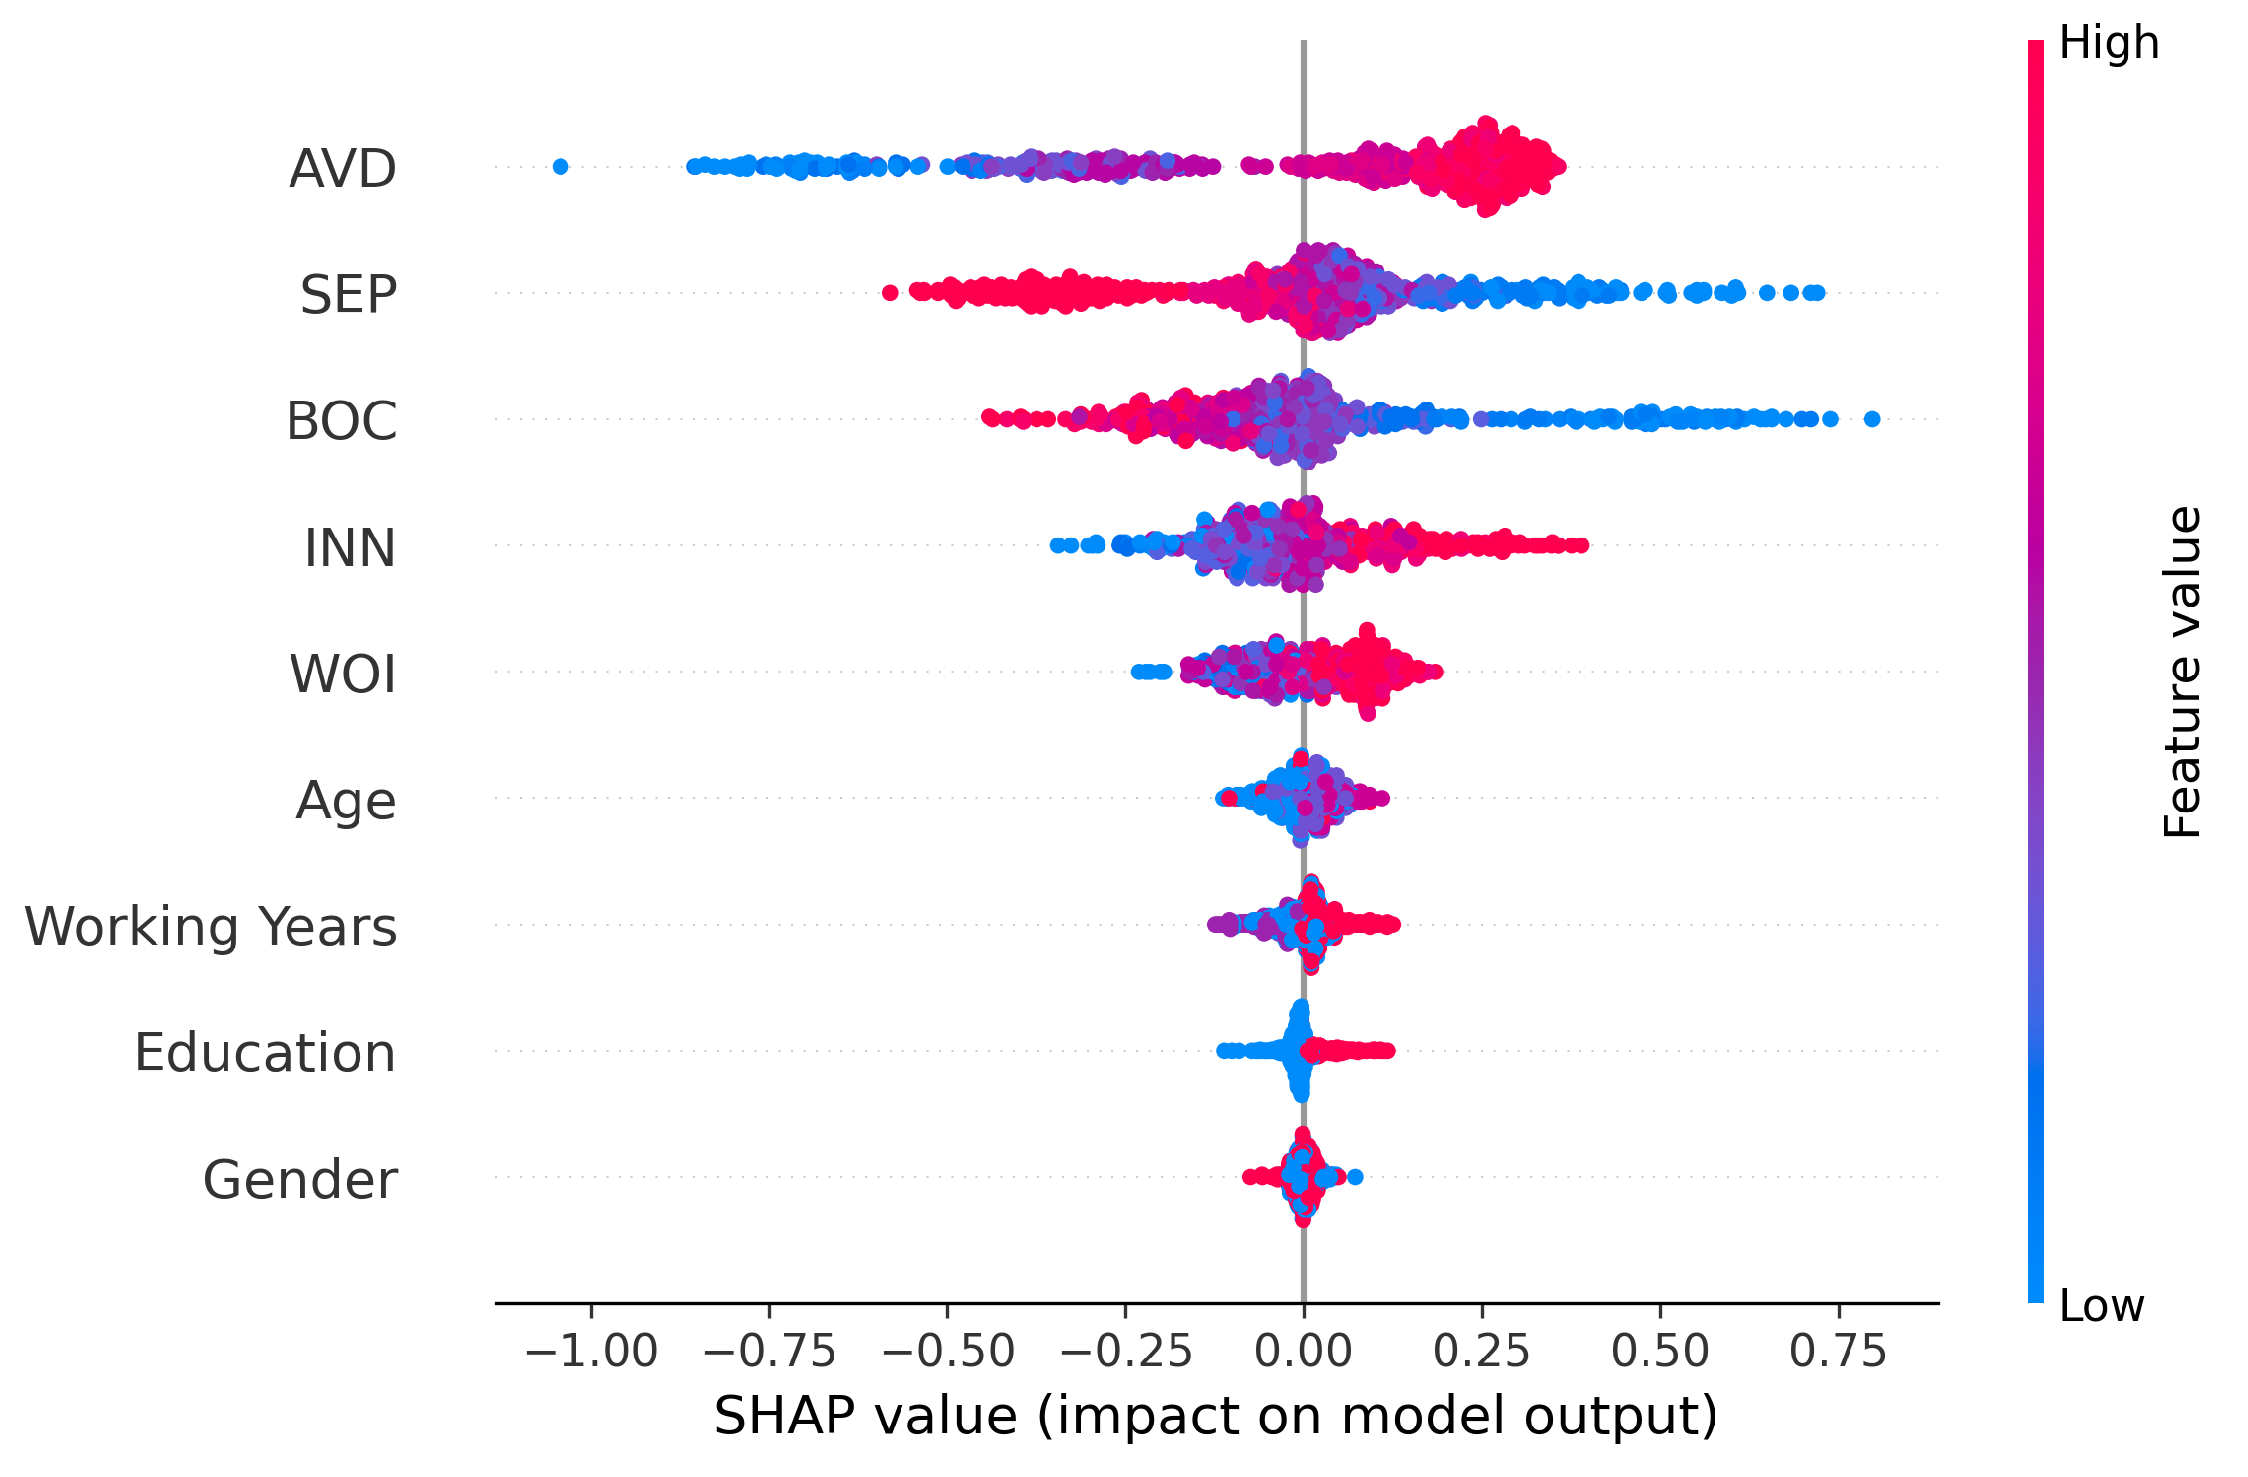
The SHAP interpretation analyses based on XGBoost prediction are depicted in Figure 7 and Figure 8. The SHAP summary plot (see Figure 7) is a beeswarm plot displaying an information-dense summary of all samples, reflecting the distribution of the SHAP value of each feature devoted to the predicted results. The features in the Y-axis are arranged in ascending order according to the features’ importance. The X-axis position of a dot conveys information about the impact of the specific feature on the model output for that specific data point. The overlap point is jittered upwards on the Y-axis. The color shades correspond to the right-hand legend and reflect the feature value strength. According to Figure 7, AVD is an essential feature, followed by SEPs, BOC, and INNs in determining the behavior prediction model. Specifically, higher AVD values result in higher SHAP values, corresponding to a high boundary integration behavior. On the contrary, lower AVD values could decrease such behavior. Interestingly, the distribution of SHAP values is asymmetrical along the perpendicular line between the negative and positive SHAP value regions relative to the X-axis. There is a ceiling effect for the positive impact of AVD on WWIN; once AVD reaches a certain threshold, its contribution to positive effects diminishes. However, on the opposite side, low AVD values can continuously reduce the SHAP values significantly away from the perpendicular line. Furthermore, for moderate levels of AVD (dots colored in purple), the dots are predominantly located to the left of the SHAP value equal to zero, suggesting that a moderate level of AVD exerts minimal positive effects on WWIN. In a nutshell, AVD is the most important feature in predicting WWIN behavior and its impacts are nonlinear.
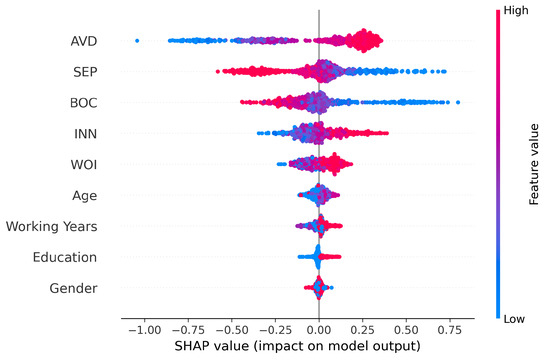
Figure 7.
SHAP summary plot.

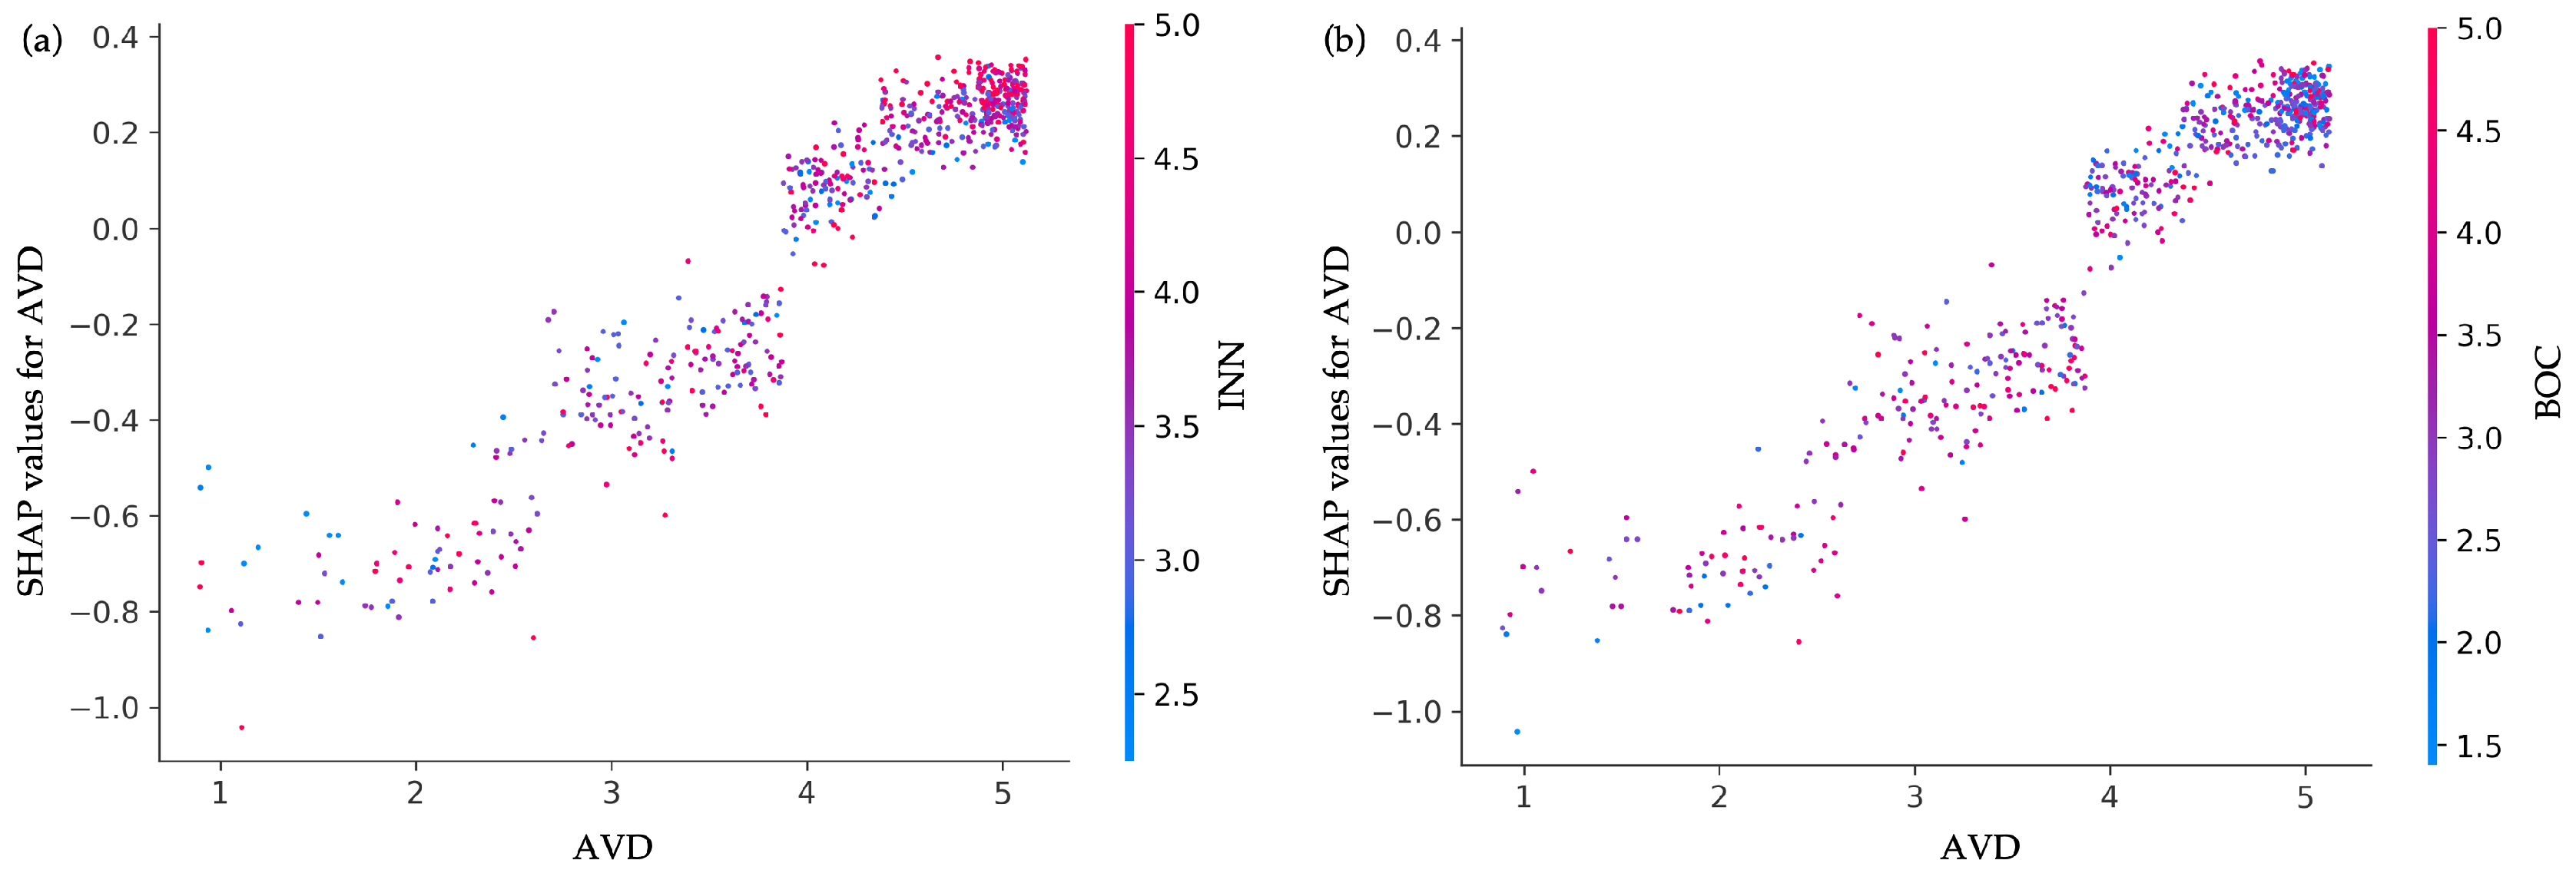
Figure 8.
Dependence plots of features and SHAP values. (a) The interaction plot between AVD and INN. (b) The interaction plot between AVD and BOC.
We move on to interpret the importance of the remaining features. Features SEPs and BOC generally show similar patterns in prediction. Features SEPs and BOC reveal similar patterns in prediction. Specifically, higher values of SEPs and BOC are associated with lower SHAP values, indicating lower integration behavior, and vice versa. The difference between SEPs and BOC becomes evident when considering individuals with moderate levels of these predictors. For SEPs, dots are primarily located to the right of the perpendicular line compared to BOC, suggesting that people with a moderate level of SEPs are more inclined to integrate their work and life, reflected by positive SHAP values. In other words, individuals with a moderate level of boundary control tend to implement stricter strategies to maintain a separation between work and life, resulting in low or nearly zero integration predictions. Conversely, those with moderate segmentation preferences (i.e., a tolerance for a permeable boundary) are more inclined to engage in boundary integration behavior. This finding helps us differentiate the roles of SEPs and BOC, which are often used interchangeably. Regarding INNs and WOI, their impacts on WWIN are minimal. For very high values of INNs and WOI, positive SHAP values are observed. However, in all other cases, their impacts on WWIN are generally negative. With respect to socio-demographic characteristics, the higher the values of working years and educational level, the more likely it is that an integration behavior occurs, which is consistent with intuitive expectations. For other characteristics, the effects are miscellaneous with no clear patterns observed.
The contribution of a feature often depends on the presence of another feature. Therefore, we draw double feature dependence plots to illustrate the relationships between features. Given that AVD is the most important feature, we calculate the top two relevant features associated with it. The results are shown in Figure 8. The X-axis indicates the value of the main feature, while the Y-axis represents the SHAP value of this feature in each data sample. The color bars to the right of each subplot display the values of the variable most dependent on the feature represented by the X-axis. We observe that the most important features interacting with AVD are INNs, followed by BOC. A common attribute in both plots is that when the value of AVD is less than four, the distribution of SHAP values spans a large range. Higher AVD corresponds to higher SHAP values, indicating increased positive effects for individuals experiencing higher injunctive norms. Conversely, a higher AVD combined with lower BOC increases the likelihood of integration behavior.
5. Discussion
Theoretically, the results address the research question of whether mobile platforms are the presumptive culprits of work–life integration. We analyzed the nonlinear behavioral patterns associated with technology-induced work–life imbalance. From a methodological perspective, we developed a fully data-driven approach that includes the co-occurrence network technique and an explainable AI framework incorporating machine learning algorithms and SHAP techniques. Our discussions were organized around the theoretical, practical, and methodological contributions as follows.
First, we found that the availability demands triggered by mobile platforms are the most influential factor leading employees to tolerate the encroachment of work into their non-work domains. The convenience and connectivity provided by these platforms afford employees greater flexibility but also result in prolonged working hours. This aligns with critiques that highlight the darker aspects of technology, describing it as a tyrant (see article [55]). Our results, grounded in an explainable AI framework, suggest that individuals experiencing low availability demands are more inclined to maintain a clear separation between their work and personal lives. Conversely, increased availability demands on mobile platforms do not necessarily correlate with a continuous tolerance for a permeable and integrated work–life boundary. This finding extends prior studies by demonstrating that there is a threshold for the positive association between mobile platform usage and work–life integration behavior, suggesting that the negative aspects of technology might be exaggerated [56]. While availability demands facilitated by mobile platforms enable employees to work anywhere and anytime, as argued in [57], the decision to integrate work into personal life largely remains at their discretion.
Second, in juxtaposing the nonlinear relationships observed, we identified two behavioral patterns—work–life integration and separation—underscoring the importance of considering the dichotomy of such behaviors. To enhance work–life integration, executives and managers should recognize that merely imposing high availability demands does not necessarily result in employees being more diligent or productive. Other factors, such as integration norms and high job autonomy, are more significant in influencing employees to work during non-work hours. In other words, whether employees choose to work during their leisure time is a complex decision influenced by their colleagues’ behaviors and the degree of job autonomy they possess.
Conversely, to mitigate any imbalance and promote sustainable human resource development, organizations could adopt strategies to discourage integration behavior. This can be achieved by reducing availability demands on mobile platforms and fostering an environment that emphasizes the separation of work and personal life. In this regard, our study diverges from prior research that predominantly addresses a single perspective, thereby failing to provide a comprehensive solution for organizations.
By highlighting the multifaceted nature of work–life integration and separation, we offer a holistic understanding of the impacts of mobile platform usage. This approach allows organizations to tailor their strategies effectively and agilely according to their specific targets, balancing the benefits and drawbacks of mobile technology platforms with their needs.
Methodologically, our contributions are twofold. Instead of relying on a contrived scheme to manually sort out all determinants of integration behavior, we utilized a robust data-driven method. Specifically, we innovatively identified key phrases from the existing literature using qualitative analysis tools and subsequently applied a co-occurrence network to calculate the nodes and links between variables. This approach allowed us to explore less apparent determinants that might have been overlooked due to the constraints of specific theoretical frameworks. During the feature extraction process, we observed that much of the existing literature on this topic selects variables based on instinct or a theoretical frame, which is prone to preference bias. By extracting influencing factors grounded in the existing knowledge, we were able to unravel a comprehensive scene graph of integration behavior.
In addition, we incorporated principles from behavioral sciences into an explainable AI framework. While a vast body of existing studies employs numerical input features that are directly measured (e.g., [38,54]), our approach diverged by using survey data to build a predictive model. Through rigorous statistical examination, we demonstrated that using survey data for predictive modeling is both feasible and effective. This responds to the recent call for expanding the application of AI in various managerial studies [58], which are often intertwined with survey data and linear regression models.
6. Conclusions
In conclusion, by developing a completely data-driven methodology, our findings can be summarized as follows. First, we identified that beyond the availability demands on mobile platforms, other factors such as segmentation preferences, boundary control, integration norms, and work identity also play important roles in shaping work–life integration behavior. The results from the explainable AI framework indicate that availability demands are the most significant contributing factor, yet their positive and negative impacts are not equally distributed.
In instances where availability demands are extremely high, employees tend to take matters into their own hands and do not allow work to intrude upon their personal lives without control. Specifically, they may tolerate overtime work caused by mobile platforms, but the positive influences of such tolerance are neither as considerable nor as persistent as assumed in linear regression models.
Furthermore, individuals who prioritize their work identity more prominently tend to engage in work–life integration when faced with higher availability demands. In this case, their actions align with their role identity and are likely to be self-motivated. Conversely, employees with limited job autonomy and control are also likely to adopt work–life integration behaviors under high availability demands. However, their actions are more likely to be organizationally enforced and determined by job characteristics, with little individual preference.
These nuanced insights highlight the complexity of work–life integration behaviors and the need for personalized strategies in managing work and personal life boundaries in a mobile technology-driven workplace.
Our study makes a significant contribution to the academic discourse by addressing the nonlinear and multifaceted nature of work–life integration behaviors influenced by mobile platforms. We offer a nuanced perspective that challenges existing linear models, thereby enriching the scholarship on technology-induced work–life dynamics. Orienting the AI-empowered workplace towards a sustainable future requires a thorough understanding of how technology revolutionizes our daily activities. Such understanding aids scholars and practitioners in formulating strategies for a sustainable future, considering the intricate interactions between humans and technology.
Our methodological contributions are also significant. The introduction of a fully data-driven methodology, featuring the co-occurrence network technique and an explainable AI framework with machine learning algorithms and SHAP techniques, provides a robust and transparent way to understand complex behavior patterns. This methodology not only enhances the accuracy and validity of our findings but also offers a replicable framework for future research. The use of explainable AI techniques ensures that the results are interpretable and actionable, thus bridging the gap between theoretical insights and practical applications.
Our study does, however, have some limitations. It is important to note that SHAP values provide interpretations based on associations, akin to linear regression models, and do not establish causality. Our analyses are susceptible to omitted variable bias and do not encompass all socio-demographic variables due to ethical regulations and anonymity considerations. For instance, we did not consider indicators such as leader support or self-efficacy, which may affect human–technology interaction. Additionally, reaching a representative sample would be conducive to building a robust predictive model. Moreover, we relied on only four analytical methods. Future research could benefit from applying a broader range of models, such as Artificial Neural Networks (ANNs), Support Vector Machines (SVMs), and hybrid machine learning models, to gain a deeper understanding of the phenomenon. Nonetheless, this study represents a significant step forward in developing interpretable machine learning models to explore complex relationships, thereby broadening the potential application of ML algorithms in managerial contexts.
Author Contributions
Conceptualization, X.W.; methodology, X.W. and Y.M.; software, Y.M.; writing—original draft preparation, X.W.; writing—review and editing, X.W.; supervision, G.H. All authors have read and agreed to the published version of the manuscript.
Funding
This research was supported by the National Social Science Foundation of China (Grant No. 20&ZD154).
Institutional Review Board Statement
Not applicable.
Informed Consent Statement
Informed consent was obtained from all subjects involved in this study.
Data Availability Statement
Further inquiries can be directed to the corresponding author.
Conflicts of Interest
The authors declare no conflicts of interest.
Appendix A
| Algorithm A1 Constructing and Drawing Co-Occurrence Graph. |
|
Appendix B
Table A1.
Variables corresponding measurement and the reliability.
Table A1.
Variables corresponding measurement and the reliability.
| Variables (Cronbach’s Alpha) | Items | Item Loadings |
|---|---|---|
| AVD (0.868) | 1. I am expected to be accessible at all times through mobile platforms (e.g., instant messaging, work apps). | 0.998 |
| 2. Mobile platforms enable people I work with to contact me at any time. | 0.849 | |
| 3. I am expected to check e-mail and/or work messages on mobile platforms when I’m out of the office | 0.878 | |
| 4. I am contacted about work-related issues outside of regular work hours. | 0.926 | |
| SEP (0.770) | 1. I do not like to have to think about work while I am at home. | 0.769 |
| 2. I prefer to keep work life at work. | 0.858 | |
| 3. I do not like work issues creeping into my home life. | 0.787 | |
| 4. I like to be able to leave work behind when I go home. | 0.707 | |
| BOC (0.861) | 1. I control whether I am able to keep my work and personal life separate. | 0.882 |
| 2. I control whether I have clear boundaries between my work and personal life. | 0.751 | |
| 3. I control whether I combine my work and personal life activities throughout the day. | 0.911 | |
| WOI (0.872) | 1. In my view, an individual’s personal life goals should be work-oriented rather than family-oriented. | 0.720 |
| 2. The major satisfaction in my life comes from my work rather than family. | 0.728 | |
| 3. The most important things that happen to me involve my work rather than family. | 0.951 | |
| 4. Work should be considered central to life rather than family. | 0.968 | |
| 5. Overall, I consider work to be more central to my existence than family. | 0.705 | |
| INN (0.815) | 1. In my work, my employer expects from me to be flexible as far as my working hours are concerned. | 0.765 |
| 2. In my work, my employer expects from me to work overtime. | 0.877 | |
| 3. In my work, my employer expects from me to work in the evenings, at night and at weekends. | 0.746 | |
| 4. In my work, my employer expects from me to help out when colleagues are absent | ||
| 5. The people I work with can keep work matters at work. | 0.770 | |
| 6. The people I work with are able to prevent work issues from creeping into their home life. | 0.712 | |
| 7. The people I work with can forget about work when they are at home. | 0.730 | |
| WWIN (0.815) | 1. I regularly bring work home. | 0.750 |
| 2. I respond to work-related communications on mobile platforms during my personal time away from work. | 0.785 | |
| 3. I allow work to interrupt me when I spend time with my family or friends. | 0.913 | |
| 4. I usually bring work materials with me when I attend personal or family activities. | 0.748 |
Notes: The anchors for these scales are: 1 = strongly disagree to 5 = strongly agree (5-point Likert scale).
Appendix C
Table A2.
Descriptive statistics.
Table A2.
Descriptive statistics.
| Mean(SD)/Freq(%) | |||
|---|---|---|---|
| Input features | |||
| Covariates | |||
| Gender | 0—322(48.94%) | - | - |
| 1—336(51.06) | - | - | |
| Age | 1—270(41.03%) | - | - |
| 2—204(31.00%) | - | - | |
| 3—125(18.99%) | - | - | |
| 4—59(8.97%) | - | - | |
| Working Years | 1—205(31.16%) | - | - |
| 2—150(22.79%) | - | - | |
| 3—303(46.05%) | - | - | |
| Education | 1—29(4.41%) | - | - |
| 2—544(82.67%) | - | - | |
| 3—132(20.06%) | - | - | |
| Independent variables | |||
| AVD | 4.10(0.98) | −1.15 | 0.63 |
| WOI | 4.09(0.90) | −1.00 | 0.62 |
| BOC | 3.06(0.99) | 0.05 | −0.47 |
| INNs | 3.77(0.83) | −0.39 | 0.08 |
| SEPs | 4.07(0.82) | −0.82 | 0.36 |
| Target variable | |||
| WWIN | 3.14(0.96) | −0.11 | −0.58 |
Notes: Covariates are categorical variables include: Gender: 0—Female, 1—Male; Age: 1—Below 30 years old, 2—Between 31 and 40 years old, 3—Between 41 and 50 years old, 4—Above 51 years old; Working Years: 1—Below 5 years, 2—Between 5 and 10 years, 3—Above 10 years; Education: 1—College or below, 2—Bachelor, 3—Master’s or above. The recommended values of skewness and kurtosis are within the range of .
Appendix D
The co-occurrence matrix is represented as an matrix C, where m denotes the number of unique phrases in the dataset. The element of the matrix indicates the number of times the phrase i co-occurs with the phrase j:
where I is an indicator function that equals 1 if the condition is true and 0 otherwise, and denotes the kth phrase in the sequence of text.
The mathematical expressions of , , , are provided below.
where p is the actual experimental values, q is the predicted values, calculated according to the model’s prediction, whereas N denotes the sample numbers.
The mathematical expression of the Pearson correlation coefficient is
where n is the number of paired scores, and are the individual sample points indexed with i, is the mean of the X values, is the mean of the Y values.
References
- TechNode. Alibaba’s DingTalk Records 600 Million Users, Works to Accelerate Monetization. 2022. Available online: https://technode.com/2022/12/29/alibabas-dingtalk-records-600-million-users-works-to-accelerate-monetization/ (accessed on 8 August 2024).
- Business of Apps. Slack Statistics. 2022. Available online: https://www.businessofapps.com/data/slack-statistics/ (accessed on 8 August 2024).
- Mariani, M.; Wamba, S.F.; Castaldo, S.; Santoro, G. The rise and consolidation of digital platforms and technologies for remote working: Opportunities, challenges, drivers, processes, and consequences. J. Bus. Res. 2023, 160, 113617. [Google Scholar] [CrossRef]
- Bunjak, A.; Černe, M.; Popovič, A. Absorbed in technology but digitally overloaded: Interplay effects on gig workers’ burnout and creativity. Inf. Manag. 2021, 58, 103533. [Google Scholar] [CrossRef]
- Singh, P.; Bala, H.; Dey, B.L.; Filieri, R. Enforced remote working: The impact of digital platform-induced stress and remote working experience on technology exhaustion and subjective wellbeing. J. Bus. Res. 2022, 151, 269–286. [Google Scholar] [CrossRef]
- Sun, Y.; Liu, Y.; Zhang, J.Z.; Fu, J.; Hu, F.; Xiang, Y.; Sun, Q. Dark side of enterprise social media usage: A literature review from the conflict-based perspective. Int. J. Inf. Manag. 2021, 61, 102393. [Google Scholar] [CrossRef]
- Kim, H.J.; Lee, C.C.; Yun, H.; Im, K.S. An examination of work exhaustion in the mobile enterprise environment. Technol. Forecast. Soc. Chang. 2015, 100, 255–266. [Google Scholar] [CrossRef]
- Jasmina, S.; Pilav-Velić, A.; Krndžija, L. Digital workplace transformation in the financial service sector: Investigating the relationship between employees’ expectations and intentions. Technol. Soc. 2021, 66, 101640. [Google Scholar]
- Warren, T. Work–life balance/imbalance: The dominance of the middle class and the neglect of the working class. Br. J. Sociol. 2015, 66, 691–717. [Google Scholar] [CrossRef]
- Qiu, D.; Li, Y.; Li, R.; He, J.; Ouyang, F.; Luo, D.; Xiao, S. Long working hours, work-related stressors and sleep disturbances among Chinese government employees: A large population-based follow-up study. Sleep Med. 2022, 96, 79–86. [Google Scholar] [CrossRef]
- Chu, L. Impact of long working hours on health based on observations in China. BMC Public Health 2021, 21, 1347. [Google Scholar] [CrossRef]
- Williams, K.J.; Suls, J.; Alliger, G.M.; Learner, S.M.; Wan, C.K. Multiple role juggling and daily mood states in working mothers: An experience sampling study. J. Appl. Psychol. 1991, 76, 664. [Google Scholar] [CrossRef]
- Park, Y.; Liu, Y.; Headrick, L. When work is wanted after hours: Testing weekly stress of information communication technology demands using boundary theory. J. Organ. Behav. 2020, 41, 518–534. [Google Scholar] [CrossRef]
- Park, Y.; Liu, Y.; Headrick, L. The use of mobile technologies for work-to-family boundary permeability: The case of Finnish and Canadian male lawyers. Hum. Relat. 2020, 73, 1388–1414. [Google Scholar]
- Ashforth, B.E.; Kreiner, G.E.; Fugate, M. All in a day’s work: Boundaries and micro role transitions. Acad. Manag. Rev. 2000, 25, 472–491. [Google Scholar] [CrossRef]
- Ammons, S.K. Work-family boundary strategies: Stability and alignment between preferred and enacted boundaries. J. Vocat. Behav. 2013, 82, 49–58. [Google Scholar] [CrossRef]
- Kao, K.Y.; Chi, N.W.; Thomas, C.L.; Lee, H.T.; Wang, Y.F. Linking ICT availability demands to burnout and work-family conflict: The roles of workplace telepressure and dispositional self-regulation. J. Psychol. Interdiscip. Appl. 2020, 154, 325–345. [Google Scholar] [CrossRef]
- Cho, S.; Kim, S.; Chin, S.W.; Ahmad, U. Daily effects of continuous ICT demands on work–family conflict: Negative spillover and role conflict. Stress Health 2020, 36, 533–545. [Google Scholar] [CrossRef]
- Peng, J.; Zou, K.; Zhou, M.; Teng, Y.; Zhu, X.; Zhang, F.; Xu, J. An explainable artificial intelligence framework for the deterioration risk prediction of hepatitis patients. J. Med. Syst. 2021, 45, 661. [Google Scholar] [CrossRef]
- Tasin, I.; Nabil, T.U.; Islam, S.; Khan, R. Diabetes prediction using machine learning and explainable AI techniques. Healthc. Technol. Lett. 2023, 10, 1–10. [Google Scholar] [CrossRef]
- Abdalzaher, M.S.; Soliman, M.S.; Krichen, M.; Alamro, M.A.; Fouda, M.M. Employing Machine Learning for Seismic Intensity Estimation Using a Single Station for Earthquake Early Warning. Remote Sens. 2024, 16, 2159. [Google Scholar] [CrossRef]
- Abdalzaher, M.S.; Soliman, M.S.; El-Hady, S.M. Seismic intensity estimation for earthquake early warning using optimized machine learning model. IEEE Trans. Geosci. Remote Sens. 2023, 61, 5914211. [Google Scholar] [CrossRef]
- Parsa, A.B.; Movahedi, A.; Taghipour, H.; Derrible, S.; Mohammadian, A.K. Toward safer highways, application of XGBoost and SHAP for real-time accident detection and feature analysis. Accid. Anal. Prev. 2020, 136, 105405. [Google Scholar] [CrossRef]
- Zhou, F.; Alsaid, A.; Blommer, M.; Curry, R.; Swaminathan, R.; Kochhar, D.; Talamonti, W.; Tijerina, L. Predicting driver fatigue in monotonous automated driving with explanation using GPBoost and SHAP. Int. J. Hum. Comput. 2022, 38, 719–729. [Google Scholar] [CrossRef]
- Ullah, I.; Liu, K.; Yamamoto, T.; Zahid, M.; Jamal, A. Modeling of machine learning with SHAP approach for electric vehicle charging station choice behavior prediction. Travel Behav. Soc. 2023, 31, 78–92. [Google Scholar] [CrossRef]
- Li, X.; Shi, L.; Shi, Y.; Tang, J.; Zhao, P.; Wang, Y.; Chen, J. Exploring interactive and nonlinear effects of key factors on intercity travel mode choice using XGBoost. Appl. Geogr. 2024, 166, 103264. [Google Scholar] [CrossRef]
- De Alwis, S.; Hernwall, P.; Adikaram, A.S. “It is ok to be interrupted; it is my job”—perceptions on technology-mediated work-life boundary experiences; a sociomaterial analysis. Qual. Res. Organ. Manag. 2022, 17, 108–134. [Google Scholar] [CrossRef]
- Plaza del Pino, F.J.; Chraibi, G.; Molina-Gallego, B.; Humanes-García, M.; Sánchez-Ojeda, M.A.; Ugarte-Gurrutxaga, M.I. Access to the Health Care System of Undocumented Moroccan Migrant Slum Dwellers in Southern Spain: A Qualitative Study. Nurs. Rep. 2024, 14, 494–505. [Google Scholar] [CrossRef]
- Choe, Y.; Lee, J.; Lee, G. Exploring values via the innovative application of social media with parks amid COVID-19: A qualitative content analysis of text and images using ATLAS. Ti. Sustainability 2022, 14, 13026. [Google Scholar] [CrossRef]
- Day, A.; Paquet, S.; Scott, N.; Hambley, L. Perceived information and communication technology (ICT) demands on employee outcomes: The moderating effect of organizational ICT support. J. Occup. Health Psychol. 2012, 17, 473–491. [Google Scholar] [CrossRef]
- Kreiner, G.E. Consequences of work-home segmentation or integration: A person-environment fit perspective. J. Organ. Behav. 2006, 27, 485–501. [Google Scholar] [CrossRef]
- Gardner, D.M.; Lauricella, T.; Ryan, A.M.; Wadlington, P.; Elizondo, F. Managing boundaries between work and non-work domains: Personality and job characteristics and adopted style. J. Occup. Organ. Psychol. 2021, 94, 132–159. [Google Scholar] [CrossRef]
- Hu, S.; Jiang, L.; Probst, T.M.; Liu, M. The relationship between qualitative job insecurity and subjective well-being in Chinese employees: The role of work–family conflict and work centrality. Econ. Ind. Democr. 2021, 42, 203–225. [Google Scholar] [CrossRef]
- Palm, E.; Seubert, C.; Glaser, J. Understanding employee motivation for work-to-nonwork integration behavior: A reasoned action approach. J. Bus. Psychol. 2020, 35, 683–696. [Google Scholar] [CrossRef]
- Mian, Z.; Deng, X.; Dong, X.; Tian, Y.; Cao, T.; Chen, K.; Al Jaber, T. A literature review of fault diagnosis based on ensemble learning. Eng. Appl. Artif. Intell. 2024, 127, 107357. [Google Scholar] [CrossRef]
- Mahajan, P.; Uddin, S.; Hajati, F.; Moni, M.A. Ensemble learning for disease prediction: A review. Healthcare 2023, 11, 1808. [Google Scholar] [CrossRef]
- Wang, Z.; Jiao, P.; Wang, J.; Luo, W.; Lu, H. Contributing factors on the level of delay caused by crashes: A hybrid method of latent class analysis and XGBoost based SHAP algorithm. J. Transp. Saf. Secur. 2024, 16, 97–129. [Google Scholar] [CrossRef]
- Li, Z. Extracting spatial effects from machine learning model using local interpretation method: An example of SHAP and XGBoost. Comput. Environ. Urban Syst. 2022, 96, 101845. [Google Scholar] [CrossRef]
- Breiman, L. Random forests. Mach. Learn. 2001, 45, 5–32. [Google Scholar] [CrossRef]
- Ke, G.; Meng, Q.; Finley, T.; Wang, T.; Chen, W.; Ma, W.; Ye, Q.; Liu, T.Y. Lightgbm: A highly efficient gradient boosting decision tree. Adv. Neural Inf. Process. Syst. 2017, 30, 3146–3154. [Google Scholar]
- González, S.; García, S.; Del Ser, J.; Rokach, L.; Herrera, F. A practical tutorial on bagging and boosting based ensembles for machine learning: Algorithms, software tools, performance study, practical perspectives and opportunities. Inf. Fusion 2020, 64, 205–237. [Google Scholar] [CrossRef]
- Rufo, D.D.; Debelee, T.G.; Ibenthal, A.; Negera, W.G. Diagnosis of diabetes mellitus using gradient boosting machine. Diagnostics 2020, 11, 1714. [Google Scholar] [CrossRef]
- Chen, T.; Guestrin, C. Xgboost: A scalable tree boosting system. In Proceedings of the 22nd ACM Sigkdd International Conference on Knowledge Discovery and Data Mining, San Francisco, CA, USA, 13–17 August 2016; pp. 785–794. [Google Scholar]
- Friedman, J.H. Greedy function approximation: A gradient boosting machine. Ann. Stat. 2001, 15, 1189–1232. [Google Scholar] [CrossRef]
- Liang, W.; Luo, S.; Zhao, G.; Wu, H. Predicting hard rock pillar stability using GBDT, XGBoost, and LightGBM algorithms. Mathematics 2020, 8, 765. [Google Scholar] [CrossRef]
- Sharma, A.; Verbeke, W.J. Improving diagnosis of depression with XGBOOST machine learning model and a large biomarkers Dutch dataset (n = 11,081). Front. Big Data 2020, 3, 15. [Google Scholar] [CrossRef]
- Guo, M.; Yuan, Z.; Janson, B.; Peng, Y.; Yang, Y.; Wang, W. Older pedestrian traffic crashes severity analysis based on an emerging machine learning XGBoost. Sustainability 2021, 13, 926. [Google Scholar] [CrossRef]
- Vakharia, V.; Gujar, R. Prediction of compressive strength and portland cement composition using cross-validation and feature ranking techniques. Constr. Build. Mater. 2019, 225, 292–301. [Google Scholar] [CrossRef]
- Scheibe, S.; Retzlaff, L.; Hommelhoff, S.; Schmitt, A. Age-related differences in the use of boundary management tactics when teleworking: Implications for productivity and work-life balance. J. Occup. Organ. Psychol. 2024, 1–23. [Google Scholar] [CrossRef]
- Bal, P.M.; Van Kleef, M.; Jansen, P.G. The impact of career customization on work outcomes: Boundary conditions of manager support and employee age. J. Organ. Behav. 2015, 36, 421–440. [Google Scholar] [CrossRef]
- Russo, M.; Ollier-Malaterre, A.; Kossek, E.E. Boundary management permeability and relationship satisfaction in dual-earner couples: The asymmetrical gender effect. Front. Psychol. 2018, 9, 1723. [Google Scholar] [CrossRef]
- Yun, K.K.; Yoon, S.W.; Won, D. Prediction of stock price direction using a hybrid GA-XGBoost algorithm with a three-stage feature engineering process. Expert Syst. Appl. 2021, 186, 115716. [Google Scholar] [CrossRef]
- Jabeur, S.B.; Mefteh-Wali, S.; Viviani, J.L. Forecasting gold price with the XGBoost algorithm and SHAP interaction values. Ann. Oper. Res. 2024, 334, 679–699. [Google Scholar] [CrossRef]
- Lei, T.M.; Ng, S.C.; Siu, S.W. Application of ANN, XGBoost, and other ml methods to forecast air quality in Macau. Sustainability 2022, 15, 5341. [Google Scholar] [CrossRef]
- van Zoonen, W.; Treem, J.W.; Ter Hoeven, C.L. A tool and a tyrant: Social media and well-being in organizational contexts. Curr. Opin. Psychol. 2022, 45, 101300. [Google Scholar] [CrossRef] [PubMed]
- Jacukowicz, A.; Merecz-Kot, D. Work-related internet use as a threat to work-life balance-a comparison between the emerging on-line professions and traditional office work. Int. J. Occup. Med. Environ. Health 2020, 33, 21–33. [Google Scholar] [CrossRef] [PubMed]
- Ninaus, K.; Diehl, S.; Terlutter, R. Employee perceptions of information and communication technologies in work life, perceived burnout, job satisfaction and the role of work-family balance. J. Bus. Res. 2021, 136, 652–666. [Google Scholar] [CrossRef]
- Kraus, M.; Feuerriegel, S.; Oztekin, A. Deep learning in business analytics and operations research: Models, applications and managerial implications. Eur. J. Oper. Res. 2020, 281, 628–641. [Google Scholar] [CrossRef]

Disclaimer/Publisher’s Note: The statements, opinions and data contained in all publications are solely those of the individual author(s) and contributor(s) and not of MDPI and/or the editor(s). MDPI and/or the editor(s) disclaim responsibility for any injury to people or property resulting from any ideas, methods, instructions or products referred to in the content. |
© 2024 by the authors. Licensee MDPI, Basel, Switzerland. This article is an open access article distributed under the terms and conditions of the Creative Commons Attribution (CC BY) license (https://creativecommons.org/licenses/by/4.0/).