Abstract
The objectives of this study were to assess the perception of a national certification programme for Good Agricultural Practices (GAP), specifically IPR (Integrated Plant Production). Another aim was to indicate the barriers of the implementation and the benefits of the practices within the IPR certification. The study was conducted using a survey questionnaire. The results were subjected to Exploratory Factor Analysis (EFA) and an analysis of the correlations between demographic characteristics and the perception of the certificate among IPR-certified farmers. Among the motivations for implementing the certificate and perceived benefits, respondents revealed specific values: a high level of social and environmental awareness and responsibility, a relatively high pursuit of material security, and a strong pro-market attitude. Of these factors, the responsibility and awareness factor best described the population, while the material security factor was less significant. The demographic characteristics in the researched population were found to be statistically insignificant for the perception of the programme and presented values. The second part of the study revealed a number of phenomena observed in the context of implementing the certificate, including positive environmental changes and those related to relations with market partners. One of the hidden factors behind these changes was the time factor. In this context, it was suggested that the longer validity of the certificate may increase interest in it. Recommendations were also formulated regarding addressing the values declared by respondents as being key in implementing IPR certification and minimising the gap in expectations regarding the price and the price obtained for certified products.
1. Introduction
Globally, there are several trends in agricultural policies, and although their founding principle remains the achievement of Sustainable Development Goals, they differ in the area of economic support. The dominant model in the USA, Australia, and New Zealand focusing on payments for land retirement from production, as land is perceived to attain a higher environmental value when taken out of farming and returned to its natural state. The next model focuses on granting funding to farmers to reduce their environmental impact while retaining intensive production systems. The last model, which is the most common in Europe, is based on providing payments to incentivise farmers to implement more environmentally friendly farming practices under the assumption that substantial environmental value is associated with existing farmland [1]. This approach forms the basis of the Common Agricultural Policy (CAP). The European CAP 2023–2027 proposes to measure the efficiency of instruments implemented for the achievement of the adopted goals based, amongst other things, on farming systems. Modern farming systems can generally be divided into the following types: conventional, conservation, integrated, organic, and precision. All the systems mentioned have a specific impact on the environmental, social, and economic spheres [2]. Since the development of the concept of integrated plant protection in the 20th century [3,4], it has been gradually expanded to include the integration of various agrotechnical practices related to the entire farming system, ultimately resulting in the emergence of the holistic concept of integrated production (IP), which is a more pro-environmental alternative to conventional agriculture [5]. Now, other systems that aim to have a positive impact on agrocenoses and their surroundings (conservation, organic, precision) are experiencing dynamic development and are perceived more favourably than the IP system.
The concept of IP has more than one definition at an international level. It can be understood as the activities related to the concept of Good Agricultural Practices (GAP) [6]. The FAO [7] defines GAP as a collection of principles to apply to on-farm production and post-production processes, resulting in safe and healthy food and non-food agriculture products, while taking into account economic, social, and environmental sustainability. IP is not synonymous with GAP, but is a part of it, related to primary production. IP is a more sustainable approach to the management of intensive production, using modern technologies and traditional practices. In Integrated Production—Principles and Technical Guidelines, the International Organisation for Biological Control (IOBC) [8], IP is defined as a farming system that produces high-quality food and other products by using natural resources and regulating mechanisms to replace polluting inputs and to secure sustainable farming. Emphasis is placed on a holistic systems approach involving the entire farm as the basic unit, the central role of agri-ecosystems, balanced nutrient cycles, and the welfare of all species in animal husbandry.
The preservation and improvement of soil fertility, of a diversified environment, and the observation of ethical and social criteria are essential components. Biological, technical, and chemical methods are balanced carefully, taking into account the protection of the environment, profitability, and social requirements. In turn, the European Initiative for Sustainable Development in Agriculture [9] presents Integrated Farming (IF) as a whole-farm approach, where the basic principle is the profitability of the farm whilst still taking care to reduce the negative effects of the farm on the environment and reinforce its positive impact in a way that goes beyond simple compliance with farming and environmental regulations. The basic principles of IF are presented in the “Integrated Farming Wheel” (Figure 1).
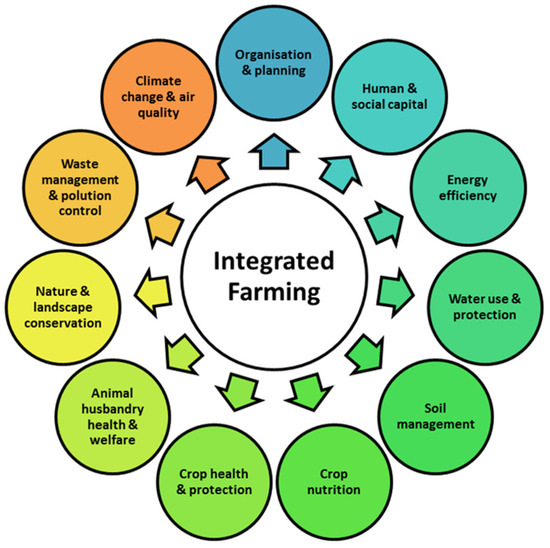
Figure 1.
Integrated Farming Wheel. Source: EISA, 2012 [9].
The principles of IF and IP are sometimes treated in the subject literature as very similar categories [10,11,12,13]. They are connected by a sustainable approach to agricultural production and cultivation, and the limitation or elimination of the negative external effects of farming through the application of knowledge-based technological and agronomical solutions. These are key principles from the point of view of the implementation of the Green Deal [14] strategy, and in particular the Farm to Fork and the biodiversity strategies [15]. IP is sometimes perceived as a more easily accessible alternative to organic farming. In European Commission documents, IP is considered to be a Good Agricultural Practices (GAP) programme. These documents mention three national public-sector programmes: Integrowana Produkcja Roślin (IPR, Poland), Haute Valeur Environnementale (HVE, France), and Sistema di Qualità Nazionale di Produzione Integrata per le Produzioni Agricole (SQNPI, Italy). In Europe, in addition to the public schemes in the aforementioned countries, private IP certification schemes play a significant role, above all the Leaf Marque from the UK, which is currently present in as many as 19 countries, where the largest number of certified areas of cultivated land are located in the UK, Spain, France, Egypt, and in Italy. In 2022, this certification scheme covered almost 311,000 ha, and in the UK, the certificate was awarded to 48% of all fruits and vegetables on the market [16]. Another example of a private certification scheme is the Sigill Kalitetsysstem AB used in Scandinavian countries, which refers not only to agricultural production, but also to breeding, working conditions, and the quality of final food products. The creators of the certification scheme for Scandinavian countries emphasise the need to adapt this solution to the climate, legislation, and geographic conditions in the Nordic region, which differ from the rest of Europe. In September 2023, around 4000 entities held a certificate in one of the different product areas (e.g., fruits and vegetables, cereals, lamb, etc.) or employment standards (https://www.sigill.se (accessed on 23 January 2024)). In addition to those mentioned above, there are several dozen other public and private IP certifications at the regional, national, and international level, applied to the chosen types of products, in general implemented on a more limited scale [6]. The certification formula and the scope of activities certified differs between the individual countries, meaning that there is also a difference in their environmental and socio-economic impact. In the case of public schemes designed to contribute to EU strategy and policy, certain common characteristics can be seen. The national public certifications IPR, HVE, and SQNPI contribute to a large extent to achieving the objectives of CAP 2023–2027, including fostering sustainable development and the efficient management of natural resources such as water, soil, and air; to halting and reversing biodiversity loss, enhancing ecosystem services; and to preserving habitats and landscapes.
They contribute to a moderate extent to achieving the objectives of climate change mitigation and adaptation, including by reducing greenhouse gas emissions and enhancing carbon sequestration, as well as promoting sustainable energy; to improving the response of EU agriculture to societal demands on food and health, including high-quality, safe and nutritious food produced in a sustainable way; to reducing food waste; to improving animal welfare and combating antimicrobial resistance.
In the context of the Farm to Fork strategy, the IPR, HVE, and SQNPI schemes contribute significantly to the circular bioeconomy; to the reduction in the overall use and risk of chemical and hazardous pesticides and the encouragement of alternatives (for example, integrated pest management and crop rotation); to the reduction in nutrient losses in the environment; to the reduction in the use of fertiliser.
According to analysis conducted by the European Commission, the IPR, HVE, and SQNPI schemes also contribute to a large extent to achieving the objectives of the biodiversity protection strategy [6,17]. None of the three public certification schemes refer to socio-economic issues.
An analysis of the level of certification uptake shows that HVE in France and SQNPI in Italy are gaining in popularity and that the number of certified farms is experiencing dynamic growth, while the number of IPR certificates issued in Poland is falling. In 2016, 503, 2271, and 4207 certificates were issued in France, Italy, and Poland, respectively. In 2022, there were already 29,898 certified farms in France, while in Poland there were only 2436. The most recently published data for Italy from 2020 show an increase in the figure to 17,169 [17].
The case of IPR is interesting due to the lack of growth in interest in the certification despite the promotion of the system by the Polish Ministry of Agriculture and Rural Development and a clear mechanism for obtaining the certificate, namely completion of training in IPR by the producer; carrying out production in accordance with the methodologies developed for the given plant species confirmed by the Chief Inspector for Plant and Seed Protection, compliance with hygiene and sanitary rules on the farm, documentation of all activities and treatments in the IPR Notebook, and undergoing obligatory inspection by authorised inspectors from certifying entities appointed by a public body (20% of farms are picked for a detailed inspection to check for residues of plant protection products and check levels of nitrates, nitrites, and heavy metals in crops carried out by accredited laboratories). The certificate attesting to compliance with IPR is issued for the “period necessary to sell the crop” (12 months). A producer of plants that has received a certificate attesting to IPR compliance is entitled to use the IPR logo (Figure 2) [18]. Producers wishing to continue to use the certificate go through the same procedure every year.

Figure 2.
Integrated Plant Production: Integrowana Produkcja Roślin (IPR) logo. Source: PIORiN, 2023 [18].
The niche status and lack of growth of interest in the IPR certificate were the motivations for this research, the purpose of which is to diagnose how the scheme is perceived and to determine the perceived benefits/lack of benefits resulting from IPR-certified activities. An understanding of motivations and observed impact of IPR practices may be important for the spread in popularity of this and other similar certification schemes, and over the longer term, for the achievement of the European Commission’s strategic goals.
2. Materials and Methods
The research was conducted in Poland in 2023. It was performed based on a survey questionnaire, and the surveyed population consisted of agricultural producers, whose production was certified under the public IPR programme in 2022. Purposive sampling was used, the criterion of which was the respondent’s IPR certification. The respondents that took part in the study were selected randomly from the certification body’s databases. The surveyed population was N = 2436 entities, the research sample was n = 332, and 314 survey questionnaires were correctly completed. The survey questionnaires were gathered from the Mazowieckie, Łódzkie, and Świętokrzyskie voivodeships, in which the highest percentage of farmers participate in the IPR certification scheme. The research sample was dominated by men and people with higher education, relatively young and middle-aged, and most were owners of small farms (see Table 1).

Table 1.
Demographic structure of survey sample.
The survey questionnaire consisted of 3 series of questions referred to as SET I (perception of the importance of IPR certification), SET II (perception of actual changes in environmental, social, and economic areas of the certified farm), and SET III (demographic variables characterising the surveyed population). Responses to questions in SET I were rated on a 10-point Likert scale, where 1 means “strongly disagree” and 10 means “strongly agree”. Responses to questions in SET II were rated on a 10-point Likert scale, where 1 means “much lower/worse/definitely not” and 10 “much higher/better/definitely yes”. The demographic structure and characteristics of the sample of producers surveyed are shown in Table 1.
The data obtained were analysed using the following methods:
1. Exploratory Factor Analysis (EFA), allowing for the main factors influencing the surveyed population to be diagnosed. The factors explaining the correlation patterns occurring within the sets of observed variables were identified in both SET I and SET II. Before commencing EFA, it was established that the distributions of survey results for SET I and SET II were acceptable and filtered. Outliers were removed and the data obtained were cleaned to ensure they were free of errors. The EFA procedure was carried out using polychoric correlations, Minimum Rank Factor Analysis (MRFA), parallel analysis, and oblique oblimin rotation. The JASP software program (0.17.1 version) was used to analyse the data [19]. Items with loadings of <0.40 or loadings in more than one factor were eliminated. A factor loading with a value higher than 0.40 was the acceptable range within which an item may belong to a factor [20]. The Kaiser–Meyer–Olkin test showed that the data prepared were adequate to conduct EFA [21].
2. The method of statistical analysis of the surveyed population, the aim of which was to determine differences in the perception of the importance of the certificate (SET I) in the context of the following demographic variables: gender, age, education, size of the farm, and disposable income. The following tests were executed to establish the hypothesised importance of demographic characteristics: the Shapiro–Wilk test, Spearman’s Rho correlation analysis, and the Mann–Whitney test. The level of significance was taken to be α = 0.05.
3. Results
The Exploratory Factor Analysis (EFA) revealed the presence of the three factors in both SET I and SET II of the research survey, which explained 59.99% and 61.70% of the total variance, respectively (Table 2).
Table 2.
Characteristics of factors obtained for separate parts of the survey questionnaire.
In SET I, the sum of squared loadings for two factors was greater than 1, and for the third it was close to 1; in SET II, the sum of squared loadings for all three factors was greater than 1, indicating that the participants in the survey were aware of the importance of IPR and had observed the impact of IPR practices on their farms. In EFA, the structure of the obtained factor loadings for individual variables provides information about how the individual observable variables are related to hidden factors. Factor loadings are numerical values that indicate how strongly each variable is related to a given factor. In SET I, the variables were grouped into three factors and their Cronbach’s alpha coefficients were relatively good and acceptable: factor RC11 (α = 0.62); factor RC22 (α = 0.73); factor RC3 (α = 0.63) [22,23]. Table 3 presents their structure.
Table 3.
The structure of the obtained factor loadings for individual variables (SET I).
The path diagram in Figure 3 presents, in schematic form, the coefficients observed in SET I between the responses given to the questions in that part of the questionnaire and groups them according to the hidden factors behind the responses.
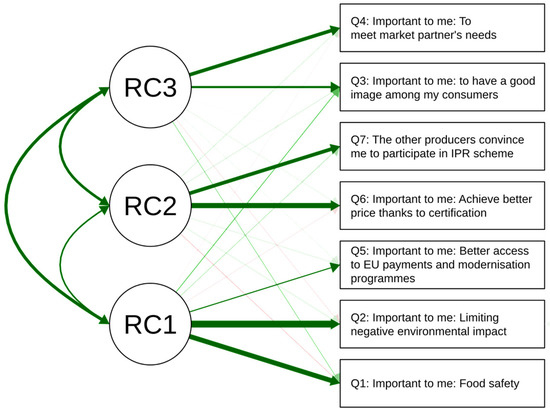
Figure 3.
Exploratory Factor Analysis (EFA) path diagram for questionnaire examining the importance of IPR certification (SET I). (abbreviations: RC—hidden factors influencing the surveyed population; Q 1–7—survey questions in SET I). The arrows in the diagram indicate the direction and strength of the impact of hidden factors on the responses given.
The hidden factors in SET I were characterised as follows:
Factor RC1 determined above all the perception of the safety of the food produced (Q2), to a slightly lesser degree the perception of the importance of environmental responsibility (Q1), and to a minor extent the perception of the importance of accessing EU and modernisation subsidies (Q5). It is possible to posit the hypothesis that the hidden factor that had an impact on those three issues was high environmental and institutional awareness and a feeling of responsibility. It was defined as the factor of social responsibility and awareness. The awareness and knowledge of producers together with the hierarchy of values, which constitute social responsibility, may have translated into the recognition of the significance of the phenomena mentioned above. Factor RC2 determined the perception of the importance of achieving a better price (Q6) and pressure from other producers holding IPR certificates (Q7). The hidden factor behind the issues above was hypothetically related to a feeling of social and material security and may have manifested itself as a fear of economic and social exclusion. It was defined as material security. Factor RC3 determined the perception of the weight assigned to the statement in Q3 about the importance of image in the eyes of consumers and in Q4 about the importance of meeting market partners’ needs. The hidden factor may have thus been concerned with both the needs of meeting the expectations of others and readiness in commercial and production terms to adapt to the changing expectations of the market. It seems that it was rather the second attitude that was the hypothetical hidden factor, which was defined as the pro-market attitude. The pro-market attitude (RC3) factor was quite strongly correlated with both the factor of social responsibility (RC1) and the factor of material security (RC3). There was also a correlation between RC1 and RC3, albeit a clearly weaker one. Those three values—social responsibility, pro-market attitude, and seeking to achieve material security—explained the behaviour of almost 60% of the surveyed population (cumulative variance of 0.599), with factor RC1 characterising 30% of the surveyed population (variance of 0.289), factor RC2 around 18% of the surveyed population, and factor RC3 around 13% of the surveyed population (cf. Table 2). In as much as 30% of cases in the surveyed population, the feeling of social responsibility may have been behind the decision to join the certification scheme, while for 18% it was the search for material security, and in 13% of cases it was a pro-market attitude.
The detailed distribution of responses to questions about the perception of certificates and the personal motivations of respondents determined by the factor of social responsibility and awareness are shown in Figure 4.
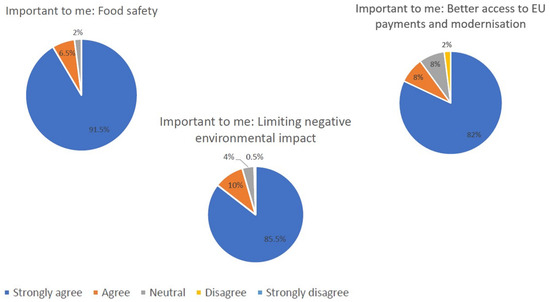
Figure 4.
Perception of the importance of the IPR certificate in the area of social responsibility and awareness.
For respondents, the impact of activities resulting from certification on the quality and safety of products and on limiting negative environmental effects was exceptionally important. Strengthening the farm’s potential through better access to EU payments was almost as important.
Users were much more divided on factor 2 for SET I related to the feeling of material security (Figure 5).
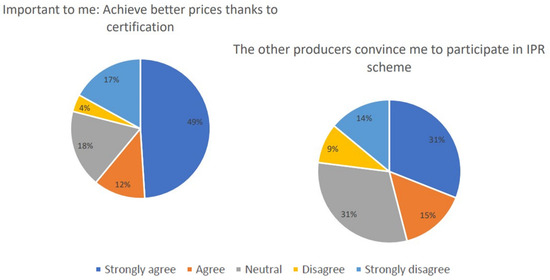
Figure 5.
Perception of the importance of the IPR certificate in the area of material security.
The possibility of achieving a better price was very important for only slightly less than half of the surveyed population, and important for 12% of the surveyed population. Nearly 40% of respondents did not see price as a significant motivating factor for the implementation of the IPR certificate, something that may be dictated by the fact that, in the case of IPR certification, the market has not reacted to the “price premium” for certified products, and producers are aware of this. IPR differs significantly in this respect from the organic certification programme, where the consumer is ready to pay more for a product with that certificate. In response to the question about encouragement from other producers, 47% felt support from other producers in participating in the IPR scheme. As many as 31% of respondents remained neutral on this issue, indicating a probable lack of contact between producers applying for the programme, resulting from poor dissemination. In this case, it is to be expected that, with better dissemination, this factor will become increasingly important.
In the area of the last factor, depending on the approach to the market, the distribution in the declarations of respondents is shown in Figure 6.
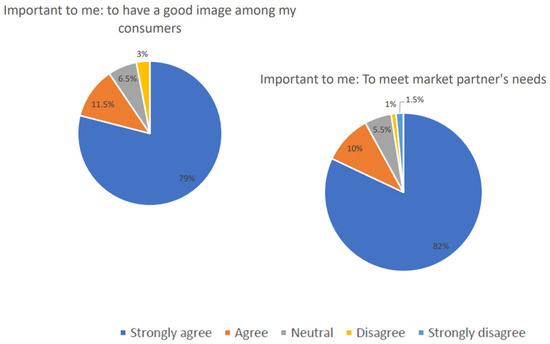
Figure 6.
Perception of the importance of the IPR certificate in the area of market approach.
Adaptation to the expectations of market entities and market partners was, alongside environmental issues, a key motivation for the implementation of IPR certification. For around 80% of respondents, meeting the expectations of both consumers and commercial partners was very important, and it was important for around 10% of the surveyed population. Only less than 10% of the surveyed group of producers considered these values not to be of importance.
The second part of the questionnaire (SET II) (Figure 7) concerned the perception by producers of actual changes in environmental, social, and economic areas of the certified farm. The Cronbach’s alpha coefficients for SET II were high: factor 1 α = 0.84; factor 2 α = 0.87; factor 3 α = 0.71. The structure of factors influencing the assessment of integrated plant production is presented in the Table 4.
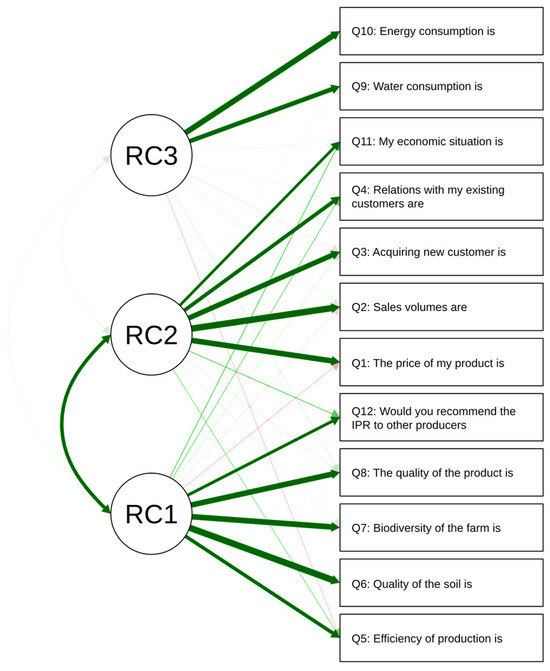
Figure 7.
Exploratory Factor Analysis (EFA) path diagram for questionnaire examining the importance of IPR certification (SET II). (abbreviations: RC—hidden factors influencing the surveyed population; Q 1–12—survey questions in SET II). The arrows in the diagram indicate the direction and strength of the impact of hidden factors on the responses given.
Table 4.
The structure of the obtained factor loadings for individual variables (SET II).
In the case of SET II, three main factors related to the variables were distinguished. Factor RC1 strongly determined the assessment of two phenomena related to transformations in the area of the environment, namely the assessment of the quality of soil (Q6) and biodiversity (Q7) and the assessment of the quality of the product itself (Q8). This hidden factor had a weaker impact on the assessment of the efficiency of crop production (Q5) and the tendency to recommend the certificate to others (Q12), but such a relationship also appeared in these cases. The identification of phenomena related to environmental and product quality was the factor of time, specifically the period of application of the IPR rules. Improvements in biodiversity and soil quality take time, as does achieving results in the area of the quality and efficiency of production. The short-term application of IPR practices certainly will not bring any immediate environmental effects. Factor RC2 was most strongly determined by the assessment of changes in sales volumes (Q2); slightly less, but still clearly by the assessment of product price achieved (Q1) and the acquisition of customers (Q3); and to a lesser extent by the relationship with existing customers (Q4) and the assessment of one’s own economic situation (Q11). All the distinguished variables were of a strictly economic nature and each of them may have been dependent on the quality of networks of relations between agribusiness stakeholders. That interpretation also seems to have been correct in the context of the correlation between factors RC1 and RC2, and thus with time and the stabilising network of business relations. This factor may also be referred to as the market and network of stakeholders. Factor RC3 was strongly determined by the assessment of the energy used for production (Q10) and of the water used (Q9). It is thus possible to posit the hypothesis that the hidden factor here was the type of crop production and/or the natural conditions of the place of production, which can thus be referred to in short as the factor of natural conditions. This factor was not significantly correlated with any other factor.
The selected factors explained the perceptions of over 60% of the surveyed population (cumulative variance of 0.617), with factor RC1 characterising over 26% of the surveyed population, factor RC2 over 25% of the surveyed populations, and factor RC3 nearly 10% of the surveyed population (cf. Table 2). The perception of observed changes examined in SET II was dependent above all on external phenomena and conditions, while in SET I it w determined by the respondents’ attitudes and values of certificate holders. As far as the data gathered in SET II are concerned, details of observations dependent on the time factor are presented in Figure 8.
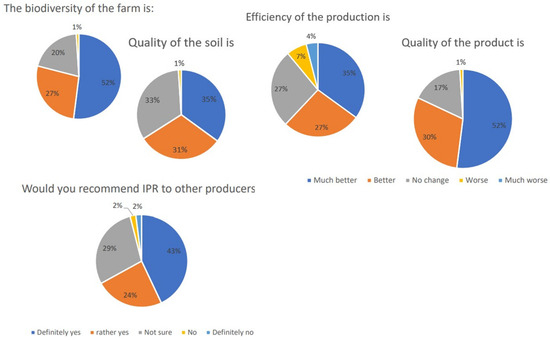
Figure 8.
Overview of observations concerning changes after introduction of IPR certification partially determined by the factor of time.
Holders of IPR certificates observed the most positive changes in the area of improvement in biodiversity, where a very significant or significant impact was observed by a total of 77% of users. Improvement in the quality of products, observed to be much better or better by 82% of respondents, was also very significant. In total, 66% of respondents observed a very significant or significant improvement in the quality of soil, while 62% observed a very significant or significant improvement in the efficiency of agricultural production. Moreover, 67% of IPR certificate holders would recommend it to others.
Respondents observed less changes in the area of phenomena determined by factor 2, in other words related to the market and stakeholder networks (Figure 9).
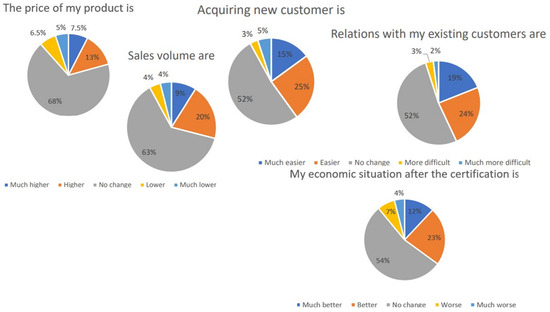
Figure 9.
Overview of observations concerning changes after introduction of IPR certification partially determined by the stakeholder network factor.
In the area of the market and stakeholder network factor, a significant majority of the population did not identify changes (more than 50% of the population in all cases), and if they were identified, then the impact of the factor was assessed to be more positive rather than negative. Noticeable positive changes were, however, observed more rarely than in the case of the previous group of variables. More frequently than in the case of phenomena of an environmental nature, respondents assessed the impact of the introduction of certification on their economic situation as low or very low.
The perception of changes in the area of phenomena determined by the factor of natural conditions is shown in Figure 10.
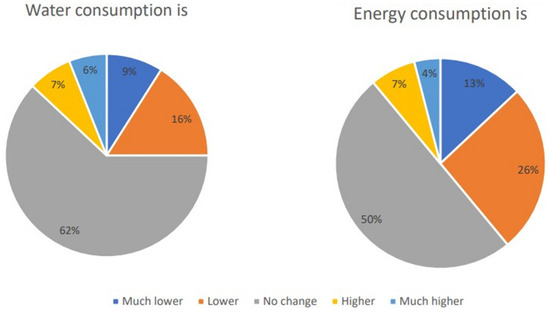
Figure 10.
Overview of observations concerning changes after introduction of IPR certification partially determined by the factor of natural conditions.
Like the market and stakeholder network factor, there was no change in the factor of natural conditions in the perception of producers, and the majority of IPR certificate holders did not notice any significant changes in the area of use of water, although one person in four noted a significant improvement or some improvement in this area. Nearly 40% of respondents, however, perceived farming in accordance with the principles of IPR as using less energy.
In summary, most IPR certificate holders noted positive changes in both the environment and product quality, and in the socio-economic sphere, where relations with other market entities and economic situation are concerned. IPR was assessed positively from the perspective of the improvement in efficiency—both in that of production, and in the level of consumption of resources, that is of water and energy.
The purpose of the next part of the research was to determine the correlation between demographic variables such as education, age, gender, disposable income, and the size of farm, and attitudes towards the certificate (SET I). An analysis of the distribution of quantitative variables was carried out based on basic descriptive statistics with the Shapiro–Wilk test examining the normality of the distribution. The results of the Shapiro–Wilk test proved to be statistically significant in the case of all the input variables, which means that their distributions deviated significantly from the normal distribution. The skewness of the distribution of most variables exceeded the absolute value of 1, which means that their distributions were asymmetric to a significant extent. Therefore, it was reasonable to conduct an analysis based on non-parametric tests. The results of the tests of the relationships between variables describing perception and demographic variables are presented in Table 5, Table 6 and Table 7.
Table 5.
Correlation between income, size of farm, and age of respondents and perception of the importance of the IPR certificate (SET I of questionnaire).
Table 6.
Correlation between gender of respondents and perception of the importance of the IPR certificate (SET I of questionnaire).
Table 7.
Correlation between the education of respondents and perception of the importance of the IPR certificate (SET I of questionnaire).
The analysis conducted did not show any statistically significant relationships between the average monthly disposable income per person in the household, the size of the farm, and the age of the producer and perception of the importance of holding an IPR certificate determined on the basis of variables, expressed as the following factors: social responsibility and awareness, material security, and pro-market attitude.
For the subsequent demographic characteristics of gender and education, a Mann–Whitney test was carried out, the results of which are shown in Table 6 and Table 7.
The analysis showed only one statistically significant difference between the compared groups in the area of the assessment of the statement “It is important to me that I can sell products with the IPR certification logo at a better price”. It turned out that women assessed the statement in question to be of significantly higher importance than men. The observed effect, however, proved to be weak (η2 < 0.06). No statistically significant differences were noted in the other cases.
In the area of education, the analysis showed only one statistically significant difference between the compared groups in the area of the assessment of the statement that “Other producers with whom I am in contact or who I collaborate with convince me to participate in the IPR scheme”. It turned out that respondents without higher education assessed the statement in question to be of higher importance than respondents with higher education, which may be indicative of the greater susceptibility of less educated people to be influenced by external factors. The observed effect, however, proved to be weak (η2 < 0.06). No statistically significant differences were noted in the other cases, meaning that level of education is not a differentiating factor when it comes to motivation to hold an IPR certificate.
4. Discussion
The purpose of this research was to diagnose the perception (1) of the importance of IPR certification and (2) of the observed impact of implemented practices on the environment and the social and economic spheres. The basic premise for conducting the research was a decrease in the number of IPR certificates issued among farm owners in Poland, where the analysed program has been operating since 2005. In contrast to other similar public programmes such as HVE in France and SQNPI in Italy, IPR is not gaining in popularity and the number of certificates issued remains low. The lack of wider participation of farmers in environmental programs is a common problem in the EU [24,25]. An analysis of the motivation of farmers in Poland to join this type of program showed that they join them based on economic interest and risk aversion, whereas environmental considerations were irrelevant [25]. However, this study proves a high level of socio-environmental awareness of certificate users, and this factor and indicates its importance in the context of remaining in the certification scheme. Social responsibility and awareness in the present case is the key factor indicated by respondents for participation in the IPR certification scheme. This factor described the behaviour of as much as 1/3rd of the surveyed population. In terms of specific responses, almost 100% of respondents indicated that the most important value is food safety, and for over 95%, it was reducing negative environmental impact. The next factors are embedded in the economic context. These are the material security of farmers and their pro-market attitudes, although these describe a smaller proportion of the population (18% and 13%, respectively). In the area of material security, over 60% of respondents indicated a higher price as an important factor for having IPR certification. A strong motivator for maintaining the certificate was meeting the expectations of customers and trading partners. In the context of individual questions, as many as 90% considered meeting the needs of consumers to be important and very important, and over 95% considered meeting the needs of trading partners to be important. The purpose of the next part of the research was to describe the relationship between the following characteristics of the population: education, age, gender, disposable income and size of the farm, and perception of the importance of IPR. One study was conducted on the significantly more widespread system of organic farming certification, where characteristics of producers such as education, age, and farm area are significant [26,27,28,29]. Higher education levels are consistently associated with increased participation in pro-environmental behaviours and environmental programs [30,31]. Similarly, the case of a higher level of income also favours participation in environmental certification schemes [31,32,33]. Surprisingly, within the IPR-certified population, statistical analyses showed that demographic characteristics are in fact of no significance to the perception of most aspects of IPR, attitudes, and the hierarchy of values of the respondents. Correlation appeared only in two cases: The female gender conditioned the declaration: “It is important to me that I can sell products with the IPR certification logo at a better price”. The correlation between the level of education and the statement “Other producers with whom I am in contact or who I collaborate with convince me to participate in the IPR scheme” also turned out to be statistically significant, and people with a lower level of education were more easily influenced by other producers than those with a higher level. Therefore, a greater external control of people with lower education can be seen. In summary, the perception of the importance of the IPR certificate among agricultural producers is positive. Certification enables the realisation of their personal values. They understand its impact on positive relations with the market and see the economic potential, although in this case it is not the most important reason for staying in the certification scheme.
SET II of the survey questionnaire concerned the perception of actual changes observed in the environmental and socio-economic spheres. Understanding the actual impact of certification can help identify barriers to IPR implementation. A positive finding worth emphasising is that the clear majority of respondents observed significant changes in the area of environmental quality, which means that IPR is making a real contribution to the implementation of the principles of sustainable development and achieving the goals of the Green Deal. Responses to questions about soil quality and biodiversity, as well as improvement in the quality of products and the efficiency of agricultural production, proved to be correlated in nearly 30% of the surveyed population. Positive changes in environmental and product quality do not occur immediately upon the implementation of sustainable agriculture practices. Martinez-Mena [34] precisely stated that the period of qualitative environmental changes following the implementation of sustainable practices in an almond orchard was 6 years. The context of time needed to achieve environmental effects also appears in studies of organic production. The long-term application of organic amendments significantly improved soil organic carbon, microbial biomass, and enzymatic activity, with notable improvements observed over periods ranging from 3 to 60 years [35,36,37]. Hence, the positive environmental and product quality phenomena reported by the respondents were defined as the time factor. The responses also turned out to be correlated in the area of a factor of quality of networks of relations between agribusiness stakeholders. Agri-environmental schemes are designed to encourage farmers to adopt environmentally friendly practices through financial incentives and other support mechanisms. In this study, only 20% of farmers noticed an increase in the prices of their products after the introduction of certification. Additionally, 11% of respondents noticed a decrease in prices. No significant impact on the economic situation of farmers was noted in the study of dairy farms in Bavaria [38]; however, other studies showed positive economic effects of certifications [39,40]. In the case of this study, respondents, more often than the impact on price, noticed an increase in sales (30%), the acquisition of new customers (40%), and the improvement of relations with trading partners (43%). These phenomena are associated with strengthening the economic position in the long term and in the opinion of respondents, being IPR-certified has a positive impact in terms of being embedded in market structures. At this point, it is also worth emphasising the improvement in relations with stakeholders noticed by farmers. The positive impact of participation in agri-environmental schemes on social capital was confirmed in the studies. Krom et al., Mills et al., Saxby et al. and Kufhus et al. [40,41,42,43] concluded that the participation in agri-environmental schemes enhanced social capital among farmers. This occurs through the development of bridging social ties, the extension of advisory networks, improvement in social activity and wellbeing, and the influence of local institutions and collective participation mechanisms. This study confirmed the positive impact of participation in a certification scheme on social capital. The last identified factor stands behind a correlation of water and energy consumption for production after the implementation of the certificate. The vast majority (62%) of respondents did not notice any changes in water consumption, but there was perceived to be a reduction in consumption by one in every four respondents. In the area of energy consumption, 50% of responses indicated there to be no clear changes, whereas 39% of respondents observed energy consumption to be lower. Energy and water consumption depends primarily on the type of production and natural conditions on the farm. Some studies have shown lower energy and water intensity in the context of sustainable agricultural production methods [44,45]. The generally positive impact on the consumption of resources may also be an argument for more intensive actions with the aim of increasing the uptake of IPR certification. In summary, the SET II study on perceived changes after the implementation of IPR certification confirmed the benefits of implementing agri-environmental programs in agriculture, both in the area of natural capital and social and economic capital. The perception of IPR certification by users in the context of its objectives is generally positive, as are the observed effects. However, there is a lack of sufficient motivation resulting from financial incentives. The values of the participants of the IPR certification scheme in the studied group do not prioritise financial issues, but from the perspective of striving to increase the popularity of IPR certification in the entire population of farmers, this issue requires support and may constitute a barrier to the dissemination of certification. Another barrier to the dissemination of certification is related to the period of validity of the certificate, which is only 1 year. Such a short period of validity of the certificate may limit the possibility of perceiving positive social, economic, and environmental effects, and does not encourage the extension of commitments, especially if changes in the area of obtained prices are imperceptible. Similar schemes in France and Italy involve granting certification for 3 and 5 years, respectively, and in both cases, there is a consistently increasing trend in HVE and SQNPI certifications [17]. Previous studies on the barriers to the implementation of agri-environmental schemes indicate that the factors inhibiting the dissemination of certificates include, among others, the transaction costs related to certification [39,46]. Also, the complexity of policy systems and the increase in bureaucratic oversight, including stringent inspections and controls, can be a source of scepticism among farmers and reduce the perceived legitimacy of agri-environmental policies [46,47]. The success of implementing a certification scheme therefore depends on many factors both on the side of farmers, for example, education, income, hierarchy of values, and behaviours, and on the side of the institutional environment, including the level of social capital, applicable policies, institutions in the agricultural environment, the level of bureaucracy, etc.
5. Conclusions
IPR, which is a GAP certification scheme that fits into CAP, is a niche certification, despite the fact that it has the status of a state certification and has recently been classified as an eco-scheme. The first objective of this study was to identify the perception of the certificate and the practices resulting from it. Certified farmers perceive them positively. This results from farmers’ beliefs in the area of environmental and social responsibility, openness to the needs of market partners, and expectations related to material security. Farmers’ motivations are therefore consistent with the values that guide IPR certification. However, in the context of the second research objective, i.e., identifying potential benefits and barriers to IPR implementation, on the side of the observed effects of implementing IPR certification, certain gaps are noticeable in the context of farmers’ expectations. This is primarily regarding the small impact of certification on product prices. Only every 5th farmer sees a positive impact of certification on the prices received. Every 10th farmer claims that their prices dropped after implementing certification. Recognising certification as one of the eco-schemes will be an important support for its dissemination. Meanwhile, the implementation of practices required in IPR certification brings noticeable, positive changes in the agricultural ecosystem and product quality; it contributes to better relations between farmers and their stakeholders; for a large percentage of farmers, it also involves water and energy savings. In this context, it is possible to formulate some recommendations aimed at popularising certification IPR.
Due to the fact that the respondents demonstrated a particularly high level of environmental and social awareness and responsibility, it is worth building communication promoting the certification of these values in order to reach agricultural producers that share these values. In a broader perspective, to support the uptake of IPR certification will be to promote knowledge of environmental threats and the importance of food safety. These are not actions that can be taken on a one-off basis but require the shaping of lasting attitudes from the start of the process of formal and informal education. In the context of the material security factor, which is important for about 1/5 of the population, and the unsatisfactory price rewards after the implementation of certification, it would be advisable to strengthen the awareness of certification among consumers, who could thus see its added value, which would translate into an increase in prices. Supporting activities for farmers choosing eco-schemes is equally important. The promotion of IPR certification and other agri-environmental certifications should be directed not only at farmers, but also at other stakeholders, such as consumers and food buyers and processors, so that the motivation of producers also results from the expectations of trading partners and customers, which in the context of the study is an important factor in remaining in the certification scheme. It is also important to promote the scheme among agricultural advisors, who have a strong influence on farmers’ decisions, particularly in financial, technological, and management practices [48,49,50]. It is also worth considering changing the approach to the certification validity period. Longer periods of certification validity result in stronger habits regarding the certificate requirements and production mechanisms, and also allow for observing the real change that certification brings.
There were certain limitations to the studies conducted as part of this research, the first of which was the regional scope limited to four voivodeships. This decision was made in order to make a targeted selection and conduct studies in these regions due to access to the surveyed population, a greater number of certified farmers, and readiness to participate in the survey. The second limitation was a tendency to create their own images on the part of respondents, especially in the area of SET II. The very positive perception of the effects of the implementation of certified activities in certain areas was sometimes surprising, for example with reference to the efficiency of production, which 62% of respondents assessed to be better, a finding which is contrary, for example, to empirical studies by Kılıç et al. [30], which found there to be a decrease in the efficiency of production after the implementation of GAP principles.
Author Contributions
Conceptualisation, M.P.; methodology, M.N.; software, M.N.; validation, A.G.; formal analysis, M.P.; investigation, K.G.; resources, K.G.; data curation, M.N.; writing—original draft preparation, M.P.; writing—review and editing, M.P.; visualisation, M.P. and A.G.; supervision, A.G.; project administration, M.P.; funding acquisition, M.P. All authors have read and agreed to the published version of the manuscript.
Funding
This research and publication were co-financed by NAWA (Narodowa Agencja Wymiany Akademickiej) Strategic Partnerships Project: BioMaster BPI/PST/2021/1/00012/U/00001 and by the grant of Polish Ministry of Science and Higher Education for the University of Agriculture in Krakow for 2024.
Institutional Review Board Statement
Not applicable.
Informed Consent Statement
Not applicable.
Data Availability Statement
Access to survey data on request: michal.niewiadomski@urk.edu.pl.
Conflicts of Interest
The authors declare no conflicts of interest.
References
- Santos, J.L.; Moreira, F.; Ribeiro, P.F.; Canadas, M.J.; Novais, A.; Lomba, A. A Farming Systems Approach to Linking Agricultural Policies with Biodiversity and Ecosystem Services. Front. Ecol. Environ. 2021, 19, 168–175. [Google Scholar] [CrossRef]
- Çakmakçı, R.; Salık, M.A.; Çakmakçı, S. Assessment and Principles of Environmentally Sustainable Food and Agriculture Systems. Agriculture 2023, 13, 1073. [Google Scholar] [CrossRef]
- Stern, V.M.; Smith, R.F.; Bosch, R.v.D.; Hagen, K.S. The Integrated Control Concept. Hilgardia 1959, 29, 81–101. [Google Scholar] [CrossRef]
- Kogan, M. Integrated Pest Management: Historical Perspectives and Contemporary Developments. Annu. Rev. Entomol. 1998, 43, 243–270. [Google Scholar] [CrossRef] [PubMed]
- Thompson, J.; Scoones, I. Addressing the Dynamics of Agri-Food Systems: An Emerging Agenda for Social Science Research. Environ. Sci. Policy 2009, 12, 386–397. [Google Scholar] [CrossRef]
- Chever, T.; Gonçalves, A.; Lepeule, C.; AND International. Research for AGRI Committee: Farm certification Schemes for Sustainable Agriculture, State of Play and Overview in the EU and in Key Global Producing Countries, Concepts and Methods; European Parliament, Policy Department for Structural and Cohesion Policies: Brussels, Belgium, 2022. [Google Scholar]
- A Scheme and Training Manual on Good Agriculture Practices (GAP) for Fruits and Vegetables; FAO: Bangkok, Thailand, 2016.
- Boller, E.F.; Avilla, J.; Joerg, E.; Malavolta, C.; Wijnands, S.G.; Esbjerg, P. Integrated Production: Principles and Technical Guidelines; IOBC/WPRS: Dijon, France, 2004. [Google Scholar]
- EISA (European Initiative for Sustainable Development in Agriculture). European Integrated Farming Framework. 2012. Available online: https://www.sustainable-agriculture.org/wp-content/uploads/2012/08/EISA_Framework_english_new_wheel_170212.pdf (accessed on 24 July 2024).
- Behera, U.K.; France, J. Chapter One—Farming Systems Research: Concepts, Design and Methodology. In Advances in Agronomy; Sparks, D.L., Ed.; Academic Press: Burlington, MA, USA, 2023; Volume 177, pp. 1–49. [Google Scholar]
- Reents, H.J.; Küstermann, B.; Kainz, M. Sustainable Land Use by Organic and Integrated Farming Systems. In Perspectives for Agroecosystem Management; Elsevier: Amsterdam, The Netherlands, 2008; pp. 17–39. ISBN 9780444519054. [Google Scholar]
- Szeląg-Sikora, A.; Cupiał, M.; Niemiec, M. Intensity and Labour Consumption of Integrated Production in Horticultural Farms. Agric. Agric. Sci. Procedia 2015, 7, 249–254. [Google Scholar] [CrossRef][Green Version]
- Perini, A.; Susi, A. Developing a Decision Support System for Integrated Production in Agriculture. Environ. Model. Softw. 2004, 19, 821–829. [Google Scholar] [CrossRef]
- European Commission, COM/2019/640 Final. Communication from the Commission to the European Parliament, the European Council, the Council, the European Economic and Social Committee and the Committee of the Regions, European Green Deal 2019. Available online: https://eur-lex.europa.eu/legal-content/EN/TXT/?uri=COM%3A2019%3A640%3AFIN (accessed on 17 September 2024).
- European Commission, COM/2020/381 Final. Communication from the Commission to the European Parliament, the Council, the European Economic and Social Committee and the Committee of the Regions. A Farm to Fork Strategy for a Fair, Healthy and Environmentally-Friendly Food System 2020. Available online: https://eur-lex.europa.eu/legal-content/EN/TXT/?uri=CELEX%3A52020DC0381 (accessed on 17 September 2024).
- LEAF Global Impacts Report 2022 by Linking-Environment-and-Farming-Issue. Available online: https://issuu.com/linking-environment-and-farming/docs/leaf_global_impacts_report_2022 (accessed on 24 July 2024).
- Pink, M.; Grochola, K.; Gorczyca, A. Public Good Agricultural Practices Certification Schemes in Chosen EU Countries. Eur. Countrys. 2023, 15, 525–541. [Google Scholar] [CrossRef]
- PIORiN. Integrowana Produkcja. Available online: https://piorin.gov.pl/integrowana-produkcja/ (accessed on 24 November 2023).
- JASP Version 0.17.1; [Computer Software]. 2023. Available online: https://jasp-stats.org/ (accessed on 14 January 2024).
- Stevens, J.P. Applied Multivariate Statistics for the Social Sciences; Routledge: New York, NY, USA, 2012; pp. 325–381. [Google Scholar]
- Yong, A.G.; Pearce, S. A Beginner’s Guide to Factor Analysis: Focusing on Exploratory Factor Analysis. Tutor. Quant. Methods Psychol. TQMP 2013, 9, 79–94. [Google Scholar] [CrossRef]
- Taber, K.S. The Use of Cronbach’s Alpha When Developing and Reporting Research Instruments in Science Education. Res. Sci. Educ. 2018, 48, 1273–1296. [Google Scholar] [CrossRef]
- Cortina, J.M. What Is Coefficient Alpha? An Examination of Theory and Applications. J. Appl. Psychol. 1993, 78, 98–104. [Google Scholar] [CrossRef]
- Hasler, B.; Termansen, M.; Nielsen, H.; Daugbjerg, C.; Wunder, S.; Latacz-Lohmann, U. European Agri-environmental Policy: Evolution, Effectiveness, and Chal-lenges. Rev. Environ. Econ. Policy 2022, 16, 105–125. [Google Scholar] [CrossRef]
- Wąs, A.; Malak-Rawlikowska, A.; Zavalloni, M.; Viaggi, D.; Kobus, P.; Sulewski, P. In search of factors determining the participation of farmers in agri-environmental schemes—Does only money matter in Poland? Land Use Policy 2021, 101, 105190. [Google Scholar] [CrossRef]
- Wheeler, S.A. What Influences Agricultural Professionals’ Views towards Organic Agriculture? Ecol. Econ. 2008, 65, 145–154. [Google Scholar] [CrossRef]
- Patidar, S.; Patidar, H. Farmers′ Perception on Transitioning to Organic Agriculture (OA) in Tsirang District, Bhutan. Res. J. Agric. For. Sci. 2020, 8, 40–48. [Google Scholar]
- Pinthukas, N. Farmers’ Perception and Adaptation in Organic Vegetable Production for Sustainable Livelihood in Chiang Mai Province. Agric. Agric. Sci. Procedia 2015, 5, 46–51. [Google Scholar] [CrossRef]
- Sapbamrer, R.; Thammachai, A. A Systematic Review of Factors Influencing Farmers’ Adoption of Organic Farming. Sustainability 2021, 13, 3842. [Google Scholar] [CrossRef]
- Gillham, P. Participation in the Environmental Movement. Int. Sociol. 2008, 23, 67–93. [Google Scholar] [CrossRef]
- Rajapaksa, D.; Islam, M.; Managi, S. Pro-Environmental Behavior: The Role of Public Perception in Infra-structure and the Social Factors for Sustainable Development. Sustainability 2018, 10, 937. [Google Scholar] [CrossRef]
- Clark, C.; Kotchen, M.; Moore, M. Internal and external influences on pro-environmental behavior: Participation in a green electricity program. J. Environ. Psychol. 2003, 23, 237–246. [Google Scholar] [CrossRef]
- Spínola, H. Environmental literacy in Madeira Island (Portugal): The influence of demographic variables. Int. Electron. J. Environ. Educ. 2016, 6, 92–107. [Google Scholar] [CrossRef]
- Martínez-Mena, M.; Pérez, M.; Almagro, M.; Garcia-Franco, N.; Díaz-Pereira, E. Long-term effects of sustainable management practices on soil properties and crop yields in rainfed Mediterranean almond agroecosystems. Eur. J. Agron. 2021, 123, 126207. [Google Scholar] [CrossRef]
- Diacono, M.; Montemurro, F. Long-term effects of organic amendments on soil fertility. A review. Agron. Sustain. Dev. 2010, 30, 401–422. [Google Scholar] [CrossRef]
- Bai, Z.; Caspari, T.; González, M.; Batjes, N.; Mäder, P.; Bünemann, E.; Goede, R.; Brussaard, L.; Xu, M.; Ferreira, C.; et al. Effects of agricultural management practices on soil quality: A review of long-term experiments for Europe and China. Agric. Ecosyst. Environ. 2018, 265, 1–7. [Google Scholar] [CrossRef]
- Panwar, A.; Ansari, M.; Ravisankar, N.; Babu, S.; Prusty, A.; Ghasal, P.; Choudhary, J.; Shamim, M.; Singh, R.; Raghavendra, K.; et al. Effect of organic farming on the restoration of soil quality, ecosystem services, and productivity in rice–wheat agro-ecosystems. Front. Environ. Sci. 2022, 10, 972394. [Google Scholar] [CrossRef]
- Sidhoum, A.; Mennig, P.; Sauer, J. Do agri-environment measures help im-prove environmental and economic efficiency? Evidence from Bavarian dairy farmers. Eur. Rev. Agric. Econ. 2023, 50, 918–953. [Google Scholar] [CrossRef]
- Falconer, K. Farm-level constraints on agri-environmental scheme participation: A transactional perspective. J. Rural. Stud. 2000, 16, 379–394. [Google Scholar] [CrossRef]
- Kuhfuss, L.; Préget, R.; Thoyer, S.; Hanley, N. Nudging farmers to enrol land into agri-environmental schemes: The role of a collective bonus. Eur. Rev. Agric. Econ. 2016, 43, 609–636. [Google Scholar] [CrossRef]
- Krom, M. Farmer participation in agri-environmental schemes: Regionalisation and the role of bridging social capital. Land Use Policy 2017, 60, 352–361. [Google Scholar] [CrossRef]
- Mills, J. Exploring the social benefits of agri-environment schemes in England. J. Rural. Stud. 2012, 28, 612–621. [Google Scholar] [CrossRef]
- Saxby, H.; Gkartzios, M.; Scott, K. ‘Farming on the Edge’: Wellbeing and Participation in Agri-Environmental Schemes. Soc. Rural. 2018, 58, 392–411. [Google Scholar] [CrossRef]
- Gathala, M.; Laing, A.; Tiwari, T.; Timsina, J.; Islam, S.; Bhattacharya, P.; Dhar, T.; Ghosh, A.; Sinha, A.; Chowdhury, A.; et al. Energy-efficient, sustainable crop production practices benefit smallholder farmers and the environment across three countries in the Eastern Gangetic Plains, South Asia. J. Clean. Prod. 2020, 246, 118982. [Google Scholar] [CrossRef]
- Raza, A.; Friedel, J.; Bodner, G. Improving Water Use Efficiency for Sustainable Agriculture. Agroecol. Strateg. Clim. Chang. 2012, 8, 167–211. [Google Scholar] [CrossRef]
- Weber, A. Implementing EU co-financed agri-environmental schemes: Effects on administrative transaction costs in a regional grassland extensification scheme. Land Use Policy 2015, 42, 183–193. [Google Scholar] [CrossRef]
- Zellei, A.; Gorton, M.; Lowe, P. Agri-environmental policy systems in transition and preparation for EU membership. Land Use Policy 2005, 22, 225–234. [Google Scholar] [CrossRef]
- Vesterager, J.; Lindegaard, K. The Role of Farm Advisors in Multifunctional Landscapes: A Comparative Study of Three Danish Areas, 1995 and 2008. Landsc. Res. 2012, 37, 673–702. [Google Scholar] [CrossRef]
- Cawley, A.; Heanue, K.; Hilliard, R.; O’Donoghue, C.; Sheehan, M. How Knowledge Transfer Impact Happens at the Farm Level: Insights from Advisers and Farmers in the Irish Agricultural Sector. Sustainability 2023. [CrossRef]
- Kuehne, G.; Llewellyn, R. The Wisdom of Farm Advisors: Knowing Who and Knowing Why. SRPN Farming Agric. 2017. [Google Scholar] [CrossRef]


Disclaimer/Publisher’s Note: The statements, opinions and data contained in all publications are solely those of the individual author(s) and contributor(s) and not of MDPI and/or the editor(s). MDPI and/or the editor(s) disclaim responsibility for any injury to people or property resulting from any ideas, methods, instructions or products referred to in the content. |
© 2024 by the authors. Licensee MDPI, Basel, Switzerland. This article is an open access article distributed under the terms and conditions of the Creative Commons Attribution (CC BY) license (https://creativecommons.org/licenses/by/4.0/).