Article

Anti-Erosion Effectiveness of Selected Crops in Sustainable Mountain Agriculture in a Warming Climate

Department of Agroecology and Crop Production, Faculty of Agriculture and Economics, University of Agriculture, Mickiewicz 21 Ave, 31-120 Krakow, Poland
*
Author to whom correspondence should be addressed.
Sustainability 2024, 16(18), 8212; https://doi.org/10.3390/su16188212
Submission received: 18 July 2024 / Revised: 17 September 2024 / Accepted: 19 September 2024 / Published: 21 September 2024

Abstract

:
Mountain ecosystems are among the most difficult areas for plant cultivation due to water erosion occurring on the slopes. Growing plants in these areas may lead to a weakening of ecosystem functions and in degradation of these areas and threatens sustainability. In this experiment, the anti-erosion effectiveness of maize, oat and spring vetch were assessed through the measuring of LAI and sheet wash from a slope where cultivation had occurred. Averaged values from the six years field experiment (2017–2022) reveal that maize achieved maximum soil protection between the 115th and 128th day of vegetation (14 days), when the LAI value equals to 3.8–4.0. The corresponding values for oats were 63–81 days of vegetation (19 days; LAI 2.4–2.7). The longest period of maximum soil protection was achieved from the cultivation of spring vetch compared to maize and oats (between the 49th and 82nd day of its vegetation, i.e., 34 days), when the LAI value was in the range of 2.2–3.0. Soil cover at their maximum development is conservative compared to mountain ecosystems, and in the case of the studied plants, the protection time varied. These relationships were quantified by simple regression equations. Additionally, taking into account the compiled climate data, the average air temperature in the years of research (2017–2022) was higher than the multi-year average (1961–2000) by 2.15 °C, which may confirm the fact that the climate is warming in the region of Southern Poland.

1. Introduction

In mountain ecosystems soil loss caused by water erosion is a serious problem. The basic means of production in agriculture is land which, when improperly used, like any other means of production, is subject to decapitalization resulting in a decline in fertility. Therefore, especially mountain land used for agriculture requires protection and treatment operation as an object of production [1]. Growing plants in these areas may lead to a weakening of ecosystem functions and degradation of these landscapes.
The concept of sustainable development refers to all areas of human activity related to the natural environment [2]. In particular it is related to agriculture, which depends on human decisions. It covers not only its production functions related to the production of food and raw materials, as well as non-agricultural functions, including social ones, implemented in rural areas, leading to the harmonization of production, economic, pro-environmental and social goals [3].
On the other hand, plant production is carried out on slopes in many places around the world, because it is a culturally valuable element of the mountain landscape, allowing the cultivation of traditions by the farming community in these areas [4,5,6] and ensures food security in many regions [7,8,9].
Currently, the effects of progressive climate warming are beginning to be felt in mountain agriculture, which causes, among other things, periodic rainfall deficits during crop vegetation [10,11], which affects the amount of biomass produced and thus the effectiveness of soil protection against surface erosion. Samborski and Ovcharuk (2020), examining meteorological conditions on the border of Poland and Ukraine in the 40-year period 1980–2019, report that the air temperature increased on average by 2.2 °C between the decades 1980–1989 and 2010–2019 [12]. Other authors of studies from the period 1961–2020 showed that since 2011, precipitation and thermal data obtained from stations located in the Beskid Sądecki Mountains were characterized by a continuous trend of high sums of effective temperatures (Growing Degree Days, GDD) during the growing seasons [11]. The authors also indicate that in the last studied decade (2011–2020), the growing season was warmer by about 1.5 °C than in the 1960s, while precipitation was characterized by the greatest variability and irregularity in the studied multi-year period in July-August. It is worth noting that the Polish Agroclimate Model prepared for the period 1971–1995 characterized the above-mentioned agricultural areas located in the mountainous conditions of Southern Poland according to the climatic water balance (KBW) as areas with a slight predominance of precipitation over evapotranspiration (+50 mm) [13,14].
On the one hand, the increase in atmospheric air temperature and rainfall deficits cause faster evapotranspiration, which results in the occurrence of arid and dry periods. This situation is intensified by the nature of the soil part of agroecosystems, i.e., the small thickness of the arable layer and the significant share of skeletal parts in the soil matrix [15]. This has an inverse proportional effect on the growth of biomass in these areas, which results in lower net primary production. This is indicated by the research of Al-Qubati et al. (2023) who indicated that net ecosystem productivity in the low-mountain region of central Germany has decreased by 18% in recent decades [16]. On the other hand, the record of lower rainfall in recent decades may suggest a smaller problem with surface erosion, but there is always the issue of sudden weather phenomena and short heavy rains, which cause the greatest loss of soil from the slope. One of the ways to counteract the effects of drought in agriculture is the appropriate selection of plants for cultivation and appropriate agrotechnics. These plants should have a low transpiration coefficient [17,18] and high anti-erosion properties. Effective counteracting of erosion by plants means that on cultivated slopes a significant part of the sum of atmospheric precipitation is used for the production of plant biomass and is not discharged unproductively into watercourses. The large surface of the above-ground parts of plants protects the soil against splashing, which initiates the erosion process [19]. The measure for assessing the anti-erosion properties of plants is the LAI index (Leaf Area Index, m2·m−2). It indicates that the larger the leaf area per unit of soil surface (larger LAI), the more often the falling drop is stopped and the kinetic energy contained in it is reduced. The drop of water arriving with the rain does not come into direct contact with the soil surface and does not cause splashing. However, in exchange for the lower initial kinetic energy of the drop given to the plant, the water clusters on its surface into larger drops and falls from the ends of the leaves, causing splashing [20]. The larger the plant leaf blades, the more intense this phenomenon is. Additionally, Fu et al. (2020), examining secondary raindrop splash, noticed that drops with a diameter of 3.64–3.74 mm had the most destructive effect on soil aggregates native to loess soils [21]. From the studies of Bollinne (1985) and Bui et al. (1992) as well as Foody (2002) show that the higher the LAI value, the smaller the splash [22,23,24]. However, the cited authors did not describe the relationship between LAI and erosion intensity in the form of a mathematical formula, e.g., a regression equation. Laflen (1998) pointed out this need [25].
Nowadays, sustainable development of bioeconomies occurs simultaneously on three spheres: economic, social and environmental [26]. Determining the soil-protective role of individual plant species remains one of the important determinants in maintaining the functions of mountain ecosystems and managing ecosystem services, while conducting plant production in these areas. The influence on the growth of the surface of above-ground parts of crop plants on the dynamics of reducing the intensity of water erosion has been the subject of many studies, including e.g.,: Klima and Wiśniowska-Kielian (2006) [27]. The authors examined this aspect in a multi-year field experiment in relation to fodder beets, spring triticale and field beans (2000–2003), and then in relation to potatoes, spring barley and green meadows (in 2005–2011) [28]. This issue was also addressed by Gao et al. (2020) for maize and soybean, but only in one growing season (May–September 2012) [29]. Hence, it is justified to expand research in this field, relating the increase in aboveground biomass in the context of limiting the phenomenon of surface erosion in plant cultivation in sloping areas.
The research results may be useful for guidelines on limiting water erosion and eutrophication of surface waters in mountain areas by determining the growth of the aboveground biomass of cultivated plants through LAI measurement and determining when the highest intensity of erosion phenomena occurs in a given crop.
The aim of the study was to determine the impact of the increase in the biomass of maize, oats and spring vetch, expressed by the LAI index, on reducing the intensity of soil surface runoff on the slope.

2. Materials and Methods

The subject of the research was a single-factor field experiment conducted in 2017–2022 on a slope with an inclination of 9% at the Mountain Experimental Station in Czyrna near Krynica (Southern Poland, N 49°25′; E 20°58′, at altitude 545 m a.s.l.) belonging to the University of Agriculture in Krakow. The mass of sheet washes removed from plots with fodder maize (Zea mays L.), hulled oats (Avena sativa L.) and spring vetch (Vicia sativa L.) with determined growth was compared. The factor causing water erosion was atmospheric precipitation. The plots were arranged on slope in a randomized block design. Each of the tested plants was grown in each year of the study in 4 repetitions, each plot measuring 22.13 × 1.82 m (ca. 40.00 m2). These plots are suitable for erosion studies according to the method of Wischmeier and Smith (1978) [30]. Sowing and cultivation was carried out transversely to the slope. Measurements of the runoff of the arable layer were performed using the direct method using Słupik catchers [31]. Such a catcher consists of a plastic bag mounted on a steel frame. A frame with an inlet width of 1.82 m was used. The frames were placed on the lower edge of each plot. The catchers were emptied after each rainfall or thaw period causing surface runoff. The volume of surface runoff was measured, and 1 L of suspension was randomly taken for detailed determinations. After filtering 1 L of surface runoff through a filter of medium hardness, the mass of surface runoff was determined. The sediment and the filter were dried at 105 °C, then cooled in a desiccator and weighed on an electronic analytical balance with an accuracy of 0.0001 g. Measurements of the area of the above-ground parts of the tested plants, expressed with the leaf index LAI (m2·m−2), were made using the SunScan Canopy Analysis System (Delta-T Devices, Ltd., Cambridge, UK) during the growing season after each rainfall causing surface runoff, once in each plot (n = 4). The mass of sheet washes covering two time periods: (a) plant vegetation periods (fodder maize, hulled oats and spring vetch) from sowing to harvest; (b) annual periods, i.e., from 1 January to 31 December, including snowmelt washes, during the growing season and outside the growing season (Table 1).
In the each year of the experiment, crops were grown in crop rotation in the following order: (1) fodder maize; (2) hulled oats; (3) spring vetch (Supplementary Material, Figure S1). Spring oats and vetch were sown in the first or second decade of April, and fodder maize in the third decade of April. Average 6-year plant density before harvest for fodder maize was 9.3 plants·m−2; oats: 413.9 panicles·m−2; spring vetch 74.8 plants·m−2. The plants were grown in accordance with the principles of proper agrotechnics. Cultivation procedures were as follows: shallow tillage after harvesting oats and spring vetch, three weeks later performed cultivator + harrow, and then before pre-winter ploughing mineral fertilization was applied. In the spring there was a following sequence of agrotechnical treatments was performed: harrow, sowing nitrogen fertilizers, cultivator + harrow aggregate. After sowing the plants, post-sowing harrowing, and herbicide application was implemented in the field.
Spring oats and vetch were usually harvested in mid-August, and fodder maize was harvested in the second decade of October (Table 2). The measurement results from the research years 2017–2022 are presented on the axis of one growing season.
The grain-size composition of mineral particles in the soil was as follows: 28% of sand, 29% of silt, and 43% of clay particles; therefore, this type of soil was classified according to WRB as a Endoeutric Stagnosol (Siltic, Endoskeletic) [33,34]. The experimental soil belonged to cambisoils formed from weathered flysch rocks with texture of medium, shale clay. The index of soil susceptibility to washing, i.e., the ratio of dust fraction to colloidal clay, was 1.81.
The average monthly air temperatures in the years 2017–2022 and the average for the multi-annual period 1961–2000 are presented in Table S1. On an annual basis, the average air temperature in the years of the study was higher than the multi-annual average by 2.15 °C, which confirms the fact that the climate in the region of Southern Poland is warming [11,12]. Only in April 2022 was the average temperature lower than the multi-year average, in the remaining months of plant vegetation the temperatures were higher. Based on the calculation of the average in the years 2017–2022, the warmest month turned out to be August, where the difference in relation to the long-term average (1961–2000) was 4.9 °C.
The meteorological data were presented in the forms of Gaussen-Walter climatograms with co-efficient α (1 °C = 2 mm) taken from Gaussen [35] (Figure 1 and Figure 2). The climatogram shows the the persistent excess of precipitation over temperature (the corrected precipitation bar exceeds the corrected temperature line). This means that erosion processes forming on the slope may occur in the studied area. From the raw data used in Table S2 it shows that the most favorable conditions for the growth and development of cultivated plants occurred in 2021, as indicated by the highest total rainfall during the growing season (567.9 mm). In the remaining years of the study, there were periodic rainfall deficits during the growing seasons, especially in April 2018 and 2020 and in June and July 2019.
Despite the fact that the precipitation distribution was different for the study period and in the multi-year period (Figure 1 and Figure 2), the lowered temperature curve for all months was below the precipitation column. This means an excess of precipitation over evapotranspiration in the study region and the possibility of surface soil erosion.
The study area is located within a moderately warm zone, where the average annual temperature is characterized in the literature as ranging between 6 and 8 °C [36]. The type of weather conditions in winter did not cause intense erosion of the grooves, because the snow melted during solar thaw. However, an increase in the intensity of water erosion usually occurred in spring, mainly during rainfall exceeding 20 mm. Precipitation below 20 mm rarely caused erosion, because almost all of the water supplied by the rainfall soaked deep into the soil profile.
Vaezi et al. (2017) reported that on surfaces without vegetation cover and on slopes with a slope of 10%, surface runoff was generated to 68% by splash caused by falling raindrops [37]. During the study period, runoff occurred in 3 snowmelt periods and after 48 rainfall events (Table 1).
Based on the data in Table 1 above, during the study period (2017–2022), there were 8 low-intensity rainfall events, 31 short-term rainfall events, and 9 short-term downpours.

3. Statistical Analyses

The ANOVA analyses (along with their assumptions) were performed to indicate the significant differences of the mass of sheet wash (kg·ha−1) recorded within the objects (plants) for two studied periods: (1) from sowing to harvest and (2) annual periods, i.e., from 1 January to 31 December (LSD post hoc test, α = 0.05). The presented simple regression equations for tested plants (i.e., influence of LAI on the mass of sheet wash) were significant below the probability level α = 0.01.
The raw meteorological data (Tables S1 and S2) were presented using climatograms with co-efficient α (1 °C = 2 mm) taken from Gaussen [35].
Statistical analyses and graphical presentation of data were performed using MS Excel 2019 v. 1808 (Figure 1 and Figure 2), and STATISTICA v. 13.3 (Figure 3, Figure 4 and Figure 5).

4. Results

The graphs show the actual (not averaged) results during the growing season of the tested plants, presenting them as overlapping years. Analysing the research results, it can be concluded that the beginning of the soil-protective effectiveness of fodder maize began on average with an LAI value of 0.7 (Figure 3). This value can be considered as the beginning of the soil-protective effectiveness of fodder maize expressed in soil losses (point 1, Figure 3), which amounted to an average of 225 kg·ha−1 (Figure 3). Fodder maize showed maximum soil-protective effectiveness at LAI in the range of 3.8 to 4.0 (point 2, Figure 3). This, in turn, corresponded to the smallest soil losses from the field, which amounted to an average of 99.25 kg·ha−1, which occurred within 14 days and on average it was the 115–128th day of maize vegetation.
The beginning of the soil-protective effectiveness of hulled oats began with an average LAI value of 0.8 (Figure 4). From this LAI value, a significant reduction in the mass of surface waste was noticed (point 1, Figure 4). At this point, the mass of surface waste reached an average value of 170 kg·ha−1. Hulled oats showed maximum soil-protective effectiveness at LAI in the range of 2.4 to 2.7 (point 2, Figure 4). This, in turn, corresponded to the smallest soil losses from the field, which amounted to an average of 31.88 kg·ha−1, which occurred within 19 days and on average it was 63–81 days of oat vegetation.
The beginning of the soil-protective effectiveness of spring vetch began with an average LAI value of 0.95 (point 1, Figure 5). From the LAI value of 0.95, there was a significant reduction in the mass of sheet washes, with the average value in this period amounting to 140 kg·ha−1 (Figure 5). Spring vetch showed maximum soil-protective effectiveness at LAI in the range of 2.2 to 3.0 (point 2, Figure 5). This, in turn, corresponded to the smallest soil losses from the field, which amounted to an average of 28.98 kg·ha−1, which occurred within 34 days and on average it was 49–82 days of spring vetch vegetation.
The influence of the increase in the surface area of the above-ground parts (LAI) of the tested plants on limiting the intensity of surface runoff expressed as the mass of sheet wash is determined by the following simple regression equations:
for maize y = −44.67x + 273.74 (R2 = 0.944, n = 172),
for oats y = −90.20x + 260.61 (R2 = 0.823, n = 144),
for spring vetch y = −88.73x + 253.54 (R2 = 0.864, n = 144)
The regression was significant below the probability level α = 0.01.

5. Discussion

Soil-protective effectiveness of plants is important in mountain sustainable agriculture. The problem of the impact of the increase in the area of cultivated plants on their soil-protective effectiveness has been discussed very rarely in previous scientific publications. Rejman (1990) [38] and Rejman and Brodowski (1999) [39], as well as Rejman et al. (2001) formulated the view that the soil protection of plants, in a dynamic approach, begins with 20–30% soil surface coverage [40]. Other authors have proven that under simulated rainfall, the soil protection effectiveness of fodder beet begins with 60% soil coverage, field beans with 30% and winter triticale with 16% [27]. Other studies by Klima et al. (2016) proved that the soil protection effectiveness of potatoes begins with 80% soil coverage, spring barley with 60%, and meadows with 10% [28]. During the period of intensive vegetative development, there comes a moment when the mass of surface waste is visibly reduced. During this time, LAI usually reaches values less than 1.0. LAI values are commonly used in studies on the soil protection of plants [29,41]. This parameter, combined with the values of the mass of surface wash, can be used to determine the initial and maximum soil protection of plants in landscaped areas. On the other hand, the indicators of sustainable agroecosystem management are needed [42], therefore in this study the three new indicators are proposed. The point of initial soil protection of plants (SPE-1) can be considered the LAI values that correspond to the greatest decrease in the value of soil surface wash in the initial phase of plant development (Figure 3, Figure 4 and Figure 5, point 1). However, the maximum soil resistance of plants (SPE-max) can be determined in the period of the lowest surface wash values, when the plant produced the maximum aboveground biomass, i.e., the highest LAI values (point 2, Figure 3, Figure 4 and Figure 5). The third indicator (SPE-days) is the number of days during vegetation season when the plant provides maximum soil protection for the cultivated field.
This study showed that the initial soil protection of fodder maize was 0.70 LAI, oats 0.80 LAI, and spring vetch 0.95 LAI. Taking into account the maximum soil resistance of the tested plants, the LAI value for maize was in the range of 3.8–4.0, for oats 2.4–2.7, and for vetches 2.2–3.0. This means that in order to achieve maximum soil protection, maize had to produce much more above-ground biomass and it achieved this only on the 115–128th day of vegetation, which indicates that maize is least useful in sloping agriculture due to shortest protection time and the highest sheet washes. The soil anti-erosion ability of plants increases with their development phase (peak of vegetative development). For oats, these values were recorded on days 63–81, and for vetches on days 49–82 of vegetation. Based on these data, it can be seen that the period of maximum soil protection of plants in the case of maize is 14 days, in the case of oats 19 days, and in the case of vetch 34 days, which leads to the conclusion that spring vetch is the plant that most effectively protects the soil against surface erosion on the slope. In maize cultivation, the highest values of the mass of sheet wash were recorded and they were 2.21 times higher than in the case of oats and 2.41 times higher than in the case of spring vetch (Table 3). Taking into account the annual periods in which the mass of sheet wash occurring both in the period from sowing to harvest and beyond this period was taken into account, it can be concluded that maize cultivation also showed the lowest soil protection, i.e., compared to oats (by 30.0%) and spring vetch (by 33.4%), (Table 3). Among these three tested plants, spring vetch is the most suited in studied conditions.
The low soil-protecting capacity of maize was due to, among others, from the fact that the seeds of this plant were sown in accordance with the principles of proper agrotechnics in wide inter-rows (60 cm), and the seeds of oats and spring vetch in narrow inter-rows (11 cm). Similar results in soil loss amounts in cereal crop (ca. 1180 kg·ha−1) was achieved by Gil et al. (2021) in the same region (Western Carpathians) [43]. The effect of using different widths of inter-rows was that the inter-rows were covered by growing plants at different times. Covering the inter-rows with plants significantly reduces the splash phenomenon that initiates the erosion process. Splash most often occurs as a result of the direct impact of raindrops on soil not covered with vegetation. The intensity of this unfavorable phenomenon is limited by vegetation cover, measured by LAI. Maize cultivation does not guarantee the lowest levels of sheet wash (Figure 3, Figure 4 and Figure 5) despite the highest LAI values of this plant, as they remain on average above 100 kg of soil·ha−1 (point 3, Figure 3). In turn, oats and vetch after compacting the rows, as plants grown in narrow rows, on average did not cause surface wash above 100 kg·ha−1 during the assumed research period (point 3, Figure 2 and Figure 3).
Zhang et al. (2011) examined surface washes on a slope of 9% in a canopy of grasses (Vetiveria zizanioiaes and Paspalum wettsteinii) and correlated them with LAI values for two types of simulated rainfall intensity (40 and 54 mm·h−1). In both cases, the correlation was negative and statistically significant (lower LAI values corresponded to higher surface wash values). However, these studies were one-year long [41]. There are no long-term studies showing the correlation of LAI and surface runoff levels in real conditions of crops grown on a slope. A one-year study under real slope rainfall conditions was undertaken by Gao et al. (2020) [29]. The authors proved that in maize cultivation on a 8% slope much smaller amounts of sheet wash were obtained (in total 16.53 kg), despite the occurrence of two heavy rains (up to 80 mm·h−1). However, maize was grown across the slope in 20 m × 5 m plots and the recorded LAI values from July to September remained constant at around 3.5. The increase in plant biomass is an important factor in determining the value of the C index (type of plant cover). This indicator appears in the universal parametric soil loss equation USLE [30] and in numerous modifications of this equation [44,45,46,47]. On the other hand, the parameterization of erosion losses on the slope is directly proportional to the dynamics of the LAI value increase and can be expressed through a simple mathematical correlation obtained over time (Equations (1)–(3)).
Many regenerative practices currently being tested around the world have their source in indigenous knowledge, e.g., contour buffer strips composed of grass species in Vietnam [48]. The key factors here are the plants. The plant cultivation aim to shade the soil as quickly as possible (inter-row spacing) and regenerative practices tend to abandon plowing in sloping farmlands. In the tillage systems, the problem of soil displacement downslope can be partially weakened by the direction of plowing, i.e., upslope depositing soil delays down movement of the soil by 7 cm in comparison to downslope plough operating [49]. Additionally, the splash erosion accelerates the negative effect of aboveground erosion processes occurring on the slope, which was studied by Kijowska-Strugała and Kiszka (2018) [50]. The authors claimed that the average downslope splash erosion was 75% higher than the upslope splash erosion in the 11° slope.
On the other hand, the rules for selecting plants in sloping areas where erosion occurs (in Poland, this land is the Carpathian Mountains), are described in European and national documents, e.g., in the agri-environmental program called Soil and Water Protection [51]. From 2023, the National Strategic Plan has been in force in Poland, containing the rules for granting subsidies to farmers. According to the principle of conditionality adopted in the European Union, it is assumed that a farmer applying for financial support will meet the standards regarding maintaining land in good agricultural and conservation condition (GAEC). The problem of soil erosion occurring on slopes is included in GAEC 5, but for land located on slopes with a slope of ≥14% [52]. Due to the preservation of the ecosystem functions of mountain agroecosystems, there is a need to also study those lands with a slope of less than 14%.

6. Conclusions

Sustainable practices are very important for agriculture, especially in mountain areas. In these areas, surface erosion and increased surface runoff occur, which degrades the soil part of ecosystems and disturbs the ecological balance of the surrounding foothills. The sowing and cultivation of perennial or leguminous plant species are good agricultural practices as well as the cultivation plants in narrow rows and early sowing leading to weakening erosion processes and maintaining existing vegetation in these areas. Agriculture in this region of the Carpathians is focused on dairy cattle breeding, for which maize silage, oat and spring vetch straw are one of the main components of bulk feed. One example of sustainable management in agriculture is the closed circulation of production means. In the experimental area, obtaining plant biomass for ruminants and applying the resulting manure back to the fields is an example of sustainable practices promoting a closed cycle in the economy, i.e., the circular economy of the mountain region. The mutual network of stakeholders in this area, which is extremely important in maintaining an appropriate level of economic profitability of agricultural production in these areas.
On the other hand, pro-ecological aspects are an integral part of sustainable practices in agriculture. The research results may be useful for reducing water erosion and eutrophication of surface waters by determining the increase in biomass expressed by LAI and comparing it with the values of surface washes formed on the slope. Further research in this field could concern determining specific development stages of plants cultivated in mountain conditions and combining them with the degree of anti-erosion of the studied plant species. The obtained research results could be useful in planning sowing dates in this area. Usually, there are intensive spring rainfalls there, which would allow for reducing the intensity of the surface erosion phenomenon. Therefore, the research results indicate the need for early spring sowing. In addition, it should be pointed out that vetch cultivation contributes to other processes beneficial to the environment, such as: intensification of microbiological life in the soil, formation of water-resistant soil aggregates, increase in fertility and nitrogen content of the topsoil. It is therefore justified to cultivate legumes on mountain, skeletal soils, in order to indirectly influence the increase in fertility of these soils. The measurement of the sustainability of plant production can be expressed in the LAI index, because it was documented in these studies that the higher its value, the lower the runoff occurred. The innovative element of the work is the determination of the LAI value from which the soil-protective function of maize, oats and spring vetch begins. Also, the three new ecological indicators (SPE-1, SPE-max, SPE-days) could help in the future in guiding local soil conservation efforts and compare soil erosion processess along different crops as well as soil and climate codnitions. Research in this field is conducted by few research centers in the world. Although, incorporation of a control plot (without vegetation) can help to highlight the effect of each crop in weakening erosion processes occuring on the slope, as well as locating a similar experiment in other climatic and soil conditions.
Currently, global warming contributes to the occurrence of unfavorable weather phenomena in agriculture. Further observations of climate changes occurring in mountain areas are needed. The anti-erosion role of plants is very important in sustainable agriculture and was quantified in this research as a simple regression equation from six years of research. Detailed research results are presented below for a slope of 9%:
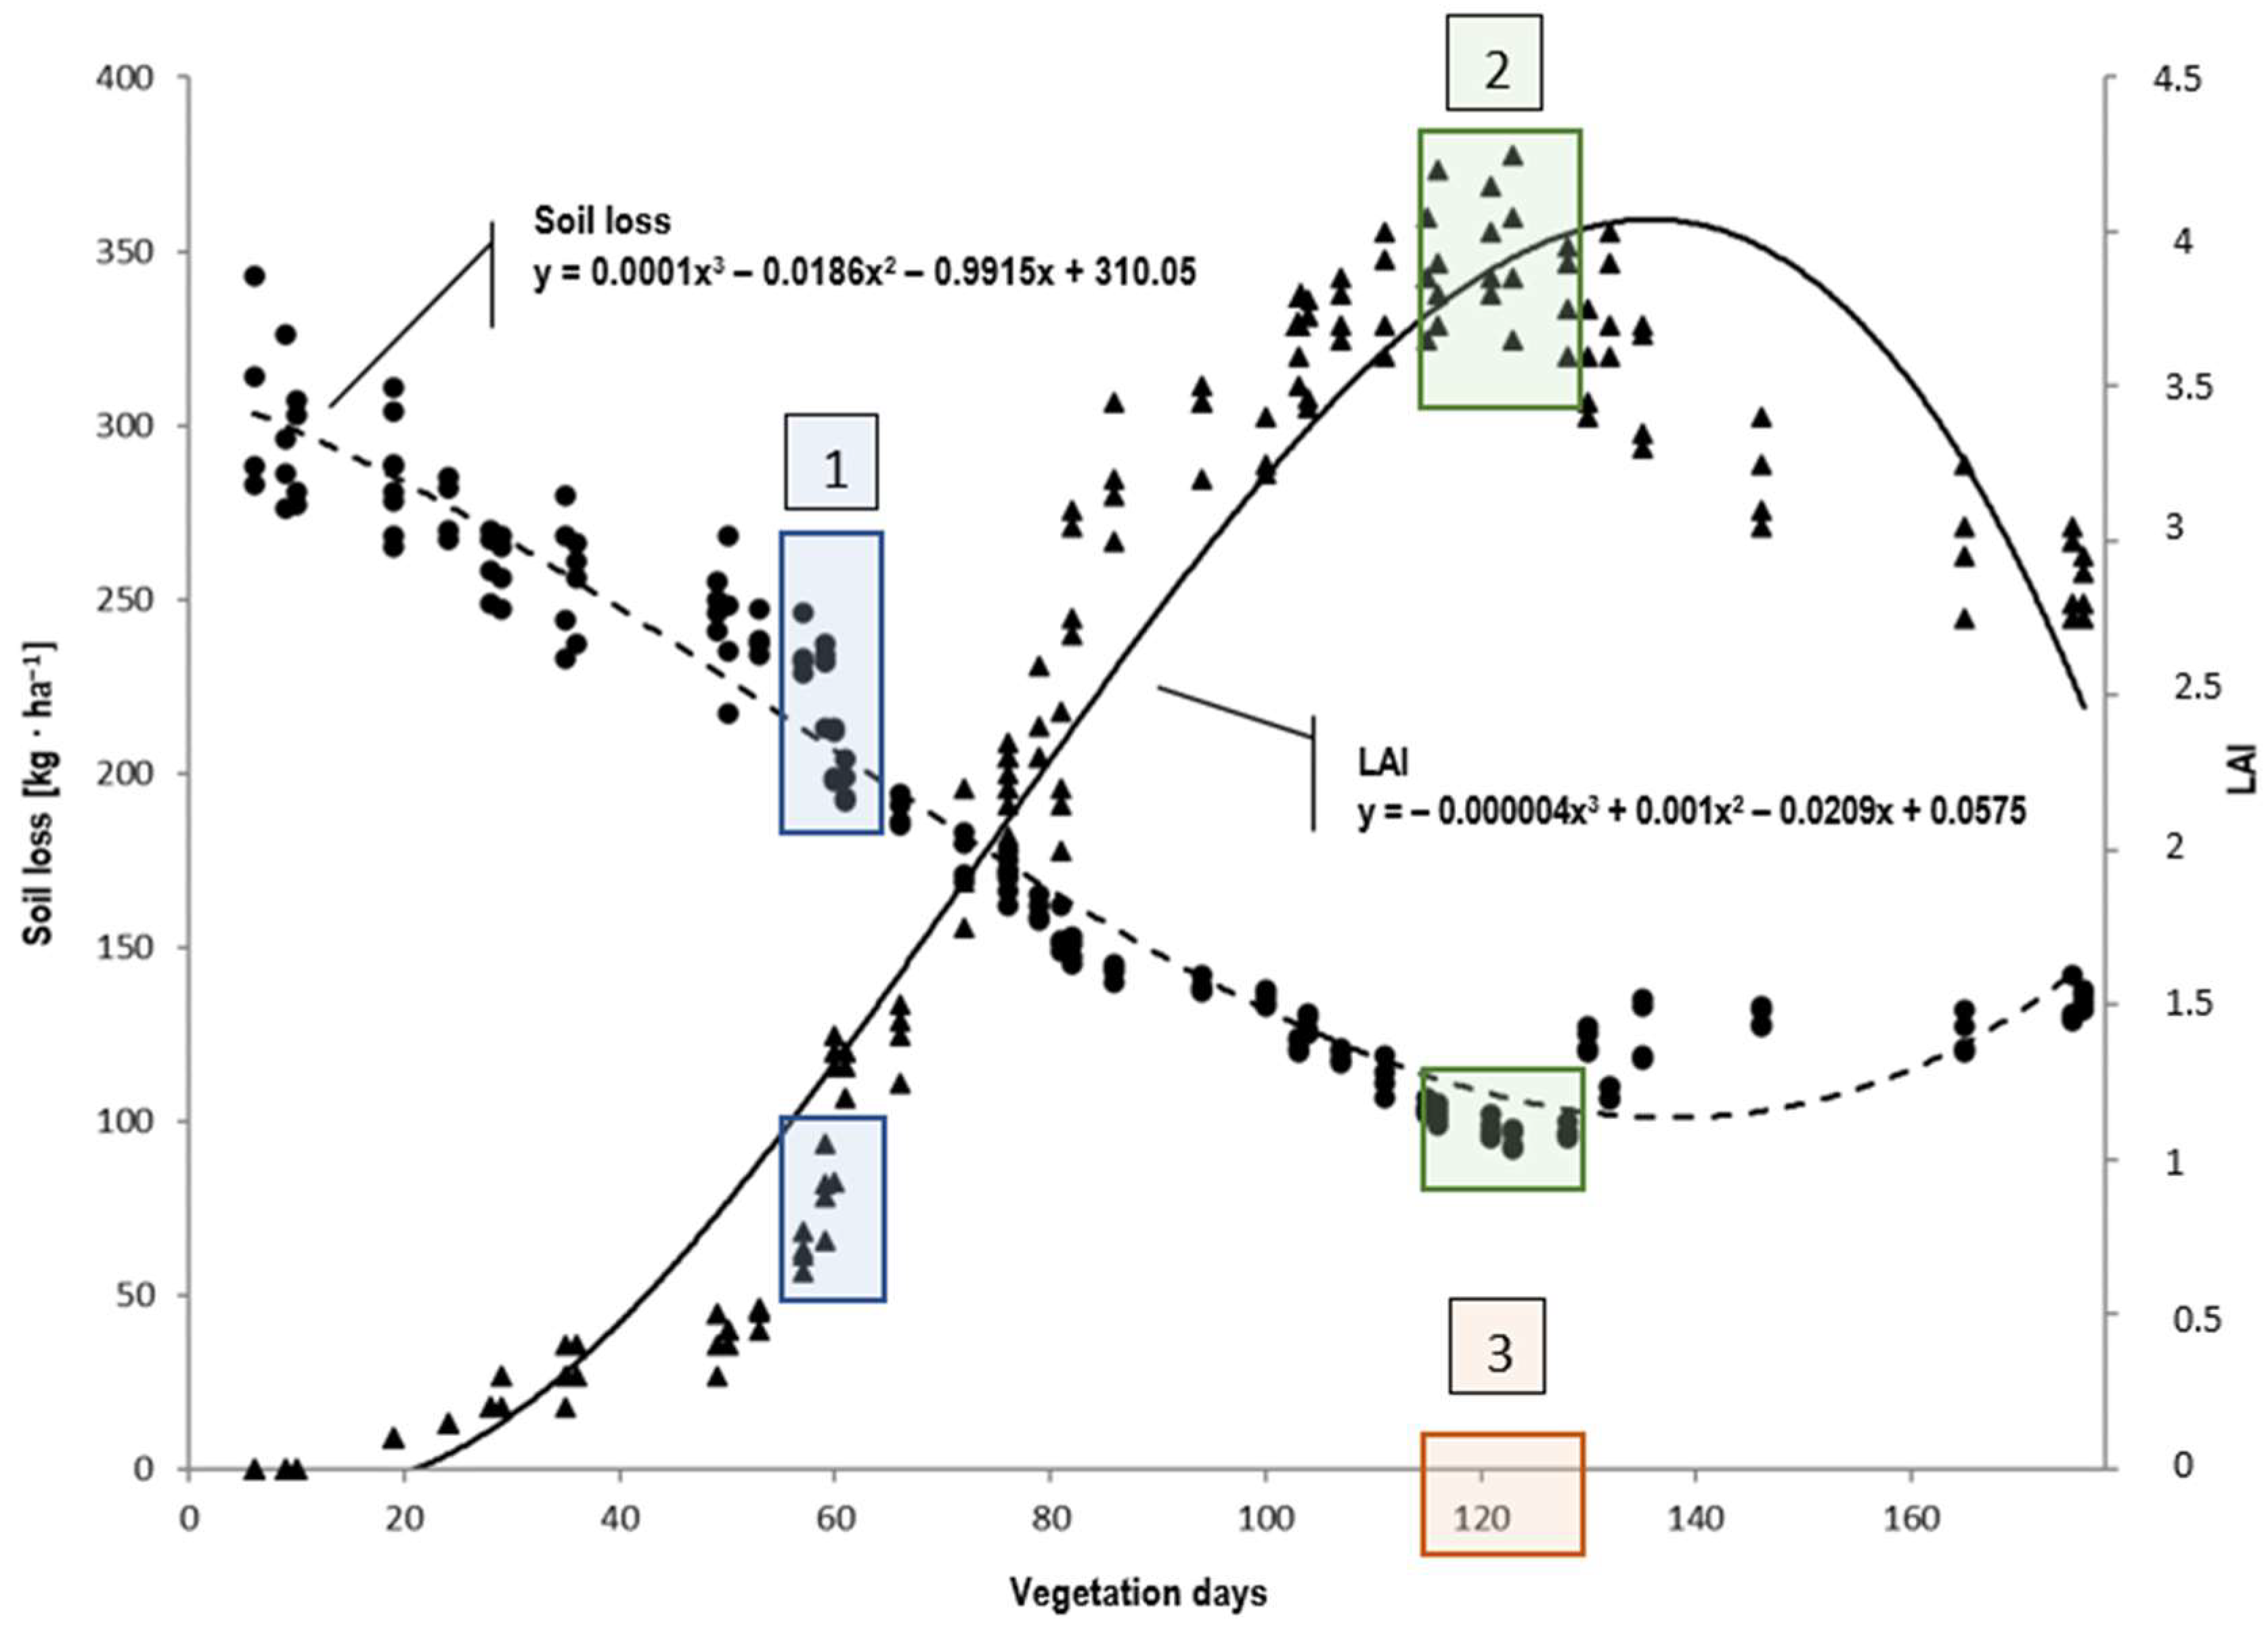
  • The initial soil protection of fodder maize starts from LAI 0.70. Maize achieved maximum soil protection between the 115th and 128th day of vegetation, when the LAI value was in the range of 3.8–4.0.
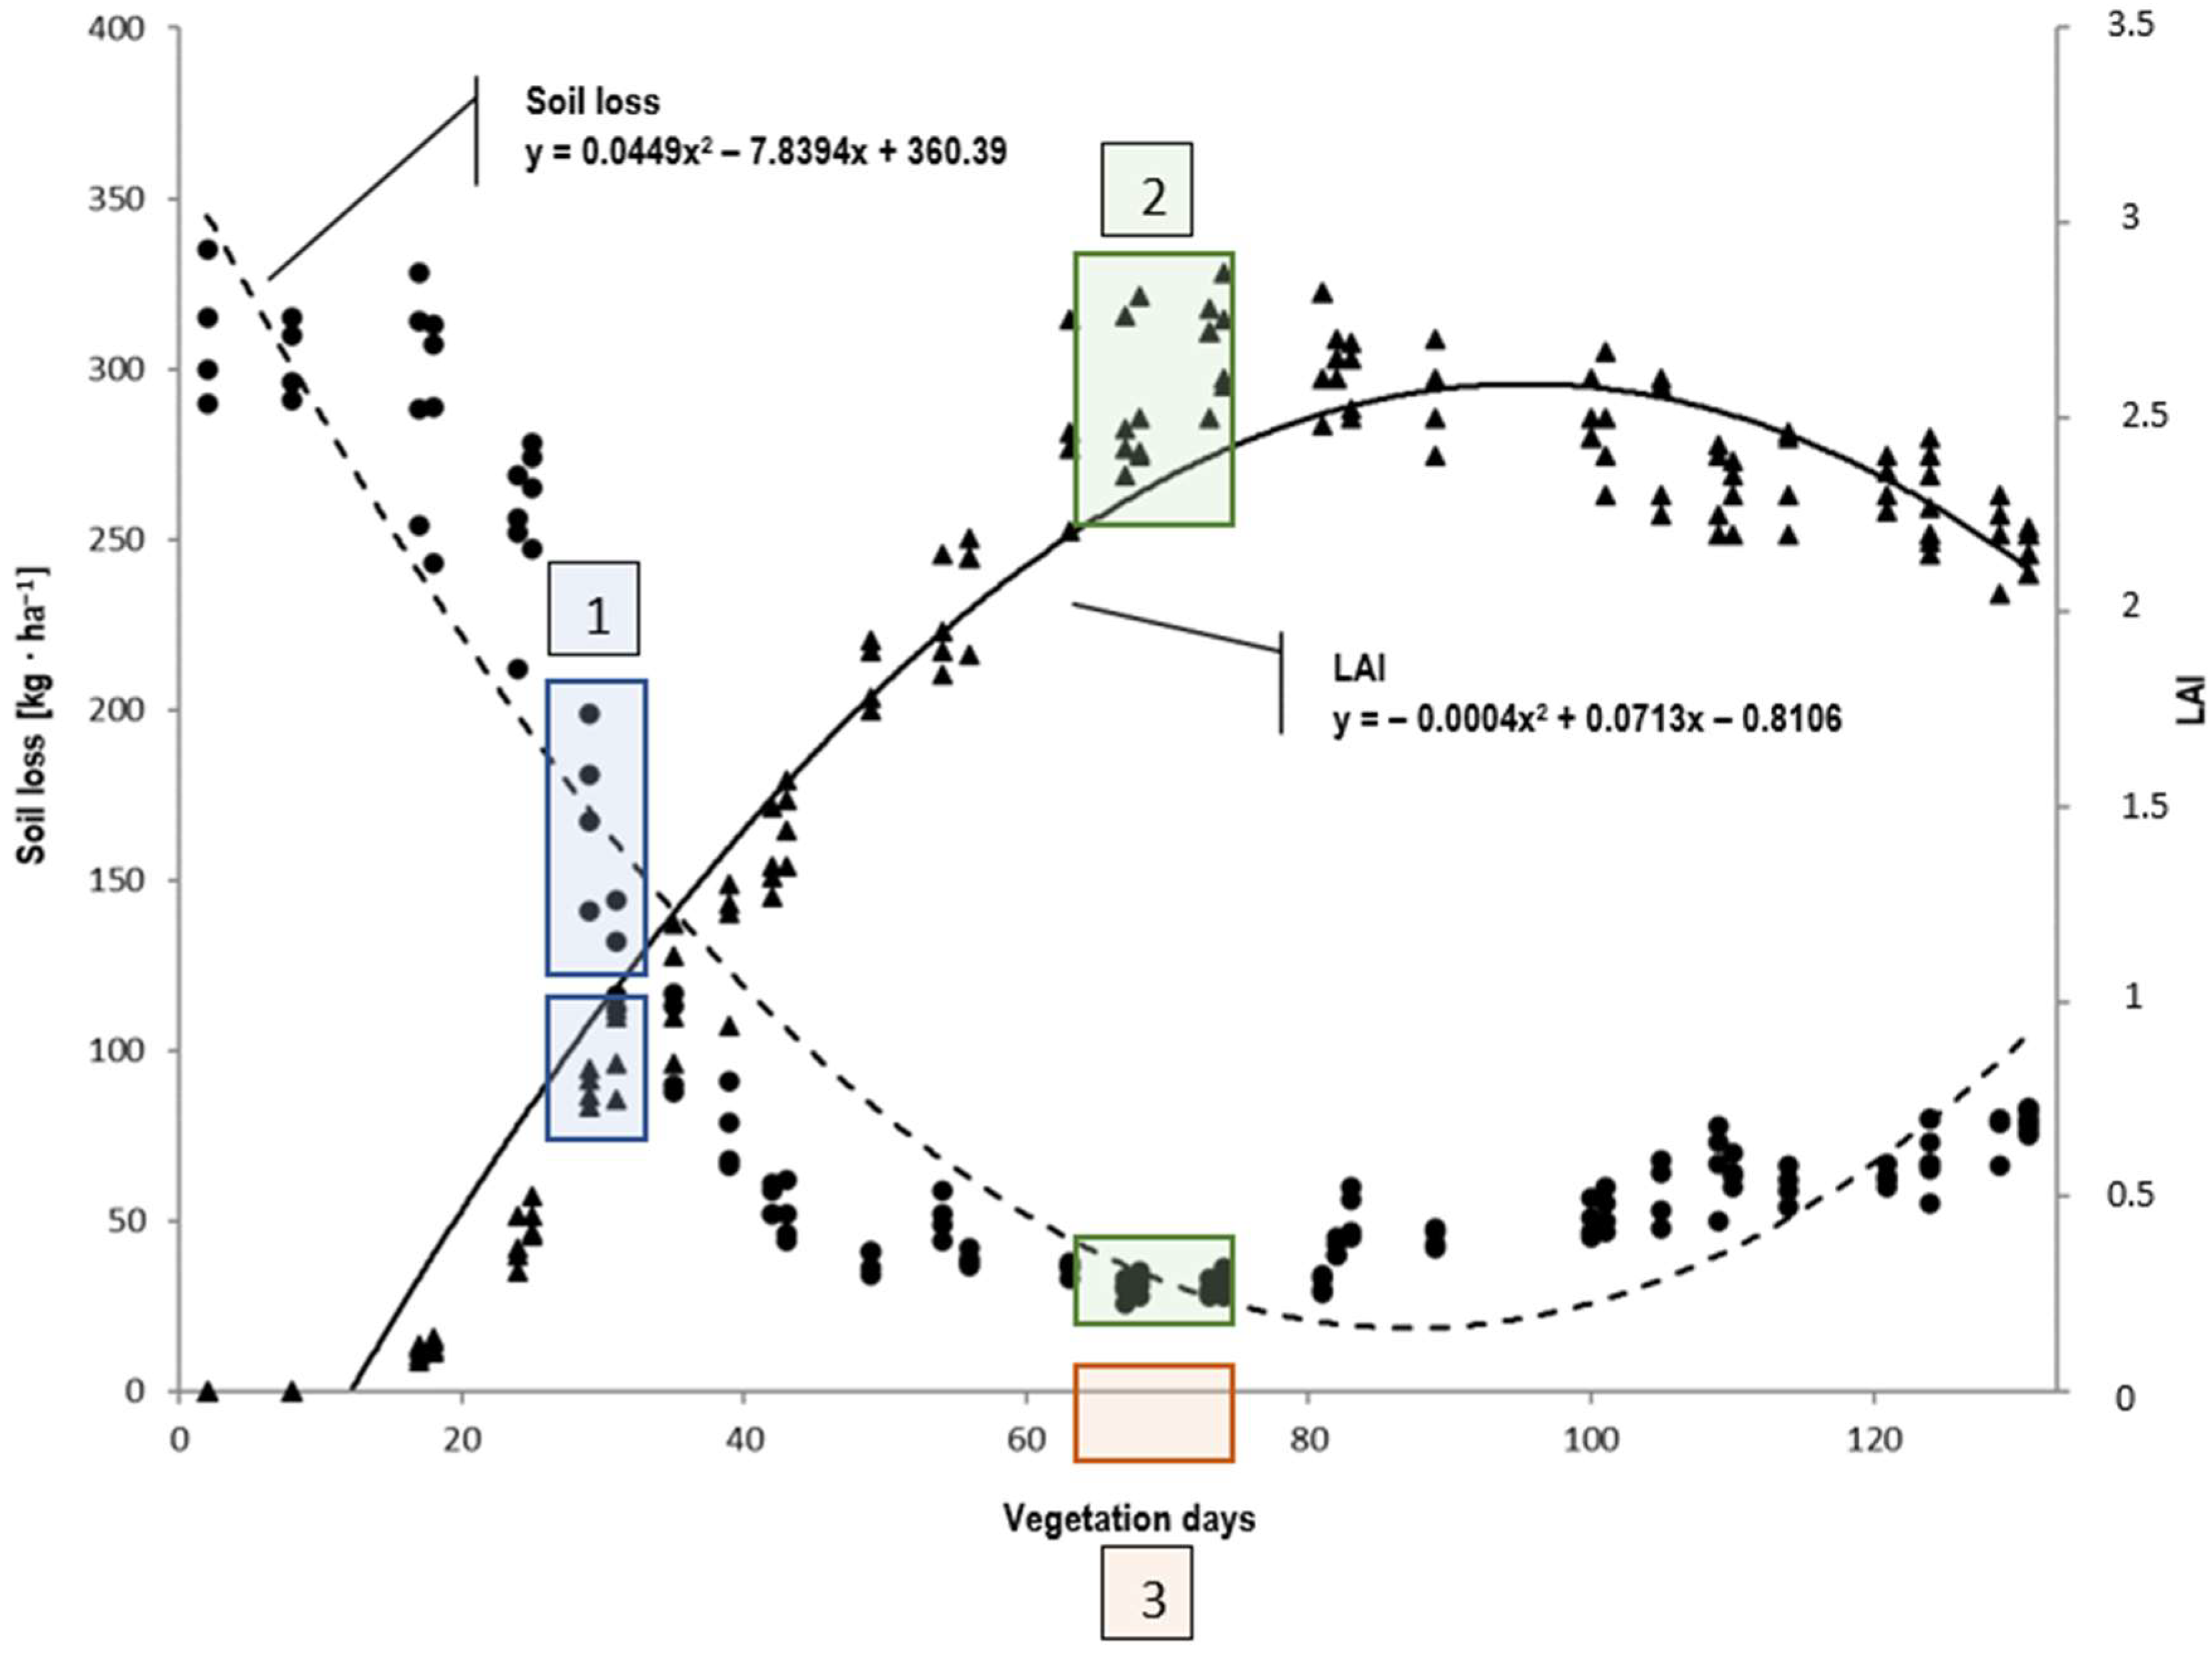
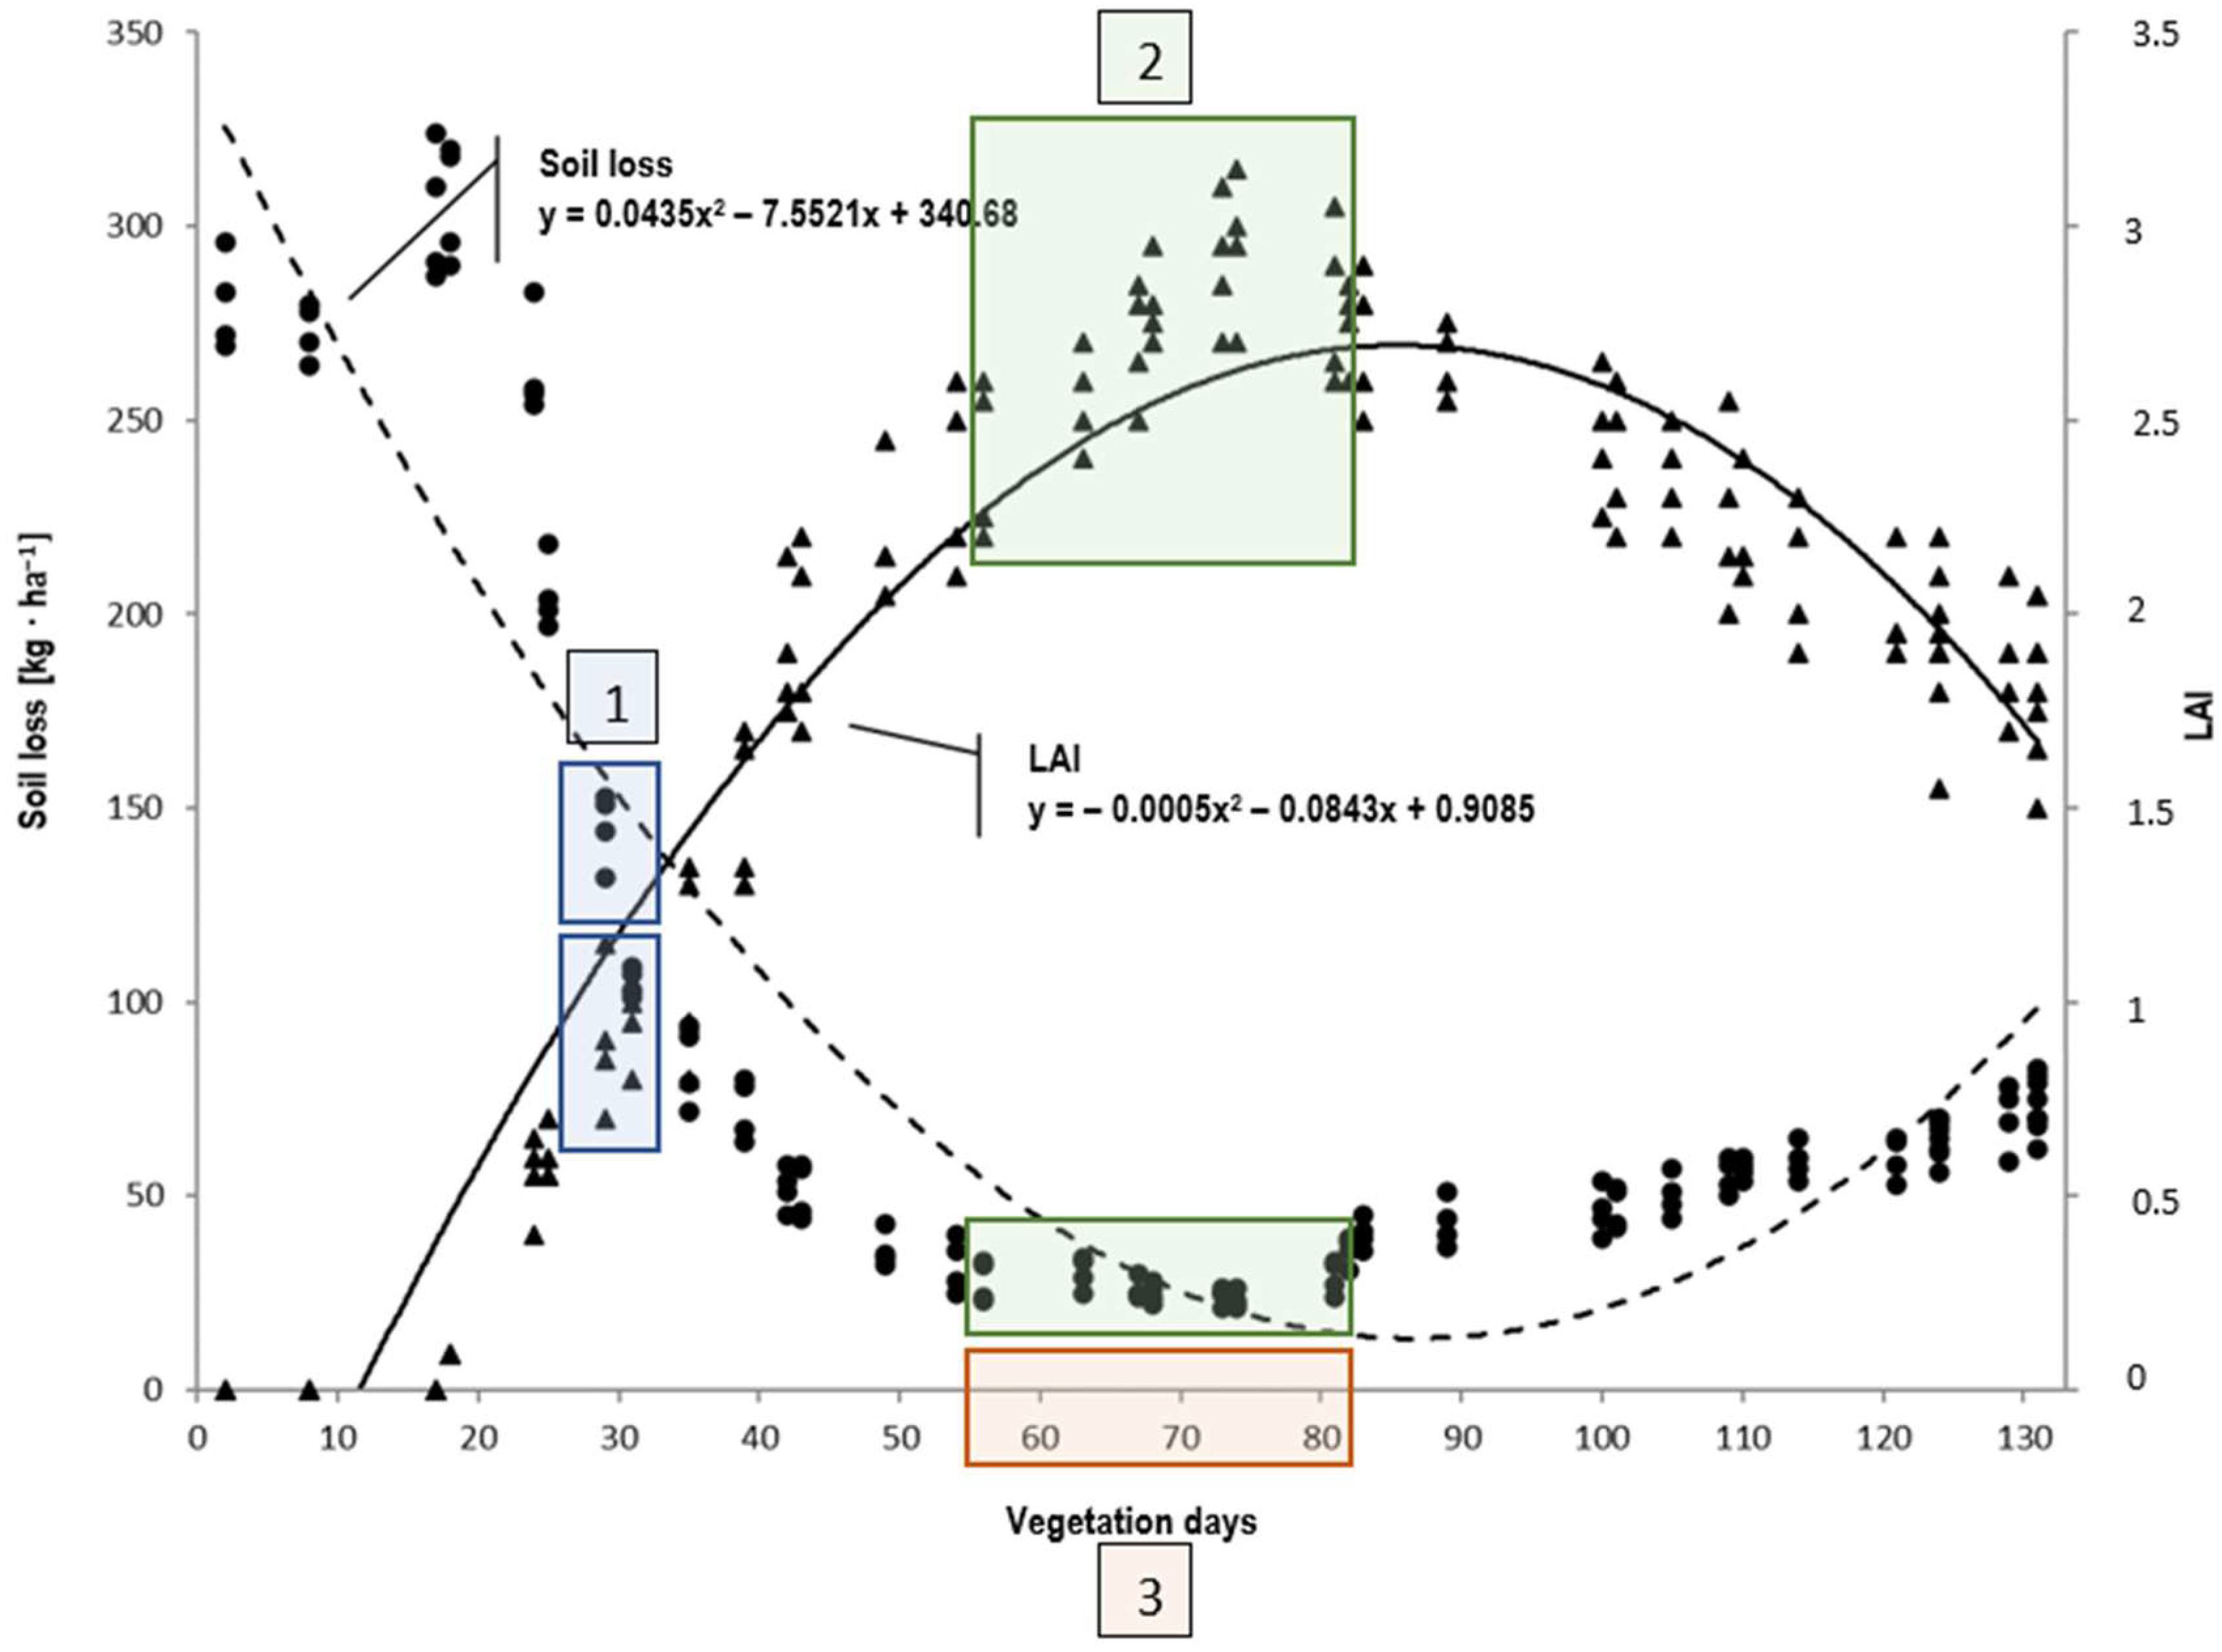
  • The initial soil protection of hulled oats starts from LAI 0.80. The maximum soil protection of oats was achieved between 63–81 days of vegetation, when the LAI value was in the range of 2.4–2.7.
  • The initial soil protection of spring vetch begins with LAI 0.95. The maximum soil protection of vetch was achieved between the 49th and 82nd day of vegetation, when the LAI value was in the range of 2.2–3.0. In order to obtain the greatest possible protective effect, it is worth paying special attention to the time in the plantation protection plan immediately preceding the period of the greatest soil protection for these plant species, so that the biomass can reach the highest possible values and thus effectively protect the slope against water erosion.
  • Based on measurements of the amount of surface washing, maize vegetation influenced the lowest soil protection of the studied agroecosystem. Compared to oats, these values were 2.21 times lower, while in the case of spring vetch they were 2.41 times lower in the period from sowing to harvest.
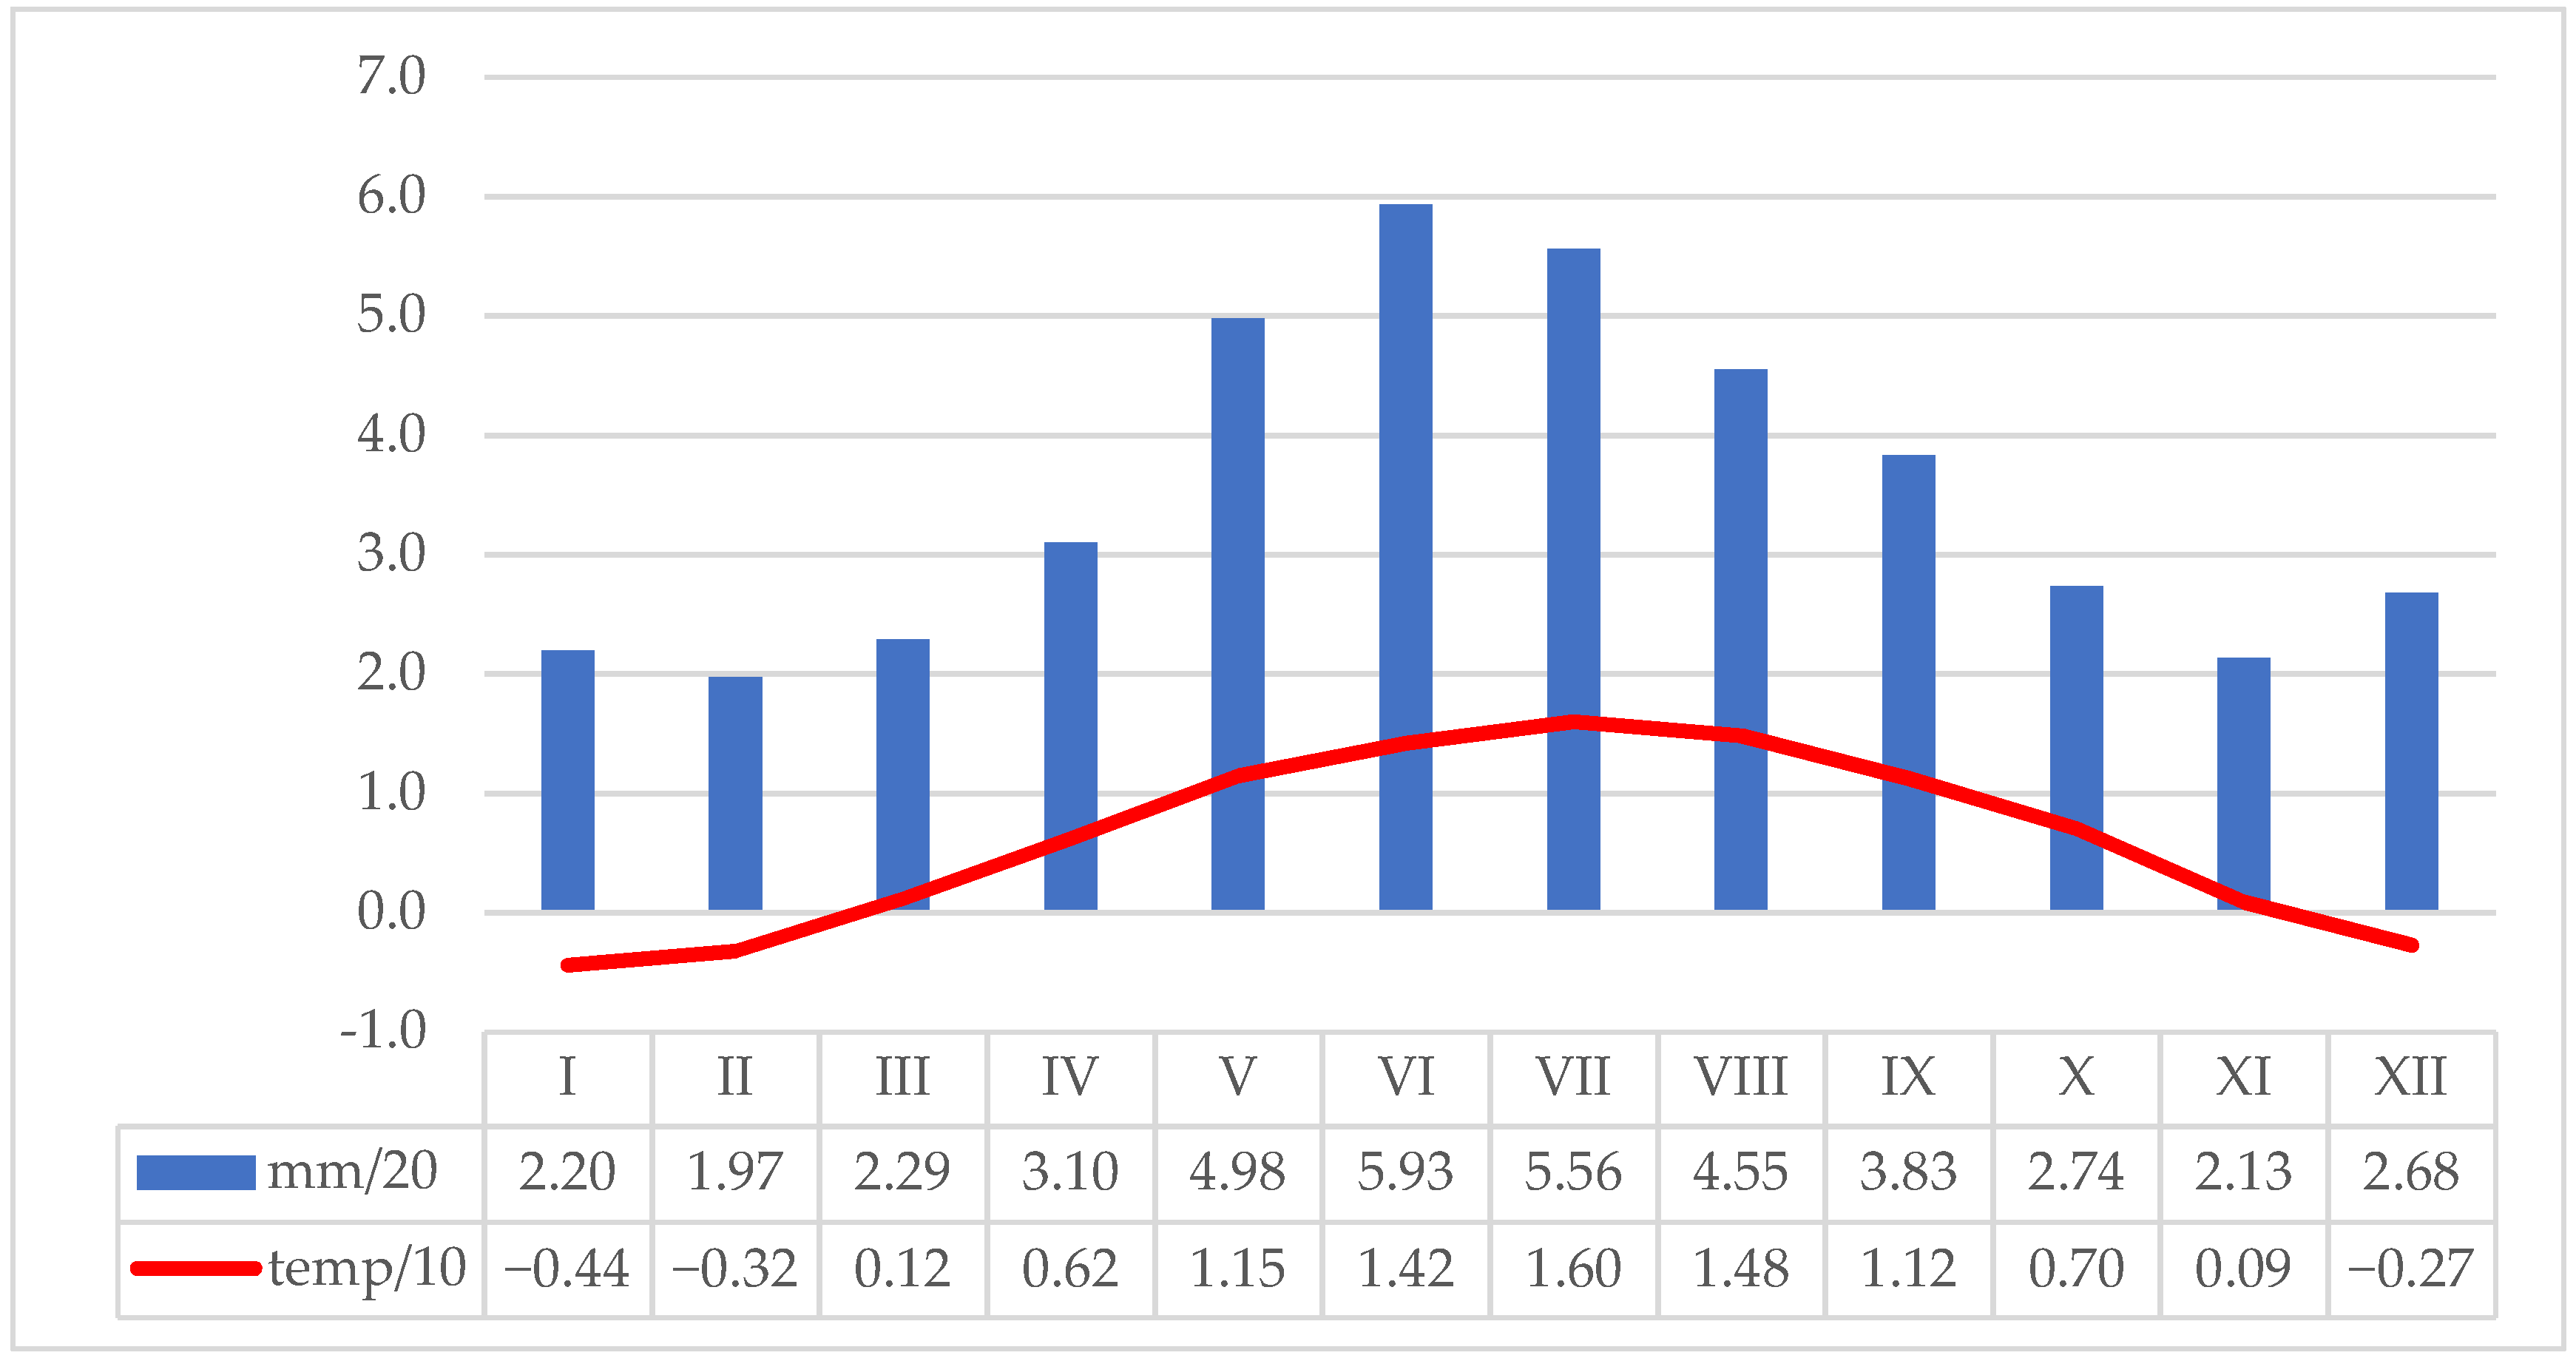
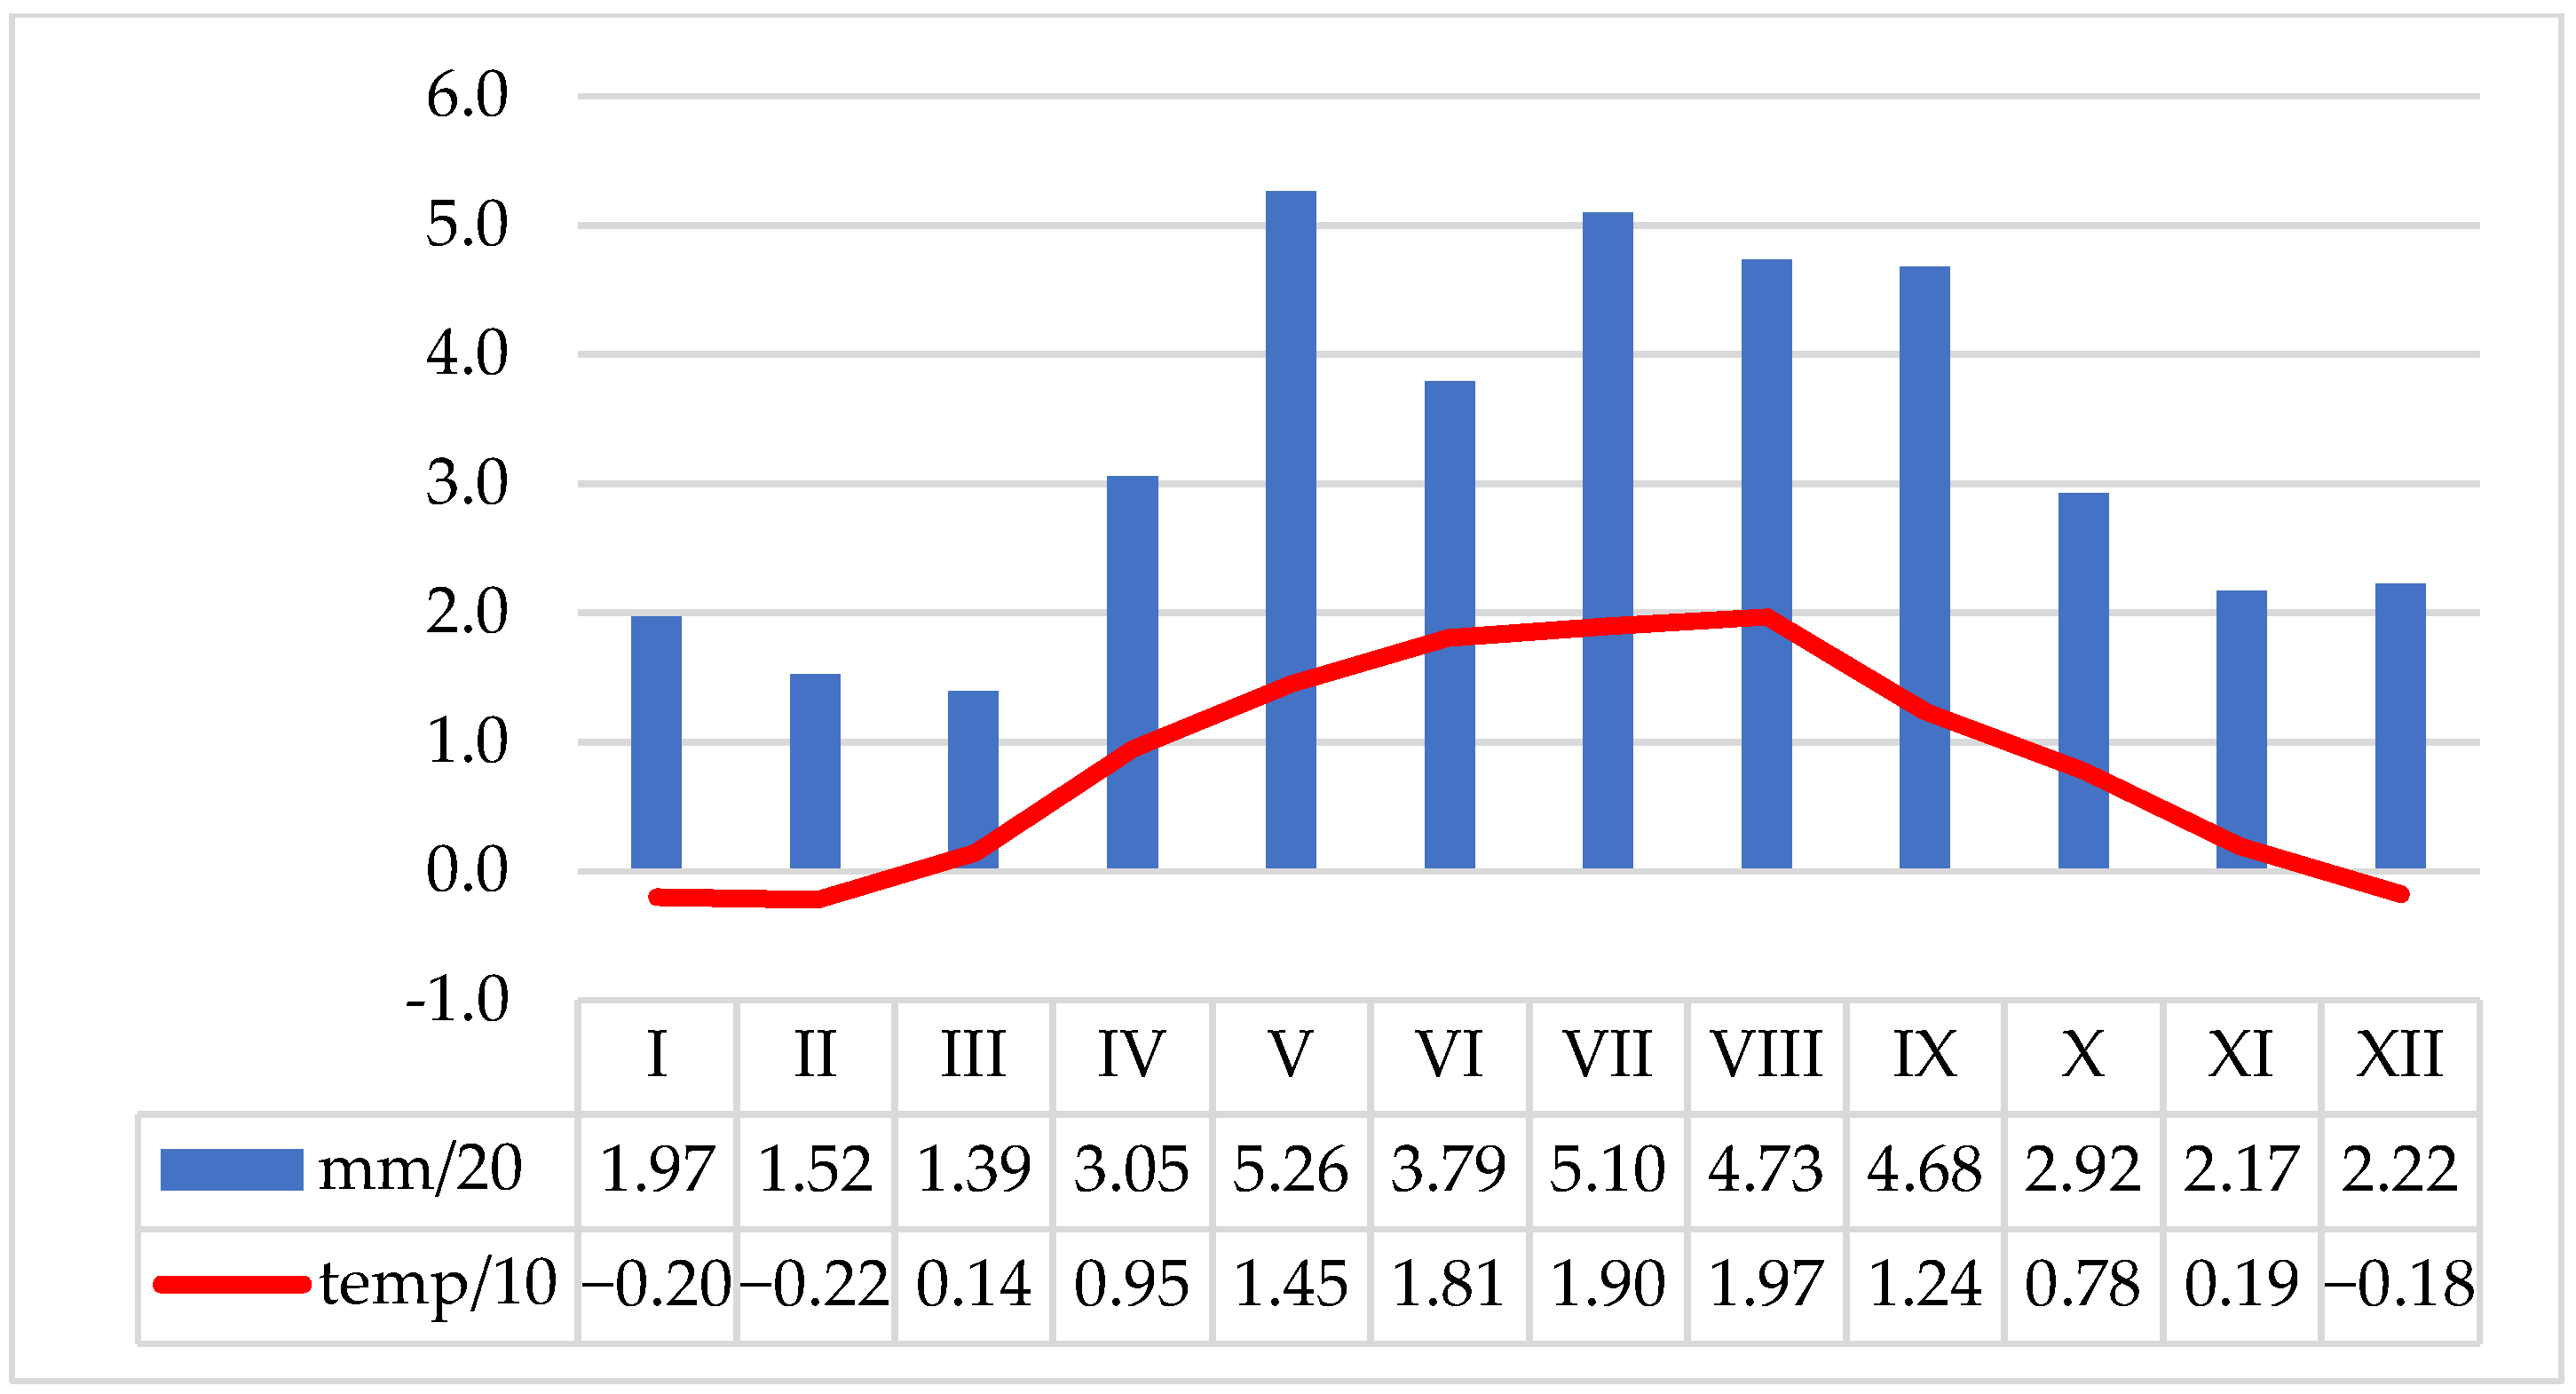
  • The average air temperature in the years of research (2017–2022) was higher than the multi-year average (1961–2000) by 2.15 °C, which confirms the fact that the climate is warming in the region of Southern Poland.
  • The research results indicate the need for early spring sowing plants in this region, which will contribute to covering the soil surface with plant biomass and will counteract erosion caused by intense weather phenomena in the mountainous region.
  • The three new indicators of sustainable agroecosystem management were proposed: SPE-1, SPE-max and SPE-days.

Supplementary Materials

The following supporting information can be downloaded at: https://www.mdpi.com/article/10.3390/su16188212/s1, Figure S1: Experimental scheme for the one year of the study; Table S1: Temperature conditions measured in the Czyrna Station in the experiment’s period (2017–2022) and in multiannual period (1961–2000) (averaged temperatures, °C); Table S2: Precipitation conditions measured in the Czyrna Station in the experiment’s period (2017–2022) and in multiannual period (1961–2000) (totals, mm).

Author Contributions

Conceptualization, K.K.; Methodology, J.P., K.K. and A.L.; Software, K.K.; Validation, K.K.; Formal analysis, K.K.; Investigation, K.K.; Resources, K.K.; Data curation, K.K. and A.K.; Writing—original draft, K.K.; Writing—review & editing, J.P. and A.K.; Visualization, K.K. and A.K.; Supervision, J.P., K.K. and A.L.; Project administration, J.P. and K.K.; Funding acquisition, J.P. All authors have read and agreed to the published version of the manuscript.

Funding

This research was funded by the Ministry of Science and Higher Education of the Republic of Poland.

Institutional Review Board Statement

Not applicable.

Informed Consent Statement

Not applicable.

Data Availability Statement

The data is contained within the article and Supplementary Materials.

Conflicts of Interest

The authors declare no conflicts of interest.

References

  1. Dubas, A. Sustainable development in contemporary agriculture systems. Fragm. Agron. 2007, 24, 71–75. [Google Scholar]
  2. Kociszewski, K. Sustainable Development of Agriculture—Theoretical Aspects and Their Implications. Econ. Environ. Stud. 2018, 18, 1119–1134. [Google Scholar] [CrossRef]
  3. Rudnicki, R.; Biczkowski, M.; Wiśniewski, Ł.; Wiśniewski, P.; Bielski, S.; Marks-Bielska, R. Towards Green Agriculture and Sustainable Development: Pro-Environmental Activity of Farms under the Common Agricultural Policy. Energies 2023, 16, 1770. [Google Scholar] [CrossRef]
  4. Bernués, A.; Rodríguez-Ortega, T.; Alfnes, F.; Clemetsen, M.; Eik, L.O. Quantifying the Multifunctionality of Fjord and Mountain Agriculture by Means of Sociocultural and Economic Valuation of Ecosystem Services. Land Use Policy 2015, 48, 170–178. [Google Scholar] [CrossRef]
  5. Klima, K.; Synowiec, A.; Puła, J.; Chowaniak, M.; Pużyńska, K.; Gala-Czekaj, D.; Kliszcz, A.; Galbas, P.; Jop, B.; Dąbkowska, T.; et al. Long-Term Productive, Competitive, and Economic Aspects of Spring Cereal Mixtures in Integrated and Organic Crop Rotations. Agriculture 2020, 10, 231. [Google Scholar] [CrossRef]
  6. Klima, K.; Kliszcz, A.; Puła, J.; Lepiarczyk, A. Yield and Profitability of Crop Production in Mountain Less Favoured Areas. Agronomy 2020, 10, 700. [Google Scholar] [CrossRef]
  7. Adelabu, D.B.; Clark, V.R.; Bredenhand, E. Potential for Sustainable Mountain Farming: Challenges and Prospects for Sustainable Smallholder Farming in the Maloti–Drakensberg Mountains. Mt. Res. Dev. 2020, 40, A1. [Google Scholar] [CrossRef]
  8. Li, X.; El Solh, M.; Siddique, K.H.M. Mountain Agriculture: Opportunities for Harnessing Zero Hunger in Asia; FAO: Bangkok, Thailand, 2019. [Google Scholar]
  9. Wang, Y.; Yang, C.; Zhang, Y.; Xue, Y. Mountainous Areas: Alleviating the Shortage of Cultivated Land Caused by Changing Dietary Structure in China. Land 2023, 12, 1464. [Google Scholar] [CrossRef]
  10. Kuczyńska, A.; Surma, M.; Adamski, T.; Krajewski, P.; Mikołajczak, K.; Ogrodowicz, P.; Kempa, M.; Ćwiek-Kupczyńska, H.; Trzeciak, R. Effects of drought on the development and architecture of barley root system. Biul. Inst. Hod. Aklim. Roślin 2019, 286, 117–121. [Google Scholar] [CrossRef]
  11. Zając, Ł.; Chojnacka-Ożga, L. Variability of thermos–pluvial conditions of the growing season in RDSF Kraków in years 1961−2020. Sylwan 2021, 165, 654–670. [Google Scholar] [CrossRef]
  12. Samborski, A.; Ovcharuk, O. Air Temperature Changes during the Plant Growth Period on the Polish-Ukrainian Borderland. 2020. Available online: http://dspace.wunu.edu.ua/bitstream/316497/39223/1/10-13%20Samborski.pdf (accessed on 18 September 2024).
  13. Górski, T.; Zaliwski, A. A Model of Poland Agroclimate; Zakład Agrometeorologiii Zastosowań Informatyki IUNG Puławy: Puławy, Poland, 2001; pp. 1–10. [Google Scholar]
  14. Karaczun, Z.; Kozyra, J. The Impact of Climate Change on Poland’s Food Security; SGGW: Warszawa, Poland, 2020; pp. 1–120. Available online: http://zgpke.pl/wp-content/uploads/2020/11/Raport_Klimat_bezpieczenstwo_zywienowe_Karaczun_20.03.pdf (accessed on 18 September 2024).
  15. Klima, K.; Puła, J.; Kliszcz, A. Effect of Conventional and Organic Farming on Crop Yielding and Water Erosion Intensity on Sloping Farmland. Agron. Sci. 2022, 77, 41–52. [Google Scholar] [CrossRef]
  16. Al-Qubati, A.; Zhang, L.; Pyarali, K. Climatic Drought Impacts on Key Ecosystem Services of a Low Mountain Region in Germany. Environ. Monit. Assess. 2023, 195, 800. [Google Scholar] [CrossRef] [PubMed]
  17. Dembek, W.; Kuś, J.; Wiatkowski, M. Innovative Methods of Water Resources Management in Agriculture; Centrum Doradztwa Rolniczego w Brwinowie: Brwinów, Poland, 2016; pp. 1–297. Available online: https://www.cdr.gov.pl/images/Brwinow/wydawnictwa/2016/Innowacyjne%20metody%20gospodarowania%20zasobami%20wody%20w%20rolnictwie.pdf (accessed on 26 August 2024).
  18. Tallec, T.; Béziat, P.; Jarosz, N.; Rivalland, V.; Ceschia, E. Crops’ Water Use Efficiencies in Temperate Climate: Comparison of Stand, Ecosystem and Agronomical Approaches. Agric. For. Meteorol. 2013, 168, 69–81. [Google Scholar] [CrossRef]
  19. Brant, V.; Zábranský, P.; Škeříková, M.; Pivec, J.; Kroulík, M.; Procházka, L. Effect of Row Width on Splash Erosion and Throughfall in Silage Maize Crops. Soil Water Res. 2017, 12, 39–50. [Google Scholar] [CrossRef]
  20. Ma, B.; Liu, Y.; Liu, X.; Ma, F.; Wu, F.; Li, Z. Soil Splash Detachment and Its Spatial Distribution under Corn and Soybean Cover. CATENA 2015, 127, 142–151. [Google Scholar] [CrossRef]
  21. Fu, Y.; Li, G.; Zheng, T.; Zhao, Y.; Yang, M. Fragmentation of Soil Aggregates Induced by Secondary Raindrop Splash Erosion. CATENA 2020, 185, 104342. [Google Scholar] [CrossRef]
  22. Bollinne, A. Adjusting the Universal Soil Loss Equation for Use in Western Europe. In Soil Erosion and Conservation; SCSA: Ankeny, IA, USA, 1985; pp. 206–213. [Google Scholar]
  23. Bui, E.N.; Box, J.E., Jr. Stemflow, Rain Throughfall, and Erosion under Canopies of Corn and Sorghum. Soil Sci. Soc. Am. J. 1992, 56, 242–247. [Google Scholar] [CrossRef]
  24. Foody, G.M. Status of Land Cover Classification Accuracy Assessment. Remote Sens. Environ. 2002, 80, 185–201. [Google Scholar] [CrossRef]
  25. Laflen, J.M. Understanding and Controlling Soil Erosion by Rainfall. In Soil and Water Conservation; Sleeping Bear Press Inc.: Chelsea, MA, USA, 1998; pp. 1–19. [Google Scholar]
  26. Kalinowska, B.; Bórawski, P.; Bełdycka-Bórawska, A.; Klepacki, B.; Perkowska, A.; Rokicki, T. Sustainable Development of Agriculture in Member States of the European Union. Sustainability 2022, 14, 4184. [Google Scholar] [CrossRef]
  27. Klima, K.; Wiśniowska-Kielian, B. Anti-Erosion Effectiveness of Selected Crops and the Relation to Leaf Area Index (LAI). Plant Soil Environ. 2006, 52, 35–40. [Google Scholar] [CrossRef]
  28. Klima, K.; Wiśniowska-Kielian, B.; Lepiarczyk, A. The Interdependence between the Leaf Area Index Value and Soil-Protecting Effectiveness of Selected Plants. Plant Soil Environ. 2016, 62, 151–156. [Google Scholar] [CrossRef]
  29. Gao, J.; Bai, Y.; Cui, H.; Zhang, Y. The Effect of Different Crops and Slopes on Runoff and Soil Erosion. Water Pract. Technol. 2020, 15, 773–780. [Google Scholar] [CrossRef]
  30. Wischmeier, W.H.; Smith, D.D. Predicting Rainfall Erosion Losses—A Guide to Conservation Planning; Agriculture Handbook No. 537; United States Department of Agriculture: Washington, DC, USA, 1978; pp. 1–58.
  31. Słupik, J. Conditions of Infiltration and Surface Run-off in the Sant Catchment Basin. Biul L’Acad. Pol. Sci. Ser. Sci. Terre 1975, 23, 233–236. [Google Scholar]
  32. Gil, E. Monitoring of water circulation and runoff on slopes. In Integrated Monitoring of the Natural Environment Base Station Szymbark (Flysch Carpathians); Starkl, L., Gil, E., Eds.; Environmental Monitoring Library: Warsaw, Poland, 1994; pp. 66–87. (In Polish) [Google Scholar]
  33. FAO. World Reference Base for Soil Resources 2014. International Soil Classification System for Naming Soils and Creating Legends for Soil Maps. Update 2015; World Soil Resources Reports No. 106; Food and Agriculture Organization of the United Nations: Rome, Italy, 2015; pp. 1–203. Available online: https://openknowledge.fao.org/server/api/core/bitstreams/bcdecec7-f45f-4dc5-beb1-97022d29fab4/content (accessed on 18 September 2024).
  34. Kabała, C.; Charzyński, P.; Chodorowski, J.; Drewnik, M.; Glina, B.; Greinert, A.; Hulisz, P.; Jankowski, M.; Jonczak, J.; Łabaz, B.; et al. Polish Soil Classification, 6th Edition—Principles, Classification Scheme and Correlations. Soil Sci. Annu. 2019, 70, 71–97. [Google Scholar] [CrossRef]
  35. Gaussen, H. Théorie et Classification des Climats et Micro Climats; C.R. VIIIème Congres International de Botanique: Paris, France, 1954; pp. 125–130. [Google Scholar]
  36. Hess, M.T. Climatic zones in the Polish Western Carpathians. Zesz. Nauk. UJ-Pr. Geogr. 1965, 11, 237–255. [Google Scholar]
  37. Vaezi, A.R.; Ahmadi, M.; Cerdà, A. Contribution of Raindrop Impact to the Change of Soil Physical Properties and Water Erosion under Semi-Arid Rainfalls. Sci. Total Environ. 2017, 583, 382–392. [Google Scholar] [CrossRef]
  38. Rejman, J. Splash detachment on a silt loam soil with and without a plant cover on triticale. Zesz. Probl. Post. Nauk Rol. 1990, 388, 161–168. [Google Scholar]
  39. Rejman, J.; Brodowski, R. Effect of soil moisture content and surface conditions on runoff and wash on loamy sand. Acta Agrophysica 2004, 4, 619–624. [Google Scholar]
  40. Rejman, J.; Dębicki, R.; Paluszek, J. Soil Loss and Crop Yields in Eroded Loess Area under Soil Conservation Practices. In Multidisciplinary Approaches to Soil Conservation Strategies; ZALF Berichte: Müncheberg, Germany, 2001; Volume 47, pp. 53–58. [Google Scholar]
  41. Zhang, W.; Yu, D.; Shi, X.; Wang, H.; Gu, Z.; Zhang, X.; Tan, M. The Suitability of Using Leaf Area Index to Quantify Soil Loss under Vegetation Cover. J. Mt. Sci. 2011, 8, 564–570. [Google Scholar] [CrossRef]
  42. Yli-Viikari, A. Indicators for Sustainable Agriculture—A Theoretical Framework for Classifying and Assessing Indicators. Agric. Food Sci. 1999, 8, 265–283. [Google Scholar] [CrossRef]
  43. Gil, E.; Kijowska-Strugała, M.; Demczuk, P. Soil Erosion Dynamics on a Cultivated Slope in the Western Polish Carpathians Based on over 30 Years of Plot Studies. CATENA 2021, 207, 105682. [Google Scholar] [CrossRef]
  44. Renard, K.G.; Foster, G.R.; Weesies, G.A.; Porter, J.P. RUSLE: Revised Universal Soil Loss Equation. J. Soil Water Conserv. 1991, 46, 30–33. [Google Scholar]
  45. Di Stefano, C.; Ferro, V.; Pampalone, V. Applying the USLE Family of Models at the Sparacia (South Italy) Experimental Site. Land Degrad. Dev. 2017, 28, 994–1004. [Google Scholar] [CrossRef]
  46. Fan, J.; Motamedi, A.; Galoie, M. Impact of C Factor of USLE Technique on the Accuracy of Soil Erosion Modeling in Elevated Mountainous Area (Case Study: The Tibetan Plateau). Environ. Dev. Sustain. 2021, 23, 12615–12630. [Google Scholar] [CrossRef]
  47. Helmi, A.M. Quantifying Catchments Sediment Release in Arid Regions Using GIS-Based Universal Soil Loss Equation (USLE). Ain Shams Eng. J. 2023, 14, 102038. [Google Scholar] [CrossRef]
  48. Tang, Q.; He, C.; He, X.; Bao, Y.; Zhong, R.; Wen, A. Farmers’ Sustainable Strategies for Soil Conservation on Sloping Arable Lands in the Upper Yangtze River Basin, China. Sustainability 2014, 6, 4795–4806. [Google Scholar] [CrossRef]
  49. Rybicki, R.; Obroślak, R.; Mazur, A.; Marzec, M. Assessment of Tillage Translocation and Tillage Erosion on Loess Slope by Contour Mouldboard Tillage. J. Ecol. Eng. 2016, 17, 247–253. [Google Scholar] [CrossRef]
  50. Kijowska-Strugała, M.; Kiszka, K. Environmental Factors Affecting Splash Erosion in the Mountain Area (the Western Polish Carpathians). Landf. Anal. 2018, 36, 97–111. [Google Scholar] [CrossRef]
  51. Sazońska, B. Agri-Environment-Climate Action; Centrum Doradztwa Rolniczego w Brwinowie, Oddział w Radomiu: Radom, Poland, 2015.
  52. Nowak, D.; Pikosz, M. Ecoschemes; Centrum Doradztwa Rolniczego w Brwinowie, Oddział w Poznaniu: Poznań, Poland, 2023.
Figure 1. The Gaussen-Walter climatogram for experimental area in the research years (monthly, 2017–2022).
Sustainability 16 08212 g001
Figure 2. The Gaussen-Walter climatogram for experimental area in the multiannual period (monthly, 1961–2000).
Sustainability 16 08212 g002
Figure 3. The soil-protection effectiveness of the maize and indicators of sustainable agroecosystem management (1: SPE-1, 2: SPE-max, 3: SPE-days).
Sustainability 16 08212 g003
Figure 4. The soil-protection effectiveness of the oats and indicators of sustainable agroecosystem management (1: SPE-1, 2: SPE-max, 3: SPE-days).
Sustainability 16 08212 g004
Figure 5. The soil-protection effectiveness of the spring vetch and indicators of sustainable agroecosystem management (1: SPE-1, 2: SPE-max, 3: SPE-days).
Sustainability 16 08212 g005
Table 1. Snow-melt seasons and dates of rainfall causing surface run-off between 1 January 2017 and 31 December 2022.
Snow-Melt Seasons and Dates of RainfallWater Storage in Snow
(mm)
Duration of Rainfall
(min)
Rainfall Total (mm)Maximum Intensity (mm·min−1)Classification of Rainfall According to [32] *
2017
14–25 February27.6
17–18 April 13627.40.041
28 April 7529.60.63
30 May 3526.61.03
4 June 3120.20.93
23 June 3426.30.93
20 August 4246.81.64
12 September 4224.80.73
17 September 5432.20.63
22 October 3923.40.83
2018
1–11 January32.0
8 May 3524.80.83
17–18 May 179038.80.021
17 July 3941.21.44
11 August 3429.71.13
25 August 3132.21.94
4 September 5234.60.73
2019
12–18 January31.9
28 April 5643.20.93
14–15 May 106034.00.071
22 May 3235.41.64
23 May 5749.71.13
24 July 2523.41.33
11–12 August 72033.30.071
23 August 3923.20.93
2020
2 May0.002622.31.23
16–20 June 125040.60.081
27 June 3425.31.23
15–17 July 132041.90.071
16 August 3232.21.64
1 September 4338.01.13
1–2 October 72023.60.061
12 October 2722.41.03
13 October 5337.60.83
2021
13 April0.005324.40.73
13 May 2922.51.13
18 May 3024.11.23
23 June 4635.40.93
24 June 3436.81.64
9 July 3427.21.23
15 July 6056.11.35
5 August 6356.31.05
9 August 2823.41.13
17 September 3123.20.93
2022
15–16 April0.0069021.00.081
9 June 2620.21.03
16 June 3021.20.93
5 July 3933.01.33
23 July 3528.41.13
13 August 2823.01.23
21 August 2728.61.74
*Rainfall totalMaximum intensity
(mm)(mm·min−1)
1—Short-term rainfall of low intensityup 900.01–0.07
2—Long-term rainfall of low intensity91–3000.08–0.19
3—Short rainup 300.20–1.30
4—Short-term downpour31–501.40–2.20
5—Torrential rain51–900.80–1.30
6—Extensive rain periodically changing to downpour91–300extensive rain: 0.01–0.16
downpour: 1.40–2.20
Table 2. Sowing and harvesting dates of plants cultivated in the Czyrna Experimental Station (2017–2022).
Plant Species201720182019202020212022
Hulled oatsS * 11 April9 April10 April7 April17 April14 April
H * 22 August14 August15 August18 August11 August22 August
Spring vetchS * 11 April9 April10 April7 April17 April14 April
H * 21 August13 August14 August15 August11 August22 August
Fodder maizeS * 21 April20 April19 April22 April24 April20 April
H * 13 October15 October13 October15 October14 October15 October
* S—sowing date, H—harvest date.
Table 3. Mass of sheet wash (kg·ha−1) from cultivation of fodder maize, hulled oats and spring vetch (average for the research years 2017–2022).
Evaluated PeriodMaizeOatsVetchAverage
(a) from sowing to harvest1302.10589.60538.30810.00
LSD * α = 0.05113.35
(b) annual periods, i.e., from 1 January to 31 December1441.601012.50961.201138.43
LSD α = 0.05141.91
* LSD—post-hoc test Least Significant Difference, α = 0.05.
Disclaimer/Publisher’s Note: The statements, opinions and data contained in all publications are solely those of the individual author(s) and contributor(s) and not of MDPI and/or the editor(s). MDPI and/or the editor(s) disclaim responsibility for any injury to people or property resulting from any ideas, methods, instructions or products referred to in the content.

