Article

Factors Affecting the Happiness of Learners in Higher Education: Attitude, Grade Point Average, and Time Management

by
Nattaporn Thongsri
,
Jariya Seksan
and
Pattaraporn Warintarawej
*
Faculty of Science and Industrial Technology, Surat Thani Campus, Prince of Songkla University, Surat Thani 84000, Thailand
*
Author to whom correspondence should be addressed.
Sustainability 2024, 16(18), 8214; https://doi.org/10.3390/su16188214
Submission received: 26 August 2024 / Revised: 14 September 2024 / Accepted: 17 September 2024 / Published: 21 September 2024

Abstract

:
Student well-being is essential for academic achievement and personal growth. Fostering happiness among university students is crucial for individual development, strong family bonds, a harmonious society, and national progress. This study aimed to identify key determinants of student happiness in higher education. Eight factors, including GPA, workload, family support, university environment, attitude, motivation, time management, and social relationships, were examined among 388 Thai students using an online survey. Students were categorized into distinct groups based on these factors using k-means clustering. ANOVA was employed to assess whether these factors significantly differentiated the groups, and significant factors were further analyzed using regression analysis to confirm their impact on student happiness. A neural network analysis was also utilized to evaluate the relative importance of each factor. The results revealed that attitude, GPA, and time management significantly affected student happiness. A positive attitude fosters a sense of opportunity and achievement, a high GPA reflects academic success and enhances self-confidence, and effective time management reduces stress while allowing more time for enjoyable activities.

1. Introduction

In higher education, the mental health and overall well-being of students have emerged as significant issues of public health concern. The challenges faced during university education, which is a period of transition from adolescence to adulthood with increased self-responsibility, involve a stage of developing into a fully-fledged adult [1,2]. However, mental and emotional stability is still not fully established, leading to self-confusion and internal conflicts [3]. This, combined with the need to adapt to academic demands and social interactions with peers, can easily result in mental health issues such as stress and depression. These problems can lead to academic issues like dropping out, failing to complete studies within the expected time frame, or even more severe outcomes such as suicide [4,5].
In Thailand, the urgency of studying happiness becomes particularly significant in light of the growing concerns about mental health among the youth. According to the Department of Mental Health, the number of patients seeking mental health services has dramatically increased from 1.3 million in 2015 to 2.4 million by 2022. Moreover, in 2023, there were 25,578 cases of suicide attempts, with the highest rates found among teenagers and university students aged 15–19 years, indicating an urgent need for interventions in educational and social environments [6]. This trend is corroborated by a comprehensive study by Professor Dr. Suriyadeo [7], which highlights a decline in the well-being levels of Thai children, particularly noting a shift from ‘good’ levels of well-being to ‘moderate’ and in some regions, even to ‘critical’ levels by 2021. This study emphasizes that the ecosystems surrounding children—families, communities, and especially schools—play critical roles in shaping their happiness.
Moreover, in contemporary society, the digital world exerts a profound influence on various aspects of life. In the context of education, digital technologies contribute to creating interactive learning experiences. Digital word interactions, supported by educational apps, online platforms, and virtual classrooms, enhance learner happiness by establishing engaging, responsive, and personalized learning environments. However, according to the report in [8], currently, 98% of Thai youth have access to the Internet, with the primary activity being communication on social networks such as Facebook, Twitter, Line, and Instagram. Furthermore, survey results indicate that over one-third of Thai students have experienced cyberbullying or cyber harassment. Such cyberbullying has detrimental effects on children’s physical health, mental well-being, emotions, and academic performance. This finding aligns with the study in [9], which reveals that increased use of social media is associated with negative impacts on various mental health indicators and the overall well-being of adolescents.
The competitive nature of Thailand’s educational system, which often leads to high-stress environments and the exclusion of lower-performing students, underscores the necessity of researching and implementing strategies that foster a supportive and enriching educational climate.
According to a report by the United Nations, the happiest country in the world is Finland, followed by Denmark in second place and Iceland in third place, with Thailand ranking 58th out of 143 countries [10]. The Thai Department of Mental Health defines happiness as a state of well-being resulting from the ability to manage life challenges and having the potential for self-development towards a better quality of life, encompassing inner virtues within the context of social and environmental conditions [11]. Fostering happiness among undergraduate students is crucial, given that their student years represent a transitional period from late adolescence to early adulthood. During this time, students are often under the weight of expectations from family, relatives, teachers, and the importance of maintaining good relationships within their social circles, including peers who influence this stage of life. Undergraduate students frequently encounter various pressures. Previous research has presented theories for studying student happiness from multiple perspectives. For instance, the United Nations Educational, Scientific and Cultural Organization [12] categorizes happiness in education into aspects such as positive family relationships, mutual understanding in society, opportunities for students to express their opinions, good physical and mental health, learner-centered teaching approaches, and learning environments conducive to education and societal peace [13]. Happiness in learning can be categorized into three main areas: (1) learner-related aspects include enthusiasm, emotional stability, self-worth, acceptance from teachers and peers, and self-confidence. (2) Learning-related aspects involve balanced self-development, opportunities to choose courses based on interests and aptitudes, responsiveness to curiosity, learning new things, and having learning goals. (3) Relationship-related aspects cover helping others, maintaining positive relationships with those around them, adapting to others, collaboration, and participation in activities. This is consistent with [14], which studied the happiness of undergraduate students by examining variables such as adaptability, emotional management skills, and peer acceptance, and found that adaptability has the highest impact on student happiness.
Therefore, multiple factors contribute to the happiness of learners, prompting researchers to seek answers to understand these influences. Creating an environment conducive to happiness in learning should be a primary goal of the educational system. Continued research in this area is necessary to understand the factors that influence happiness and develop methods to promote happiness in learning. In higher education, research on student happiness is highly valuable, as it is a crucial factor affecting students’ success and development. Student happiness directly impacts their learning ability, motivation, and stress management skills. An in-depth study in this field can provide empirical evidence to help educational institutions and educators develop and improve learning environments, policies, and various supports to enhance the happiness and quality of life of students. This, in turn, will lead to improved academic performance and better university experiences for students.
Research related to studying the factors affecting learners’ happiness has been widely conducted. Emotional and financial support from family can be important factors influencing learners’ happiness. A good parent–child relationship often positively impacts children’s happiness [15]. Family stability, such as having a stable home and good financial conditions, usually positively affects children’s happiness [16]. These studies help to understand the importance of family in promoting learners’ happiness at various stages of their educational journey during adolescence. In addition, the university environment affecting student happiness encompasses various dimensions, such as good teaching quality and a fulfilling learning experience, which are often key factors influencing student happiness [17]. Universities that provide emotional support and a friendly environment tend to enhance student happiness and well-being [18]. Additionally, having adequate and high-quality facilities can increase students’ satisfaction with university life [19]. These studies help to understand the factors influencing student happiness in educational institutions and the improvement of their quality of life in the long term.
Attitude refers to the concepts and beliefs that individuals have towards events, situations, or other people, which influence their behavior and responses in daily life [20]. Attitudinal factors affecting student happiness can be divided into several aspects. For instance, perceiving the learning process as meaningful and receiving appropriate responses can influence student happiness [21]. Self-confidence in one’s academic abilities can also affect student happiness [22].
Motivation refers to the process or state that drives or stimulates individuals to engage in activities or pursue success in various aspects according to their needs or set goals. It is essential in all human activities [23]. A review of the literature found that motivation factors influencing learners’ happiness have been studied from various perspectives as follows: ref. [24] found that learners with clear goals and determination to achieve those goals have higher levels of happiness because goal setting increases motivation and effort in learning. Meanwhile, ref. [25] identified that fostering savoring beliefs, resilience, and a sense of meaning in students can enhance these characteristics, leading to increased happiness and fulfillment in their lives.
Social influence refers to the process by which individuals change their attitudes, beliefs, or behaviors in response to pressure from others in society or their group. Social influence can come in various forms [26]. Ref. [27] found that students who feel supported and cared for by their teachers experience greater happiness and satisfaction in their academic lives. Teacher support also leads to increased self-confidence and better problem-solving abilities in students. Meanwhile, ref. [28] found that social support from classmates positively affects students’ happiness and satisfaction, especially among adolescents, who often prioritize peer relationships.
Time management refers to the process of planning and controlling the use of time in various activities to increase efficiency and effectiveness in work or life. Ref. [29] found that goal setting and prioritization help students manage their time effectively, which results in reduced stress and increased satisfaction with their academic lives. Ref. [30] demonstrated that planning and scheduling enable students to better manage their tasks and activities, leading to greater satisfaction with their studies and increased happiness.
The grade point average (GPA) is a metric used to measure students’ academic performance over a period, commonly used in secondary and higher education. The GPA reflects academic achievement and serves as an important indicator for evaluating students’ overall academic performance. Ref. [31] found that the GPA is positively correlated with university students’ happiness. Students with higher GPAs tend to be more satisfied with their academic lives and experience greater happiness. Meanwhile, ref. [32] highlighted that personal perceptions of success from achieving a high GPA are related to students’ satisfaction and happiness. Students who feel they have succeeded academically often experience higher levels of happiness and satisfaction with their lives.
A student’s workload refers to the quantity of work assigned to students per semester. Ref. [33] explored the relationship between students’ workload, stress, and happiness, finding that excessive workload is associated with higher levels of stress, which negatively impacts students’ overall happiness. Meanwhile, ref. [34] found that excessive workload in online learning leads to decreased happiness and life satisfaction.
From the summary of the aforementioned research, it can be seen that factors such as GPA, workload, family, university, attitude, motivation, and time management affect students’ happiness. This leads to the formulation of the following research questions:
RQ1: How many distinct groups of students can be identified based on factors affecting their happiness?
RQ2: Which factors affect the happiness of students?
The reviewed research forms the basis for the proposed hypotheses, as depicted in Figure 1.
H1
GPA positively influences students’ happiness.
H2
Workload negatively influences students’ happiness.
H3
Family positively influences students’ happiness.
H4
University environment positively influences students’ happiness.
H5
Attitude positively influences their happiness.
H6
Motivation positively influences students’ happiness.
H7
Time management positively influences students’ happiness.
H8
Social influence positively influences students’ happiness.

2. Materials and Methods

2.1. Sample Selection

To verify the hypotheses proposed above, research data were obtained using an online survey questionnaire. The population in this study was 2nd to 4th year undergraduate learners in Thailand, the total number of which is unknown. Based on the Cochran formula [35] with an acceptable sampling error of 0.05, the target sample size was 385 participants. The stratified sampling method was used to select the fields of study randomly; business, social science, and technology science were obtained. Participation was on a voluntary basis. This research employed an online questionnaire that was distributed and received a total of 441 responses. Of these, 53 questionnaires with excessive defects, irregular answers, or contradictory answers were eliminated. Finally, 388 valid questionnaires were utilized. Participants’ demographic information is shown in Table 1.

2.2. Research and Analysis Methods

This study employs a four-step data analysis process, as illustrated in Figure 2. The procedures for each step are as follows:
Step 1: Clustering techniques are used to study the factors affecting students’ happiness by grouping students with similar characteristics into the same cluster and separating those with different characteristics into separate clusters. This approach aims to identify which factors influence the level of students’ happiness. For this research, the k-means clustering technique is employed to group students based on the identified factors being studied. The k-means clustering algorithm is frequently utilized due to its simplicity and efficiency in handling large datasets. K-means clustering involves assigning each data point to one of k distinct clusters. Research on student behavior has widely applied the k-means clustering technique; for example, ref. [36] analyzed factors contributing to mental health problems among Malaysian university students; ref. [37] identified factors influencing psychosocial characteristics and assessed how sociodemographic and psychosocial behaviors during COVID-19 affect individuals; and ref. [38] clustered students based on behaviors such as talkativeness, innovation, reserved nature, carefulness, deep thinking skills, stress handling, and worrying to understand and discuss the necessary advancements.
In this study, the k-means clustering technique is employed to group the variables presented in the research framework. This approach aims to examine the characteristics of students in each group using the Python library sklearn version 1.5.2. K-means clustering is used to categorize students based on factors affecting their happiness, following the steps below.
  • Data preprocessing and normalization.
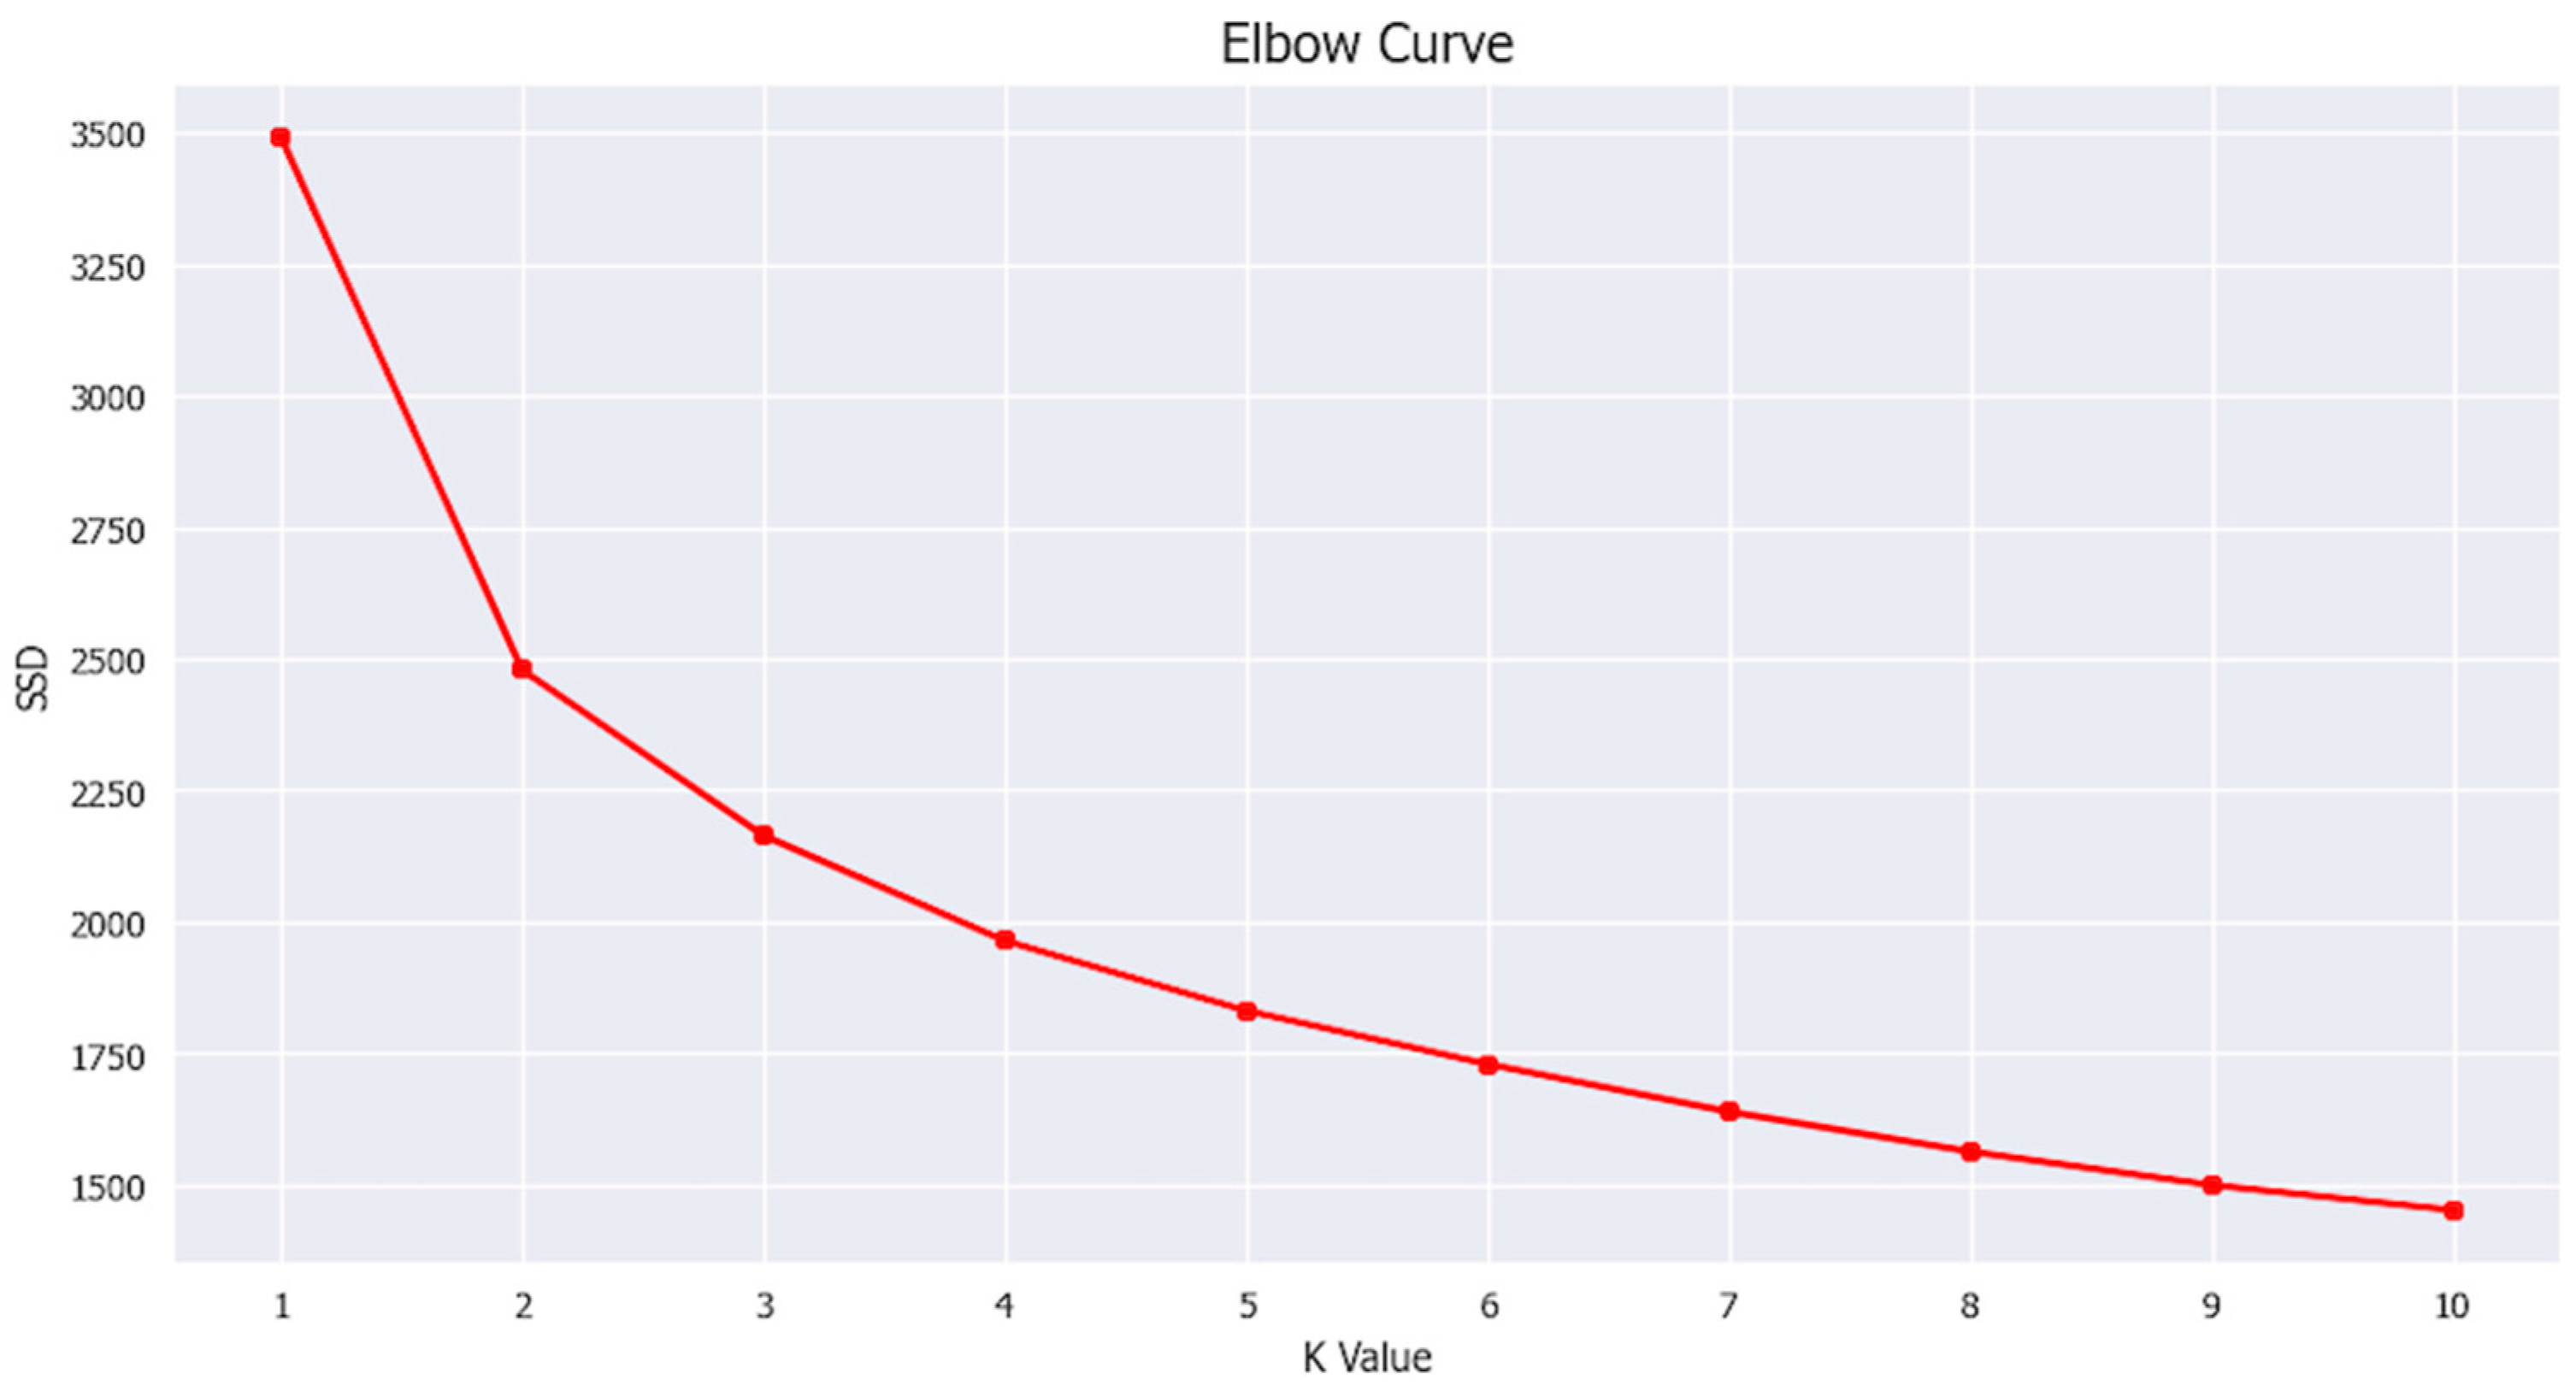
  • Determining the optimal number of clusters using the elbow method.
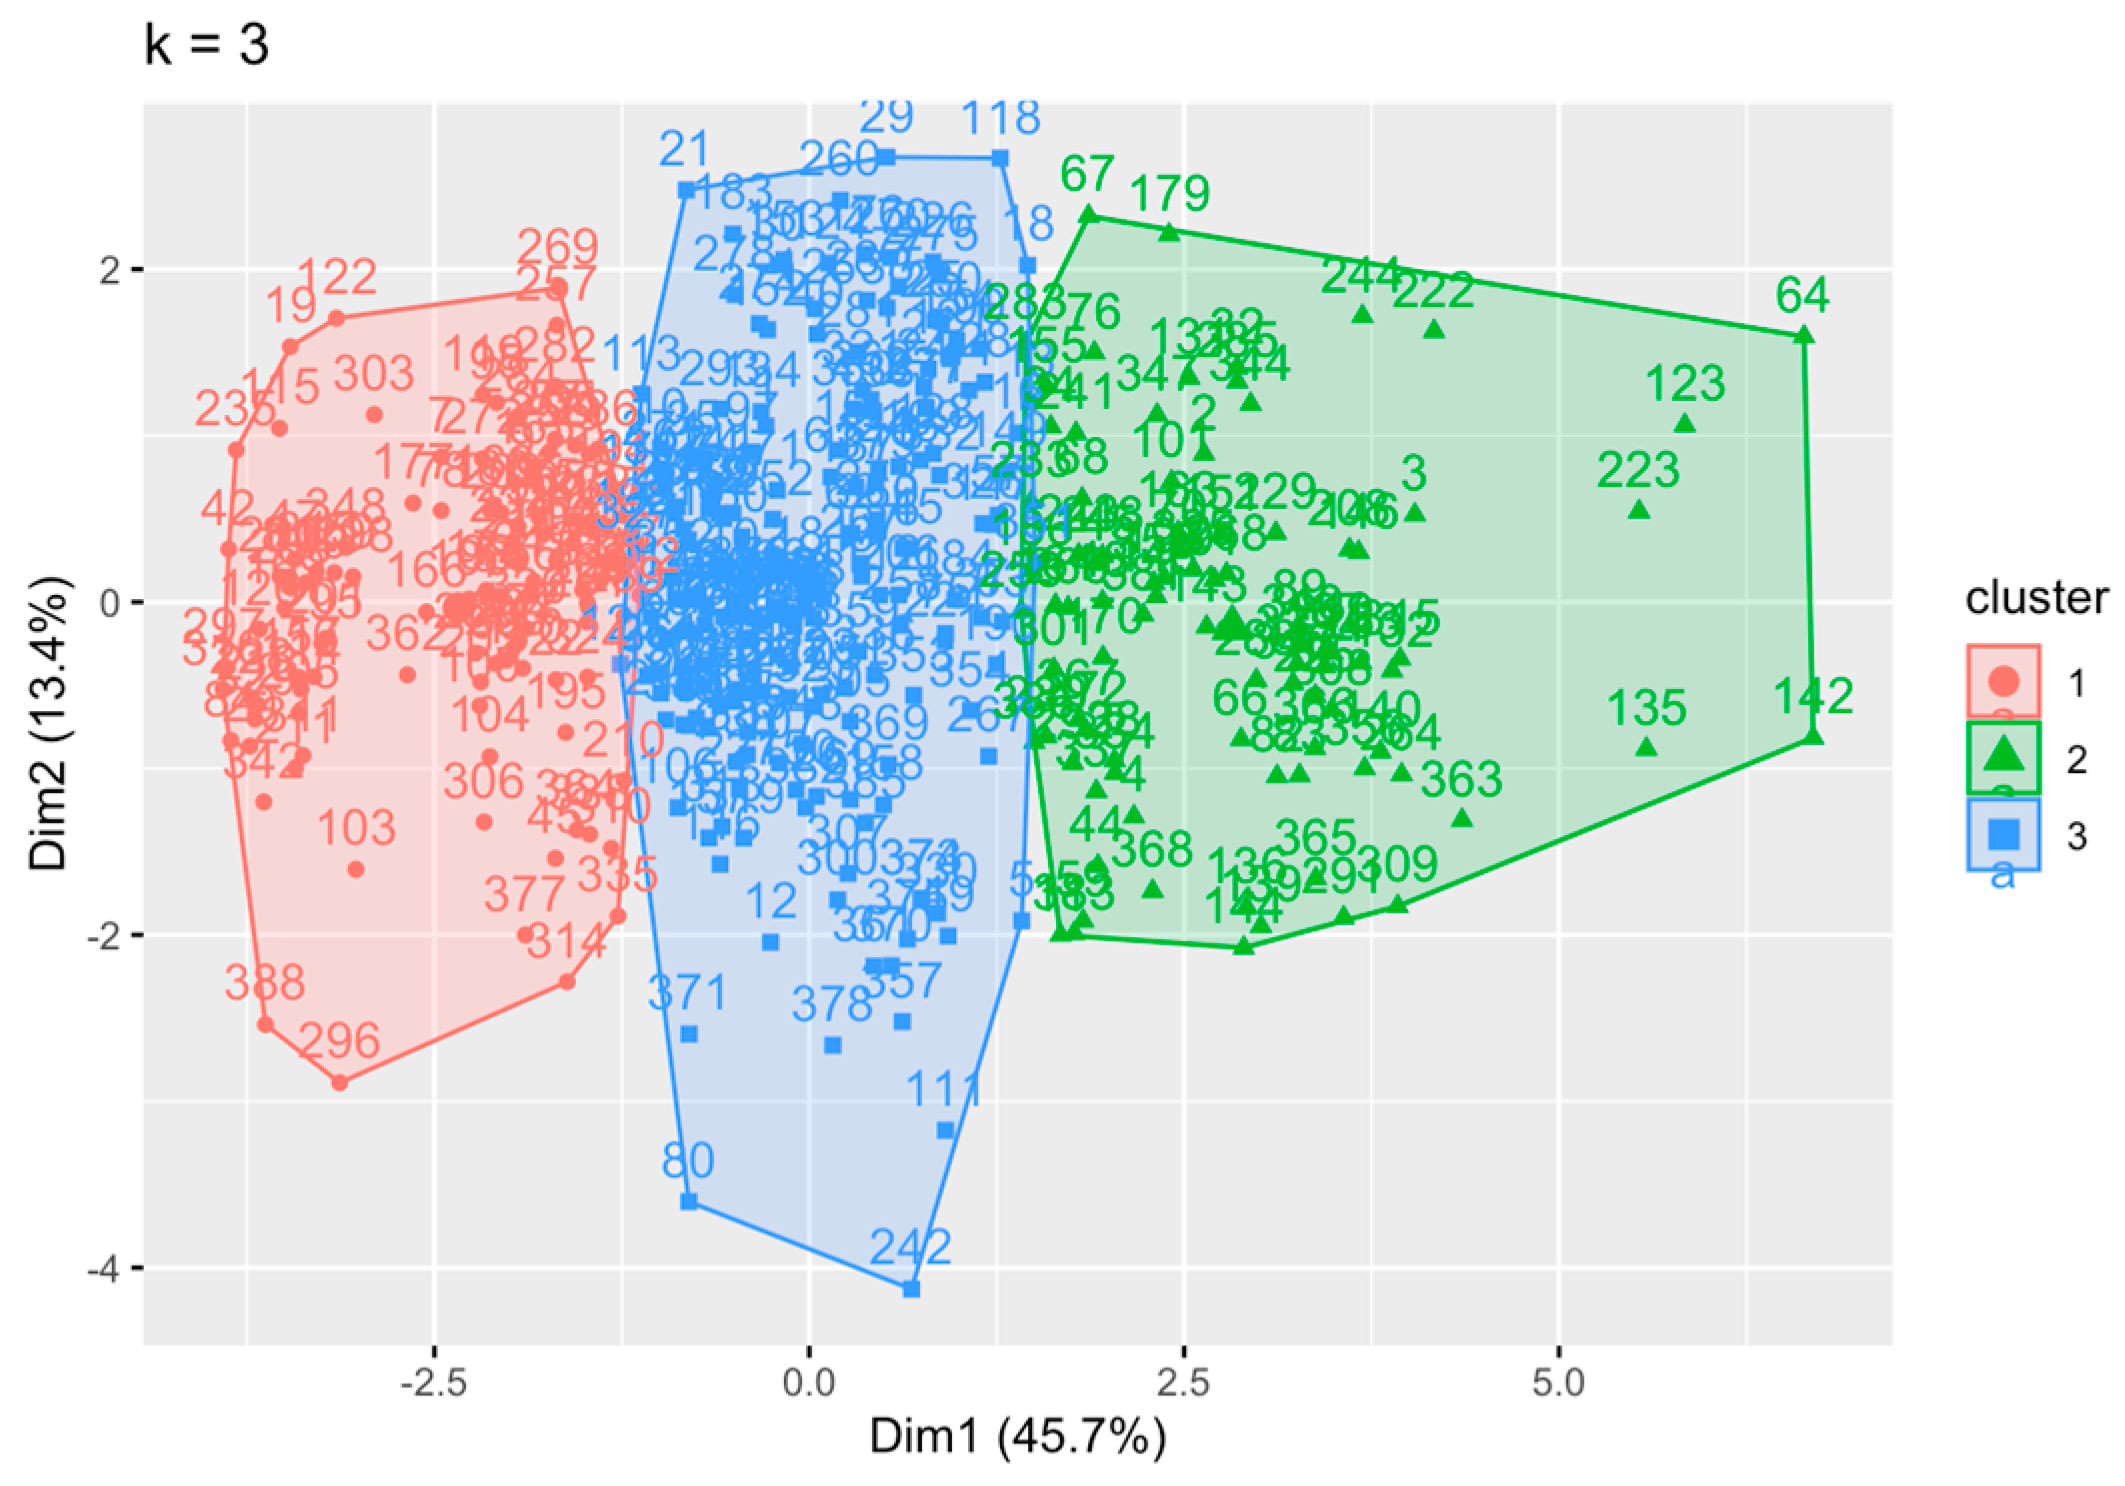
  • Applying the k-means algorithm to assign students to clusters.
  • Analyzing the characteristics and differences of students within each cluster.
Step 2: Analyze the data from the clustering in Step 1 to determine which variables show statistically significant differences using the ANOVA method.
Analysis of variance (ANOVA) is a statistical method used to analyze the differences among group means and determine whether the differences are statistically significant or simply due to random chance. ANOVA is used to compare the means of two or more groups to see if there is enough evidence to conclude that the population means are significantly different from each other. In this study, the one-way ANOVA method was used to compare the means of three clusters derived from the previous step to investigate the characteristics of each group.
Step 3: Extract the variables identified in Step 2 and analyze which variables influence happiness using multiple linear regression.
Multiple linear regression is a model that expresses the linear relationships between a dependent variable and independent variables. The independent variables are sometimes called predictors, as they are considered causes affecting the dependent variable variation. These models consider the effects at a specified time point. The model is obtained from a system of equations that can be expressed in matrix notation as follows (1):
Y = X β + ϵ ,
where Y is an (n × 1) vector of the dependent variable, X is an (n × (k + 1)) matrix of the levels of k independent variables, β is a ((k + 1) × 1) vector of the regression coefficients, and ϵ is an (n × 1) vector of random errors. This method assumes that the expected value of the error term is zero, so the variance is V(ϵ) = σ, and the errors are uncorrelated.
In this study, the equation below summarizes the multiple linear regression considered.
Happiness = β 0 + β 1 GPA + β 2 Workload + β 3 Family + β 4 University_environment + β 5 Attitude + β 6 Motivation + β 7 Time_management + β 8 Social_influence + ε i
The stepwise method is employed to develop the regression model. The stepwise method for regression is a systematic approach to selecting a subset of predictor variables in a regression model. Its objective is to identify the most statistically significant variables while minimizing the risk of overfitting by including only those that substantially enhance the model’s predictive accuracy.
Step 4: The final step involves validating the results from Step 3 by ranking the importance of each variable affecting happiness. This is achieved using neural network techniques.
Neural network techniques involve mathematical and computer science methods used to develop and train computer models that mimic the functioning of human neural systems [39]. These models learn from and predict outcomes based on provided data with high efficiency. Neural networks have the capability to automatically learn and adapt from data, making them powerful tools for complex tasks such as classification, prediction, and clustering. They can evaluate intricate linear and nonlinear relationships between predictors and decision-making factors. Previous research has employed artificial neural networks to identify and evaluate significant factors related to user behavior or preferences. For our analysis, we utilize the hyperbolic tangent (tanh) function (as shown in (3)) in both the hidden and output layers for computations.
t a n h x = 2 1 + e 2 x 1 ,

3. Results

3.1. Data Exploration and Visualization

The dataset on factors affecting student happiness includes several ordinal variables, namely family (FA), university environment (UN), attitude (AT), motivation (MO), time management (TM), and social influence (SI). These variables are assessed using a five-point Likert scale, where one denotes strongly disagree, two represents disagree, three indicates neither agree nor disagree, four stands for agree, and five signifies strongly agree. The specific questions for these variables are detailed in Table 2. Additionally, happiness is measured on a 10-point scale, ranging from one (very unhappy) to ten (extremely happy). The grade point average (GPA) and workload (WL) are quantitative variables. Descriptive statistics for these variables are summarized in Table 3.
Table 2 shows that among 388 respondents, the average GPA score is 3.21 (SD = 0.53). The average of the happiness score is 6.95 (SD = 1.91). The average of the workload score is 8.2 (SD = 3.33). The average of the top three factors are as follows: family has the highest average at 4.49 (SD = 0.59), followed by motivation and social influence with averages of 4.05 (SD = 0.71) and 4.02 (SD = 0.75), respectively.
These findings illustrate the characteristics of the data collected from the survey, as shown in Figure 3.

3.2. Clustering Analysis

The dataset for clustering includes nine variables, which are family, university environment, attitude, motivation, social influence, time management, GPA, workload, and happiness. These variables have different ranges of values. Therefore, prior to clustering, normalization of the data is required. This is achieved using the z-score normalization method, which standardizes the data by setting the mean to 0 and the standard deviation to one, resulting in values within the range of [1.0, 1.0].
The next step involves determining the number of clusters, denoted as k, using the elbow method [40,41]. This method calculates the sum of squared errors (SSE), which represents the total distance between data points and their respective cluster centroids. The goal is to identify the value of k that minimizes the SSE. Figure 4 is visualized by plotting a graph of the SSE against different values of K, where the “elbow” point indicates the optimal number of clusters. The results of the elbow method suggest that the optimal number of clusters, k, is three.
The results of clustering using the k-means technique are displayed in Table 4 and Figure 5.
The results of clustering using the k-means technique are shown in boxplot graphs, separated by factor variables for each group, as illustrated in Figure 5.
Based on the results of clustering the students according to the factors studied, as shown in Figure 5, the characteristics of each student group can be described as in Table 5 and the clustering results using the k-means technique are illustrated through a principal component analysis (PCA) plot, as shown in Figure 6.
In Table 5, the distinct differences between the clusters become more evident. For instance, Cluster 1, “The Highly Happy Motivated Learners”, is characterized by a high GPA, the highest levels of happiness, strong family support, positive attitude, and good time management. These students excel both academically and personally, demonstrating resilience in handling academic pressures and maintaining a balanced life. Cluster 2, “The Moderate Happy Learner, Yet Time-Challenged”, has a similar GPA to Cluster 1 but lower happiness levels. They struggle more with time management and social influence, indicating that although they perform well academically, their overall well-being could benefit from improving these areas to reduce stress and increase happiness. Cluster 3, “The TimeManagement Struggler Learner”, has the lowest GPA and happiness scores, combined with poor time management and attitude. These students face significant challenges academically and personally, requiring comprehensive support, particularly in time management, fostering positive attitudes, and enhancing their social connections to improve their overall well-being.
Although some factors showed similar values across groups, ANOVA testing revealed differences, except for in the workload, where the ANOVA indicated no significant difference between groups. For other variables such as happiness, family, university environment, attitude, motivation, time management, and social influence, differences were found across all three groups, as shown in Table 3. This information can be used to develop strategies to help students manage their time more effectively, create positive attitudes and motivation for learning, and enhance family support to improve overall student happiness.

3.3. Difference Analysis of Three Clusters

From all 388 samples, the students were clustered into three labels. Then, the different characteristics of learners in each group were analyzed. The learners from different clusters differ in terms of GPA (F = 10.51, p < 0.001), happiness (F = 136.68, p < 0.001), family (F = 69.11, p < 0.001), university environment (F = 183.51, p < 0.001), attitude (F = 324.04, p < 0.001), motivation (F = 371.96, p < 0.001), time management (F = 150.98, p < 0.001), and social influence (F = 157.24, p < 0.001). Furthermore, workload has no significant difference among groups (F = 2.33, p = 0.1). The results are shown in Table 6.

3.4. Influence of Significantly Different Factors among Groups on Students’ Happiness

After examining the different characteristics among groups, a regression analysis was conducted to find the most well-predictive model for student happiness prediction and investigate factors that affect learner happiness. All variables found to differ among groups in the previous step are considered at the initial stage. The regression analysis is summarized in Table 7. Using the stepwise method, the model that is the most well-predictive consists of factors that significantly influence student happiness, which are the GPA, attitude, and time management. Those three factors positively predicted student happiness with coefficients of 0.392, 1.431, and 0.353, respectively. The estimated regression equation is (4).
y ^ = 1.213 + 0.392 X 1 + 1.431 X 2 + 0.353 X 3
where y ^ is an estimated value of student happiness depending on predictor variables, X1 is GPA, X2 is attitude, and X3 is time management.
Consequently, the results of the hypothesis testing investigating the influence of independent variables on students’ happiness are presented in Table 8.

3.5. Confirmation of the Importance of Factors Affecting Happiness

In this experiment, three statistically significant variables affecting happiness—GPA, attitude, and time management—along with the variable happiness, were input into the neural network model. The dataset was divided into two subsets, with 70% for training and 30% for testing. Figure 7 illustrates the neural network architecture.
To address overfitting and assess the model’s performance, we employed the ten-fold cross-validation method. We used the root mean square error (RMSE) as the evaluation metric. The RMSE (root mean square error) is a metric used to evaluate the accuracy of forecasting or prediction models, such as artificial neural networks (ANNs) [42]. It is particularly useful in measuring the difference between the predicted values generated by the model and the actual values that occurred. The average cross-validated RMSE for training was 0.159, and for testing, it was 0.177. These low RMSE values indicate that the neural network model effectively captures the numerical relationships between the predictors and the output.
The results, presented in Table 9, show that the most influential factor on happiness is attitude (AT), followed by grade point average (GPA) and time management (TM).

4. Discussion

The study on factors affecting student happiness provides empirical results that address the research questions as shown below.

4.1. Identification of Distinct Student Groups

Based on the clustering results, students in Cluster 1 and Cluster 2 have similar GPAs, but their levels of happiness differ. This suggests that student happiness is likely influenced by other factors in addition to the GPA. The clustering results can guide the development of targeted support activities tailored to the unique characteristics of each group. For instance, students in Cluster 2, despite their good academic performance, have the lowest scores in time management and social influence compared to other variables within the cluster. Therefore, for students in this group, activities that support time management and promote increased social interactions should be encouraged. Similarly, students in Cluster 3, the group with the lowest happiness, exhibit significantly lower scores for all factors compared to the other groups. The most prominent weaknesses in this group are in time management, followed by attitude. Thus, implementing support programs that focus on fostering positive attitudes, providing guidance on time management, and strengthening social networks would likely help students in Cluster 3.

4.2. Factors Influencing Students’ Happiness

From the study results, it was confirmed that factors positively influencing the happiness of higher education students include attitude, GPA, and time management. A review of the literature has shown that researchers have found relationships between these aspects and student happiness from various perspectives.

4.2.1. Attitude

This study focused on attitudes towards learning, such as the belief that what they are studying is beneficial and feeling pride in their field of study. This factor had the highest influence on happiness. The literature review reveals the following relationships between positive attitudes and student happiness in various dimensions: Attitude towards learning: previous studies have found that students with a positive attitude towards learning tend to be happier in their studies because they see learning as an opportunity for personal development and a better future [43]. This finding aligns with [44], which found that a positive attitude towards learning is associated with higher levels of happiness and life satisfaction among university students. Attitude towards faculty and instructors: Satisfaction with the faculty and instructors significantly impacts student happiness. Students who feel supported and well-guided by their instructors tend to have a positive attitude and happiness in their studies. Ref. [45] demonstrated that attitudes towards faculty and support from instructors have a positive correlation with student happiness and satisfaction in academic life. Attitude towards peers: Having a positive attitude towards classmates helps build a sense of belonging to the learning community and fosters good relationships. Students with supportive classmates tend to be happier. Ref. [18] found that having good classmates and a positive attitude towards interactions with peers are associated with student happiness.

4.2.2. Grade Point Average

The GPA variable plays a crucial role in influencing the happiness of higher education students. As an indicator of academic success, the GPA significantly impacts students’ satisfaction and happiness. This study collected GPAs of students from the second semester of the 2023 academic year and found that the GPA is the second most influential factor on happiness, following attitude. Previous research confirms the relationship between the GPA and happiness in various aspects.
  • Academic achievement satisfaction: Students with higher GPAs tend to feel more satisfied with their academic achievements, which increases their overall happiness. Ref. [46] found a positive correlation between high GPAs and life satisfaction and happiness among university students.

4.2.3. Time Management

This study found that time management significantly influences students’ happiness, ranking just below attitude and GPA. Effective time management is crucial for the well-being of higher education students, who must juggle academics, work, and personal activities. Good time management can reduce stress, enhance learning efficiency, and promote daily happiness. The aspects of time management affecting students’ happiness include
  • Planning and goal setting: Clear planning and goal setting help students visualize their tasks and activities, reducing stress and increasing a sense of accomplishment. Ref. [29] found a positive correlation between planning and goal setting with student satisfaction and happiness.
  • Time management for rest and personal activities: Allocating time for rest and personal activities helps students maintain their life balance, rejuvenate, and increases their overall happiness. Ref. [47] reported that managing time for rest and personal activities positively correlates with happiness and life satisfaction.

5. Conclusions

This research found that attitude, GPA, and time management significantly affect student happiness. A positive attitude can help students see opportunities and achieve success in life. A good GPA reflects academic success, enhancing satisfaction and self-confidence. Effective time management allows students to handle workloads and activities efficiently, reducing stress and increasing time for enjoyable activities. These three factors are interrelated and collectively influence students’ overall happiness.

6. Practical Implications and Future Recommendations

This research provides practical findings that can guide future studies in the following areas: First, this study found that attitude has the greatest impact on happiness levels. Therefore, relevant agencies should promote positive attitudes towards learning by creating an enjoyable and meaningful learning environment. This can be achieved by promoting positive attitudes among learners through goal setting, reflection exercises, confidence-building activities, relaxation techniques, and intrinsic motivation strategies. Organizing special events or workshops that focus on developing a positive attitude towards learning, such as setting personal learning goals and emphasizing developmental assessments, can also be beneficial. Future research should expand the scope to include other factors such as attitudes towards teachers, classmates, or extracurricular learning activities. Second, the study found that GPA affects happiness. Therefore, universities should provide effective academic counseling programs with advisors who can offer guidance on study planning, time management, and exam preparation. This support can help students achieve better GPAs and reduce stress. Lastly, time management was found to influence happiness. Future studies could develop platforms to help manage students’ workloads in higher education, enhancing their ability to balance academic responsibilities and personal activities.

Author Contributions

Project administration, conceptualization, methodology, data analysis, writing—original draft, N.T.; conceptualization, methodology, data analysis, validation, writing—original draft, J.S.; and conceptualization, methodology, data preparation, data analysis software, visualization, writing—review and editing, supervision, P.W. All authors have read and agreed to the published version of the manuscript.

Funding

This research was funded by the National Science, Research and Innovation Fund (NSRF) and Prince of Songkla University, grant number SIT6701054S. The APC was funded by the Research and Innovation Fund (NSRF) and Prince of Songkla University.

Institutional Review Board Statement

The study was conducted in accordance with the Declaration of Thailand and approved by the Institutional Review Board (or Ethics Committee) of Mahachulalongkornrajavidyalaya University (protocol code ว98ฝ2567 and date of 11 March 2024).

Informed Consent Statement

Informed consent was obtained from all subjects involved in the study.

Data Availability Statement

Data are contained within the article.

Acknowledgments

All authors would like to thank the principals, teachers, and students for their cooperation.

Conflicts of Interest

The authors declare no conflicts of interest.

References

  1. Bruffaerts, R.; Mortier, P.; Kiekens, G.; Auerbach, R.P.; Cuijpers, P.; Demyttenaere, K.; Green, J.G.; Nock, M.K.; Kessler, R.C. Mental health problems in college freshmen: Prevalence and academic functioning. J. Affect. Disord. 2018, 225, 97–103. [Google Scholar] [CrossRef] [PubMed]
  2. Cheung, K.; Tam, K.Y.; Tsang, M.H.; Zhang, L.W.; Lit, S.W. Depression, anxiety and stress in different subgroups of first-year university students from 4-year cohort data. J. Affect. Disord. 2020, 274, 305–314. [Google Scholar] [CrossRef] [PubMed]
  3. Arnett, J.J. Emerging Adulthood: The Winding Road from the Late Teens through the Twenties; Oxford University Press: Oxford, UK, 2023. [Google Scholar]
  4. Boyne, H. Depressive Symptoms, Perceived Stress, and Nonsuicidal Self-Injury Among Emerging Adults: An Examination of the Mediating Effect of Self-Compassion; University of Toronto (Canada): Toronto, ON, Canada, 2020. [Google Scholar]
  5. Hirsch, J.K.; Rabon, J.K.; Reynolds, E.E.; Barton, A.L.; Chang, E.C. Perceived stress and suicidal behaviors in college students: Conditional indirect effects of depressive symptoms and mental health stigma. Stigma Health 2019, 4, 98–106. [Google Scholar] [CrossRef]
  6. Thecoverage. In 2023, 25,000 Thais Attempted Suicide, ‘Teenagers’ Most Affected—Ministry of Health Promotes ‘Ready Doctor-AI Doctors’ for Assistance. Available online: https://www.thecoverage.info/news/content/6082 (accessed on 24 March 2024).
  7. TheActive. Research Indicates Thai Children’s ‘Happiness’ Declines Annually—Central Region in Severe Crisis. Available online: https://theactive.net/news/public-health-20240130/ (accessed on 1 March 2024).
  8. Institute for Population and Social Research. Stress: The Silent Threat in Thai Society; Mahidol University: Nakhon Pathom, Thailand, 2024. [Google Scholar]
  9. Viner, R.M.; Gireesh, A.; Stiglic, N.; Hudson, L.D.; Goddings, A.-L.; Ward, J.L.; Nicholls, D.E. Roles of cyberbullying, sleep, and physical activity in mediating the effects of social media use on mental health and wellbeing among young people in England: A secondary analysis of longitudinal data. Lancet Child Adolesc. Health 2019, 3, 685–696. [Google Scholar] [CrossRef]
  10. Helliwell, J.F.; Layard, R.; Sachs, J.D.; De Neve, J.E.; Aknin, L.B.; Wang, S. World Happiness Report 2024; University of Oxford, Wellbeing Research Centre: Oxford, UK, 2024. [Google Scholar]
  11. Department of Mental Health. Thai Mental Health Indicators; Department of Mental Health, Ministry of Public Health: Nonthaburi, Thailand, 2022.
  12. UNESCO. Regional Bureau for Educational: Asia and Pacific; UNESCO: Paris, France, 2008. [Google Scholar]
  13. Phanphai, P. Fairy Tales Electronic Book Design System Using Digital Storytelling in Gamification Environment to Enhance Creative Thinking and Happiness in Learning. Ph.D. Thesis, Chulalongkorn University, Bangkok, Thailand, 2018. [Google Scholar]
  14. Srichai, N.; Mattayakorn, K.; Tansakul, J. Factors Influencing Students’ Happiness on Prince of Songkla University, Trang Campus. J. Lib. Arts Maejo Univ. 2022, 10, 177–191. [Google Scholar]
  15. Crouter, A.C.; Head, M.R.; Bornstein, M.H. Handbook of Parenting Volume 3: Being and Becoming a Parent; Psychology Press: London, UK, 2002. [Google Scholar]
  16. Conger, R.D.; Conger, K.J.; Martin, M.J. Socioeconomic status, family processes, and individual development. J. Marriage Fam. 2010, 72, 685–704. [Google Scholar] [CrossRef]
  17. Hanushek, E.A.; Woessmann, L. The Knowledge Capital of Nations: Education and the Economics of Growth; MIT Press: Cambridge, MA, USA, 2023. [Google Scholar]
  18. Chen, Y.; VanderWeele, T.J. Associations of religious upbringing with subsequent health and well-being from adolescence to young adulthood: An outcome-wide analysis. Am. J. Epidemiol. 2018, 187, 2355–2364. [Google Scholar] [CrossRef]
  19. Akhtar, M.; Kroener-Herwig, B. Coping styles and socio-demographic variables as predictors of psychological well-being among international students belonging to different cultures. Curr. Psychol. 2019, 38, 618–626. [Google Scholar] [CrossRef]
  20. Rakap, S.; Balikci, S.; Kalkan, S.; Aydin, B. Preschool teachers’ use of strategies to support social-emotional competence in young children. Int. J. Early Child. Spec. Educ. 2018, 10, 11–25. [Google Scholar] [CrossRef]
  21. Fredricks, J.A.; Blumenfeld, P.C.; Paris, A.H. School engagement: Potential of the concept, state of the evidence. Rev. Educ. Res. 2004, 74, 59–109. [Google Scholar] [CrossRef]
  22. Harter, S. Manualfor the Self-Perception Profilefor Children; University of Denver: Denver, CO, USA, 1985. [Google Scholar]
  23. Maslow, A.H. A theory of human motivation. Psychol. Rev. 1943, 50, 370. [Google Scholar] [CrossRef]
  24. Elliot, A.J. Competition and achievement outcomes: A hierarchical motivational analysis. Motiv. Sci. 2020, 6, 3–11. [Google Scholar] [CrossRef]
  25. Chen, D.-F.; Huang, K.-W.; Ho, W.-S.; Cheng, Y.-C. Savoring Belief, Resilience, and Meaning in Life as Pathways to Happiness: A Sequential Mediation Analysis among Taiwanese University Students. Behav. Sci. 2024, 14, 388. [Google Scholar] [CrossRef]
  26. Maines, D.R. Rediscovering the Social Group: A Self-Categorization Theory; JSTOR: New York, NY, USA, 1989. [Google Scholar]
  27. Suldo, S.M.; Friedrich, A.A.; White, T.; Farmer, J.; Minch, D.; Michalowski, J. Teacher support and adolescents’ subjective well-being: A mixed-methods investigation. Sch. Psychol. Rev. 2009, 38, 67–85. [Google Scholar] [CrossRef]
  28. Rueger, S.Y.; Malecki, C.K.; Demaray, M.K. Relationship between multiple sources of perceived social support and psychological and academic adjustment in early adolescence: Comparisons across gender. J. Youth Adolesc. 2010, 39, 47–61. [Google Scholar] [CrossRef]
  29. Macan, T.H.; Shahani, C.; Dipboye, R.L.; Phillips, A.P. College students’ time management: Correlations with academic performance and stress. J. Educ. Psychol. 1990, 82, 760. [Google Scholar] [CrossRef]
  30. Britton, B.K.; Tesser, A. Effects of time-management practices on college grades. J. Educ. Psychol. 1991, 83, 405. [Google Scholar] [CrossRef]
  31. MacCann, C.; Jiang, Y.; Brown, L.E.R.; Double, K.S.; Bucich, M.; Minbashian, A. Emotional intelligence predicts academic performance: A meta-analysis. Psychol. Bull. 2020, 146, 150. [Google Scholar] [CrossRef]
  32. Parker, P.D.; Marsh, H.W.; Ciarrochi, J.; Marshall, S.; Abduljabbar, A.S. Juxtaposing math self-efficacy and self-concept as predictors of long-term achievement outcomes. In Noncognitive Psychological Processes and Academic Achievement; Routledge: Abingdon, UK, 2017; pp. 39–58. [Google Scholar]
  33. Pascoe, M.C.; Hetrick, S.E.; Parker, A.G. The impact of stress on students in secondary school and higher education. Int. J. Adolesc. Youth 2020, 25, 104–112. [Google Scholar] [CrossRef]
  34. Bao, W. COVID-19 and online teaching in higher education: A case study of Peking University. Hum. Behav. Emerg. Technol. 2020, 2, 113–115. [Google Scholar] [CrossRef] [PubMed]
  35. Cochran, W.G. Sampling Techniques; John Wiley & Sons: Hoboken, NJ, USA, 1977. [Google Scholar]
  36. Isa, N.; Mohamad, N.; Badri, A.I.A.; Sa’aid, H.B. Analyzing Factors of Mental Health Problems among Malaysian University Students using Clustering Analysis. In Proceedings of the 2022 3rd International Conference on Artificial Intelligence and Data Sciences (AiDAS), Ipoh, Malaysia, 7–8 September 2022; pp. 164–169. [Google Scholar]
  37. Jore, S.; Acharya, S.; Hasija, K.G.; Hyde, A. Clustering Analysis of Psychosocial Factors: A Pandemic Perspective. J. Inform. Educ. Res. 2024, 4, 2. [Google Scholar]
  38. Ahmed, S.K.; Gilani, S.M.; Sultan, S.; Riaz, A.R.; Ashraf, M.W.A. An Assessment for Understanding Student Behaviour by Applying Machine Learning Technique. KIET J. Comput. Inf. Sci. 2022, 5, 2. [Google Scholar] [CrossRef]
  39. Bouwmans, T.; Javed, S.; Sultana, M.; Jung, S.K. Deep neural network concepts for background subtraction: A systematic review and comparative evaluation. Neural Netw. 2019, 117, 8–66. [Google Scholar] [CrossRef] [PubMed]
  40. Liu, F.; Deng, Y. Determine the number of unknown targets in open world based on elbow method. IEEE Trans. Fuzzy Syst. 2020, 29, 986–995. [Google Scholar] [CrossRef]
  41. Syakur, M.A.; Khotimah, B.K.; Rochman, E.M.S.; Satoto, B.D. Integration k-means clustering method and elbow method for identification of the best customer profile cluster. IOP Conf. Ser. Mater. Sci. Eng. 2018, 336, 012017. [Google Scholar] [CrossRef]
  42. Olawoyin, A.; Chen, Y. Predicting the future with artificial neural network. Procedia Comput. Sci. 2018, 140, 383–392. [Google Scholar] [CrossRef]
  43. Liang, C.; Sun, J. A study of the happiness of chinese university students and Its influencing factors—A case study of Beijing universities. Sustainability 2022, 14, 16057. [Google Scholar] [CrossRef]
  44. Moon, W.-H.; Kim, J.-Y. Stress and depression in the Korean college students: Mediated effects of self-differentiation and self-efficacy. Bio-Inspired Neurocomput. 2021, 903, 151–161. [Google Scholar]
  45. Chemers, M.M.; Hu, L.-T.; Garcia, B.F. Academic self-efficacy and first year college student performance and adjustment. J. Educ. Psychol. 2001, 93, 55. [Google Scholar] [CrossRef]
  46. Zajacova, A.; Lynch, S.M.; Espenshade, T.J. Self-efficacy, stress, and academic success in college. Res. High. Educ. 2005, 46, 677–706. [Google Scholar] [CrossRef]
  47. Hurley, K. Trait procrastination, time management, and academic behaviour. J. Sodat Behav. Personal. 2003, 8, 47–66. [Google Scholar]
Figure 1. Hypothesized research model.
Sustainability 16 08214 g001
Figure 2. Research procedure.
Sustainability 16 08214 g002
Figure 3. The histograms of the study variables.
Sustainability 16 08214 g003
Figure 4. Visualization by plotting a graph of the SSE against different values of k.
Sustainability 16 08214 g004
Figure 5. The visualization of the results of the k-means technique by boxplot.
Sustainability 16 08214 g005
Figure 6. The visualization of the results of the k−means technique by PCA plot.
Sustainability 16 08214 g006
Figure 7. Neural network architecture.
Sustainability 16 08214 g007
Table 1. Demographic characteristics of the respondents.
PropertyItemFrequencyMeanSD
GenderMale154
Female234
Age 38819.70.78
Field of studyBusiness145
Social sciences118
Technology sciences125
Table 2. The questions on factors affecting student happiness.
VariablesQuestions
Family1: Parents fully support the educational expenses.
2: Parents allow me the freedom to choose the field of study I prefer.
3: My family is supportive and nurturing.
University1: The overall content of the curriculum meets my expectations.
2: The instructor effectively conveys the subject matter.
3: The university environment supports learning.
4: The university provides adequate resources to support learning.
Attitude1: I feel engaged with almost all of my subjects.
2: I believe that learning is beneficial to my life.
3: I feel proud to tell others that I am studying this field.
4: The field of study I am pursuing is one that I enjoy.
Motivation1: I have clear goals set for my studies.
2: I put in more effort when I realize I am behind others.
3: I put more effort into a subject when I find it difficult.
4: I strive to achieve the target grade I set for each course.
5: I aim to pursue a career related to the field I have studied.
Time management1: I like waking up early to study.
2: When I know the exam schedule, I plan ahead to prepare for studying.
3: I read the material in advance for the upcoming class.
4: I allocate time to further explore and acquire additional knowledge.
5: I submit my assignments on time every time.
Social influence1: I have close friends in the field of study I am pursuing.
2: I participate in university activities if friends or close acquaintances are involved.
3: I feel comfortable seeking advice from my instructors.
GPAThe grade point average for the last semester.
WorkloadNumber of assignments given during the last semester.
Table 3. Descriptive statistics.
DescriptiveGPAHappinessWLFAUNATMOTMSI
Mean3.216.958.24.493.994.014.053.314.02
Median3.32784.674443.24
S.D.0.531.913.330.590.660.730.710.810.75
Minimum1112211.81.41.33
Maximum41016555555
Table 4. The results of k-means clustering.
VariableCluster 1 Cluster 2Cluster 3
(n = 109)(n = 191)(n = 88)
Mean ± SDMean ± SDMean ± SD
GPA3.32 ± 0.4793.24 ± 0.5332.99 ± 0.535
Happiness8.50 ± 1.2676.99 ± 1.3954.94 ± 1.704
Workload8.43 ± 2.9298.36 ± 3.5867.56 ± 3.162
Family4.86 ± 0.2734.45 ± 0.5714.15 ± 0.657
University Environment 4.58 ± 0.4604.00 ± 0.4303.23 ± 0.514
Attitude4.69 ± 0.3174.08 ± 0.3933.02 ± 0.574
Motivation4.76 ± 0.2964.06 ± 0.4243.16 ± 0.522
Time management4.08 ± 0.6583.22 ± 0.5642.55 ± 0.578
Social influence4.71 ± 0.4263.95 ± 0.5533.33 ± 0.743
Table 5. The characteristics of each cluster.
ClusterCharacteristics
Cluster 1: The Highly Happy Motivated LearnersThis group consists of students who report high levels of happiness, effective time management, and positive attitudes towards university and learning. They receive substantial family support, have strong social relationships, and exhibit high motivation for their studies.
Cluster 2: The Moderate Happy Learner, Yet Time-ChallengedThis group performs well academically but experiences moderate levels of happiness. Time management and social influence are areas for improvement, indicating that their overall well-being could benefit from support in building stronger social networks and improving time management skills to reduce stress.
Cluster 3: The Time Management Struggler LearnerStudents in this group are struggling both academically and personally. With the lowest scores in their GPAs, happiness, time management, and attitude, they are in need of the most support. Interventions aimed at improving their time management and fostering a positive attitude will be crucial to help these students increase their happiness and academic performance.
Table 6. Comparison of clusters’ characteristics.
VariableCluster 1
(n = 109)
Cluster 2
(n = 191)
Cluster 3
(n = 88)
Fp
GPA3.32 ± 0.479 a3.24 ± 0.533 a2.99 ± 0.535 b10.51 ***< 0.001
Happiness8.5 ± 1.267 a6.99 ± 1.395 b4.94 ± 1.704 c136.68 ***<0.001
Workload8.43 ± 2.929 a8.36 ± 3.586 a7.56 ± 3.162 a2.33 ns0.1
Family4.86 ± 0.273 a4.45 ± 0.571 b4.15 ± 0.657 b69.11 ***<0.001
University environment4.58 ± 0.460 a4.00 ± 0.430 b3.23 ± 0.514 c183.51 ***<0.001
Attitude4.69 ± 0.317 a4.08 ± 0.393 b3.02 ± 0.574 c323.04 ***<0.001
Motivation4.76 ± 0.296 a4.06 ± 0.424 b3.16 ± 0.522 c371.96 ***<0.001
Time management4.08 ± 0.658 a3.22 ± 0.564 b2.55 ± 0.578 c150.98 ***<0.001
Social influence4.71 ± 0.426 a3.95 ± 0.553 b3.33 ± 0.743 c157.24 ***<0.001
Note: mean ± sd. *** indicates significant differences between group means with a significance level of 0.001. ns indicates non-significant differences in group means. a,b,c, different alphabets in the same row indicate significant differences between groups.
Table 7. Regression analysis for learner happiness prediction.
PredictorbSEtp
Intercept−1.2130.558−2.17 *0.030
GPA0.3920.1382.83 **0.005
Attitude1.4310.12411.58 ***<0.001
Time management0.3530.1103.2 **0.001
Note: *, **, and *** indicate a significant influence on the dependent variable with significance levels of 0.05, 0.01, and 0.001, respectively. Model fit: R = 0.671, R2 = 0.451, F = 105, p < 0.001.
Table 8. Hypotheses’ results.
Hypothesisp-ValueSupported
H1: GPA positively influences students’ happiness.0.005Yes
H2: Workload negatively influences students’ happiness.0.254No
H3: Family positively influences students’ happiness.0.610No
H4: University environment positively influences students’ happiness.0.311No
H5: Attitude positively influences their happiness.<0.001Yes
H6: Motivation positively influences students’ happiness.0.761No
H7: Time management positively influences students’ happiness.0.001Yes
H8: Social influence positively influences students’ happiness.0.089No
Table 9. Independent variable importance.
RankConstructsImportanceNormalized Importance
1AT0.579100.00%
2GPA0.21937.9%
3TM0.20234.9%
Disclaimer/Publisher’s Note: The statements, opinions and data contained in all publications are solely those of the individual author(s) and contributor(s) and not of MDPI and/or the editor(s). MDPI and/or the editor(s) disclaim responsibility for any injury to people or property resulting from any ideas, methods, instructions or products referred to in the content.

