Article

The Impact of Enterprise Digital Transformation on Low-Carbon Supply Chains: Empirical Evidence from China

School of Statistics and Data Science, Nanjing Audit University, Nanjing 211815, China
*
Author to whom correspondence should be addressed.
Sustainability 2024, 16(18), 8242; https://doi.org/10.3390/su16188242
Submission received: 29 August 2024 / Revised: 19 September 2024 / Accepted: 20 September 2024 / Published: 22 September 2024
(This article belongs to the Special Issue Green Supply Chain and Sustainable Economic Development)

Abstract

:
The vigorous development of the digital economy, alongside the collaborative promotion of enterprise digital transformation and low-carbon supply chains, has emerged as a critical pathway for achieving green and high-quality development in enterprises. In this paper, we utilize a mathematical model framework to empirically investigate the mechanisms and impacts of enterprise digital transformation on the low-carbon effect of supply chains, employing data from A-share-listed companies spanning 2011 to 2021. The findings indicate that (1) enhancing the degree of enterprise digital transformation can significantly decrease the carbon emission intensity of upstream suppliers, thereby promoting low-carbon supply chains. (2) “Innovation-driven” and “structural transformation” mechanisms are vital channels by which enterprise digital transformation promotes carbon reduction in supply chains. (3) The diffusion mechanism effect and demonstration effect exhibit heterogeneity in the process of enterprise digital transformation, driving low-carbon emission reductions in supply chains.

1. Introduction

The 20th National Congress report emphasizes the need to expedite the development of a modern economic system while also enhancing the resilience and security of supply chains. Improving supply chain resilience boosts supply chains’ ability to adapt to environmental changes and external shocks and promotes sustainable development [1,2]. Conventional approaches to bolstering supply chain resilience, characterized by an excessive dependence on inventory, information asymmetry, and limited responsiveness, are inadequate in addressing the complexity and uncertainty inherent in contemporary supply chains [3,4,5]. In contrast, eco-friendly and low-carbon development strategies significantly enhance the sustainability and adaptability of supply chains by reducing their environmental impact and resource consumption, thereby enhancing their resilience [6,7]. Research into green supply chains has gained prominence as enterprises face growing pressures to minimize their carbon footprints and improve sustainability. Green supply chains integrate environmental considerations into operations, emphasizing eco-friendly practices and waste reduction, which not only address environmental concerns but also drive innovation and enhance efficiency [8,9]. The 2024 Government Work Report highlights the need to strengthen ecological civilization construction, vigorously develop the green and low-carbon economy, promote the research and application of advanced energy-saving and emission-reduction technologies, and accelerate the development of green and low-carbon supply chains. Establishing a green and low-carbon supply chain not only reduces enterprises’ carbon emissions and resource consumption, thereby improving their overall environmental performance, but also enhances their brand value and market competitiveness, significantly boosting their operational performance [10].
Meanwhile, in 2022, the State Council emphasized that digital transformation is a pivotal driver for enhancing corporate competitiveness, promoting high-quality economic development, and achieving industrial upgrading. Digital transformation not only equips enterprises with enhanced technological capabilities, helping them maintain a leading position in a highly competitive market, but also serves as a strategic measure that aids enterprises in achieving their strategic objectives and expanding their market share [11,12,13]. Furthermore, digital transformation aligns with national development strategies and constitutes an essential path to achieving long-term growth and sustainable development [14]. The National Development and Reform Commission issued the “Guiding Opinions on Promoting the Healthy Development of Smart Cities”, which aims to advance smart city construction, enhance the digitalization of urban management and services, and foster sustainability and low emissions. The Ministry of Industry and Information Technology issued the “Industrial Internet Innovation and Development Action Plan (2021–2023)”, advocating for the deep integration of the industrial internet with the manufacturing sector to promote the digital transformation of industrial enterprises and achieve sustainable, green manufacturing.
The existing research literature on enterprise digital transformation and green low-carbon supply chains can be predominantly categorized into two distinct groups. One group concentrates on the impact of digital transformation on environmental spillover effects within enterprises or at the industry level. Some studies have revealed that enterprise digital transformation exerts a positive impact on the environment. Certain scholars posit that digital transformation can directly foster low-carbon emission reductions. It not only decreases an enterprise’s carbon emissions but also promotes low-carbon practices in nearby businesses through spatial spillover effects [15,16]. Other scholars argue that the relationship between the two is indirect. Due to the growth of the digital economy, the total carbon emission intensity in surrounding areas has decreased, driven by advancements in digital finance and the easing of financing restrictions [17,18]. Additional research has discovered that digital transformation can curtail energy consumption in industrial systems and advance industrial low-carbon emissions reductions [19,20]. However, some studies suggest that enterprise digital transformation can lead to negative environmental externalities. During the process of digital transformation, the prolonged operation of data centers and extensive utilization of digital products by enterprises can increase their carbon emissions [21,22,23]. Additionally, some other studies suggest that the relationship between digital transformation and carbon emissions is uncertain. Some research demonstrates that the relationship between digital transformation and carbon emission intensity exhibits an inverted “U” shape [24,25], whereas other research suggests that this relationship can have both positive and negative effects [26].
Another area of research delves into the impact of enterprise digital transformation on the economic performance or production management efficiency of enterprises in supply chains. Some research indicates that digital transformation can assist enterprises in establishing comprehensive digital trade operation systems, thereby enhancing their profitability [27,28]. Additionally, digital transformation is believed to effectively enhance the internal resources and innovation levels of enterprises and, with the aid of external forces, facilitate more effective transformation and upgrading strategies [29,30]. Meanwhile, digital transformation can also improve enterprises’ innovation capabilities and production efficiency while promoting the growth of their total factor productivity [31,32]. Further research has found that digital transformation is a critical mechanism for enhancing supply chain resilience and improving supply chain management efficiency [33,34].
In summary, most existing research investigates the impact of enterprise digital transformation on the intensity of carbon emissions at the enterprise or industry level, with few directly focusing on the environmental spillover effects of the digital transformation of enterprises at the supply chain level. Additionally, while research often concentrates on the spillover effects of enterprise digital transformation on supply chain management and performance, it largely neglects its direct impact on low-carbon supply chains, especially their underlying mechanisms and processes.
Therefore, we empirically test the impact of enterprise digital transformation on low-carbon supply chains through a mathematical model. The possible contributions of our work are as follows: (1) By constructing a mathematical model that encapsulates enterprise digital transformation and supply chain carbon emission strategies, we theoretically elucidate how enterprise digital transformation influences low-carbon supply chains. This model extends our understanding of the impact of digital transformation at the supply chain level and enhances research on the economic implications of enterprise digital transformation. (2) Empirically analyzing the logical pathways through which enterprise digital transformation affects low-carbon supply chains. We delve into these mechanisms via “innovation-driven” and “structural transformation” channels, while also examining the heterogeneity of the diffusion mechanism effect and the demonstration effect, further elucidating their interactions (Figure 1). We not only augment the empirical evidence on how enterprise digital transformation facilitates green and low-carbon supply chains but also offer supporting data and a theoretical reference for government policies targeting high-quality development and the achievement of the “dual carbon” goals.

2. Theoretical Model and Hypotheses

2.1. Theoretical Model

Transaction cost theory posits that enterprises, when engaging in market transactions, aim to minimize their transaction costs [35,36]. These costs include those for search, negotiation, enforcement, and opportunity. To enhance operational efficiency and competitiveness, enterprises typically opt to internalize transaction costs. Concurrently, low-carbon supply networks can be promoted by adopting and utilizing a variety of digital technologies during the digital transformation process to greatly lower the external transaction costs within supply chains. For example, big data analytics and blockchain technology can optimize supply chain management processes, improve resource allocation efficiency, and reduce waste and energy consumption, thereby lowering the carbon footprint of supply chains [37]. Similarly, artificial intelligence can optimize logistics routes and transportation arrangements and reduce transportation mileage and fuel consumption, achieving reductions in carbon emissions [38]. Therefore, enterprises must balance internal and external transaction costs when making strategic decisions. In this paper, we employ the newsvendor model to investigate optimal decision-making issues concerning carbon emission trading between two enterprises in the supply chain.
Within a stringent environmental regulatory framework, both the government and society have imposed higher standards for corporate environmental responsibility. While pursuing economic benefits, enterprises must also earnestly fulfill their environmental responsibilities to meet societal expectations for sustainable development. In this context, enterprises not only consider production efficiency and profitability as key metrics but also incorporate carbon emission management into their strategic planning. In a supply chain consisting of a downstream enterprise A and an upstream supplier B, all parties collaborate closely, using digital technologies to reduce carbon emissions and lower emission costs through quota trading, with the goal of maximizing their mutual interests. A, being energy-intensive and producing high emissions, faces significant pressure due to stringent government environmental regulations. To reduce its carbon emissions and alleviate pressure, A decides to adjust its output by enhancing its production technology and equipment. As the upstream supplier of A, B is under pressure from A to reduce its carbon emissions in addition to ensuring product quality and production efficiency. Government regulations mandate that companies operate within allocated carbon emission quotas, and any excess must be offset by purchasing additional quotas from the carbon emission trading market. Meanwhile, A and B begin utilizing digital technologies to optimize their production processes and enhance supply chain management, employing data analytics and predictive models to manage their carbon emissions effectively.

2.1.1. Assumptions and Basic Settings

The fundamental assumptions of the model are as follows:
(1) In the context of carbon emission trading between A and B, carbon emissions are valid only for the current period, without carrying over to subsequent periods or being transferred from preceding periods.
(2) Carbon emissions are proportional to the volume of production. The total carbon emissions C of A are assumed to be linearly related to its production volume q. Specifically, C = c u q , where c u denotes the carbon emissions per unit of product.
(3) A must strictly adhere to the environmental regulations imposed by the government during the production process. If the carbon emissions of A exceed the stipulated emission cap c t , it must purchase additional carbon emission quotas ( c u q c t ) from B. Notably, B can always meet the demand of A for additional carbon emission quotas.
In addition, the following additional variables are defined: F ( · ) and f ( · ) represent the output and density functions of downstream enterprises. p denotes the market price of carbon emission allowances, which is the unit price at which the allowances are traded. c f is the unit quota operating cost, representing the expense of managing each unit of the carbon emission quota. p c represents the trading price of carbon emission rights, indicating the cost of buying or selling these allowances. t ( Δ ) refers to the external transaction costs of enterprise digital transformation, covering the additional expenses incurred during the integration of digital technologies. Δ denotes enterprise digital transformation. π i is the profit function for enterprises.
The symbols and definitions employed in the theoretical analysis section are presented in Table 1.

2.1.2. Game-Theoretic Analysis

By conducting a game-theoretic analysis, we should be able to identify the optimal strategies for the profit functions of downstream enterprise A and upstream supplier B in the context of digital transformation, thereby clarifying digital transformation’s impact on the low-carbon effect of supply chains.
Considering that variations in q affect its carbon emissions, the profit function of A is expressed by Equation (1):
π 1 = p 0 q ( 1 F ( x ) ) d x c q ( 1 + t ( Δ ) ) q < c t c u p 0 q ( 1 F ( x ) ) d x c q ( 1 + t ( Δ ) ) p c ( c u q c t ) ( 1 + t ( Δ ) ) q c t c u
Taking the first derivative of π 1 , the critical points that are obtained are q 1 = F 1 p c ( 1 + t ( Δ ) p and q 2 = F 1 p c ( 1 + t ( Δ ) ) c u p c ( 1 + t ( Δ ) ) p .
When q < c t c u , the value of q * can be 0, c t c u , or q 1 . If q * = 0 , as q * 0 , we have lim q 0 π 1 q = p c ( 1 + t ( Δ ) ) > 0 . Thus, π 1 is monotonically increasing and not at a maximum, implying q * 0 . If q 1 < c t c u , π 1 has a maximum at q * = q 1 . Conversely, if q 1 c t c u , π 1 achieves a maximum at q * = c t c u . Therefore, when q < c t c u , q * = m i n q 1 , c t c u .
When q c t c u , the value of q * can be c t c u or q 2 . If q 2 < c t c u , π 1 attains a maximum at c t c u . If q 2 c t c u , π 1 achieves a maximum at q 2 . Therefore, when q c t c u , q * = m a x q 2 , c t c u .
Consequently, the optimal production volume q * for A can be summarized as Equation (2):
q * = q 1 q 1 < c t c u c t c u q 2 < c t c u < q 1 q 2 q 2 > c t c u
The profit function of B, defined as the revenue obtained from providing additional carbon emission allowances to A, can be expressed as Equation (3):
π 2 = ( p c c f ) ( c u q c t ) ( 1 + t ( Δ ) )
From Equation (3), it is evident that when q < c t c u , π 2 < 0 , indicating that suppliers cannot generate a profit. Conversely, when q c t c u , π 2 > 0 , suppliers can make a profit. Thus, an optimal carbon emission trading price p c * exists, which must satisfy Equation (4):
p c * c f , p c ( 1 + t ( Δ ) ) p F c t c u c u ( 1 + t ( Δ ) )
Since the value of π 2 depends on c u q c t , the optimal strategy of the model requires q c t c u , with the optimal production quantity q * for the profit function being q 2 . By taking the second derivative of π 2 with respect to p c , we obtain Equation (5):
2 π 2 p c 2 = c u 2 ( 1 + t ( Δ ) ) p f ( q * ) × 2 + ( p c c f ) ( 1 + t ( Δ ) ) × c u f ( q * ) p f 2 ( q * )
The hazard rate function of this model is R ( x ) = f ( x ) 1 F ( x ) . Given that this hazard rate function is non-decreasing, it is evident that an optimal p c * exists to maximize π 2 (Equation (6)).
f ( q * ) f 2 ( q * ) 1 1 F ( q * ) > 2 p c u ( p c c f ) ( 1 + t ( Δ ) )
By setting π 2 p c = 0 , we get p c = p f ( q * ) ( c u q * c t ) c u 2 ( 1 + t ( Δ ) ) + c f , q * = F 1 p c ( 1 + t ( Δ ) ) c u p c ( 1 + t ( Δ ) ) p . Since π 2 p c p c = c f > 0 and π 2 p c p c = p c ( 1 + t ( Δ ) ) p F ( c t c u ) c u ( 1 + t ( Δ ) ) < 0 , it is clear that p c * = p f ( q * ) ( c u q * c t ) c u 2 ( 1 + t ( Δ ) ) + c f represents the optimal emission price.
In summary, when q * = F 1 p c ( 1 + t ( Δ ) ) c u p c ( 1 + t ( Δ ) ) p and p c * = p f ( q * ) ( c u q * c t ) c u 2 ( 1 + t ( Δ ) ) + c f , π 1 * (Equation (7)) and π 2 * (Equation (8)) reach Nash equilibrium, enabling both A and B to maximize their profits.
π 1 * = p 0 q * ( 1 F ( x ) ) d x c q * ( 1 + t ( Δ ) ) p c * ( c u q * c t ) ( 1 + t ( Δ ) )
π 2 * = ( p c * c f ) ( c u q * c t ) ( 1 + t ( Δ ) )

2.1.3. Theoretical Model Results

Considering the optimal profit functions for the downstream enterprise A and upstream supplier B, it is evident that π 1 * > 0 and π 2 * > 0 , with q * > c t c u . Taking the first derivative of π 1 * with respect to Δ , we obtain:
π 1 * Δ = c q * + p c * ( c u q * c t ) × t ( Δ ) Δ > 0
Taking the first derivative of π 2 * with respect to Δ , we obtain:
π 2 * Δ = ( p c * c f ) ( c u q * c t ) × t ( Δ ) Δ < 0
For the entire supply chain, let π = π 1 * + π 2 * . Taking the first derivative of π with respect to Δ , we obtain:
π Δ = c f ( c t c f ) c q * × t ( Δ ) Δ > 0
From Equations (9)–(11), it can be deduced that digital transformation is positively correlated with the profit function of downstream enterprises. As the degree of digitalization increases, the overall profit of the downstream enterprises also rises. Conversely, it is negatively correlated with the profit function of its upstream supplier, indicating that the upstream supplier’s profit from selling additional carbon quotas to downstream enterprises decreases with increasing digital transformation. Across the entire supply chain, enterprise digital transformation is positively correlated with the overall profit function. Therefore, we put forward H1:
H1. 
Enhancing the level of enterprise digital transformation can decrease the carbon emission intensity of suppliers, thereby demonstrating low-carbon effects throughout the supply chain.

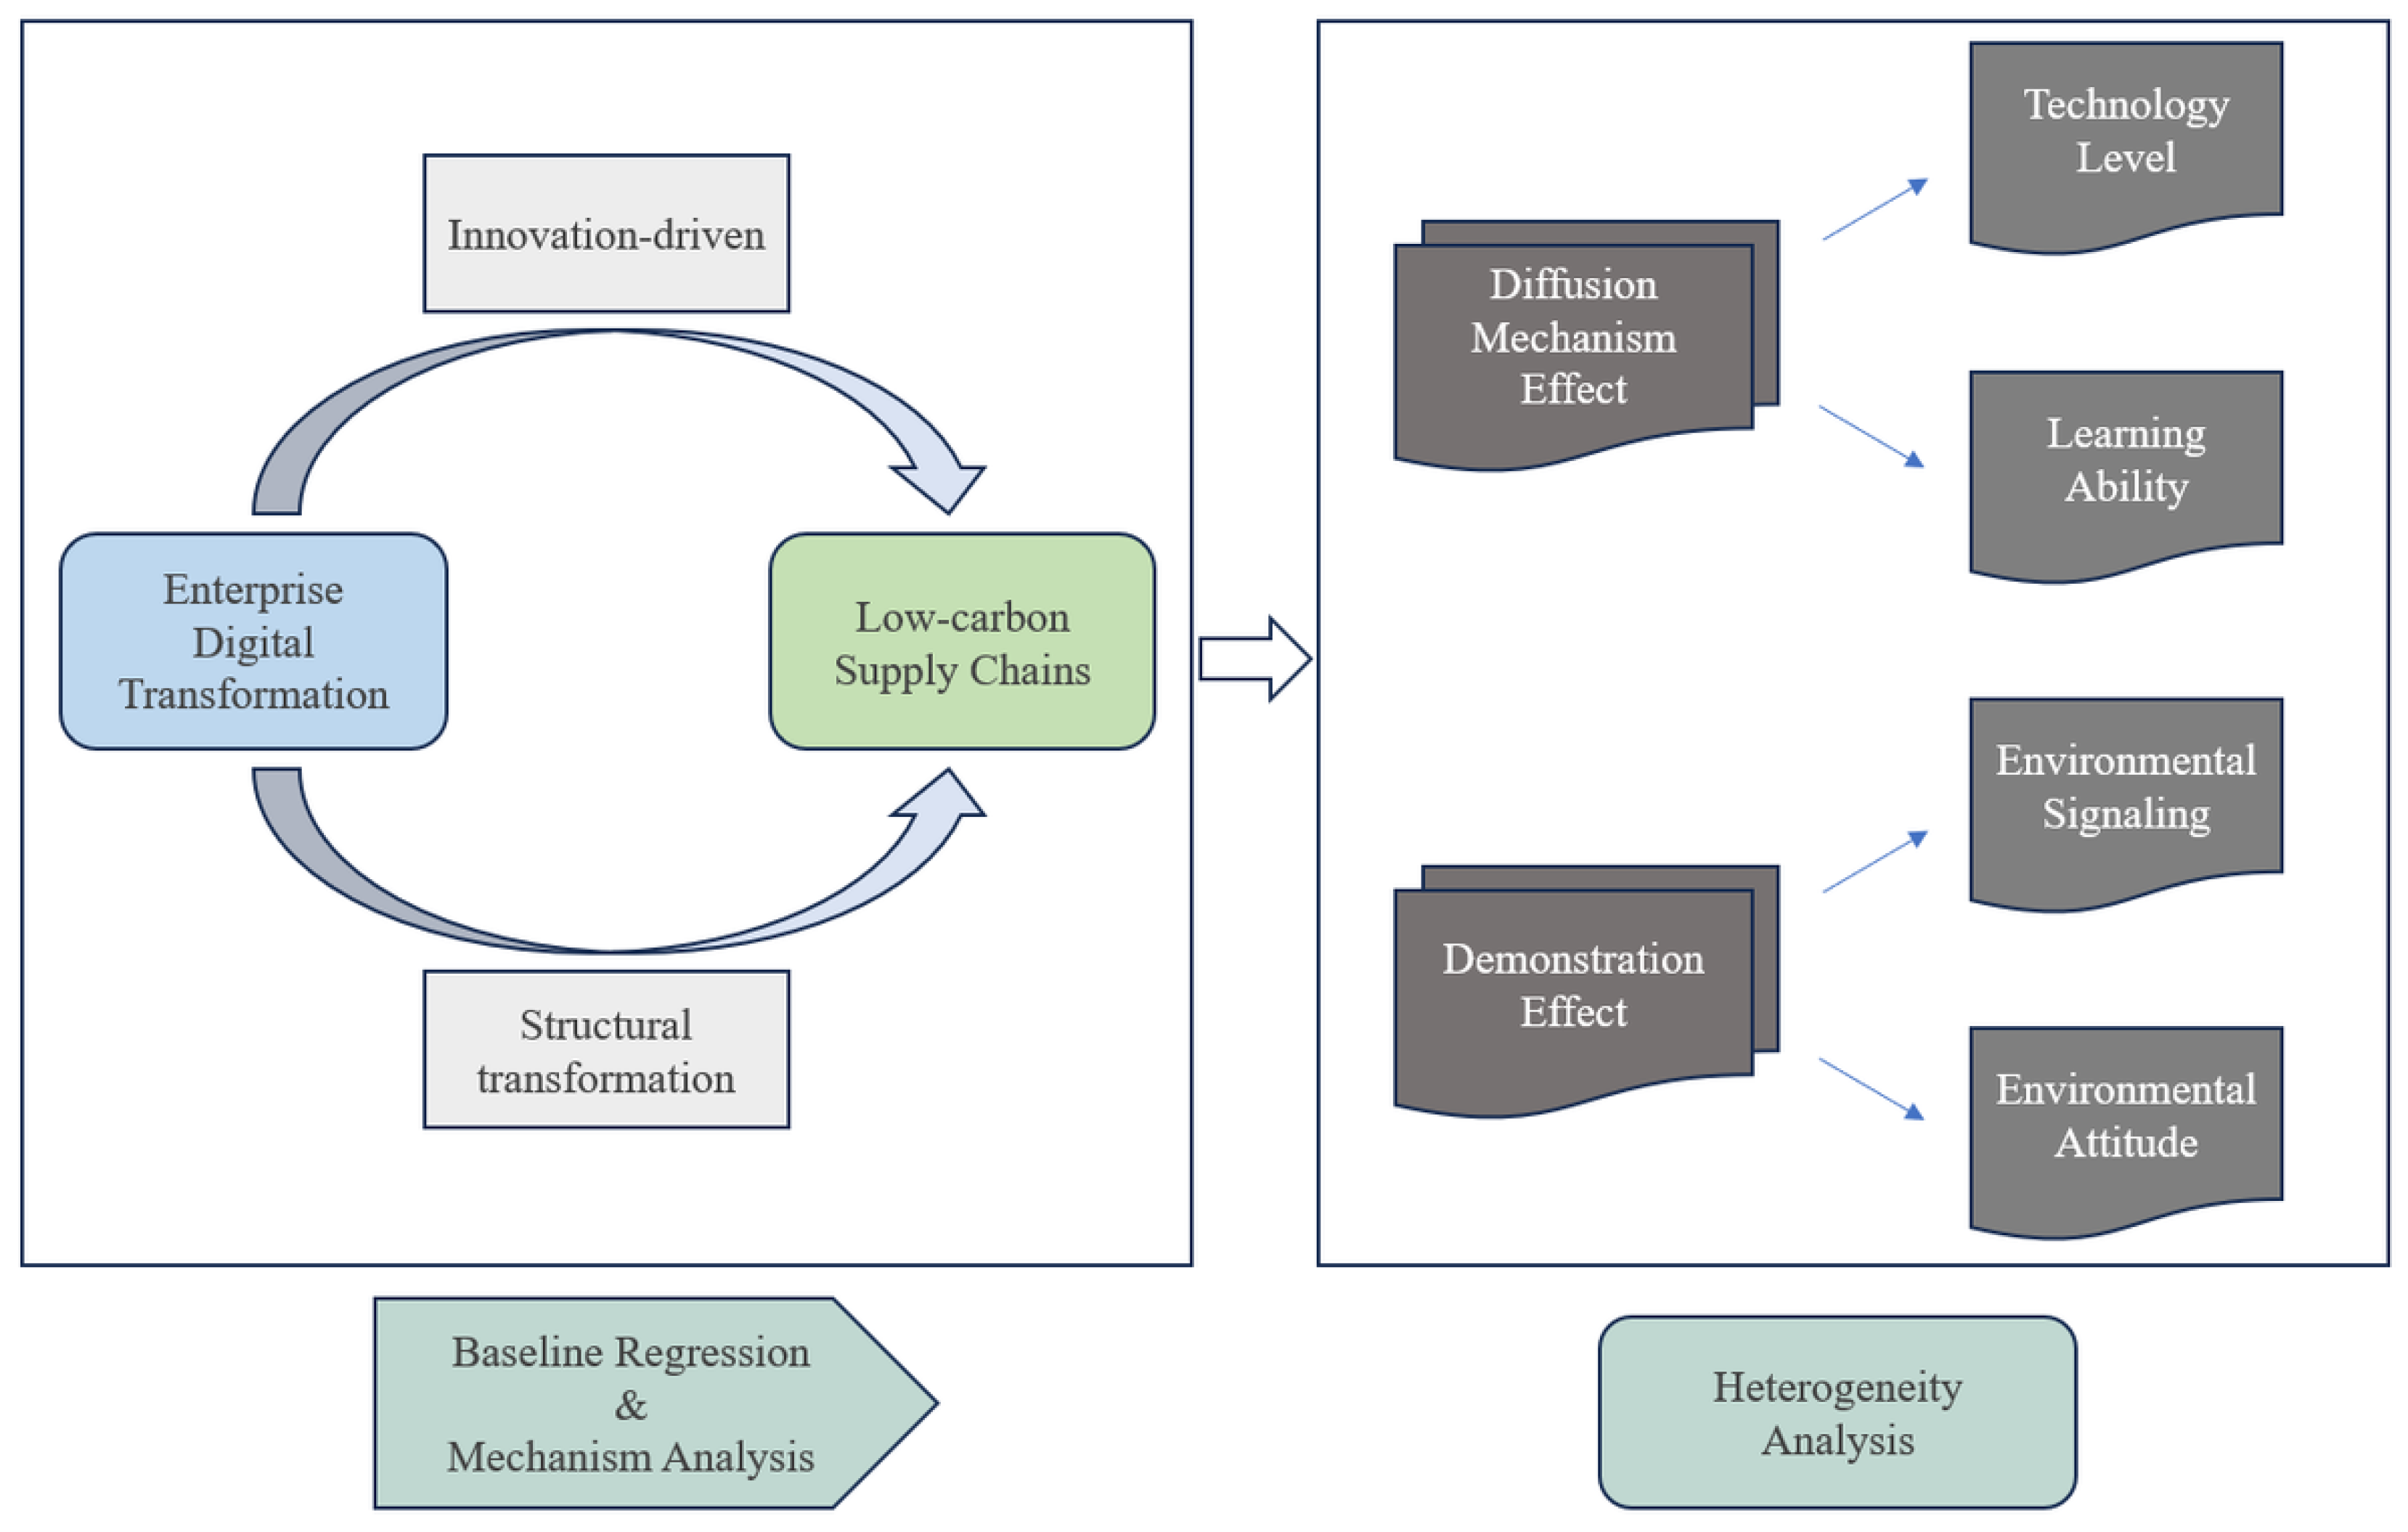
2.2. Innovation-Driven and Structural Transformation

To achieve a digital transformation that effectively reduces the carbon emission intensity of supply chains, enterprises must focus on enhancing green innovation and optimizing resource allocation efficiency [39,40]. By utilizing artificial intelligence and sophisticated data analytics, enterprises can precisely manage and optimize supply chains, including reducing their energy consumption, optimizing transportation routes, and improving resource utilization efficiency in production processes, thereby effectively lowering carbon emissions. Furthermore, digital transformation facilitates information sharing and collaborative efficiency between enterprises and their supply chain partners, enhancing their overall coordination and performance. Through real-time data exchanges and collaborative efforts, unnecessary steps and resource waste can be effectively minimized, further advancing the supply chain’s low-carbon development. Therefore, if digital transformation can decrease the low-carbon effect of supply chains, its specific mechanisms can be categorized into “innovation-driven” and “structural transformation” channels.
During digital transformation, enterprises can effectively reduce supply chain carbon emissions through “innovation-driven” mechanisms. In this process, some downstream enterprises choose to innovate by acquiring advanced green emission reduction technologies [41]. Through the diffusion mechanism, upstream suppliers start to imitate and learn relevant expertise and technologies in order to reduce their own carbon emissions, thereby promoting the dissemination of green technology throughout the entire supply chain [42,43].
Enterprises can also effectively reduce supply chain carbon emissions through “structural transformation” mechanisms during digital transformation. Downstream firms can redesign products to reduce resource consumption and lower carbon emissions [44]. Simultaneously, they can actively seek cooperation with green suppliers to replace traditional high-carbon suppliers. Through green cooperation and resource sharing with upstream suppliers, carbon emissions can be collectively reduced [45,46].Therefore, we put forward H2:
H2. 
Enterprise digital transformation reduces the carbon emission intensity of supply chains through “innovation-driven” and “structural transformation” mechanisms.

2.3. The Diffusion Mechanism and Demonstration Effects

If digital transformation can effectively the lower carbon emission intensity of supply chains, it is essential to explore the potential variations influenced by different factors. C C I C E D explored the development pathways of supply chains in its 2022–2023 policy research report, highlighting the synergy between reducing carbon emissions, curbing pollution, and fostering green growth. In 2024, C A I C T released the “Research Report on Green Development Pathways for Key Industries’ Industrial Chains and Supply Chains”, which outlines strategies for leveraging demonstration effects to advance green and low-carbon transformations across industries. In this context, relevant studies also indicate that implementing low-carbon and environmental protection measures in supply chain management involves both diffusion mechanism effects and demonstration effects [47,48].
The diffusion mechanism effect refers to the gradual spread of low-carbon and environmental protection measures from one enterprise to others in the supply chain [49,50], driven by factors such as technology transfer and learning mechanisms. When downstream enterprises possess advanced green technology, upstream suppliers may be incentivized to adopt similar measures to sustain their cooperative relationships. Additionally, upstream suppliers may learn from the successful experiences of downstream enterprises, gradually enhancing their own green standards to meet market and environmental protection demands. When upstream suppliers have strong learning capabilities, they can adopt innovations and practices from downstream enterprises, helping maintain their competitiveness. Moreover, upstream suppliers may proactively collaborate with downstream enterprises by learning and applying new technologies, jointly advancing the environmentally friendly and responsible growth of supply chains.
The demonstration effect refers to a situation where an enterprise in a supply chain adopts advanced management practices and, through its experience and influence, encourages other enterprises or organizations within the supply chain to follow suit [51,52]. When downstream enterprises emit stronger environmental signals, upstream suppliers not only actively respond by exploring or adopting more environmentally friendly production technologies to meet market demand but also increase their willingness to cooperate, thereby enhancing the low-carbon effect of supply chains. In addition, when upstream suppliers show a more proactive environmental attitude, it can stimulate environmental investments and the technological upgrade of downstream enterprises, thus pushing the entire supply chain in an environmentally friendly and sustainable direction.Therefore, we put forward H3 and H4:
H3. 
The stronger the diffusion mechanism effect between enterprises and suppliers, the greater the likelihood that digital transformation will drive carbon reduction in supply chains.
H4. 
The higher the level of the demonstration effect between enterprises and suppliers, the greater the likelihood that digital transformation will drive carbon reduction in supply chains.

3. Data and Model Settings

3.1. Data

In this paper, data on enterprise digital transformation were obtained from annual reports published on the Juchao Information Network, while supply chain and control variable data were sourced from the C S M A R and the C N R D S .
By cross-referencing data, we obtained the names and basic details of the top five customers and suppliers of listed companies on the Shanghai and Shenzhen stock markets from 2011 to 2021. Matching these details with the names disclosed in financial statements, we compiled 2570 annual datasets, each containing upstream suppliers, downstream enterprises, and the corresponding year [53,54]. For example, in 2021, supplier A might be linked to several clients X, Y, and Z, resulting in observation values such as A-X-2021, A-Y-2021, and A-Z-2021. The data filtering process involved (1) excluding observations with key missing variables; (2) removing ST and *ST enterprises; (3) omitting samples from the financial industry; (4) discarding companies that did not disclose the names of their suppliers and customers for a year; (5) applying 1% winsorization to the control variables.

3.2. Model Setting

3.2.1. Regression Mode

We use a multiple linear regression model to study how enterprise digital transformation affects the low-carbon effect of supply chains. As shown in Equation (12), the model includes fixed effects and accounts for clustering at both the year and firm levels:
C E E i , j = α 0 + α 1 D i g i t a l i , t + α 2 X i , t + Y e a r i + F i r m i + ε i , t
Specifically, C E E denotes the carbon emission intensity of upstream suppliers, D i g i t a l represents the degree of the digital transformation of downstream enterprises, and X includes the control variables utilized in this paper. Y e a r and F i r m refer to the fixed effects of the year and firm, respectively, while ε represents the random disturbance term. The indices i and t denote firms and years, respectively. The parameter α 1 is the primary coefficient in this model. A positive α 1 suggests that the D i g i t a l of downstream enterprises increases the C E E of upstream suppliers, whereas a negative α 1 indicates a reduction in the C E E of upstream suppliers.

3.2.2. A Further Test Model

To further examine the effect of D i g i t a l on C E E , this paper constructs a moderation effect model (Equation (13)) from both mechanistic and heterogeneous perspectives:
C E E i , j = α 0 + α 1 D i g i t a l i , t + α 2 K + α 3 K × D i g i t a l i , t + α 4 X i , t + Y e a r i + F i r m i + ε i , t
In this regard, the moderation effect model includes a moderating variable K that may influence the relationship between D i g i t a l and the C E E of supply chains. The variable K includes mechanism variables reflecting “innovation-driven” and “structural transformation” mechanisms, as well as heterogeneous variables reflecting diffusion mechanism effects and demonstration effects. Further analysis will focus on the coefficient α 3 of the interaction term ( K × D i g i t a l ) to assess how K moderates this relationship. A positive α 3 indicates that K diminishes the impact of D i g i t a l on C E E , whereas a negative α 3 indicates the opposite effect.

3.3. Variable Determination and Interpretation

3.3.1. Carbon Emission Intensity

The core independent variable is the carbon emission intensity ( C E E ) . Understanding the C E E of listed companies is crucial for assessing their carbon footprints and managing high-carbon emission segments within their supply chains. Therefore, the effective measurement of carbon emission intensity has become an important component of corporate sustainable development strategies. Currently, the carbon emission data of listed companies mainly come from voluntary disclosures by enterprises. Given the potential for falsification, we measure C E E using the logarithm of their corporate revenue ( R e v ) divided by the logarithm of their total carbon emissions ( E t o t a l ) (Equation (14)).
C E E = R e v E t o t a l
Equation (15) provides the E t o t a l calculation formula. E c o m b u s t i o n represents emissions from combustion and fugitive sources. E p r o d u c t i o n represents emissions from production processes. E w a s t e represents emissions from waste, including emissions from the incineration of solid waste and wastewater treatment. E l a n d _ u s e represents emissions from changes in land use.
E t o t a l = E c o m b u s t i o n + E p r o d u c t i o n + E w a s t e + E l a n d _ u s e

3.3.2. Enterprise Digital Transformation

The core dependent variable is enterprise digital transformation ( D i g i t a l ) . Digital transformation is not only crucial for enterprises to sustain their competitiveness in a fiercely competitive market environment but also an important pathway to achieve long-term sustainable development. Increasingly, publicly listed companies mention terms such as digitalization, intelligence, and networking in their annual reports. The frequency of these terms’ appearance can reflect the importance enterprises place on digital transformation. To measure the level of digital transformation, we undertook the following steps: First, we collected annual reports from 5331 listed companies on the Shanghai and Shenzhen Stock Exchanges for the years 2011 to 2021, with a focus on the MD&A sections. We organized these texts into panel data and measured the length of the full reports, including both the Chinese and English sections. Next, we developed a digital transformation terminology dictionary, which included 76 terms from across five dimensions (Figure 2). Using the jieba library in Python 3.10.7, we processed the text, removed stop words, and counted the frequency of these terms. Finally, we quantified the level of D i g i t a l using the logarithm of these terms’ occurrences [55,56].

3.3.3. Control Variables

We have selected control variables that may affect the digital transformation of downstream enterprises and upstream suppliers’ carbon emission intensity [57]:
  • The control variables that influence the digital transformation of downstream enterprises include the following: (1) Firm Size ( S i z e ) : the logarithm of a firm’s annual total assets, indicating its resource allocation and management capability. (2) Return on Equity ( R O E ) : the ratio of net profit to average shareholder equity, reflecting profitability and investment potential. (3) Leverage ( L e v ) : the ratio of total liabilities to year-end total assets, indicating financial stability and debt capacity. (4) Cash Holdings ( C a s h ) : the proportion of cash flow relative to assets, reflecting liquidity and financial health. (5) Ownership Nature ( S O E ) : assigned a value of 1 for state-owned enterprises and 0 otherwise, capturing the influences of policy and management. (6) Return on Assets ( R O A ) : the proportion of profit to average assets, indicating asset utilization efficiency. (7) Market-to-Book Ratio ( B M ) : the ratio of book value to total market value, indicating the market assessment of future development potential. (8) CEO–Chair Duality ( D u a l ) : assigned a value of 1 if the chairman and CEO are the same person, and 0 otherwise, affecting decision-making efficiency. (9) Tobin’s Q ( T o b i n Q ) : the proportion of market value to the replacement cost of company assets, reflecting long-term planning and technology investment decisions.
  • The control variables that influence the carbon emission intensity of upstream suppliers include the following: (1) Board Size ( B o a r d ) : the number of board members, expressed as a natural logarithm, affecting decision-making efficiency and governance quality. (2) Independent Director Ratio ( I n d e p ) : the ratio of independent directors to total directors, reflecting board independence and governance transparency. (3) Top Shareholder’s Ownership Ratio ( T o p 1 ) : the ratio of shares held by the largest shareholder to the total shares outstanding, indicating the ownership structure and its influence on strategic decisions. (4) Top Ten Shareholders’ Ownership Ratio ( T o p 10 ) : the ratio of shares held by the top ten shareholders to the total shares outstanding, reflecting a broader ownership structure and governance model, influencing long-term environmental policy execution.

3.3.4. Moderating Variables

The moderating variables in this paper include those that reflect both "innovation-driven” and “structural transformation” mechanisms, as well as variables that capture the heterogeneity of diffusion mechanism effects and demonstration effects.
  • Mechanism variables: (1) Innovation-driven. In this paper, we use the level of green innovation technology of enterprises to measure innovation-driven effects ( L C U ) . Based on patent classification numbers and using the WIPO green patent list, we filter out enterprises’ green patents and calculate the number of green utility model patent applications. The logarithm of the number of green utility model patent applications, after adding 1, is used to measure the green innovation technology level of enterprises. (2) Structural transformation. The structural transformation of enterprises ( T F P ) is measured by their total factor productivity. Structural transformation typically refers to the shift of resources from low-efficiency sectors or activities to more efficient areas, and the improvement in T F P can reflect the productivity gains brought about by this shift. Therefore, we employ the Olley–Pakes ( O P ) method to measure enterprises’ total factor productivity (Equations (16) and (17)). In Equation (16), Y represents the sales revenue; L denotes the labor input, measured by the number of employees; K stands for capital input, which is measured by the book value of fixed assets; and M is the intermediate input, calculated as the sales revenue minus depreciation, labor compensation, net production taxes, and operating surplus. A g e indicates the ages of the enterprises. Y e a r , P r o v , and I n d denote time, region, and industry fixed effects, respectively, while ε is the residual term. Both L C U and T F P are used to explore how enterprise digital transformation can effectively promote the low-carbon effect of supply chains through “innovation-driven” and “structural transformation” mechanisms.
    ln Y i , t = β 0 + β k ln K i , t + β t ln L i , t + β m ln M i , t + β a A g e i , t + ε i , t + m δ m Y e a r j + n λ n P r o v n + k γ k I n d k
    TFP i t = ln Y i β k ln K i t β l ln L i t .
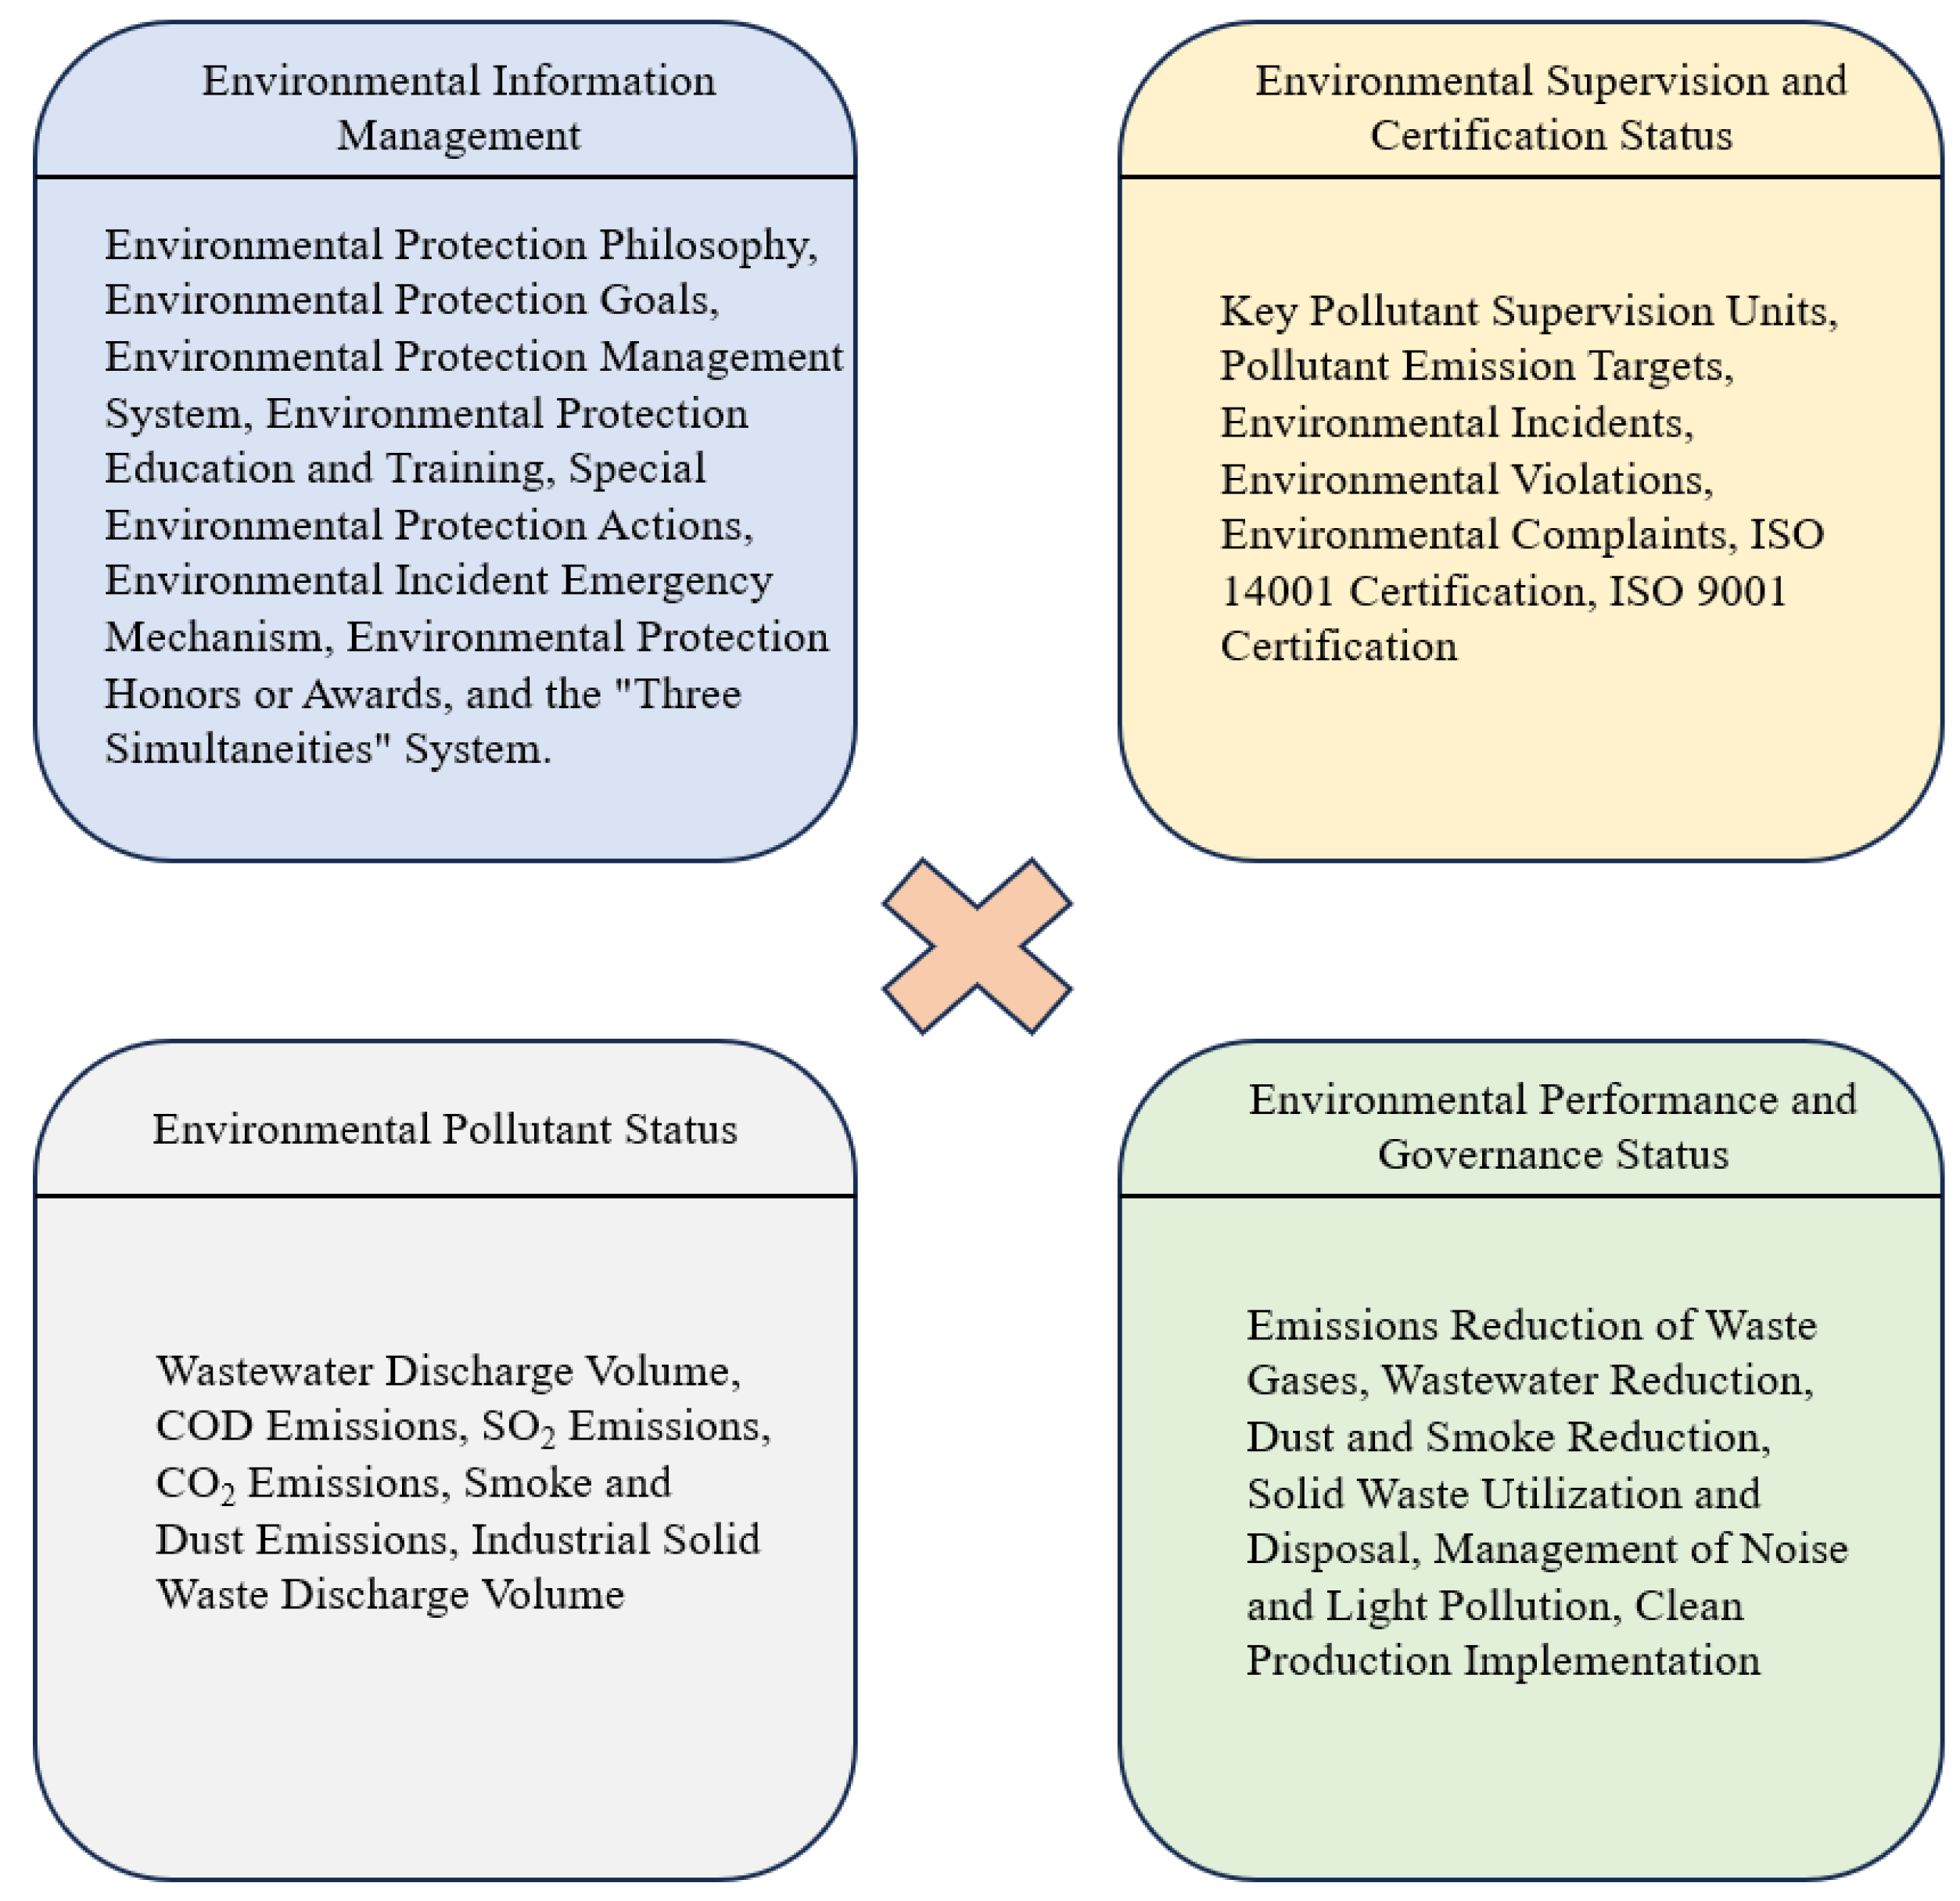
  • We have also identified a number of heterogeneity variables. (1) Green technology level ( G T I ) : assessed based on the aggregate number of green patent filings, with enterprises in the top 5% assigned a value of 1, and 0 otherwise. (2) Non-green technology level ( N G T I ) : assessed based on the aggregate number of non-green patent filings, with firms in the top 5% assigned a value of 1, and 0 otherwise. (3) Degree of Enterprise rejuvenation ( N E W ) : determined by taking the reciprocal of the time span between the current year and the year the company was listed. (4) Technological level ( H i g h T e c h ) : a binary variable representing the enterprises’ classification in the high-tech sector, where enterprises in the high-tech industry are coded as 1 and all others as 0. (5) Enterprise information disclosure level ( E P S ) : quantified by whether the enterprise disclosed environmental information in its annual or social responsibility report, with a value of 1 if disclosed, and 0 otherwise. (6) CEO green background ( G P B ) : based on the CEO’s education and experience, with a value of 1 if the CEO has green education or project experience, and 0 otherwise. (7) Enterprise environmental score ( E P W ) : measured by scoring enterprises in terms of four environmental aspects and using the logarithm of the total score (Figure 3). (8) CEO green environmental awareness ( G S E N ) : calculated using the logarithm of the word frequency related to green awareness in the CEO’s annual reports [58]. Among these, G T I , N G T I , N E W , and H i g h T e c h are used to examine the impact of diffusion mechanism effects, while E P S , G P B , E P W , and G S E N are used to examine the impact of demonstration effects.

3.4. Descriptive Statistical Analysis

In Table 2, we effectively summarize key data features, facilitating a rapid comprehension of the data’s distribution patterns and forming a basis for decision-making and further analysis.
Among these variables, the mean of C E E is 1.7850, with a median of 1.7782, indicating a right-skewed distribution ranging from 1.5170 to 2.6815 and a variance of 0.1287. While some enterprises exhibit higher or lower carbon emissions, the majority have emissions within a relatively narrow range. Similarly, D i g i t a l shows a right-skewed distribution, ranging from 0 to 6.1633, with a variance of 1.3294, indicating significant differences.
The table below provides the descriptive statistics of the remaining variables. However, determining whether D i g i t a l can effectively reduce C E E requires further analysis.

4. Results

4.1. Baseline Regression

To explore the impact of D i g i t a l on the C E E of supply chains, we conducted a baseline regression test, as shown in Table 3. Column (1) includes only the dependent variable and fixed effects, column (2) incorporates control variables related to the D i g i t a l of downstream enterprises, while column (3) adds control variables affecting both the D i g i t a l of downstream enterprises and C E E of upstream suppliers. The coefficient of D i g i t a l is significant in all cases. Economically, considering column (3) as an example, a 1 percentage point increase in D i g i t a l corresponds to a 0.0051 percentage point decrease in the C E E of upstream suppliers. This finding indicates that the enhancement of D i g i t a l will reduce the C E E of upstream suppliers, thereby promoting the low-carbon effect of supply chains and confirming Hypothesis H1.

4.2. Robustness Test

4.2.1. Substitute the Dependent and Independent Variables

To verify the robustness of our findings, tests were carried out by substituting C E E and D i g i t a l , as shown in Table 4.
  • Substituting the dependent variable: Given the extended time span of the annual dataset and significant fluctuations in corporate revenue, we remeasure C E E using the ratio of the logarithm of the number of employees to the logarithm of corporate carbon emissions. The test results, presented in Columns (1) and (2), show significantly negative coefficients at the 1% level, indicating that enterprise digital transformation enhances the low-carbon effect of supply chains.
  • Substituting the independent variable: We select 99 relevant word frequencies across four dimensions and use the logarithm of their occurrences to remeasure the level of enterprise digital transformation. The test results, presented in Columns (3) and (4), reveal significantly negative coefficients at the 1% level, consistent with our findings.

4.2.2. Exclusivity Test

This paper will use exclusivity tests from the following four aspects to assess the robustness of these findings, as shown in Table 5:
  • The low-carbon effect from suppliers may be due to their own digital transformation. To address this, the carbon emission intensity of suppliers is regressed against their D i g i t a l , and the resulting residuals are used to replace the C E E in the baseline regression. The residuals are then regressed against the D i g i t a l of downstream enterprises. The results, presented in column (1), indicate that the coefficient of D i g i t a l is −0.0054, which is significant at the 10% level.
  • The low-carbon effect observed from suppliers might be due to inherently low carbon emissions. To account for this, this analysis focuses on suppliers with a C E E above the median in the dataset. The results, presented in column (2), indicate that the coefficient of D i g i t a l is −0.0032, which is significant at the 10% level.
  • The baseline regression includes only firm and year fixed effects. Given the variability of fixed effects, the results might still vary. Therefore, we further incorporate industry fixed effects for a high-dimensional fixed effects analysis. The regression results are shown in column (3), where the coefficient of D i g i t a l is −0.0033, which is significant at the 1% level.
  • Excluding policy factors. We incorporate the smart city pilot policy variable t r e a t × p o s t in the regression. The results, presented in column (4), indicate that the coefficient of D i g i t a l is −0.0034, which is significant at the 5% level, while t r e a t × p o s t has a coefficient of −0.0048 and is not significant.
In summary, the robustness test results indicate that, even when the measurement methods of the variables are substituted or potential interfering factors are considered, the research results remain robust, demonstrating that enterprise digital transformation effectively promotes the low-carbon effect of supply chains.

4.3. Endogeneity Test

We employ the instrumental variable method and Heckman two-stage approach to address endogeneity and mitigate the influence of sample selection bias, as shown in Table 6 and detailed below:
  • Instrumental variable method: We use the product of the number of fixed telephones per 10,000 people in each prefecture-level city in 1984 and the lagged national number of internet users as an instrumental variable of enterprise digital transformation to address endogeneity [59]. The increase in fixed telephones’ density in prefecture-level cities indicates a more advanced communication infrastructure, while the lagged national number of internet users reflects the internet’s penetration. Using the interaction terms of these two factors as the instrumental variable enhances the analysis of enterprise digital transformation’s impact. Column (1) shows the results of the instrumental variable regression, where the coefficient of D i g i t a l is −0.0125 and statistically significant at the 10% level, thereby supporting the baseline regression findings.
  • Heckman two-stage approach: Given that information disclosure by listed companies regarding their suppliers and customers is voluntary, there may be sample selection bias. To address this, we employ the Heckman two-step method to correct for sample self-selection bias [60]. In the first stage, the dependent variable is whether the sample undergoes enterprise digital transformation ( d i g i _ d u m ) , with the exogenous variable of the executives’ digital background ( g m _ d i g i ) included in the Probit regression. In the second stage, I M R is added as an additional control variable to correct for potential sample self-selection bias in the regression. In the first stage of this approach, the coefficient of g m _ d i g i is 0.3632, which is significantly positive at the 1% level, indicating that listed companies with executives who have a digital background are more likely to undergo digital transformation. In the second stage, after correcting for sample self-selection bias, the coefficient of Digital is −0.0034, which still significantly negative at the 5% level, consistent with the baseline regression results.

4.4. Mechanism Test

D i g i t a l can decrease the C E E of upstream suppliers through “innovation-driven” mechanisms. The extensive application of digital technologies in supply chain management enhances operational efficiency, transparency, and flexibility [61]. Nonetheless, as enterprises increasingly prioritize the low-carbon effect of supply chains, traditional supply chain management models often fail to meet this demand effectively. In this context, “innovation-driven” mechanisms emerge as a pivotal factor in advancing the low-carbon effect of the supply chain amid enterprise digital transformation [62].
To investigate how D i g i t a l decreases the C E E in supply chains through an “innovation-driven” mechanism, the regression equation includes an interaction term ( D i g i t a l × L C U ) between D i g i t a l and L C U . Columns (1) and (2) of Table 7 present the test results. Column (1) controls only for fixed effects, while column (2) includes relevant control variables. The coefficients of D i g i t a l × L C U in both columns are significantly positive, indicating that the improvement in enterprise digitalization enhances the level of green innovation, which in turn helps to reduce the carbon emission intensity of suppliers. Thus, enterprise digital transformation can reduce the carbon emission intensity of upstream suppliers through “innovation-driven” mechanisms.
D i g i t a l can decrease the C E E of upstream suppliers through “structural transformation” mechanisms. “Structural transformation” includes restructuring organizational frameworks, optimizing business processes, and expanding partnerships to adapt to evolving market environments and achieve strategic objectives [63]. To enhance the low-carbon effect of supply chains, enterprises undergoing digital transformation must reassess their supply chain’s structure, optimizing supplier selection, production processes, and logistics distribution to minimize carbon emissions and achieve optimal resource utilization [64].
Therefore, we include the interaction term ( D i g i t a l × T F P ) between D i g i t a l and T F P to explore how D i g i t a l decreases the C E E in supply chains through the mechanism of “structural transformation”. Columns (3) and (4) of Table 7 present the test results. Column (3) controls only for fixed effects, while column (4) includes relevant control variables. The coefficients of D i g i t a l × T F P in both columns are both significantly positive, indicating that the improvement in enterprise digitalization can enhance total factor productivity, thereby reducing the carbon emission intensity of supply chains. Thus, enterprise digital transformation can alleviate the carbon emission intensity of upstream suppliers through “structural transformation” mechanisms.
In summary, D i g i t a l can reduce the C E E of upstream suppliers through “innovation-driven” and “structural transformation” mechanisms. Hence, Hypothesis H2 is confirmed.

4.5. Heterogeneity Test

4.5.1. The Heterogeneity of the Diffusion Mechanism Effect

We investigate the heterogeneity of the diffusion mechanism effect from two perspectives: the green technology level of downstream enterprises and the learning ability of upstream suppliers. The test results are presented in Table 8.
Typically, upstream suppliers tend to adopt low-carbon emission reduction technologies more readily from downstream enterprises that possess advanced green technology. Accordingly, we employ dummy variables for the green technology level ( G T I ) and non-green technology level ( N G T I ) in this analysis. D i g i t a l × G T I and D i g i t a l × N G T I are included in the regression equation to verify the impact of the green technology level on the diffusion mechanism effect. Table 8 displays the test results in terms of downstream enterprises’ green technology level in columns (1) and (2). The D i g i t a l × G T I coefficient is −0.0002, which is significantly negative at the 5% level. The coefficient of D i g i t a l × N G T I is −0.0001, which is not significant. These findings indicate that the promotion of the low-carbon effect in supply chains by enterprise digital transformation is influenced by the diffusion effect of the green technology level. Specifically, a higher green technology level in downstream enterprises is associated with a greater reduction in carbon emissions among upstream suppliers, leading to a more pronounced low-carbon effect in supply chains.
Furthermore, the learning ability of upstream suppliers also affects their carbon emissions. Suppliers with stronger learning abilities exhibit a more robust diffusion mechanism effect, making them more inclined to adopt low-carbon emission reduction technologies from downstream enterprises. Consequently, this paper employs the degree of enterprise rejuvenation ( N E W ) and technological level ( H i g h T e c h ) for this analysis. D i g i t a l × N E W and D i g i t a l × H i g h T e c h are included in the regression equation to verify the impact of suppliers’ learning ability on the diffusion mechanism effect. Table 8 displays the test results for the learning ability from upstream suppliers in columns (3) and (4). The D i g i t a l × N E W coefficient is −0.0002, which is significantly negative at the 10% level. The coefficient of D i g i t a l × H i g h T e c h is −0.0035, indicating a significantly negative value at the 5% level. These findings suggest that the effectiveness of enterprise digital transformation in enhancing the low-carbon effect in supply chains depends on the learning ability of suppliers. The greater the learning ability of upstream suppliers, the more pronounced the low-carbon impact in supply chains.
In summary, a stronger diffusion mechanism effect between downstream enterprises and upstream suppliers increases the likelihood that enterprise digital transformation will enhance the low-carbon emission reduction in supply chains, thus confirming Hypothesis H3.

4.5.2. The Heterogeneity of the Demonstration Effect

We investigate the heterogeneity of the demonstration effect from two perspectives: the environmental signals of downstream enterprises and the environmental attitudes of upstream suppliers. The test results are presented in Table 9.
Enhancing the environmental signals of downstream enterprises offers upstream suppliers more opportunities to participate in environmental projects, thereby promoting sustainable supply chain development. To assess the possible demonstration effect of enterprises’ environmental signals, this paper employs dummy variables for the enterprise information disclosure level ( E P S ) and CEO’s green background ( G P B ) . D i g i t a l × E P S and D i g i t a l × G P B are included in the regression equation to verify the impact of downstream enterprises’ environmental signals on the demonstration effect. Table 9 displays the test results for downstream enterprises’ environmental signals in columns (1) and (2). The D i g i t a l × E P S coefficient is −0.0098, which is significantly negative at the 5% level. The coefficient of D i g i t a l × G P B is −0.0053, indicating a significantly negative value at the 10% level. These results indicate that the promotion of the low-carbon effect in supply chains by enterprise digital transformation is influenced by the demonstration effect of enterprises’ environmental signals. The stronger the environmental signals from downstream enterprises, the more likely upstream suppliers are to implement emission reduction measures, thus strengthening the low-carbon effect within supply chains.
Additionally, the more positive the environmental attitudes of upstream suppliers, the more willing they are to respond to the environmental measures proposed by downstream enterprises. This paper employs the enterprise environmental score ( E P W ) and CEO’s green environmental awareness ( G S E N ) to test the possible demonstration effect of upstream suppliers’ environmental signals. D i g i t a l × E P W and D i g i t a l × G S E N are included in the regression equation to verify the impact of upstream suppliers’ environmental attitudes on the demonstration effect. Table 9 displays the test results for the environmental attitudes from upstream suppliers in columns (3) and (4). The D i g i t a l × E P W coefficient is −0.0051, which is significantly negative at the 10% level. The coefficient of D i g i t a l × G S E N is −0.0059, indicating a significantly negative value at the 5% level. These findings indicate that the promotion of the low-carbon effect in supply chains by enterprise digital transformation is influenced by the demonstration effect of suppliers’ environmental attitudes. The better the environmental attitude of upstream suppliers, the more they can promote the low-carbon effect in supply chains.
In summary, the higher the level of the demonstration effect between downstream enterprises and upstream suppliers, the more likely it is that enterprise digital transformation will promote carbon reduction in supply chains, thus confirming Hypothesis H4.

5. Conclusions

5.1. Conclusions

Enterprise digital transformation is a crucial driver of supply chain modernization, intelligent management, energy conservation, and emission reductions. This paper, focusing on micro-enterprises and adopting a supply chain perspective, investigates how digital transformation influences supply chain carbon emission intensity through both theoretical and empirical research. The findings indicate that enhancing the degree of enterprise digital transformation can significantly decrease the carbon emission intensity of upstream suppliers, thereby promoting low-carbon supply chains. The “innovation-driven” and “structural transformation” mechanisms of digital transformation, according to our mechanism analysis, lower the carbon emission intensity of supply chains. Our heterogeneity analysis reveals that when downstream enterprises have higher levels of green technology and upstream suppliers demonstrate stronger learning capabilities, diffusion mechanisms significantly enhance the impact of enterprise digital transformation on the low-carbon effect of supply chains. Additionally, stronger environmental signals from downstream enterprises and improved environmental attitudes exhibited by upstream suppliers significantly increase the demonstration effects of enterprise digital transformation on the low-carbon effect of supply chains.

5.2. Recommendations

The following policy recommendations are presented in this paper to jointly support low-carbon emission reductions in supply chains and enterprise digital transformation:
(1) Promote green management in the supply chain and vigorously develop the digital economy.
This paper finds that enterprise digital transformation enhances the low-carbon impact of supply chains and reduces the carbon emission intensity of upstream suppliers through “innovation-driven” and “structural transformation” mechanisms. Consequently, the government should invest in high-speed internet and advanced telecommunications networks, especially in underserved areas, to ensure comprehensive access to essential digital tools for supply chain management. Additionally, targeted grants and tax incentives should be provided to enterprises investing in green technology research and development, with a focus on sustainable production methods and eco-friendly materials. This support will drive innovation, promote the adoption of environmentally friendly practices, and mitigate the overall environmental impact of industrial activities. The government should also establish a national platform for green technology exchange to promote technical cooperation and knowledge sharing among enterprises, thereby accelerating the dissemination of green innovations. Finally, introducing tax incentives and subsidies for enterprises that undertake significant upgrades to incorporate low-carbon technologies and sustainable practices into their operations would support their transition toward becoming environmentally friendly industries and foster sustainable economic development.
(2) Promote green technology innovation and emphasize enterprises’ learning capability.
This paper finds that the level of green technology and the learning capability of enterprises significantly enhance the impact of digital transformation on the low-carbon effect of supply chains. Therefore, the government should establish dedicated funds to support enterprises in their green technology research and innovation, encourage their participation in academic research projects, and enhance their technological and innovative capabilities. For example, a program could be created to fund and facilitate industry–university research partnerships, providing financial support for joint R&D projects and offering incentives for collaboration between universities, research institutions, and enterprises. Strengthening these collaborations will improve the integration of research with practical applications, boost enterprise learning, and accelerate technological innovation. Additionally, the government should enhance intellectual property protection, ensure a stable innovation environment, and provide legal guarantees for enterprises. To support this, a network of legal support services offering affordable or subsidized advice on intellectual property and green technology should be established.
(3) Optimize collaborative cooperation in supply chains to jointly advance digital transformation and carbon reduction efforts.
This paper indicates that clear environmental signals and positive responses from both upstream and downstream enterprises are crucial for enhancing collaborative efforts within the supply chain and amplifying the impact of digital transformation on achieving low-carbon outcomes. To support this, the government should encourage downstream enterprises to actively communicate environmental signals throughout the supply chain, establish incentive mechanisms, and prioritize collaboration and rewards for those meeting environmental standards. Additionally, the government could promote the adoption of environmental technologies among upstream suppliers through financial support and tax incentives. Concurrently, the government should implement transparent mechanisms and a comprehensive supply chain monitoring and evaluation system to improve information sharing and communication. For example, a nationwide environmental monitoring system for supply chains could be developed, utilizing big data and IoT technology to track environmental practices in real time. This system should include regular assessments and audits of environmental impacts at various stages of the supply chain to ensure compliance with environmental standards.

Author Contributions

Conceptualization, Z.L.; methodology, Z.L.; data curation, Z.L.; writing—original draft preparation, Z.L.; writing—review and editing, N.G. and M.L. All authors have read and agreed to the published version of the manuscript.

Funding

This research was funded by the Major Project of the National Social Science Fund of China (23&ZD036); the General Project of the National Natural Science Foundation of China (62375133); and the Industry-University-Research Cooperation Project of Jiangsu Province (BY20230589).

Institutional Review Board Statement

Not applicable.

Informed Consent Statement

Informed consent was obtained from all subjects involved in the study.

Data Availability Statement

The data related to supply chains were sourced from the China Securities Market & Accounting Research Database ( C S M A R ) : https://data.csmar.com/ (accessed on 10 March 2024), and the control variables’ data were obtained from the China Research Data Service Platform ( C N R D S ) : https://www.cnrds.com/(accessed on 10 March 2024).

Conflicts of Interest

The authors declare no conflicts of interest.

References

  1. Pettit, T.J.; Croxton, K.L.; Fiksel, J. The evolution of resilience in supply chain management: A retrospective on ensuring supply chain resilience. J. Bus. Logist. 2019, 40, 56–65. [Google Scholar] [CrossRef]
  2. Negri, M.; Cagno, E.; Colicchia, C.; Sarkis, J. Integrating sustainability and resilience in the supply chain: A systematic literature review and a research agenda. Bus. Strategy Environ. 2021, 30, 2858–2886. [Google Scholar] [CrossRef]
  3. Sobb, T.; Turnbull, B.; Moustafa, N. Supply chain 4.0: A survey of cyber security challenges, solutions and future directions. Electronics 2020, 9, 1864. [Google Scholar] [CrossRef]
  4. Zhao, N.; Hong, J.; Lau, K.H. Impact of supply chain digitalization on supply chain resilience and performance: A multi-mediation model. Int. J. Prod. Econ. 2023, 259, 108817. [Google Scholar] [CrossRef]
  5. Chowdhury, M.M.H.; Quaddus, M. Supply chain readiness, response and recovery for resilience. Supply Chain. Manag. Int. 2016, 21, 709–731. [Google Scholar] [CrossRef]
  6. Kang, K.; Zhao, Y.; Zhang, J.; Qiang, C. Evolutionary game theoretic analysis on low-carbon strategy for supply chain enterprises. J. Clean. Prod. 2019, 230, 981–994. [Google Scholar] [CrossRef]
  7. Du, S.; Hu, L.; Wang, L. Low-carbon supply policies and supply chain performance with carbon concerned demand. Ann. Oper. 2017, 255, 569–590. [Google Scholar] [CrossRef]
  8. Sarkis, J.; Zhu, Q.; Lai, K.-H. An organizational theoretic review of green supply chain management literature. Int. J. Prod. Econ. 2011, 130, 1–15. [Google Scholar] [CrossRef]
  9. Abbasi, S.; Choukolaei, H.A. A systematic review of green supply chain network design literature focusing on carbon policy. Decis. Anal. J. 2023, 6, 100189. [Google Scholar] [CrossRef]
  10. Abdallah, A.B.; Al-Ghwayeen, W.S. Green supply chain management and business performance: The mediating roles of environmental and operational performances. Bus. Process Manag. J. 2020, 26, 489–512. [Google Scholar] [CrossRef]
  11. Westerman, G.; Bonnet, D.; McAfee, A. Leading Digital: Turning Technology into Business Transformation; Harvard Business Press: Boston, MA, USA, 2014. [Google Scholar]
  12. Kane, G. Strategy, Not Technology, Drives Digital Transformation; MIT Sloan Management Review and Deloitte University Press: Westlake, TX, USA, 2015. [Google Scholar]
  13. Ross, J.; Beath, C.; Sebastian, I.M. How to Develop a Great Digital Strategy; MIT Sloan Management Review: Cambridge, MA, USA, 2016. [Google Scholar]
  14. ElMassah, S.; Mohieldin, M. Digital transformation and localizing the sustainable development goals (sdgs). Ecol. Econ. 2020, 169, 106490. [Google Scholar] [CrossRef]
  15. Li, Y.; Yang, X.; Ran, Q.; Wu, H.; Irfan, M.; Ahmad, M. Energy structure, digital economy, and carbon emissions: Evidence from china. Environ. Sci. Pollut. Res. 2021, 28, 64606–664629. [Google Scholar] [CrossRef] [PubMed]
  16. Li, Z.; Wang, J. The dynamic impact of digital economy on carbon emission reduction: Evidence city-level empirical data in china. J. Clean. Prod. 2022, 351, 131570. [Google Scholar] [CrossRef]
  17. Ren, X.; Shao, Q.; Zhong, R. Nexus between green finance, non-fossil energy use, and carbon intensity: Empirical evidence from china based on a vector error correction model. J. Clean. Prod. 2020, 277, 122844. [Google Scholar] [CrossRef]
  18. Huang, Y.; Xue, L.; Khan, Z. What abates carbon emissions in china: Examining the impact of renewable energy and green investment. Sustain. Dev. 2021, 29, 823–834. [Google Scholar] [CrossRef]
  19. Zhang, W.; You, J.; Lin, W. Internet plus and china industrial system’s low-carbon development. Renew. Sustain. Energy Rev. 2021, 151, 111499. [Google Scholar] [CrossRef]
  20. Ahmad, T.; Zhang, D.; Huang, C.; Zhang, H.; Dai, N.; Song, Y.; Chen, H. Artificial intelligence in sustainable energy industry: Status quo, challenges and opportunities. J. Clean. Prod. 2021, 289, 125834. [Google Scholar] [CrossRef]
  21. Williams, E. Environmental effects of information and communications technologies. Nature 2011, 479, 354–358. [Google Scholar] [CrossRef] [PubMed]
  22. Belkhir, L.; Elmeligi, A. Assessing ict global emissions footprint: Trends to 2040 & recommendations. J. Clean. Prod. 2018, 177, 448–463. [Google Scholar]
  23. Hittinger, E.; Jaramillo, P. Internet of things: Energy boon or bane? Science 2019, 364, 326–328. [Google Scholar] [CrossRef]
  24. Hig, D.A.; Gholami, R.; Shirazi, F. Ict and environmental sustainability: A global perspective. Telemat. Informatics 2017, 34, 85–95. [Google Scholar]
  25. Cheng, Y.; Zhang, Y.; Wang, J.; Jiang, J. The impact of the urban digital economy on china’s carbon intensity: Spatial spillover and mediating effect. Resour. Conserv. Recycl. 2023, 189, 106762. [Google Scholar] [CrossRef]
  26. Chen, X.; Despeisse, M.; Johansson, B. Environmental sustainability of digitalization in manufacturing: A review. Sustainability 2020, 12, 10298. [Google Scholar] [CrossRef]
  27. Gao, D.; Yan, Z.; Zhou, X.; Mo, X. Smarter and prosperous: Digital transformation and enterprise performance. Systems 2023, 11, 329. [Google Scholar] [CrossRef]
  28. Rogers, D.L. The Digital Transformation Playbook: Rethink Your Business for the Digital Age; Columbia University Press: New York, NY, USA, 2016. [Google Scholar]
  29. Du, X.; Jiang, K. Promoting enterprise productivity: The role of digital transformation. Borsa Istanb. Rev. 2022, 22, 1165–1181. [Google Scholar] [CrossRef]
  30. Zhuo, C.; Chen, J. Can digital transformation overcome the enterprise innovation dilemma: Effect, mechanism and effective boundary. Technol. Forecast. Soc. Change 2023, 190, 122378. [Google Scholar] [CrossRef]
  31. Han, D.; Ding, Y.; Shi, Z.; He, Y. The impact of digital economy on total factor carbon productivity: The threshold effect of technology accumulation. Environ. Sci. Pollut. Res. 2022, 29, 55691–55706. [Google Scholar] [CrossRef]
  32. Hao, Y.; Guo, Y.; Wu, H. The role of information and communication technology on green total factor energy efficiency: Does environmental regulation work? Bus. Strategy Environ. 2022, 31, 403–424. [Google Scholar] [CrossRef]
  33. Faruquee, M.; Paulraj, A.; Irawan, C.A. Strategic supplier relationships and supply chain resilience: Is digital transformation that precludes trust beneficial? Int. J. Oper. Prod. 2021, 41, 1192–1219. [Google Scholar] [CrossRef]
  34. Stroumpoulis, A.; Kopanaki, E. Theoretical perspectives on sustainable supply chain management and digital transformation: A literature review and a conceptual framework. Sustainability 2022, 14, 4862. [Google Scholar] [CrossRef]
  35. Coase, R.H. The Nature of the Firm; Springer: Berlin/Heidelberg, Germany, 1995. [Google Scholar]
  36. Williamson, O.E. Transaction-cost economics: The governance of contractual relations. J. Law Econ. 1979, 22, 233–261. [Google Scholar] [CrossRef]
  37. Wang, G.; Gunasekaran, A.; Ngai, E.W.; Papadopoulos, T. Big data analytics in logistics and supply chain management: Certain investigations for research and applications. Int. J. Prod. Econ. 2016, 176, 98–110. [Google Scholar] [CrossRef]
  38. Hofmann, E.; Rüsch, M. Industry 4.0 and the current status as well as future prospects on logistics. Comput. Ind. 2017, 89, 23–34. [Google Scholar] [CrossRef]
  39. Yang, G.; Wang, F.; Deng, F.; Xiang, X. Impact of digital transformation on enterprise carbon intensity: The moderating role of digital information resources. Int. J. Environ. Res. Public Health 2023, 20, 2178. [Google Scholar] [CrossRef]
  40. Zhang, C.; Fang, J.; Ge, S.; Sun, G. Research on the impact of enterprise digital transformation on carbon emissions in the manufacturing industry. Int. Rev. Econ. Financ. 2024, 92, 211–227. [Google Scholar] [CrossRef]
  41. Greaker, M.; Rosendahl, K.E. Environmental policy with upstream pollution abatement technology firms. J. Environ. Econ. Manag. 2008, 56, 246–259. [Google Scholar] [CrossRef]
  42. Zhang, L.; Xue, L.; Zhou, Y. How do low-carbon policies promote green diffusion among alliance-based firms in china? An evolutionary-game model of complex networks. J. Clean. Prod. 2019, 210, 518–529. [Google Scholar] [CrossRef]
  43. Melander, L. Customer and supplier collaboration in green product innovation: External and internal capabilities. Bus. Strategy Environ. 2018, 27, 677–693. [Google Scholar] [CrossRef]
  44. Grant, D.B.; Wong, C.Y.; Trautrims, A. Sustainable Logistics and Supply Cchain Management: Principles and Practices for Sustainable Operations and Management; Kogan Page Publishers: New York, NY, USA, 2017. [Google Scholar]
  45. Ramanathan, U.; Bentley, Y.; Pang, G. The role of collaboration in the uk green supply chains: An exploratory study of the perspectives of suppliers, logistics and retailers. J. Clean. Prod. 2014, 70, 231–241. [Google Scholar] [CrossRef]
  46. Tsai, S.-B.; Wei, Y.-M.; Chen, K.-Y.; Xu, L.; Du, P.; Lee, H.-C. Evaluating green suppliers from a green environmental perspective. Environ. Plan. Plan. Des. 2016, 43, 941–959. [Google Scholar] [CrossRef]
  47. Stucki, T.; Woerter, M. Intra-firm diffusion of green energy technologies and the choice of policy instruments. J. Clean. Prod. 2016, 131, 545–560. [Google Scholar] [CrossRef]
  48. Yang, X.; Zhang, J.; Ren, S.; Ran, Q. Can the new energy demonstration city policy reduce environmental pollution? evidence from a quasi-natural experiment in china. J. Clean. Prod. 2021, 287, 125015. [Google Scholar] [CrossRef]
  49. Wang, L.; Zheng, J. Research on low-carbon diffusion considering the game among enterprises in the complex network context. J. Clean. Prod. 2019, 210, 1–11. [Google Scholar] [CrossRef]
  50. Shi, Y.; Wei, Z.; Shahbaz, M.; Zeng, Y. Exploring the dynamics of low-carbon technology diffusion among enterprises: An evolutionary game model on a two-level heterogeneous social network. Energy Econ. 2021, 101, 105399. [Google Scholar] [CrossRef]
  51. Jiang, X.; Zhang, X.; Xia, Y. Peer effect on low-carbon practices of firms along the value chain: Evidence from china. Energy Econ. 2023, 127, 107102. [Google Scholar] [CrossRef]
  52. Ju, Y.; Hou, H.; Cheng, Y.; Feng, Y. Assessing the impact of government-led green supply chain demonstration on firms’ financial distress: The role of environmental information disclosure quality and supply chain concentration. J. Clean. Prod. 2024, 440, 140786. [Google Scholar] [CrossRef]
  53. Isaksson, O.H.; Simeth, M.; Seifert, R.W. Knowledge spillovers in the supply chain: Evidence from the high tech sectors. Res. Policy 2016, 45, 699–706. [Google Scholar] [CrossRef]
  54. Chu, Y.; Tian, X.; Wang, W. Corporate innovation along the supply chain. Manag. Sci. 2019, 65, 2445–2466. [Google Scholar] [CrossRef]
  55. Gao, J.; Xu, N.; Zhou, J. Does digital transformation contribute to corporate carbon emissions reduction? empirical evidence from china. Sustainability 2023, 15, 13414. [Google Scholar] [CrossRef]
  56. Long, Y.; Liu, L.; Yang, B. The effects of enterprise digital transformation on low-carbon urban development: Empirical evidence from china. Technol. Forecast. Soc. Chang. 2024, 201, 123259. [Google Scholar] [CrossRef]
  57. Zhong, W.; Ma, Z.; Tong, T.W.; Zhang, Y.; Xie, L. Customer concentration, executive attention, and firm search behavior. Acad. Manag. 2021, 64, 1625–1647. [Google Scholar] [CrossRef]
  58. Duriau, V.J.; Reger, R.K.; Pfarrer, M.D. A content analysis of the content analysis literature in organization studies: Research themes, data sources, and methodological refinements. Organ. Res. 2007, 10, 5–34. [Google Scholar] [CrossRef]
  59. Nunn, N.; Qian, N. Us food aid and civil conflict. Am. Rev. 2014, 104, 1630–1666. [Google Scholar] [CrossRef]
  60. Bendig, D.; Hoke, J. Correcting Selection Bias in Innovation and Entrepreneurship Research: A Practical Guide to Applying the Heckman Two-Stage Estimation. 2022. Available online: https://papers.ssrn.com/sol3/papers.cfm?abstract_id=4105207 (accessed on 28 August 2024).
  61. Hartley, J.L.; Sawaya, W.J. Tortoise, not the hare: Digital transformation of supply chain business processes. Bus. Horizons 2019, 62, 707–715. [Google Scholar] [CrossRef]
  62. Jabbour, C.J.C.; Neto, A.S.; Gobbo, J.A., Jr.; de Souza Ribeiro, M.; Jabbour, S. Eco-innovations in more sustainable supply chains for a low-carbon economy: A multiple case study of human critical success factors in brazilian leading companies. Int. J. Prod. 2015, 164, 245–257. [Google Scholar] [CrossRef]
  63. Herrendorf, B.; Rogerson, R.; Valentinyi, A. Growth and structural transformation. Handb. Econ. Growth 2014, 2, 855–941. [Google Scholar]
  64. Xing, X.; Ye, A. Consumption upgrading and industrial structural change: A general equilibrium analysis and empirical test with low-carbon green transition constraints. Sustainability 2022, 14, 13645. [Google Scholar] [CrossRef]
Figure 1. The framework of the paper.
Sustainability 16 08242 g001
Figure 2. Word frequency across five dimensions.
Sustainability 16 08242 g002
Figure 3. Measurement indicators of enterprises’ environmental score.
Sustainability 16 08242 g003
Table 1. Symbols and definitions.
SymbolDefinition
qDownstream enterprise output
F ( · ) , f ( · ) Output and density functions of downstream enterprises
cUnit product cost of downstream enterprises
CTotal carbon emissions from downstream enterprises
pMarket price of the product
c u Carbon emissions incurred by the enterprises per unit of production
c t Carbon emission cap for downstream enterprises
c f Unit quota operating cost
p c Carbon emission rights trading price
t ( Δ ) External transaction costs of enterprise digital transformation
Δ Enterprise digital transformation
π i Profit function
Table 2. Descriptive statistical analysis.
Variables Obs Avg S.D. Minim Median Maxim
C E E 25701.78500.12871.51701.77822.6815
D i g i t a l 25701.39041.329401.09866.1633
S i z e 257023.02901.812619.277522.679328.6365
R O E 25700.07070.1391−1.72360.07571.3193
L e v 25700.49450.19980.03270.50820.9763
C a s h f l o w 25700.04600.0704−0.46300.04340.4876
S O E 25700.50540.5001011
R O A 25700.03650.0569−0.36280.03370.6553
B M 25700.70240.281500.72801.5592
D u a l 25700.20890.4067001
T o b i n Q 25701.74941.371701.349424.4953
B o a r d 25702.16600.20611.38632.19722.8904
I n d e p 257037.67976.239822.220036.360080
T O P 1 257036.050515.89314.145632.975788.5493
T O P 10 257055.638316.016912.256055.799395.5023
L C U 19760.05400.1265000.8889
T F P 1091−0.42701.0220−5.7298−0.14020.7297
G T I 19940.05010.2183001
N G T I 19940.05020.2183001
N E W 25080.06160.03080.02770.05260.5
H i g h T e c h 25080.06170.0308001
E P S 25660.25100.4336001
G P B 17460.11910.3240001
E P W 25472.57690.905102.83323.8918
G S E N 14331.37830.888901.38633.8712
Table 3. Baseline regression.
Variables(1)(2)(3)
CEECEECEE
D i g i t a l −0.0048 *−0.0045 *−0.0051 *
(0.0028)(0.0027)(0.0028)
C o n s t a n t 1.8335 ***2.0362 ***2.0520 ***
(0.0118)(0.1862)(0.1908)
D o w n _ C o n t r o l s NoYesYes
U p _ C o n t r o l s NoNoYes
F i r m F E YesYesYes
Y e a r F E YesYesYes
O b s 257025702570
R- s q u a r e 0.06340.06230.0690
Note: Robust standard errors are presented in parentheses, with ***, and * denoting significance at the 1% and 10% levels, respectively. D o w n _ C o n t r o l s and U p _ C o n t r o l s , respectively, represent the control variables affecting the downstream enterprise’s D i g i t a l and upstream supplier’s C E E .
Table 4. Substituting the dependent and independent variables.
Variables(1)(2)(3)(4)
CEECEECEECEE
D i g i t a l −0.0074 ***−0.0072 ***−0.0037 ***−0.0034 ***
(0.0032)(0.0033)(0.0033)(0.0013)
C o n s t a n t 1.8484 ***2.0486 ***0.6965 ***0.7924 ***
(0.0137)(0.1982)(0.0060)(0.0928)
D o w n _ C o n t r o l s NoYesNoYes
U p _ C o n t r o l s YesYesYesYes
F i r m F E YesYesYesYes
Y e a r F E YesYesYesYes
O b s 2545254525452545
R- s q u a r e 0.06340.06230.06900.1214
Note: Robust standard errors are presented in parentheses, with *** denoting significance at the 1% level. The controls include D o w n _ C o n t r o l s and U p _ C o n t r o l s . This is the same below.
Table 5. Exclusivity test.
Variables(1)(2)(3)(4)
CEECEECEECEE
D i g i t a l −0.0054 ***−0.0032 ***−0.0033 ***−0.0034 ***
(0.0028)(0.0019)(0.0012)(0.0028)
t r e a t × p o s t −0.0048
(0.0058)
C o n s t a n t 0.2165 ***0.7111 ***0.7967 ***0.7940 ***
(0.0920)(0.1028)(0.0866)(0.0939)
D o w n _ C o n t r o l s YesYesYesYes
U p _ C o n t r o l s YesYesYesYes
F i r m F E YesYesYesYes
Y e a r F E NoNoYesNo
O b s 2545127325662542
R- s q u a r e 0.06300.18540.87290.1212
Note: Robust standard errors are presented in parentheses, with *** denoting significance at the 1% level.
Table 6. Endogeneity test.
Variables(1)(2)(3)
CEEdigi_dumCEE
D i g i t a l −0.0125 * −0.0034 ***
(0.0068) (0.0013)
g m _ d i g i 0.3632 ***2.0520 ***
(0.0538)
C o n s t a n t 0.7567 ***−4.8270 ***0.7411 ***
(0.1299)(0.6128)(0.1200)
C o n t r o l s YesYesYes
F i r m F E YesYesYes
Y e a r F E YesYesYes
O b s 240624012401
R- s q u a r e 0.01960.09590.8684
Note: Robust standard errors are presented in parentheses, with *** and * denoting significance at the 1% and 10% levels, respectively.
Table 7. Mechanism test.
Variables(1)(2)(3)(4)
CEECEECEECEE
D i g i t a l −0.0001−0.0001−0.0037 ***−0.0034 ***
(0.0001)(0.0001)(0.0033)(0.0013)
L C U −0.0047−0.0042
(0.0043)(0.0042)
D i g i t a l × L C U 0.0009 ***0.0007 **
(0.0003)(0.0003)
T F P −0.0037−0.0145
(0.0048)(0.0095)
D i g i t a l × T F P 0.0010 **0.0012 ***
(0.0004)(0.0005)
C o n s t a n t 0.5472 ***2.0486 ***0.6965 ***0.7924 ***
(0.0032)(0.1982)(0.0060)(0.0938)
C o n t r o l s NoYesNoYes
F i r m F E YesYesYesYes
Y e a r F E YesYesYesYes
O b s 1994199410911091
R- s q u a r e 0.08580.09550.08510.1226
Note: Robust standard errors are presented in parentheses, with *** and ** denoting significance at the 1% and 5% levels, respectively.
Table 8. Heterogeneity test—diffusion mechanism effect.
Variables(1)(2)(3)(4)
CEECEECEECEE
D i g i t a l 0.00010.00010.0056 **0.0023 ***
(0.0001)(0.0001)(0.0025)(0.0009)
D i g i t a l × G T I −0.0002 **
(0.0001)
D i g i t a l × N G T I −0.0001
(0.0001)
D i g i t a l × N E W −0.0002 *
(0.0001)
D i g i t a l × T F P −0.0035 **
(0.0018)
C o n s t a n t 0.5558 ***2.0486 ***0.6965 ***0.7924 ***
(0.0741)(0.0732)(0.0503)(0.0538)
C o n t r o l s YesYesYesYes
F i r m F E YesYesYesYes
Y e a r F E YesYesYesYes
O b s 1994199425082508
R- s q u a r e 0.09240.09550.09470.0962
Note: Robust standard errors are presented in parentheses, with ***, **, and * denoting significance at the 1%, 5%, and 10% levels, respectively.
Table 9. Heterogeneity test—demonstration effect.
Variables(1)(2)(3)(4)
CEECEECEECEE
D i g i t a l 0.0107 ***0.0024 **0.0210 ***0.01873 ***
(0.0029)(0.0010)(0.0076)(0.0061)
D i g i t a l × E P S −0.0098 **
(0.0039)
D i g i t a l × G P B −0.0053 *
(0.0029)
D i g i t a l × E P W −0.0051 *
(0.0024)
D i g i t a l × G S E N −0.0059 **
(0.0033)
C o n s t a n t 1.2825 ***0.4333 ***1.2410 ***1.6876 ***
(0.2051)(0.0774)(0.2039)(0.2491)
C o n t r o l s YesYesYesYes
F i r m F E YesYesYesYes
Y e a r F E YesYesYesYes
O b s 2565174625461433
R- s q u a r e 0.11340.07560.11530.1433
Note: Robust standard errors are presented in parentheses, with ***, **, and * denoting significance at the 1%, 5%, and 10% levels, respectively.
Disclaimer/Publisher’s Note: The statements, opinions and data contained in all publications are solely those of the individual author(s) and contributor(s) and not of MDPI and/or the editor(s). MDPI and/or the editor(s) disclaim responsibility for any injury to people or property resulting from any ideas, methods, instructions or products referred to in the content.

