Article

Urban Sprawl and Imbalance between Supply and Demand of Ecosystem Services: Evidence from China’s Yangtze River Delta Urban Agglomerations

School of Business, Hohai University, Nanjing 210098, China
*
Author to whom correspondence should be addressed.
Sustainability 2024, 16(18), 8269; https://doi.org/10.3390/su16188269
Submission received: 28 June 2024 / Revised: 14 September 2024 / Accepted: 16 September 2024 / Published: 23 September 2024
(This article belongs to the Special Issue Urbanization and Environmental Sustainability—2nd Edition)

Abstract

:
The contradiction between ecological resource protection and urban sprawl in urban agglomeration areas is becoming more and more prominent, facing a serious imbalance between the supply and demand of ecosystem services. To analyze the impact of urban agglomeration expansion on regional ecosystem services, based on multi-source data, an assessment model of supply and demand of ecosystem services for water conservation, carbon sequestration, soil conservation and crop production was constructed. With the help of value transformation model and spatial analysis method, this paper explores the risk of ecosystem service supply and demand imbalance faced by the Yangtze River Delta urban agglomeration in the process of expansion. This study found that the supply capacity of ecosystem services in the YRDUA has continued to decline at the spatial pixel scale; ecosystem service value deficits are a common problem in the YRDUA, with cities around Taihu Lake, such as Shanghai and Suzhou, being the most serious; the value surplus areas are concentrated in the southern cities, such as Xuancheng and Chizhou, but the balance between the supply of and demand for ecosystem services in these cities is also facing a challenge as the cities are expanding. This study analyzed the spatial pattern changes in the Yangtze River Delta region in the context of urban sprawl from the perspective of ecosystem service supply and demand, which helps to clarify the changing ecosystem service dynamics of the region and guide the formulation of urban planning policies and to achieve a balance between ecological supply and demand as well as sustainable development.

1. Introduction

Ecosystem services are environmental conditions and utilities that natural ecosystems and their ecological processes create and maintain for human survival and are an important source of human well-being. They not only provide food, fresh water, energy, and other raw materials for production and life but also create and maintain the Earth’s life support system [1], form the environmental conditions necessary for human survival, and provide human beings with leisure, recreation, and esthetic enjoyment [2]. In the Millennium Ecosystem Assessment (MA) of the United Nations Organization, ecosystem services are defined as all the benefits that human beings derive directly or indirectly from ecosystems, including both the provision of natural resources and products and other services provided by ecosystems [3]. Ecosystem services include provisioning services (e.g., food, water resources, etc.), regulating services (e.g., climate regulation, water conservation, etc.), cultural services (e.g., recreation, esthetics, etc.), and supporting services (e.g., soil conservation, biodiversity maintenance, etc.).
There is a close interrelationship between these services, and water conservation refers to the ability of an ecosystem to maintain and regulate water resources through the interaction of vegetation, soil, and water bodies [4]. Good soil conservation can effectively prevent soil erosion and enhance water conservation capacity. The relationship between water conservation and carbon sequestration is reflected in the healthy growth of vegetation. Healthy forests and grasslands not only effectively absorb and store carbon but also enhance the structure of the soil through the root system, increasing the capacity for water conservation. The relationship between carbon sequestration and food production is equally important [5]. Healthy soils store large amounts of organic carbon, the presence of which contributes to soil fertility and water retention. Soil is the basis for food production, and good soil conservation practices can prevent soil erosion and degradation, maintain soil fertility and structure, and thus increase food production. The relationship among water conservation, soil conservation, carbon sequestration, and food production is a complex ecological network. A good ecological environment promotes water conservation, maintains soil health, and sequesters more carbon, thereby increasing food production capacity. Conversely, excessive agricultural development, deforestation, and irrational water management can lead to soil erosion, soil degradation, and carbon emissions, ultimately affecting food security and ecological balance. The relationship among water conservation, soil conservation, carbon sequestration, and food production is a complex ecological network [6].
The concept of ecosystem services emphasizes the interaction and dependence between ecosystems and human society, and the importance of ecosystems for human well-being and socio-economic development [7]. There is a close interrelationship between ecosystem services and regional development. Ecosystem services provide an important material basis and ecological support for regional development. Ecosystem services such as water conservation, soil fertility, climate regulation, and other ecosystem services provide the necessary resources and conditions for agricultural production, industrial development, urban construction, and so on, supporting regional economic development and social progress. The demand for and impact of regional development on ecosystem services are also increasing [8]. With rapid economic growth and urbanization, regional development has created an increasing demand for ecosystem services, while at the same time exerting certain pressures and impacts on ecosystems. Problems such as over-exploitation, pollution emissions, and ecological damage have put the ability to supply ecosystem services at risk, thereby affecting the sustainable development of the region.
Urban agglomerations have a high intensity of human activities and high population density, and the ecological demand for ecosystems often exceeds the ecological supply capacity of the region [9]. In the process of urban agglomeration development, ecosystem health is facing serious challenges due to the combination of two unfavorable factors: intensified ecological demand and encroachment of ecosystem land [10,11]. Therefore, research on the ecosystem services and ecological effects of urban agglomerations is necessary for the ecological protection of the region [12]. In the face of the increasingly serious ecological risks in urban agglomerations, researchers have drawn on a variety of fields, such as ecology and environment, economic geography, etc., to weigh the synergistic relationship between economic development and green ecology, and have attempted to assess the ecological status of urban agglomerations from the perspective of the ecological resources as the core ecological assets to provide advice for the subsequent formulation of scientifically sound ecological governance policies [13]. The assessment of ecological assets includes not only the assessment of ecological quality and ecological resources in urban agglomerations but also the specific positioning of ecological functional zones to form an orderly unity among the “production, living, and ecological” spaces of urban agglomerations and to achieve the rational planning and effective integration of the green and sustainable development of urban agglomerations [14,15,16].
To study the risk of imbalance between the supply and demand of regional ecosystem services in the context of urban sprawl, this study carried out the following research: (1) assess the supply of ecosystem services and value; (2) quantify the demand for regional ecosystem services and trade-off of the supply and demand of ecosystem services; (3) use a typical Chinese urban agglomeration, the Yangtze River Delta Urban Agglomeration (YRDUA), as the study area to carry out a case study, and with the help of spatial analysis methods, the spatial mismatch phenomenon of ecosystem services in the region is portrayed. This study realized a quantitative assessment at multiple scales of meta-precision, prefecture, and county, which is of great practical significance for guiding the conservation and scientific planning of urban agglomerations and alleviating the spatial imbalance of ecosystem services.

2. Materials and Methods

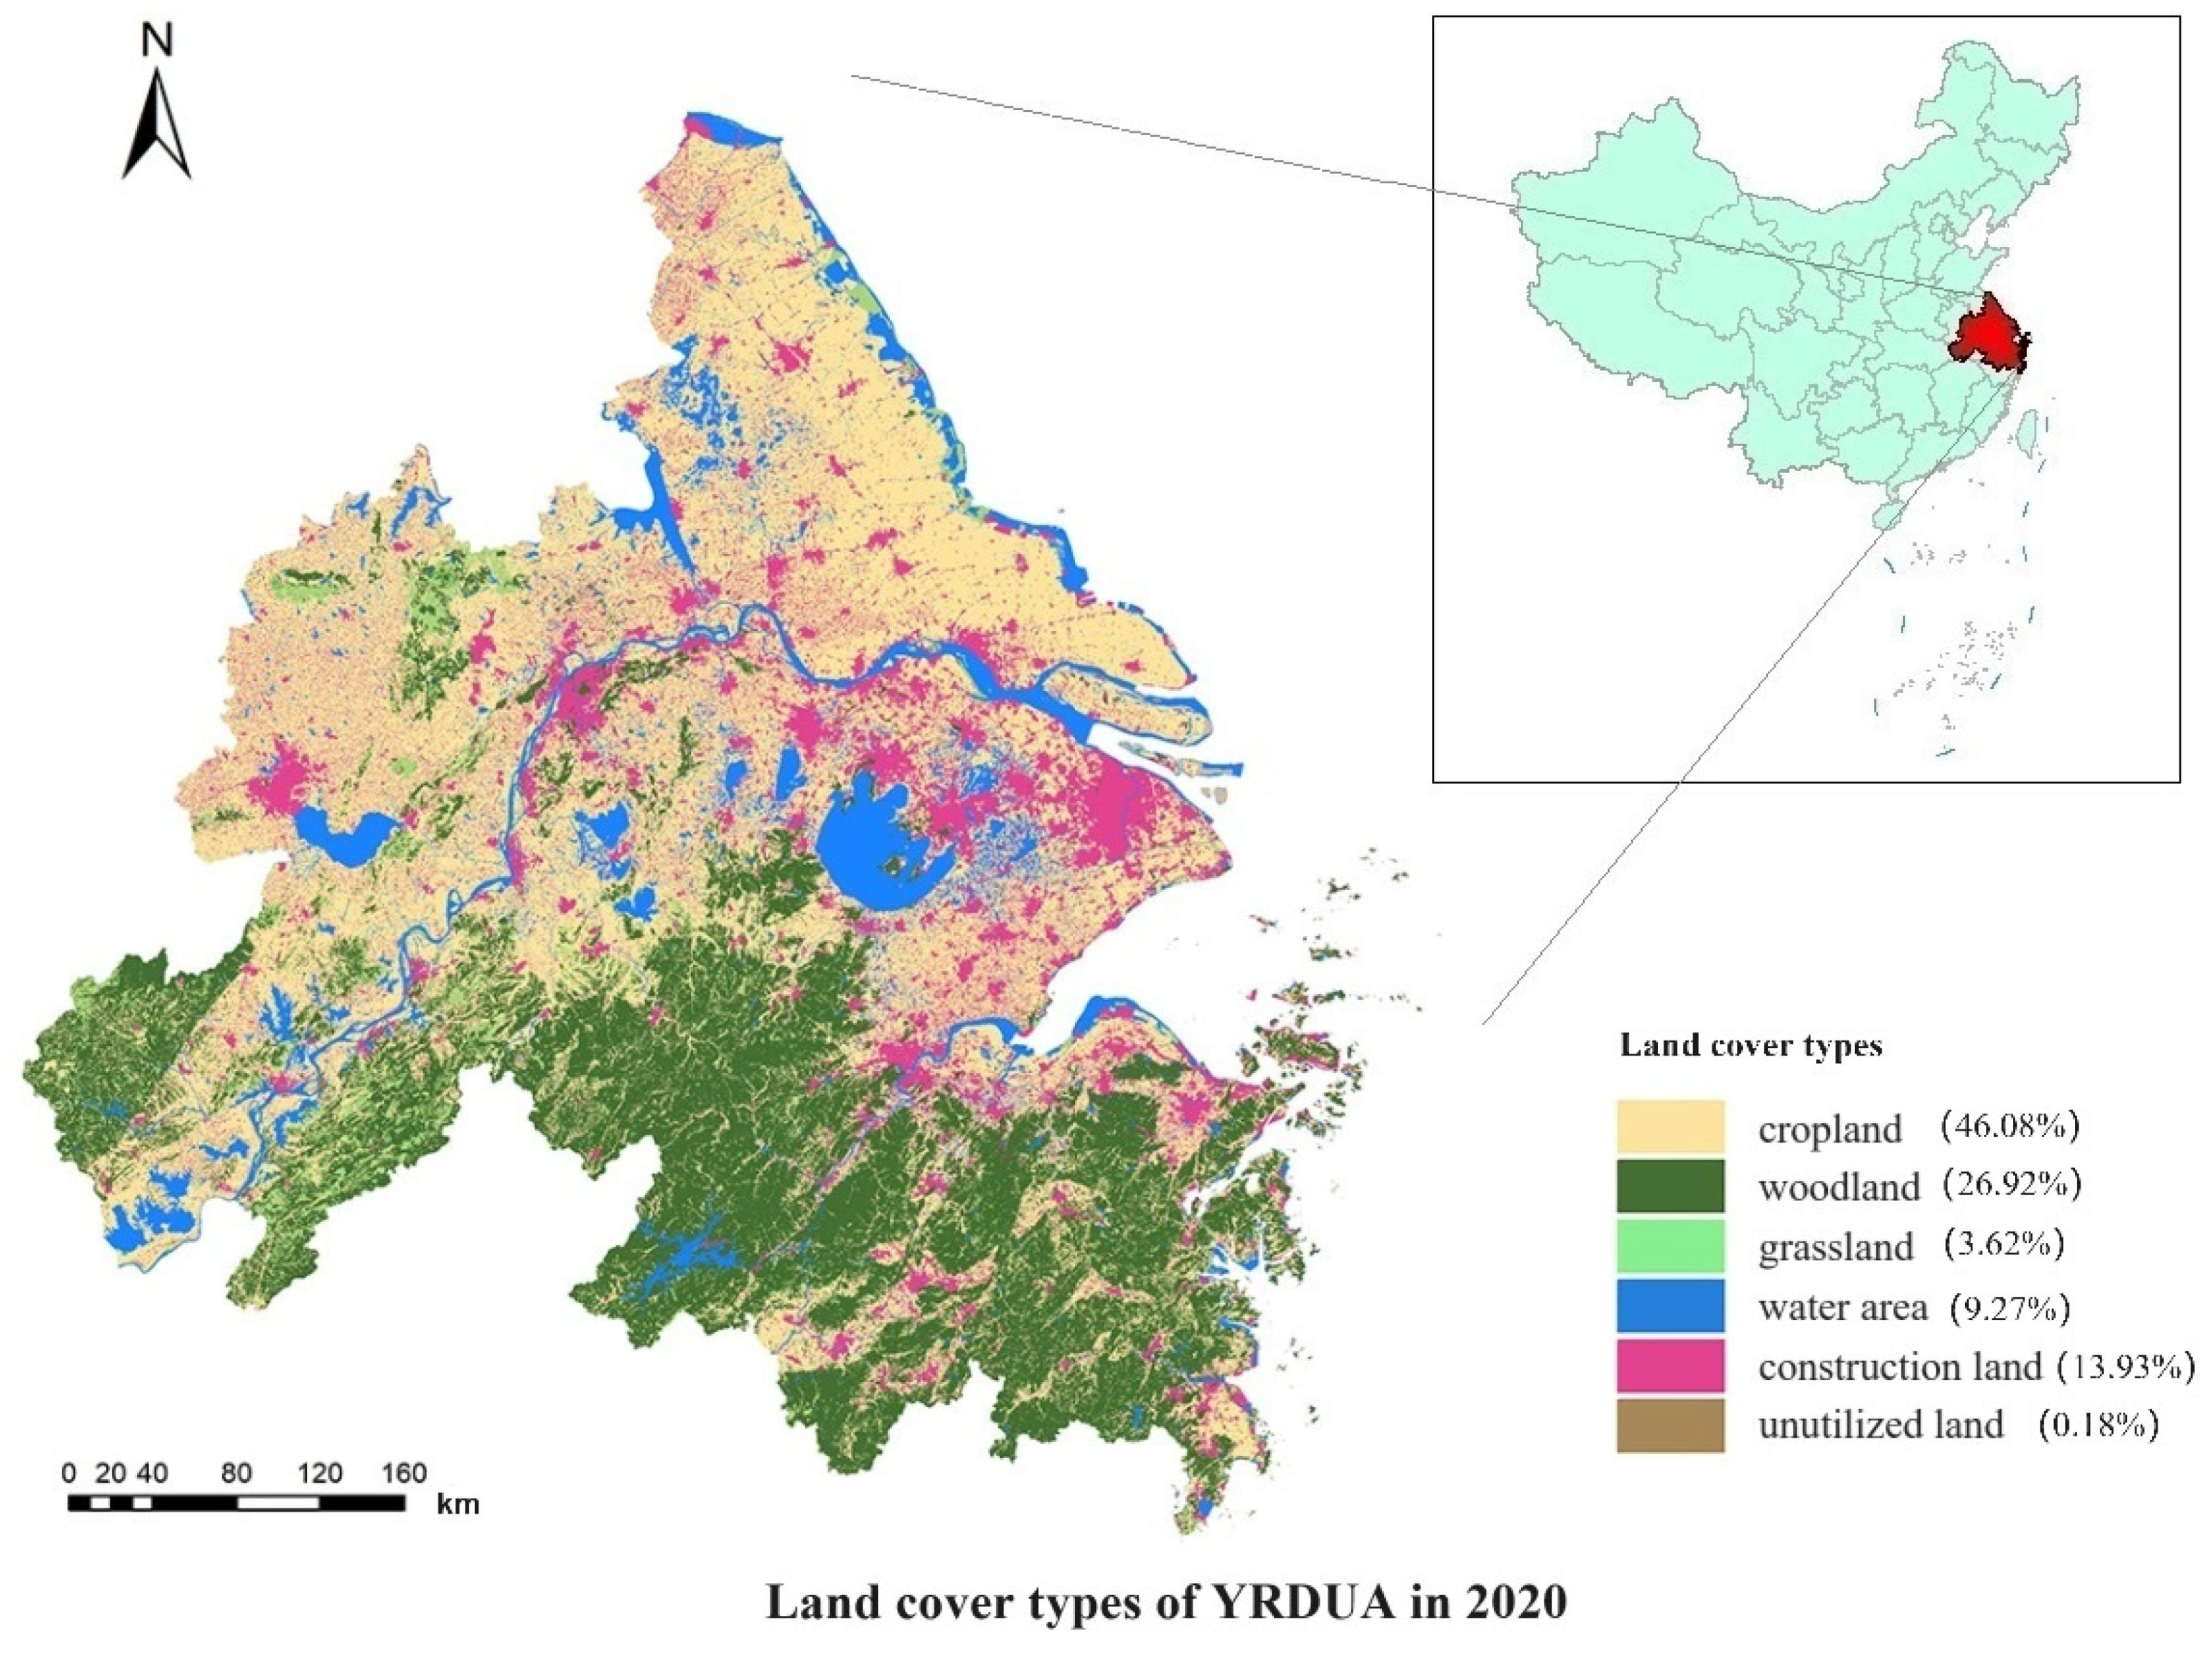
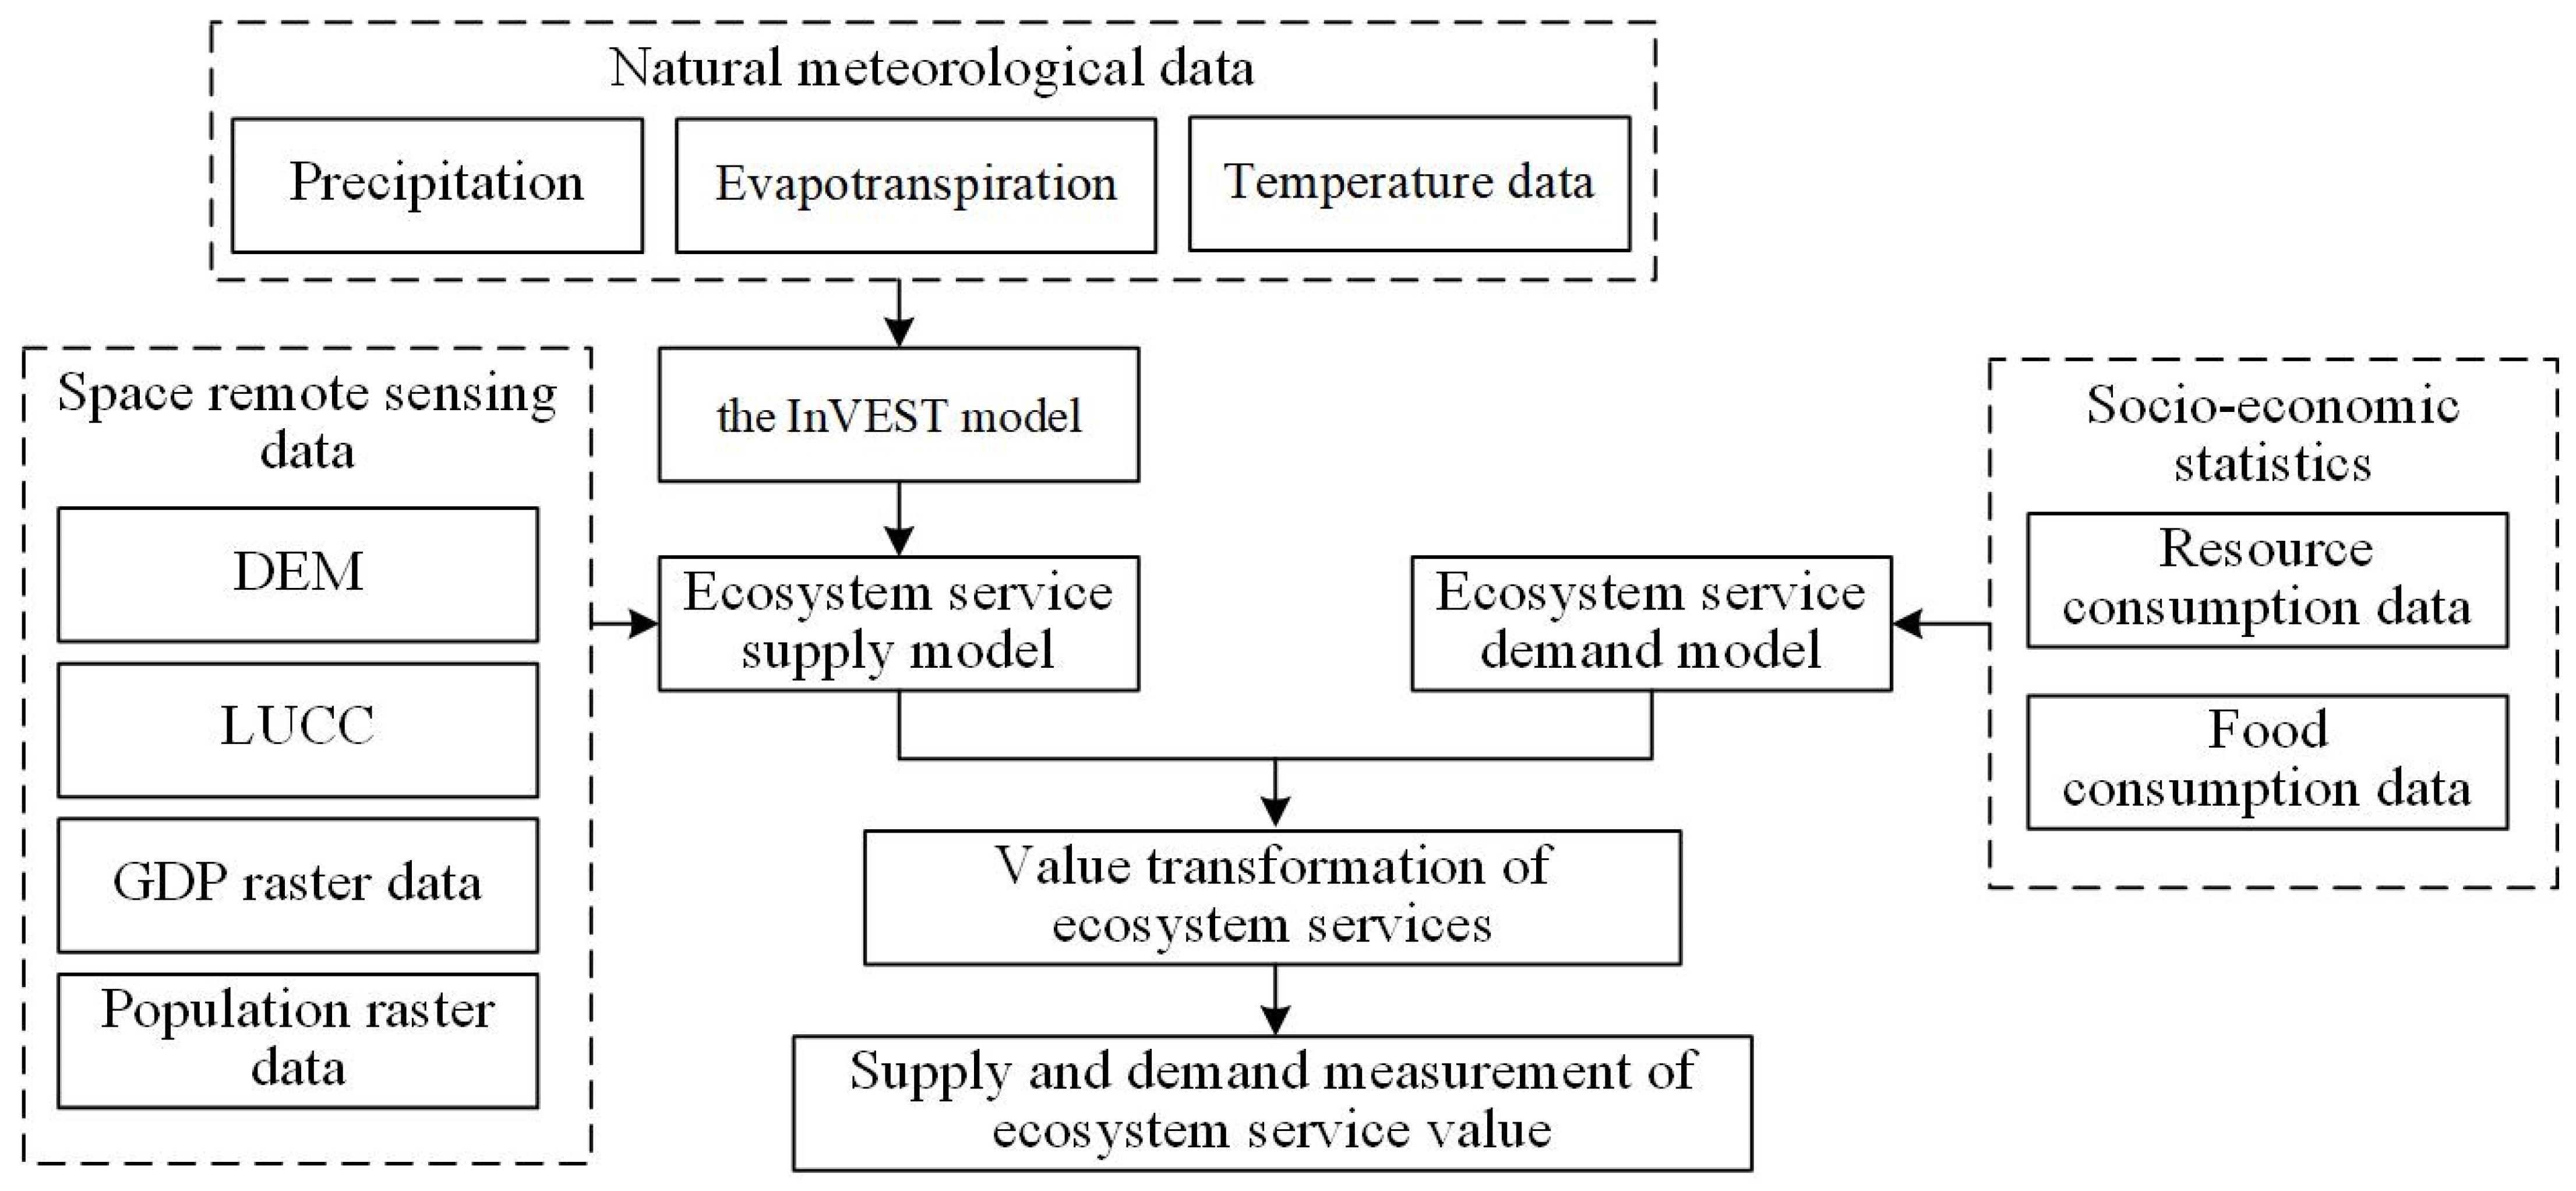
2.1. Overview of the Study Area and Data Sources

With economic growth, China has gradually formed urban clusters dominated by big cities, and the city cluster strategy is also an important economic development strategy of China. Among the clusters, the YRDUA is the highest level of urbanization in China, with an average urbanization rate of more than 60%. It has a total of 26 cities including Shanghai, Hangzhou, Suzhou, Nanjing, and other large cities. The YRDUA is one of the most developed economic regions in China, with an economic volume of more than 2.1 billion by 2020, accounting for more than 20% of China’s total economic volume. Moreover, the YRDUA has a large population. According to the seventh census data, the total resident population of the 26 cities in this region has reached 170 million. With the expansion of the cities, the sustainable development of ecosystem services in the region has gradually become an important issue for the government and society. At present, in the Yangtze River Delta city cluster development planning documents, ecological green protection is placed in an important position. In 2019, the Yangtze River Delta eco-green Integration Demonstration Zone was established.
The YRDUA is the largest urban cluster in China with typical representative characteristics, located in the eastern coastal region of China (Figure 1), covering an area of more than 210,000 square kilometers, and is situated in the lower reaches of the Yangtze River Basin, where water resources are abundant. The natural climate is mild, with an average annual temperature of 14–18 °C. Rainfall is abundant, with an annual precipitation of 1000 to 1400 mm. [15]. With a predominantly plain landscape, it possesses a large amount of arable land resources, which is suitable for the growth of crops. In addition, due to the suitable climatic, geographic, and hydrological characteristics, there are diverse biological populations in the region. Ecological wetland resources also provide a barrier to ecosystem self-repair, water conservation, and climate regulation in the region.
The data used in this research come from several data resource platforms; Table 1 shows the data sources used for this study, and Figure 2 shows the data processing. After the meteorological and remote sensing data of the YRDUA region were analyzed by hydrological analysis, the supply of ecosystem services in the region for each year was calculated according to the ecosystem service function module of the InVEST model; the demand for ecosystem services was calculated using the ecosystem service demand model constructed using the socio-economic statistics of the population, resources, etc.; and the final ecosystem service value was calculated using a value assessment model. In addition, the final value of the ecosystem services was derived from the value assessment model, which provides the basis for the subsequent research on the evolution of the supply and demand relationship.

2.2. Models of Ecosystem Service Supplies

2.2.1. Water Conservation

The calculation of the water conservation (WC) services of ecosystems is mainly based on rainfall and evapotranspiration data, which are further processed with the help of the soil flow rate, topography, and other data after completing the calculation of regional water production [17]. It is generally believed that without human interference, rainfall minus evapotranspiration is the regional water yield. In this study, the water yield module in the InVEST model was used to calculate the water yield of the unit raster in the YRDUA.

2.2.2. Carbon Sequestration

It is generally recognized that the carbon sequestration (CS) of an ecosystem consists of four carbon pools, which are the above-ground carbon pool, the below-ground carbon pool, the soil carbon pool, and the dead organic matter carbon pool. The calculation formula is as follows:
C S = C a b o v e + C b e l o w + C s o i l + C d e a d
In the above equation, C S represents the overall carbon stock in the study area, C a b o v e is the above-ground carbon stock, C b e l o w is the below-ground carbon stock, C s o i l is the soil carbon stock, and C d e a d is the dead organic matter carbon stock.

2.2.3. Soil Conservation

The modified RUSLE erosion equation was used in this study to calculate the physical soil conservation (SC):
S C = S C p o t S C a c t S C p o t = R × K × L × S S C a c t = R × K × L × S × C
where SC is the soil conservation services of the regional ecosystem, S C p o t is the potential soil loss, and S C a c t is the actual soil loss. R is the rainfall erosion factor, K is the soil erosion factor, L is the slope length factor, S is the slope gradient factor, C is the vegetation cover and management factor, and P is the soil and water conservation measure factors.

2.2.4. Crop Production

Panek E et al. [18] found a linear relationship between the normalized vegetation index (NDVI) and crop yield. In this study, the quality of crop production (CP) of unit raster was calculated using the procedure shown below:
C P i = ω u n i t ω s u m × Q i
In the above equation, C P i is the crop production of the study area (t/km2), ω u n i t is the normalized vegetation coefficient (NVC) of the unit raster of the area, ω s u m is the sum of the NVC of the overall raster of the study area (including the land cover types of arable land and grassland), and Q i is the food production of the area (t).

2.3. Models of Ecosystem Service Demands

2.3.1. Water Resource Demand

Regional water consumption consists of water for production, living, and ecology, of which water for production includes water for agricultural and industrial production. The calculation process is as follows:
W D = W D i n d + W D a g r + W D d o m
In the formula, W D represents the total water demand; and W D i n d , W D a g r , W D d o m are the industrial, agricultural, and domestic water use in the study area, respectively.
In this paper, the index of water consumption of CNY 10,000 of GDP was used as a reference for the calculation, and the raster data of industrial water consumption in the study area were processed to obtain the following process:
W D i n d = W D i u n i t W D i u n i t = A D i u n i t × A G i u n i t
In the above equation, W D i n d is obtained by summarizing the spatial raster water consumption in each study area, where W D i u n i t is the unit raster industrial water consumption in study area i . A D j u n i t is the water consumption per CNY 10,000 of GDP in the unit raster in the region, and A G j u n i t is the GDP value in the unit raster in the region.
Similarly, domestic water use data were obtained using per capita water use and population raster data:
W D d o m = W M i u n i t W M i u n i t = A M i u n i t × A P i u n i t
In summarizing W D d o m from the spatial raster water use in each study area, W M i u n i t is the unit raster domestic water use in the study area, A D j u n i t is the water use per CNY 10,000 of GDP in the unit raster, and A G j u n i t is the GDP value in the unit raster in the region.
In this study, the actual agricultural irrigation water was used as the agricultural water demand. The agricultural irrigation water use in each municipality was averaged over a raster of cropland types within the region to obtain agricultural water demand data for the study area:
W D a g r = W A i W A i u n i t = W A i N i
W D a g r is the total agricultural water demand in the study area, and W A i reflects the amount of water used for the agricultural irrigation of region i . W A i u n i t is the agricultural water demand for the unit raster, and N i is the raster number for cropland types in the study area.

2.3.2. Carbon Storage Demand

In this paper, based on the regional energy consumption data (including coal and natural gas) and population data, the per capita carbon emissions are obtained, combined with the population density raster data [15], to complete the process of calculating the carbon stock demand:
C D = C D i C D i = E C i × p i u n i t E C i = ( E L C i α 1 + G A Z i α 2 ) × 12 44 P O P i
In the above equation, C D represents the total demand for carbon stocks in the study area, and C D i is the demand for carbon stocks in region i . E C i is the per capita carbon emissions, and p i u n i t is the population density of the spatial unit grid. E L C i represents the electricity consumption of the whole society of the region in the year (kw·h−1), and G A Z i is the natural gas consumption of the region in the year (m3). α 1 represents the CO2 conversion coefficient per unit of electricity consumption, which takes the value of 1.302 kg/kw·h−1; α 2 is the CO2 conversion coefficient per unit of natural gas, which takes the value of 2.1622 kg/m3; 12 44 is the C conversion coefficient of CO2, and P O P i is the population number of the region.

2.3.3. Soil Conservation Demand

Soil conservation needs to reflect the actual situation of regional soil erosion and loss. Therefore, this study adopted the RUSLE soil erosion equation as the calculation method and used the actual soil loss T S a c t as the soil conservation demand of the study area.

2.3.4. Crop Production Demand

The food supply demand is closely related to the population’s food consumption of the region, this study is based on the regional per capita food consumption data, combined with the population density raster data, concerning the studies of Peng et al. [19], to complete the calculation of the demand for food supply in the study area:
F D = F D i F D i = A F i × p i u n i t
where F D is the total demand for food supply in the study area, F D i is the demand for food supply in the region i , A F i indicates the per capita consumption of food, and p i u n i t is the population density of the regional cell grid.

2.4. Models of Ecosystem Service Values

Based on the functional quantity of ecosystem services, various methods, such as market value and shadow engineering, are used to complete the process of transforming the value quantity.

2.4.1. Value of Water Conservation Service

The shadow engineering method was used to complete the assessment of the amount of value of the water conservation services in the study area using the cost of constructing a unit of reservoir as a proxy value factor.
W S V = i = 1 n P W W S i W S i = W S u n i t
In the above formula, W S V is the value of water conservation services, and P W is the construction cost of the unit capacity. A paper on the Ministry of Water Resources in 1990 announced the cost of each party capacity for CNY 0.67 [20], after the social discount rate treatment to obtain the cost of the unit capacity in 2020, with the value of the cost being 2.62 CNY/m3. W S i is the in-kind summary amount of the study area of all unit grids of water conservation.

2.4.2. Value of Carbon Sequestration Service

Carbon market prices were used to account for the value of carbon sequestration services in the study area based on the following process:
C S V = C t o t a l × P C × 12 / 44
C S V is the total value of carbon sequestration services in the study area, and P C is the unit market carbon price. In this study, the carbon tax rate of Swedish carbon was 1200 CNY/ton CO2 [18]. C t o t a l is the total carbon stock in the study area.

2.4.3. Value of Soil Conservation Service

The value of soil conservation services consists of two parts: the value of sediment reduction and the value of soil fertility maintenance. These are calculated as follows:
T S V = S D V + L B V S D V = 24 % × S C u n i t × π θ L B V = S C u n i t × ( N × p 1 r 1 + P × p 1 r 2 + K × p 2 r 3 )
In the above equation, T S V is the value of soil conservation service, S D V is the value of reducing sediment siltation, and L B V is the value of soil fertility keeping. π is the alternative cost of reservoir dredging, with the value of 6.11 CNY/m3, and θ is the soil capacity, with the value of 1.3 t/m3. N , P , and K , respectively, stand for the average content of nitrogen, phosphorus, and potassium in the soil coefficient, with the values of 0.123%, 0.108%, and 1.83%; r 1 is the nitrogen content of diammonium phosphate fertilizers (14%), r 2 is the phosphorus content of diammonium phosphate fertilizers (15.01%), and r 3 is the potassium chloride fertilizer potassium rate (50%); p 1 and p 2 are the diammonium phosphate fertilizer and potassium chloride fertilizer market units, with the values of 2702.5 and 3707.5 CNY/t, respectively.

2.4.4. Value of Crop Production

The market value approach is further applied to measure the overall food supply service value:
F S V = F S i × P i
where F S V is the value of the overall food supply service, and P i is the market price of food in the i region (CNY/t).

2.5. Index of Supply and Demand for Ecosystem Services

To further measure the supply and demand of ecosystem services in the urban agglomeration region, this study adopted the difference between the supply and demand of value quantities to form a trade-off index:
E S R i = E S S i E S D i
E S R i refers to the difference between the supply and demand of ecosystem services in the region. E S S i is expressed as the supply of ecosystem services, and E S D i is the demand of ecosystem services in the region.

2.6. Spatial Analysis Methods

To further reflect the supply and demand patterns of ecosystem service values in the cities and municipalities of the YRDUA, cold–hot-spot spatial statistics (Getis-Ord Gi*) analysis was used to analyze the value supply, demand, and supply–demand surplus [21].

3. Results

3.1. Changes in Ecosystem Services in the YRDUA

3.1.1. Spatial Pixel Distribution of Ecosystem Services

In this study, with the help of the InVEST model, the parameters of the water yield, carbon sequestration, soil conservation, and crop production modules were set, and references were made to existing studies for comparisons, to ensure the accuracy of the results of the calculation of ecosystem service provisioning in the YRDUA, and the specific parameter settings are shown in the attached Table A1, Table A2 and Table A3; Figure 3 below presents the results of the spatial image element distribution of the four types of ecosystem service functions of water conservation, carbon storage, soil conservation, and crop production in the YRDUA region at a 1 km image element accuracy for 2010, 2015, and 2020. As can be seen from the figure, since water conservation reflects the storage capacity of land parcels for precipitation, areas with a high proportion of vegetation cover, such as forests and grasslands, are significantly better than other land types in terms of water conservation capacity per image element. The highest water retention per image dollar was 2.49 × 10⁵ m3/pixel in 2015. The distribution of the highest value of carbon storage per image dollar did not change significantly at the three time points, which was 1198.05 t/pixel. Compared with 15,162.5 t/image CNY in 2010, the highest unit image yuan soil retention in 2020 reached 23,466.2 t/pixel. As far as a unit like the yuan food production potential is concerned, the Yangtze River Delta urban agglomeration has remained the same during the study period, with the highest being 51.9752 t/pixel back in 2015.
A horizontal comparison of the spatial pixel distribution of the ecosystem services in 2010, 2015, and 2020 reveals that with economic development, the built-up area of major cities in the YRDUA, such as Shanghai, Suzhou, and Hangzhou, has continued to expand to cope with the expansion of demand for urban public construction and population housing. The increased level of urbanization has raised the proportion of built-up land within the region, encroaching on the area of ecological land. As natural ecosystems such as forests and grasslands are the main source of important ecological functions such as water resource storage, natural carbon sinks, and the prevention of soil erosion, the expansion of urban areas has led to the concentration of high values of images of water conservation, carbon storage, and soil retention services within the YRDUA in the southwestern mountainous areas, and with urban expansion, the ecosystem service provision capacity per image in the peripheral urban areas has declined. As for food production services in the YRDUA, the high-value pixels are mainly concentrated in the central and northern plains of the region, which are important food production areas. Similarly, the spatial distribution of food production images is also facing the threat of urban expansion, and the cultivated land around the periphery of important cities in the YRDUA has been encroached upon, which has weakened the capacity of the neighboring ecosystems for crop production services.

3.1.2. Supply of Ecosystem Services

Table A4 shows the results of the water conservation capacity, with Hangzhou City having the highest water conservation capacity of 1.35 × 10¹⁰ m3 in 2010. Zhoushan City had the lowest water conservation capacity, with only 1.94 × 10⁶ m3 in 2010 due to a huge difference in its land area compared to the other cities. The cities with higher water resources are mainly in Anhui Province and Zhejiang Province, while Jiangsu Province and Shanghai have a larger gap in their ecosystem water resource service capacity since the area of forests and grasslands is much smaller than that of the other two provinces. Similarly, in 2020, the areas with a high water conservation capacity were still concentrated in cities with a high density of forests and mountains in the YRDUA. Compared with 2010, the volume of water in the YRDUA has declined, mainly due to the expansion of cities in recent years, which encroached on vegetated land and weakened the ecosystem’s capacity for water conservation.
The carbon sequestration service supply is shown in Table A5 below. In 2020, the highest supply of carbon storage services in the YRDUA was still Hangzhou City, which reached 4.72 × 10⁷ t, followed by Xuancheng City’s 3.32 × 10⁷ t. In making a horizontal comparison of 2010’s, 2015’s, and 2020’s annual carbon stocks, a side-by-side comparison reveals that the carbon stock supply capacity of some cities and municipalities shows a continuous downward trend. Compared with 2010, the largest decrease in the carbon sequestration capacity by 2020 will be in Shanghai, with a decline of 2.76 × 10⁶ t, followed by Hangzhou, with a decline of 6.09 × 10⁵ t. The ecosystem services of these cities, which have seen a significant decline in the supply of carbon storage services, are facing serious challenges as economic production and urban construction activities intensify.
Table A6 gives the supply of soil conservation services in the cities of the YRDUA. As the topography and vegetation factors are the key factors determining the protection and conservation of soil in the region, the cities with a high capacity of annual soil conservation services are mainly concentrated in the areas of Anhui and Zhejiang, which have mountainous topography and high forest cover. In 2010, Hangzhou City had the highest soil conservation service supply, reaching 5.37 × 10⁷ t, followed by Anqing City with 4 × 10⁷ t and Jinhua City with 3.19 × 10⁷ t. By 2020, the supply of soil conservation services in each city maintained the basic pattern of 2010, still dominated by soil conservation in mountainous areas, but numerically, the supply of soil conservation services in each city of the YRDUA had expanded due to the further increase in potential soil erosion.
The quantity of food supply in each city in 2010, 2015, and 2020 was calculated and is summarized in Table A7. It can be seen that the overall situation of food supply in the Yangtze River Delta city cluster region in 2015 was lower than that in 2010 and 2020. The highest food supply in 2020 was in Yancheng City, which reached 3.94 × 10⁶ t, followed by Chuzhou City’s 3.07 × 10⁶ t. The lowest food supply capacity in the ecosystem is Zhoushan City, which was only 1.15 × 10³ t, and in excluding island cities like Zhoushan, the lower food supply capacity was in Tongling City and Wuxi City, with each being supply 7.85 × 10⁵ and 8.08 × 10⁵ t of food in 2020.

3.2. Changes in the Ecosystem Service Values in the YRDUA

Based on the ecosystem service value-accounting model constructed in the previous section, the ecosystem service provision value of each city in the YRDUA in 2020 was calculated, and the following Table A8 was obtained. The total value of water conservation services in the YRDUA in 2020 amounted to CNY 1.38 × 10¹¹, with Hangzhou City at the highest level with CNY 2.54 × 10¹⁰, followed by Xuancheng City with CNY 1.67 × 10¹⁰, and Anqing City and Chizhou City also at a high level. The values of water conservation services in Anqing City and Chizhou City were also at a high level, at CNY 1.62 × 10¹⁰ and 1.46 × 10¹⁰, respectively. In terms of water conservation, there is a huge gap between the cities in the YRDUA, except Zhoushan City, which provides only CNY 4.87 × 10⁸ of water conservation service value due to its sparse land area, and the areas with the lowest water conservation value are mainly concentrated in the cities around Lake Taihu, with Jiaxing City providing only CNY 5.39 × 10⁸, followed by Shanghai City with CNY 5.85 × 10⁸, and Suzhou City with only CNY 7.05 × 10⁸ of water conservation value. In terms of the value of carbon sequestration services, the total value provided by the ecosystems of the YDRUA in 2020 was CNY 1.28 × 10¹¹, with Hangzhou City at the highest level with CNY 1.54 × 10¹⁰ and Xuancheng City at the second-highest level with CNY 1.08 × 10¹⁰. The total value of soil conservation services of the YRDUA in 2020 was CNY 7.18 × 10¹⁰, with Hangzhou City, Anqing City, and Xuancheng City having a stock of soil conservation service values of CNY 1.63 × 10¹⁰, 1.16 × 10¹⁰, and 8.77 × 10⁹, respectively, ranking among the top three, while the lowest soil conservation value was only CNY 2.68 × 10⁷ in Jiaxing City; the total value of ecosystem crop production of the YRDUA in 2020 was CNY 9.99 × 10¹⁰, with Yancheng City reaching the highest value of CNY 1.02 × 10¹⁰, and Chuzhou City, CNY 7.98 × 10⁹.
The total value of ecosystem services in the YRDUA was CNY 4.38 × 10¹¹ in 2020, with Hangzhou City having the highest total service value of CNY 6.03 × 10¹⁰, accounting for 13.750%, and Zhoushan City having the lowest total service value of CNY 1.79 × 10⁹, accounting for only 0.409%. The results of the total value level show that there are significant differences in ecological resource endowment among the cities in the Yangtze River Delta urban agglomeration and that areas with a large amount of mountainous Moringa vegetation cover, such as Hangzhou, Anqing, and Xuancheng, are the main sources of ecosystem services for the entire urban agglomeration, shouldering important ecosystem service contributions and regulating functions.

3.3. Evolution of Ecosystem Service Value Supply and Demand in the YRDUA

3.3.1. Spatial Evolution of Each Service Function

The supply and demand results of water conservation, carbon sequestration, soil conservation, and crop production services in the YRDUA in 2010, 2015, and 2020 were matched and calculated at the grid level to finally obtain the spatial distribution results of the supply and demand of ecosystem services in the region on the pixel scale, as shown in Figure 4 below.
In terms of the distribution of physical supply and demand of water conservation, in 2010, the highest surplus pixel of supply in the YRDUA was 2.64 × 10⁶ m3/km2, and the spatial surplus pixels of physical water conservation were mainly concentrated in the mountainous areas of Anhui Province and Zhejiang Province. The deficiency pixels of water conservation material quantity reached the highest value of 3.67 × 10⁶ m3/km2, and these pixels are mainly distributed in highly urbanized areas, mainly in Shanghai, Suzhou, Wuxi, the Hangzhou main urban area, Nanjing, Ningbo, and other cities. Meanwhile, the demand for water conservation material quantity in the central and northern areas of Jiangsu Province also showed the characteristics that the demand was much higher than the supply. By 2020, the spatial pixel distribution of supply and demand for water conservation has changed significantly compared with 2010. The value of the highest surplus pixel decreased to 2.42 × 10⁶ m3/km2, and the value of the highest deficiency pixel increased to 2.69 × 10⁷ m3/km2. In terms of the supply and demand of carbon reserves, the unit pixel values with the largest carbon storage deficit in 2010, 2015, and 2020 were 5.52 × 10⁵, 7.51 × 10⁵, and 1.01 × 10⁶ t /km2, respectively. However, during this period, the carbon storage supply capacity of pixels did not increase significantly due to the limitation of vegetation density, and the high surplus pixel value was still 1.33 × 10⁴ t/km2. In terms of the distribution of soil conservation supply and demand pixels, the high level of surplus pixels of the supply and demand in the YRDUA are mainly in the mountainous area, which is because high-density vegetation cover can play an effective role in soil and water protection, thus alleviating soil and water loss in the region. In other non-mountainous areas, the demand was slightly higher than the actual supply level of soil conservation in 2010. By 2020, physical demand will be slightly lower than supply. The supply and demand of grain supply services are related to the distribution of grain production areas and population concentration areas in the YRDUA. The high grain supply elements in this region are mainly distributed along the Yangtze River, while the population is mainly concentrated in Shanghai, Suzhou, Hangzhou, Nanjing, and other cities. Therefore, from 2010 to 2020, the spatial distribution characteristics of the grain supply and demand pixels in the Yangtze River Delta urban agglomeration did not show significant changes, and the high surplus and high-deficit pixels were concentrated in the belt area centered on the Yangtze River. The northern regions of Jiangsu and Anhui on the upper side of the belt region in the map show a high grain supply surplus because they are the main grain-producing areas in China, while the lower regions of Zhejiang are dominated by the balance pixels of grain supply and demand due to the high proportion of mountainous areas, and the surplus pixels of supply and demand are concentrated in the cultivated land part of the region, while the lack of pixels is the covered urban area.

3.3.2. Changes in the ESR Index by City

The total demand value of ecosystem services in each city was compared with the total supply value of the local city to obtain the surplus of the supply and demand of the ecosystem services value of each city, and the results are shown in Figure 5. In 2010, the total value of ecosystem services showed a surplus mainly in Anhui Province and Zhejiang Province, of which Hangzhou had the highest total value surplus, reaching CNY 32.39 billion, followed by Xuancheng City with CNY 29.76 billion and Jinhua City with CNY 27.45 billion. In the YRDUA, the total values of ecosystem services of cities in Jiangsu Province and Shanghai all showed supply and demand deficits of varying degrees, among which Shanghai had the largest supply and demand deficit. The total value of the ecosystem service demand of this city is much higher than the total service value supply of its ecosystem, reaching CNY 64.56 billion, followed by Suzhou. The deficit was CNY 43.47 billion. By 2020, the supply and demand of the total value of ecosystem services in the YRDUA changed further, among which Shanghai, Suzhou, Nanjing, Wuxi, Hefei, and other core cities in the economic development of the region had a total value deficit in ecosystem services, and the value deficit of Hefei expanded from CNY 6.41 billion in 2010 to CNY 16.87 billion. In Zhejiang Province, in cities such as Hangzhou, Jinhua, and Taizhou, due to their high proportion of mountain forest cover area and high-quality ecological resource endowment, the supply of the ecosystem service value could meet the demand. However, with the population growth of these cities and the rapid economic development in recent years, the demand for ecosystem service value has also increased significantly. In increasing the load on the natural ecosystem, the surplus of the total value of ecosystem services of each city is attenuated. Among them, Jinhua City’s surplus decreased the most, from CNY 27.45 billion in 2010 to CNY 14.79 billion in 2020; with a decrease of CNY 12.66 billion, Taizhou City and Hangzhou City also reduced to CNY 9.71 billion and 8.92 billion, respectively.

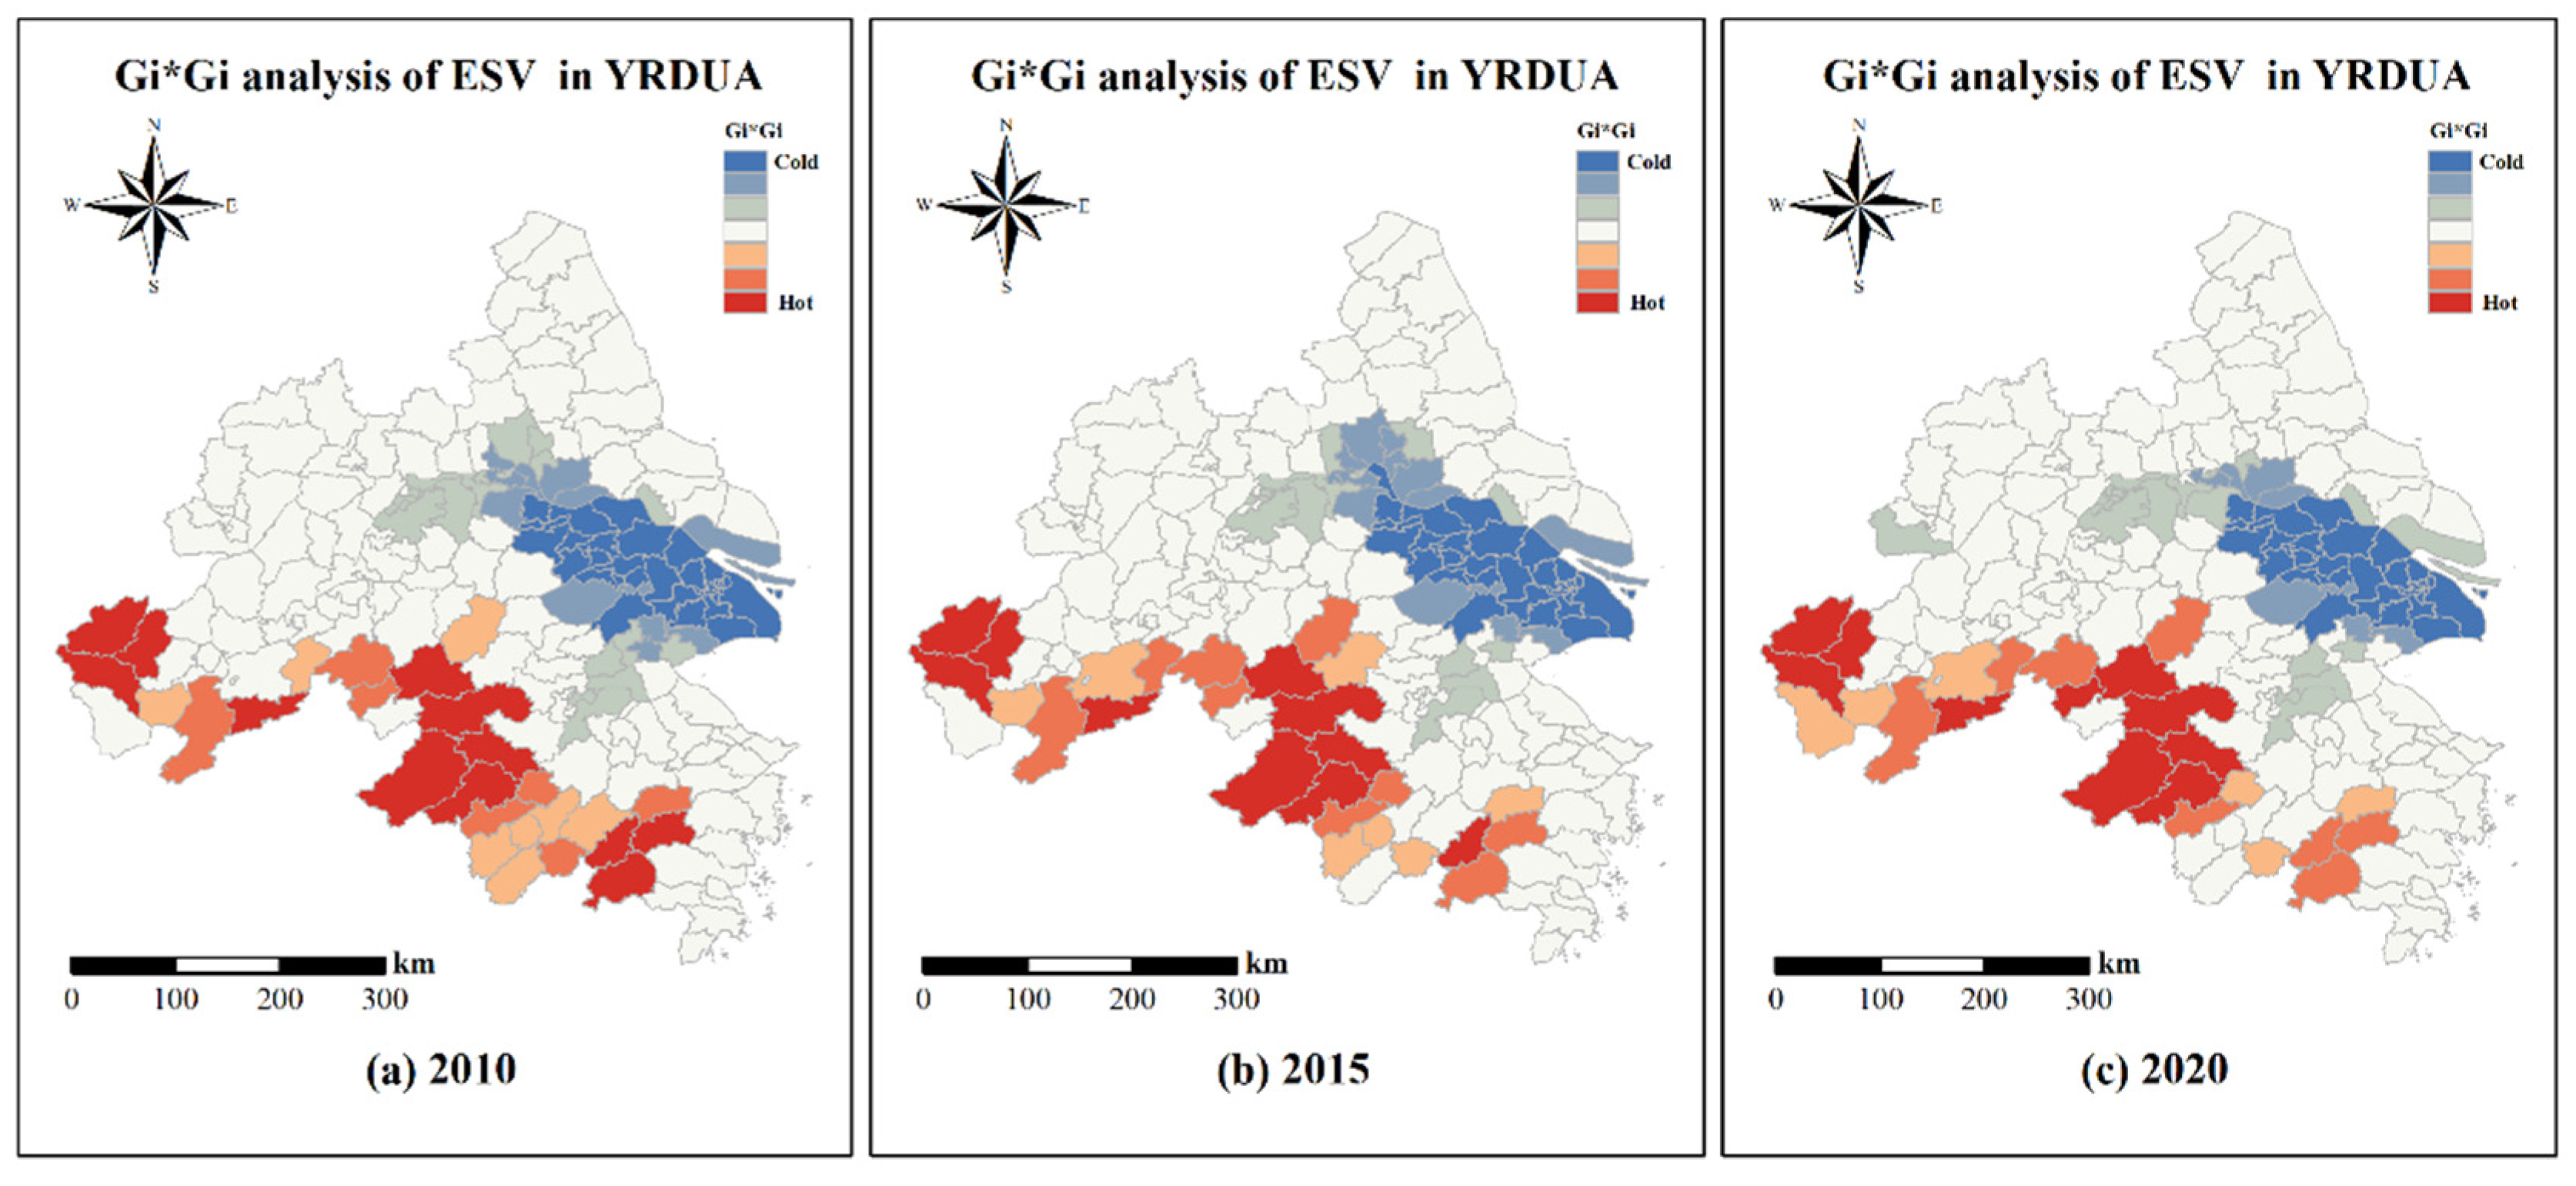
3.3.3. Characteristics of ESR Spatial Clustering at the County Scale

Figure 6 below analyzes the spatial agglomeration changes in ecosystem service supply and demand in the Yangtze River Delta urban agglomeration at the county scale. In 2010, cold spot areas with a surplus of supply and demand were concentrated in the counties around Shanghai and Suzhou. The performance was significant at the 99% level, covering the surrounding districts and counties of Nantong (90% significant), Wuxi (90% significant), Jiaxing (95% significant), and Changzhou (95% significant). The hot spots only included districts and counties in Xuancheng (90% significant), Hangzhou (95% significant), and Jinhua (95% significant). In 2015, the hot spots of the ecosystem service value supply and demand surplus expanded to Anqing, Chizhou, Xuancheng, Hangzhou, and Jinhua, among which Hangzhou was the concentration center of hot spots with a significant level of 99%, while the cold spot of supply and demand surplus did not change significantly. The significant level of cold spot aggregation decreased to 90% in Jiaxing City alone. In 2020, the cold spot of the surplus supply and demand of ecosystem services was still mainly centered in Shanghai. Districts and counties in Changzhou City showed a cluster of cold spots at a 95% significance level and began to gradually form a secondary cold spot cluster center beside the main cluster center in Shanghai. From 2010 to 2020, the cold and hot regional connection of the ecosystem service supply and demand surplus in the Yangtze River Delta urban agglomeration gradually changed from the “Shanghai-Hangzhou” line to the “Shanghai–Anqing” line. Similar to the numerical results of surplus of supply and demand mentioned above, the number of cities and prefectures in Zhejiang Province in the surplus hot spots of ecosystem service value gradually decreased, and the hot spot aggregation area gradually shifted from the original vicinity of Hangzhou in Zhejiang Province to Anqing and Chizhou in Anhui Province.

4. Discussion

4.1. Evaluation of Ecosystem Service Value

In this study, the actual supply of four ecosystem service functions of water conservation, carbon storage, soil conservation, and food supply in the YRDUA was calculated, and a value assessment model was further constructed to complete the assessment process of ecosystem service value. The total value of ecosystem services in the YRDUA was CNY 4.38 × 10¹¹ in 2020, in which the water conservation service value reached CNY 1.38 × 10¹¹. The value of ecosystem services mainly includes two dimensions: economic value and social value [22]. The calculation of economic value is mainly performed to evaluate the tangible resources provided by the ecosystem for human society. Social value aims to transform the monetary value of service functions that do not have direct material form, such as landscape esthetics and cultural inheritance.
The economic valuation of ecosystem services primarily encompasses the supply of resources such as water, food, and raw materials. This aspect is typically assessed through equivalent market price calculations, employing methods like direct market value, contingent valuation, and cost substitution for natural asset accounting. In contrast, evaluating the social value of ecosystem services is more complex due to the subjective nature of cultural services, such as leisure and recreation. To address this, the value preference method is often utilized, integrating questionnaire data to refine monetary estimates. For services closely linked to ecological processes, such as climate regulation and water conservation, mainstream valuation approaches include equivalent factor transformation and ecological material quantity estimation. The equivalent factor method combines established factor scales with land characteristic data to assess various ecosystem services. Meanwhile, ecological supply quantity calculations rely on comprehensive meteorological, hydrological, and topographic data, employing market value methods to derive final valuations based on the quantified service functions.

4.2. Urban Sprawl and Risk of Unbalanced Supply and Demand of Ecosystem Services

The YRDUA is the region with the highest intensity of human activities in China, gathering more than 170 million people. The research proves that during 2010–2020, the major cities in this region all show a continuously deteriorating demand deficit for ecosystem service value, Shanghai’s 2020 deficit is CNY 57.57 billion. The spatial analysis results also show significant spatial mismatch characteristics. This study is consistent with the studies of others, such as Huang et al. [15]. The expansion of urban agglomerations has an increasingly significant impact on the risk of imbalance between the supply and demand of regional ecosystem services. With the acceleration of urbanization, land use has undergone profound changes, and ecological space has been occupied in large quantities, resulting in the decline of the supply capacity of ecological services [23]. While promoting economic development, urban clusters often neglect the carrying capacity of the ecological environment, resulting in shortages of key ecological services such as water resources, air quality, and biodiversity. In urbanization, land development and infrastructure construction lead to the destruction of natural ecosystems, and the supply capacity of ecological services is weakened. For example, the loss of wetlands and forests directly affects water conservation and carbon storage functions, increasing the risk of natural disasters. The dense population in urban agglomerations and the surge in resource demand have further intensified the demand pressure for ecological services. Urban residents’ demands for clean water, air, and leisure space continues to rise, resulting in an increasingly prominent contradiction between supply and demand for ecological services. The imbalance between supply and demand of ecosystem services not only affects the sustainable development of the region but also may lead to social and economic problems, such as resource competition, environmental pollution, and ecological security risks. Therefore, it is necessary to optimize the development mode of urban agglomerations and enhance the supply capacity of ecological services through scientific planning and policy intervention to achieve a win–win situation between economic development and ecological protection.
In addition, the results of this study demonstrate that the total provisioning capacity of ecosystem services in the region declined with urban sprawl, especially carbon sequestration, which declined by almost 6 million tons in 2020 compared to 2010. Water retention fell by 7.1 billion m3, and food production decreases by nearly 1.66 million tons. Urbanization is usually accompanied by the hardening of the land and an increase in impervious surfaces, which reduces the infiltration of rainwater and groundwater recharge, leading to a reduction in the capacity of water sources to contain water. It may also lead to the pollution of water bodies, affecting water quality and further reducing the availability of water sources. Urban expansion is often accompanied by the destruction of natural vegetation, and the destruction of natural ecosystems such as forests, wetlands, and grasslands can directly affect carbon sequestration capacity. Transportation, industrial, and construction activities in cities increase greenhouse gas emissions, further contributing to climate change. The construction of building materials and infrastructure required for urban expansion also consumes large amounts of resources, leading to increased carbon emissions. The process of urbanization, in which agricultural and natural land is converted to urban land, leads to soil erosion and degradation. Urbanization is often accompanied by soil compaction and pollution, which reduces the soil’s ability to retain water and nutrients. The impact of urbanization on food supply capacity is mainly reflected in the reduction in farmland area and the transformation of agricultural production. As cities expand, farmland is encroached upon, leading to a reduction in arable land. This not only affects food production capacity but may also lead to higher food prices and supply instability. In addition, changes in lifestyles and shifts in consumption patterns brought about by urbanization may also affect the sustainability of local agriculture.

4.3. Limitations and Future Study

Taking a typical urban agglomeration—the YRDUA—as the research object, this study completed a quantitative assessment of the supply and demand of ecosystem services in this region for many years and weighed the relationship between supply and demand. At the pixel scale, it was verified that the maximum pixel of ecosystem service supply in this region decreases with urban expansion, demonstrating the decline of the ecosystem supply capacity in this region. In addition, on the demand side, with the increase in population and the intensification of economic intensity, the demand for ecological resources also shows a significant increase, resulting in the widespread demand deficit of the ecosystem service value in this region. At the level of spatial evolution, the regions show obvious spatial mismatch.
To ensure the accuracy of the results, only four subdivided ecosystem service functions of water conservation, carbon sequestration, soil conservation, and crop production were selected in this study, as these ecosystem service functions have relatively rich results in quantitative research, and the quantitative process is relatively mature. However, ecosystem service functions, such as recreation and recreation, which belong to the category of ecosystem cultural services, were not involved in this study. On the one hand, these functions are limited in carrying out multi-city level research; on the other hand, such service functions involve a variety of subjective factors in the process of service–value transformation. In addition, although this study applied a large number of multivariate data to complete the analysis of the supply and demand of ecosystem services in the region, it only reflected the ecological status of the Yangtze River Delta and was based on the current development conditions. However, with the awareness of ecological issues, the government has gradually formulated a series of strict ecological sustainable development plans for urban agglomerations, which will inevitably affect the development prospects of the region.
In focusing on the mechanism of the relationship between the supply and demand of urban agglomerations and ecosystem services, it is meaningful to carry out a more comprehensive spatial scale study, including cultural services, to promote the sustainable development of urban agglomerations. At the same time, the use of various means, including the multi-scenario forecasting method, based on the historical development of urban agglomerations and fully considering the current and future urban agglomerations planning scheme are conducive to predicting the prospects of urban agglomeration development and provide government departments effective help in formulating more reasonable urban planning schemes.

5. Conclusions

This study evaluated ecosystem service values and examined changes in the regional supply–demand relationship amidst urban cluster sprawl, using the Yangtze River Delta Urban Agglomeration (YRDUA) as a case study. The findings reveal a decline in ecosystem service supply and an increasing imbalance between supply and demand due to urban expansion and population growth. Specifically, from 2010 to 2020, water conservation services decreased by 7.08 × 10⁹ m3, carbon storage by 5.96 × 10⁶ tons, soil conservation by 1.43 × 10⁸ tons, and food supply by 1.66 × 10⁶ tons. Concurrently, the demand for ecosystem services rose, with the total service value demand increasing from CNY 4.79 × 10¹¹ in 2010 to CNY 5.54 × 10¹¹ in 2020, and the value deficit expanded from CNY 4.47 × 10¹⁰ to CNY 1.16 × 10¹¹. The spatial analysis indicates a growing imbalance in supply and demand.
The value assessment of ecosystem services and the measurement framework of the supply and demand relationship proposed in this study helped realize the measurement of regional ecosystem services from a spatial scale, to provide a reference for the formulation of relevant policies in regional urban planning and contribute to the scientific development and ecological sustainable development of urban agglomeration regions. However, the impact of subdivision factors such as population and economy, or the ecological development prospects of the region, were not deeply discussed. These will be the focus of subsequent research.

Author Contributions

H.W.: data curation, methodology, and writing—original draft; Q.S.: data curation, software, writing—original draft, and writing—review and editing. All authors have read and agreed to the published version of the manuscript.

Funding

This research was supported by the Young Scientists Fund of the National Natural Science Foundation of China (No. 42301351) and the National Social Science Fund of China (No. 20BGL196).

Institutional Review Board Statement

Not applicable.

Informed Consent Statement

Informed consent was obtained from all subjects involved in the study.

Data Availability Statement

The data presented in this study are available upon request from the corresponding author.

Acknowledgments

We thank the reviewers and editors during the review process.

Conflicts of Interest

The authors declare no conflicts of interest.

Appendix A

(1) Calculation process and parameter setting of ecosystem service supply
The annual water production process on the unit grid is given in the following equation:
W P unit = 1 E T u n i t P u n i t × P u n i t E T u n i t P u n i t = 1 + t u n i t R u n i t 1 + t u n i t R u n i t + 1 / R u n i t R u n i t = L u n i t E T u n i t P u n i t t u n i t = Z × A W C u n i t P u n i t
In the above equation, W P u n i t is the calculated water yield of the unit grid (mm), P u n i t is the rainfall of the unit grid (mm), and E T u n i t is the actual evapotranspiration of the unit grid. t u n i t is the unit grid in the plant and can be used as the stored-water rate; R u n i t is the Budyko aridity index for the unit grid, reflecting the proportionality between potential evapotranspiration and rainfall. L u n i t is the plant evapotranspiration coefficient in the unit grid; Z is the Zhang coefficient, which is a factor reflecting the seasonal characteristics of regional rainfall; and A W C u n i t is the plant-available water content (mm) in the unit grid.
Regional water conservation is the amount of water that is finally retained in the local soil through the processes of interception, absorption, and the storage of precipitation by different land use covers on the surface. Therefore, in this study, after obtaining the results of water production, the physical amount of water conservation in the study area was further calculated using the following process:
W C = W P × min 1 , 249 V s o i l × min 1 , 0.9 × T I 3 × min 1 , K s o i l 300 T I = lg A s u m S o i l d e p t h × S l o p e p e r c e n t
In the formula, W C represents the amount of water conservation, W P is the amount of water production, V s o i l is the flow rate coefficient, T I is the topographic parameter, K s o i l is the infiltration rate of the soil, and S o i l d e p t h reflects the depth of the soil. A s u m is the total number of fences in the catchment area, and S l o p e p e r c e n t is the percentage of slopes; both are obtained by Arcgis hydrological analysis.
The process of calculating the four types of carbon pools is as follows:
C a b o v e = i = 1 n S i A i a b C b l o w = i = 1 n S i A i b l b l o w C s o i l = i = 1 n S i A i s o C d e a d = i = 1 n S i A i d e
S i denotes the area of land use type i , km2; A i a b is the corresponding above-ground carbon stock coefficient; A i b l is the corresponding below-ground carbon stock coefficient; A i s o is the corresponding soil carbon stock coefficient; and A i d e is the corresponding carbon stock coefficient of dead organic matter.
Table A1 shows the settings of the calculation parameters of the water production module, in which the Zhang coefficient, after several inputs, is compared with the calculated water production data of various cities and the runoff data in the Water Resources Bulletin published by the local government that year, and the value of the coefficient was finally determined to be 27.2.
Table A1. Ecological parameterization of water yield models.
Serial NumberLUCC TypesMaximum Root Depth of the PlantSurface Crop CoefficientVegetation Class
1Cropland10001.11
2Woodland35001.0081
3Grassland20000.651
4Water area−11.050
5Construction land−10.20
6Unutilized land−10.20
Table A2 shows the carbon storage factor coefficients corresponding to each land use type set in this study. The data refer to the measured carbon density data of various types of ecosystems and vegetation in China by Xu et al. [24], and the data of dead organic matter in the table are set with reference to the relevant empirical values in the improved 2006 IPCC Guidelines for National Greenhouse Gas Inventories published by the IPCC (International Intergovernmental Panel on Climate Change) in 2019.
Table A2. Carbon factor coefficients for each land type.
Serial NumberLUCC TypesAbove-Ground Carbon PoolUnderground Carbon PoolSoil Carbon PoolCarbon Pool of Dead Organic Matter
1Cropland26.06415.21022.8491
2Woodland46.29448.54834.7643.511
3Grassland22.74911.18719.6671
4Water area0000
5Construction land0000
6Unutilized land6.5011.47500
This study set the above parameters by referring to the suggested parameters in the user manual of the InVEST model combined with the research of Zhong et al. [25] and Zhang et al. [26]. The specific value setting are shown in the attached Table A3.
Table A3. Vegetation management and soil and water conservation measures of factor parameters.
LUCC TypesCroplandWoodlandGrasslandWater AreaConstruction LandUnutilized Land
P111001
C0.070.030.07001
(2) Calculation results of four ecosystem service supplies
Table A4, Table A5, Table A6 and Table A7 show the calculation results of each ecosystem service supply.
Table A4. Water conservation services in the YRDUA. Unit: 108 m3.
Serial NumberCity201020152020
1Xuancheng72.43492.35574.057
2Wuhu11.87016.21413.652
3Chizhou70.22877.92365.004
4Tongling8.18410.5869.233
5Hefei10.18114.55214.589
6Maanshan4.5096.7466.474
7Chuzhou8.06811.79113.182
8Anqing61.52670.22771.866
9Zhenjiang2.0373.1713.851
10Yangzhou1.4632.1433.376
11Yancheng4.0294.2949.316
12Wuxi2.5544.1414.364
13Taizhou1.5612.2243.688
14Suzhou1.5112.5583.122
15Nantong3.4295.0257.677
16Changzhou2.4924.0624.103
17Nanjing4.0376.4286.616
18Shanghai1.4922.1922.591
19Huzhou17.66224.37021.383
20Jiaxing1.9422.8482.386
21Ningbo35.92130.54325.592
22Shaoxing45.13341.74731.739
23Taizhou278.69267.52343.850
24Zhoushan1.9472.0312.155
25Jinhua95.85584.35356.968
26Hangzhou135.481145.590112.542
YRDUA Total684.238735.637613.376
Table A5. Carbon sequestration services in the YRDUA. Unit: 104 t.
Serial NumberCity201020152020
1Xuancheng3336.7523308.9003324.824
2Wuhu1025.750992.5191006.114
3Chizhou2056.7652054.4532050.346
4Tongling481.184476.487473.772
5Hefei1616.7101584.7101569.757
6Maanshan631.005626.222623.594
7Chuzhou2217.4012183.5932188.882
8Anqing2897.3862903.6172898.168
9Zhenjiang549.716543.238531.199
10Yangzhou759.571754.276740.858
11Yancheng2154.7262145.6362163.214
12Wuxi516.320509.779498.379
13Taizhou752.079735.040724.546
14Suzhou599.584580.249579.460
15Nantong1327.0641286.6911284.901
16Changzhou550.333544.079528.555
17Nanjing875.120871.344841.903
18Shanghai709.790677.182633.060
19Huzhou1380.8751366.8711347.489
20Jiaxing496.578483.794456.359
21Ningbo2013.1442022.4642045.621
22Shaoxing2134.2512115.8882104.729
23Taizhou22619.6662612.3832584.824
24Zhoushan245.525271.520259.623
25Jinhua3018.8393008.5602970.038
26Hangzhou4785.5114764.6254724.582
YRDUA Total39,751.64539,424.12039,154.797
Table A6. Soil conservation services in the YRDUA. Unit: 104 t.
Serial NumberCity201020152020
1Xuancheng2723.5893203.6974875.357
2Wuhu177.880182.771322.362
3Chizhou2684.4383178.5214159.193
4Tongling182.136192.784324.066
5Hefei200.884180.850373.588
6Maanshan105.30795.181208.847
7Chuzhou180.958131.374317.849
8Anqing4003.5173542.5396453.133
9Zhenjiang41.44635.88893.126
10Yangzhou19.38015.31042.488
11Yancheng36.10625.98870.143
12Wuxi80.10087.219186.455
13Taizhou12.71910.34128.487
14Suzhou19.34321.31751.708
15Nantong15.09213.22038.914
16Changzhou33.12634.13474.676
17Nanjing90.66480.790194.134
18Shanghai8.9669.35126.266
19Huzhou631.999737.6291332.038
20Jiaxing6.3026.82314.893
21Ningbo1224.255972.2921748.854
22Shaoxing1341.5501172.3831943.937
23Taizhou23039.2942794.5213766.633
24Zhoushan70.43264.66186.655
25Jinhua3192.2002858.5914098.407
26Hangzhou5379.0125809.3029057.452
YRDUA Total25,500.69525,457.47739,889.661
Table A7. Crop production services in the YRDUA. Unit: 104 t.
Serial NumberCity201020152020
1Xuancheng133.527130.846131.716
2Wuhu175.457168.512171.464
3Chizhou102.586101.499100.798
4Tongling80.56679.02178.858
5Hefei303.013296.756294.016
6Maanshan127.408125.948125.389
7Chuzhou312.244305.848307.185
8Anqing239.474238.057237.264
9Zhenjiang105.104103.893101.927
10Yangzhou131.648130.770128.512
11Yancheng389.737387.855393.984
12Wuxi84.61583.01080.814
13Taizhou139.811136.476134.180
14Suzhou120.253115.624113.611
15Nantong271.323262.794260.022
16Changzhou126.255124.249119.842
17Nanjing135.351134.577128.441
18Shanghai168.096160.551147.699
19Huzhou102.51499.90596.536
20Jiaxing114.196110.802104.392
21Ningbo136.665134.931118.382
22Shaoxing110.575105.583103.959
23Taizhou2109.894105.103102.677
24Zhoushan16.51117.37911.528
25Jinhua141.550137.926132.788
26Hangzhou133.186125.203119.198
YRDUA Total4011.5593923.1183845.182
(3) Results of ecosystem service value
Table A8. Ecosystem service value of the YRDUA in 2020. Unit: 108 CNY.
Serial
Number
CityWater
Conservation
Carbon
Sequestration
Soil
Conservation
Crop
Production
Total
ES Values
1Xuancheng167.368108.81287.76234.246398.188
2Wuhu30.85332.9275.80344.581114.164
3Chizhou146.90967.10274.87026.207315.088
4Tongling20.86715.5055.83420.50362.709
5Hefei32.97151.3746.72576.444167.514
6Maanshan14.63120.4093.75932.60171.400
7Chuzhou29.79271.6365.72279.868187.018
8Anqing162.41794.849116.16361.689435.119
9Zhenjiang8.70317.3851.67626.50154.265
10Yangzhou7.63024.2460.76533.41366.054
11Yancheng21.05570.7961.263102.436195.549
12Wuxi9.86216.3113.35621.01250.541
13Taizhou8.33423.7120.51334.88767.446
14Suzhou7.05618.9640.93129.53956.490
15Nantong17.35042.0510.70067.606127.707
16Changzhou9.27417.2981.34431.15959.075
17Nanjing14.95327.5533.49533.39579.396
18Shanghai5.85620.7180.47338.40265.449
19Huzhou48.32644.10023.97825.099141.504
20Jiaxing5.39114.9350.26827.14247.737
21Ningbo57.83866.94831.48130.779187.046
22Shaoxing71.73068.88234.99327.029202.634
23Taizhou299.10284.59467.80426.696278.196
24Zhoushan4.8708.4971.5602.99717.923
25Jinhua128.74897.20173.77634.525334.250
26Hangzhou254.344154.623163.04430.992603.002
Total1386.2291281.430718.058999.7484385.464

References

  1. Fisher, B.; Turner, R.K.; Morling, P. Defining and classifying ecosystem services for decision making. Ecol. Econ. 2009, 68, 643–653. [Google Scholar] [CrossRef]
  2. Pritchard, L.; Folke, C.; Gunderson, L. Valuation of Ecosystem Services in Institutional Context. Ecosystems 2000, 3, 36–40. [Google Scholar] [CrossRef]
  3. Bennett, E.M.; Peterson, G.D.; Gordon, L.J. Understanding relationships among multiple ecosystem services. Ecol. Lett. 2010, 12, 1394–1404. [Google Scholar] [CrossRef] [PubMed]
  4. Asah, S.T.; Blahna, D.J.; Ryan, C.M. Involving Forest Communities in Identifying and Constructing Ecosystem Services: Millennium Assessment and Place Specificity. J. For. 2012, 110, 149–156. [Google Scholar] [CrossRef]
  5. Ling, Y.; Yang, Y.N.; Xu, J.L.; Wang, L.; Wang, Z.H.; Sun, Y.Y.; Yao, C.X.; Wang, Y. Impacts of urbanization on the supply and demand relationship of typical ecosystem services in Beijing-Tianjin-Hebei region. Acta Ecol. Sin. 2023, 43, 5289–5304. [Google Scholar]
  6. Huang, X.; Xie, Y.; Lei, F.; Cao, L.; Zeng, H. Analysis on spatio-temporal evolution and influencing factors of ecosystem service in the Changsha-Zhuzhou-Xiangtan urban agglomeration, China. Front. Environ. Sci. 2024, 11, 1334458. [Google Scholar] [CrossRef]
  7. Hua, Y.; Yan, D.; Liu, X. Assessing synergies and trade-offs between ecosystem services in highly urbanized area under different scenarios of future land use change. Environ. Sustain. Indic. 2024, 22, 100350. [Google Scholar] [CrossRef]
  8. Darshana, A.; Yuji, M.; Madduma, C.B.; Erandathie, L.; Tilak, H.; Jagath, G.; Siri, K. Effects of urban land change on ecosystem service values in the Bolgoda Wetland, Sri Lanka. Sustain. Cities Soc. 2024, 101, 105050. [Google Scholar]
  9. Hu, Y.C.; Liu, Y.; Yan, Z.Y. Research Regarding the Coupling and Coordination Relationship between New Urbanization and Ecosystem Services in Nanchang. Sustainability 2022, 14, 15041. [Google Scholar] [CrossRef]
  10. Li, N.; Yang, L.Z.; Luo, G. Coupling Coordination Analysis of Ecosystem Services and Urbanization in Inner Mongolia, China. Land 2022, 11, 1870. [Google Scholar] [CrossRef]
  11. Zhang, L.; Hickel, K.; Dawes, W.R.; Chiew, F.H.S.; Western, A.W.; Briggs, P.R. A Rational Function Approach for Estimating Mean Annual Evapotranspiration. Water Resour. Res. 2004, 40, 89–97. [Google Scholar] [CrossRef]
  12. Wang, X.; Zhang, X.; Feng, X.; Liu, S.; Yin, L.; Chen, Y. Trade-offs and Synergies of Ecosystem Services in Karst Area of China Driven by Grain-for-Green Program. Chin. Geogr. Sci. 2020, 30, 101–114. [Google Scholar] [CrossRef]
  13. Gao, Y.; Feng, Z.; Li, Y.; Li, S. Freshwater ecosystem service footprint model: A model to evaluate regional freshwater sustainable development—A case study in Beijing–Tianjin–Hebei, China. Ecol. Indic. 2014, 39, 1–9. [Google Scholar] [CrossRef]
  14. Zhou, S.; Li, W.; Lu, Z.; Yue, R. An analysis of multiple ecosystem services in a large-scale urbanized area of northern China based on the food-energy-water integrative framework. Environ. Impact Assess. Rev. 2023, 98, 106913. [Google Scholar] [CrossRef]
  15. Huang, Y.; Cao, Y.; Wu, J. Evaluating the spatiotemporal dynamics of ecosystem service supply-demand risk from the perspective of service flow to support regional ecosystem management: A case study of yangtze river delta urban agglomeration. J. Clean. Prod. 2024, 460, 142598. [Google Scholar] [CrossRef]
  16. Wu, K.; Wang, D.; Lu, H.; Liu, G. Temporal and spatial heterogeneity of land use, urbanization, and ecosystem service value in China: A national-scale analysis. J. Clean. Prod. 2023, 418, 137911. [Google Scholar] [CrossRef]
  17. Roy, S.K.; Alam, M.T.; Mojumder, P.; Mondal, I.; Kafy, A.A.; Dutta, M.; Ferdous, M.N.; Al Mamun, M.A.; Mahtab, S.B. Dynamic assessment and prediction of land use alterations influence on ecosystem service value: A pathway to environmental sustainability. Environ. Sustain. Indic. 2024, 21, 100319. [Google Scholar] [CrossRef]
  18. Panek, E.; Gozdowski, D. Analysis of relationship between cereal yield and NDVI for selected regions of Central Europe based on MODIS satellite data. Remote Sens. Appl. Soc. Environ. 2019, 17, 100286. [Google Scholar] [CrossRef]
  19. Peng, J.; Hu, X.; Wang, X.; Meersmans, J.; Liu, Y.; Qiu, S. Simulating the impact of Grain-for-Green Programme on ecosystem services trade-offs in Northwestern Yunnan, China. Ecosyst. Serv. 2019, 39, 100998. [Google Scholar] [CrossRef]
  20. Gong, J.; Dai, X.; Wang, L.; Niu, Z.; Cao, Q.; Huang, C. The Impact of Urbanization on the Supply–Demand Relationship of Ecosystem Services in the Yangtze River Middle Reaches Urban Agglomeration. Remote Sens. 2023, 15, 4749. [Google Scholar] [CrossRef]
  21. Wang, W.; Deng, X.; Wang, Y.; Peng, L.; Yu, Z. Impacts of infrastructure construction on ecosystem services in new-type urbanization area of North China Plain. Resour. Conserv. Recycl. 2022, 185, 106376. [Google Scholar] [CrossRef]
  22. Das, S.; Kumar Shit, P.; Bera, B.; Adhikary, P.P. Effect of urbanization on the dynamics of ecosystem services: An analysis for decision making in Kolkata urban agglomeration. Urban Ecosyst. 2022, 25, 1541–1559. [Google Scholar] [CrossRef]
  23. Prakash, C.M.; Milap, P. Impact of urbanization processes on availability of ecosystem services in National Capital Region of Delhi (1992–2010). Environ. Dev. Sustain. 2021, 24, 21–25. [Google Scholar]
  24. Xu, L.; He, N.P.; Yu, G.R. Data Set of Carbon Density of Terrestrial Ecosystems in China in 2010s; Science Data Bank: Beijing, China, 2018. [Google Scholar]
  25. Zhong, J.T.; Wang, B.; Mi, W.B.; Fan, X.G.; Yang, M.L.; Yang, X.M. Spatial recognition of ecological compensation standard for grazing grassland in Yanchi County based on InVEST model. Sci. Geogr. Sin. 2020, 40, 1019–1028. [Google Scholar]
  26. Zhang, W.; Wang, F.C.; Wan, H.L.; Zhang, L.J.; Li, Z.M.; Wang, H.X. Spatiotemporal variations and influencing factors of soil conservation service based on InVEST model: A case study of Miyun Reservoir upstream basin of Zhangcheng area in Hebei. Prog. Geophys. 2022, 37, 2339–2350. [Google Scholar]
Figure 1. The information of the YRDUA.
Sustainability 16 08269 g001
Figure 2. Processing flowchart of the data.
Sustainability 16 08269 g002
Figure 3. Spatial pixel distributions of ecosystem services.
Sustainability 16 08269 g003
Figure 4. Patterns of ecosystem service supply and demand in the YRDUA at the pixel scale.
Sustainability 16 08269 g004
Figure 5. Surplus of supply and demand of total value of ecosystem services of cities in YRDUA.
Sustainability 16 08269 g005
Figure 6. ESR spatial agglomeration characteristics of the YRDUA at the county scale.
Sustainability 16 08269 g006
Table 1. Description of data sources.
Data ContentData SourceYear
LUCCChina’s Multi-period Remote Sensing Monitoring of Land Use (LUCC) dataset2010, 2015, 2020
administrative divisionsSource Environmental Science and Data Center of Chinese Academy of Sciences (SESDC)2020
GDP raster dataSESDC2010, 2015, 2020
meteorological data for the YRDUAthe National Qinghai–Tibetan Plateau Scientific Data Center (NATPSSDC)2010, 2015, 2020
population raster data,World Pop public dataset2010, 2015, 2020
the resource consumption, population, and food demand data of the cities and provincesthe Statistical Yearbook and Water Resources Bulletin of each province and city2010, 2015, 2020
major highways, railroads, and rivers in the YRDUAthe National Geographic Information Resource Inventory Service System (NGIRSS)2010, 2015, 2020
DEMthe ASTER GDEM 30m data of the American Aviation Administration (NASA)2019
Disclaimer/Publisher’s Note: The statements, opinions and data contained in all publications are solely those of the individual author(s) and contributor(s) and not of MDPI and/or the editor(s). MDPI and/or the editor(s) disclaim responsibility for any injury to people or property resulting from any ideas, methods, instructions or products referred to in the content.

