


The Synergistic Effect of Urban and Rural Ecological Resilience: Dynamic Trends and Drivers in Yunnan


Abstract
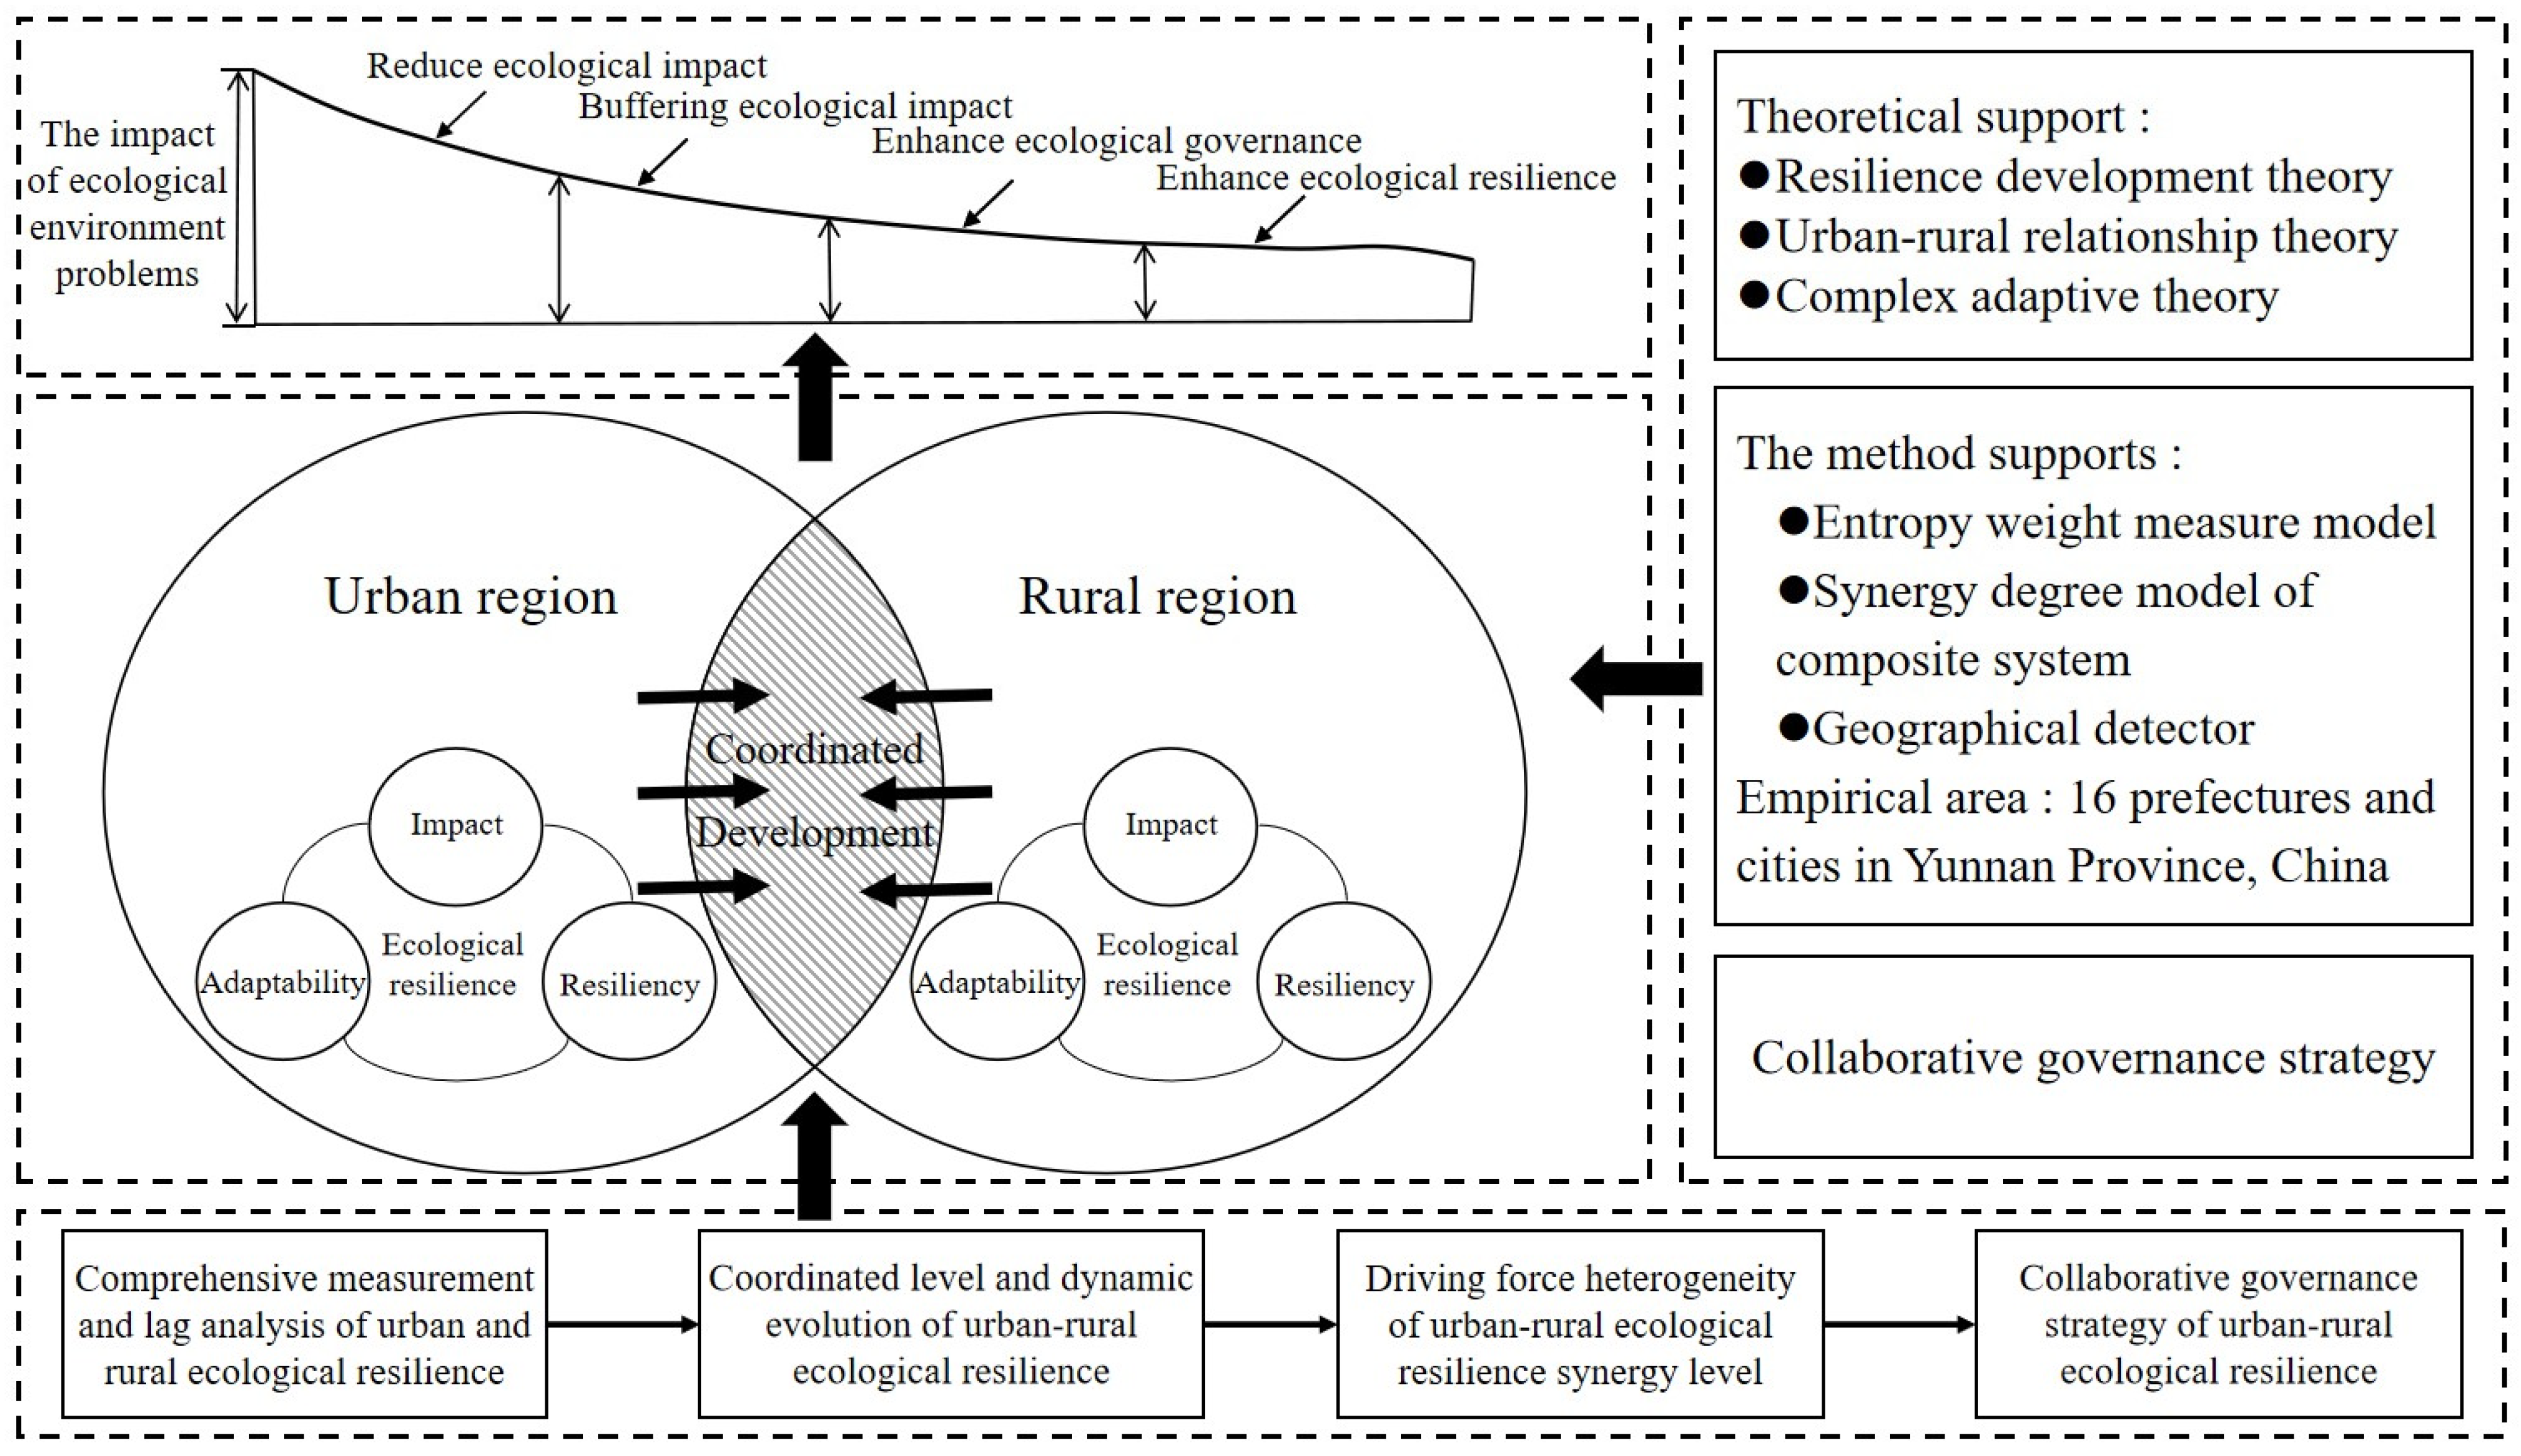
1. Introduction
2. Methods
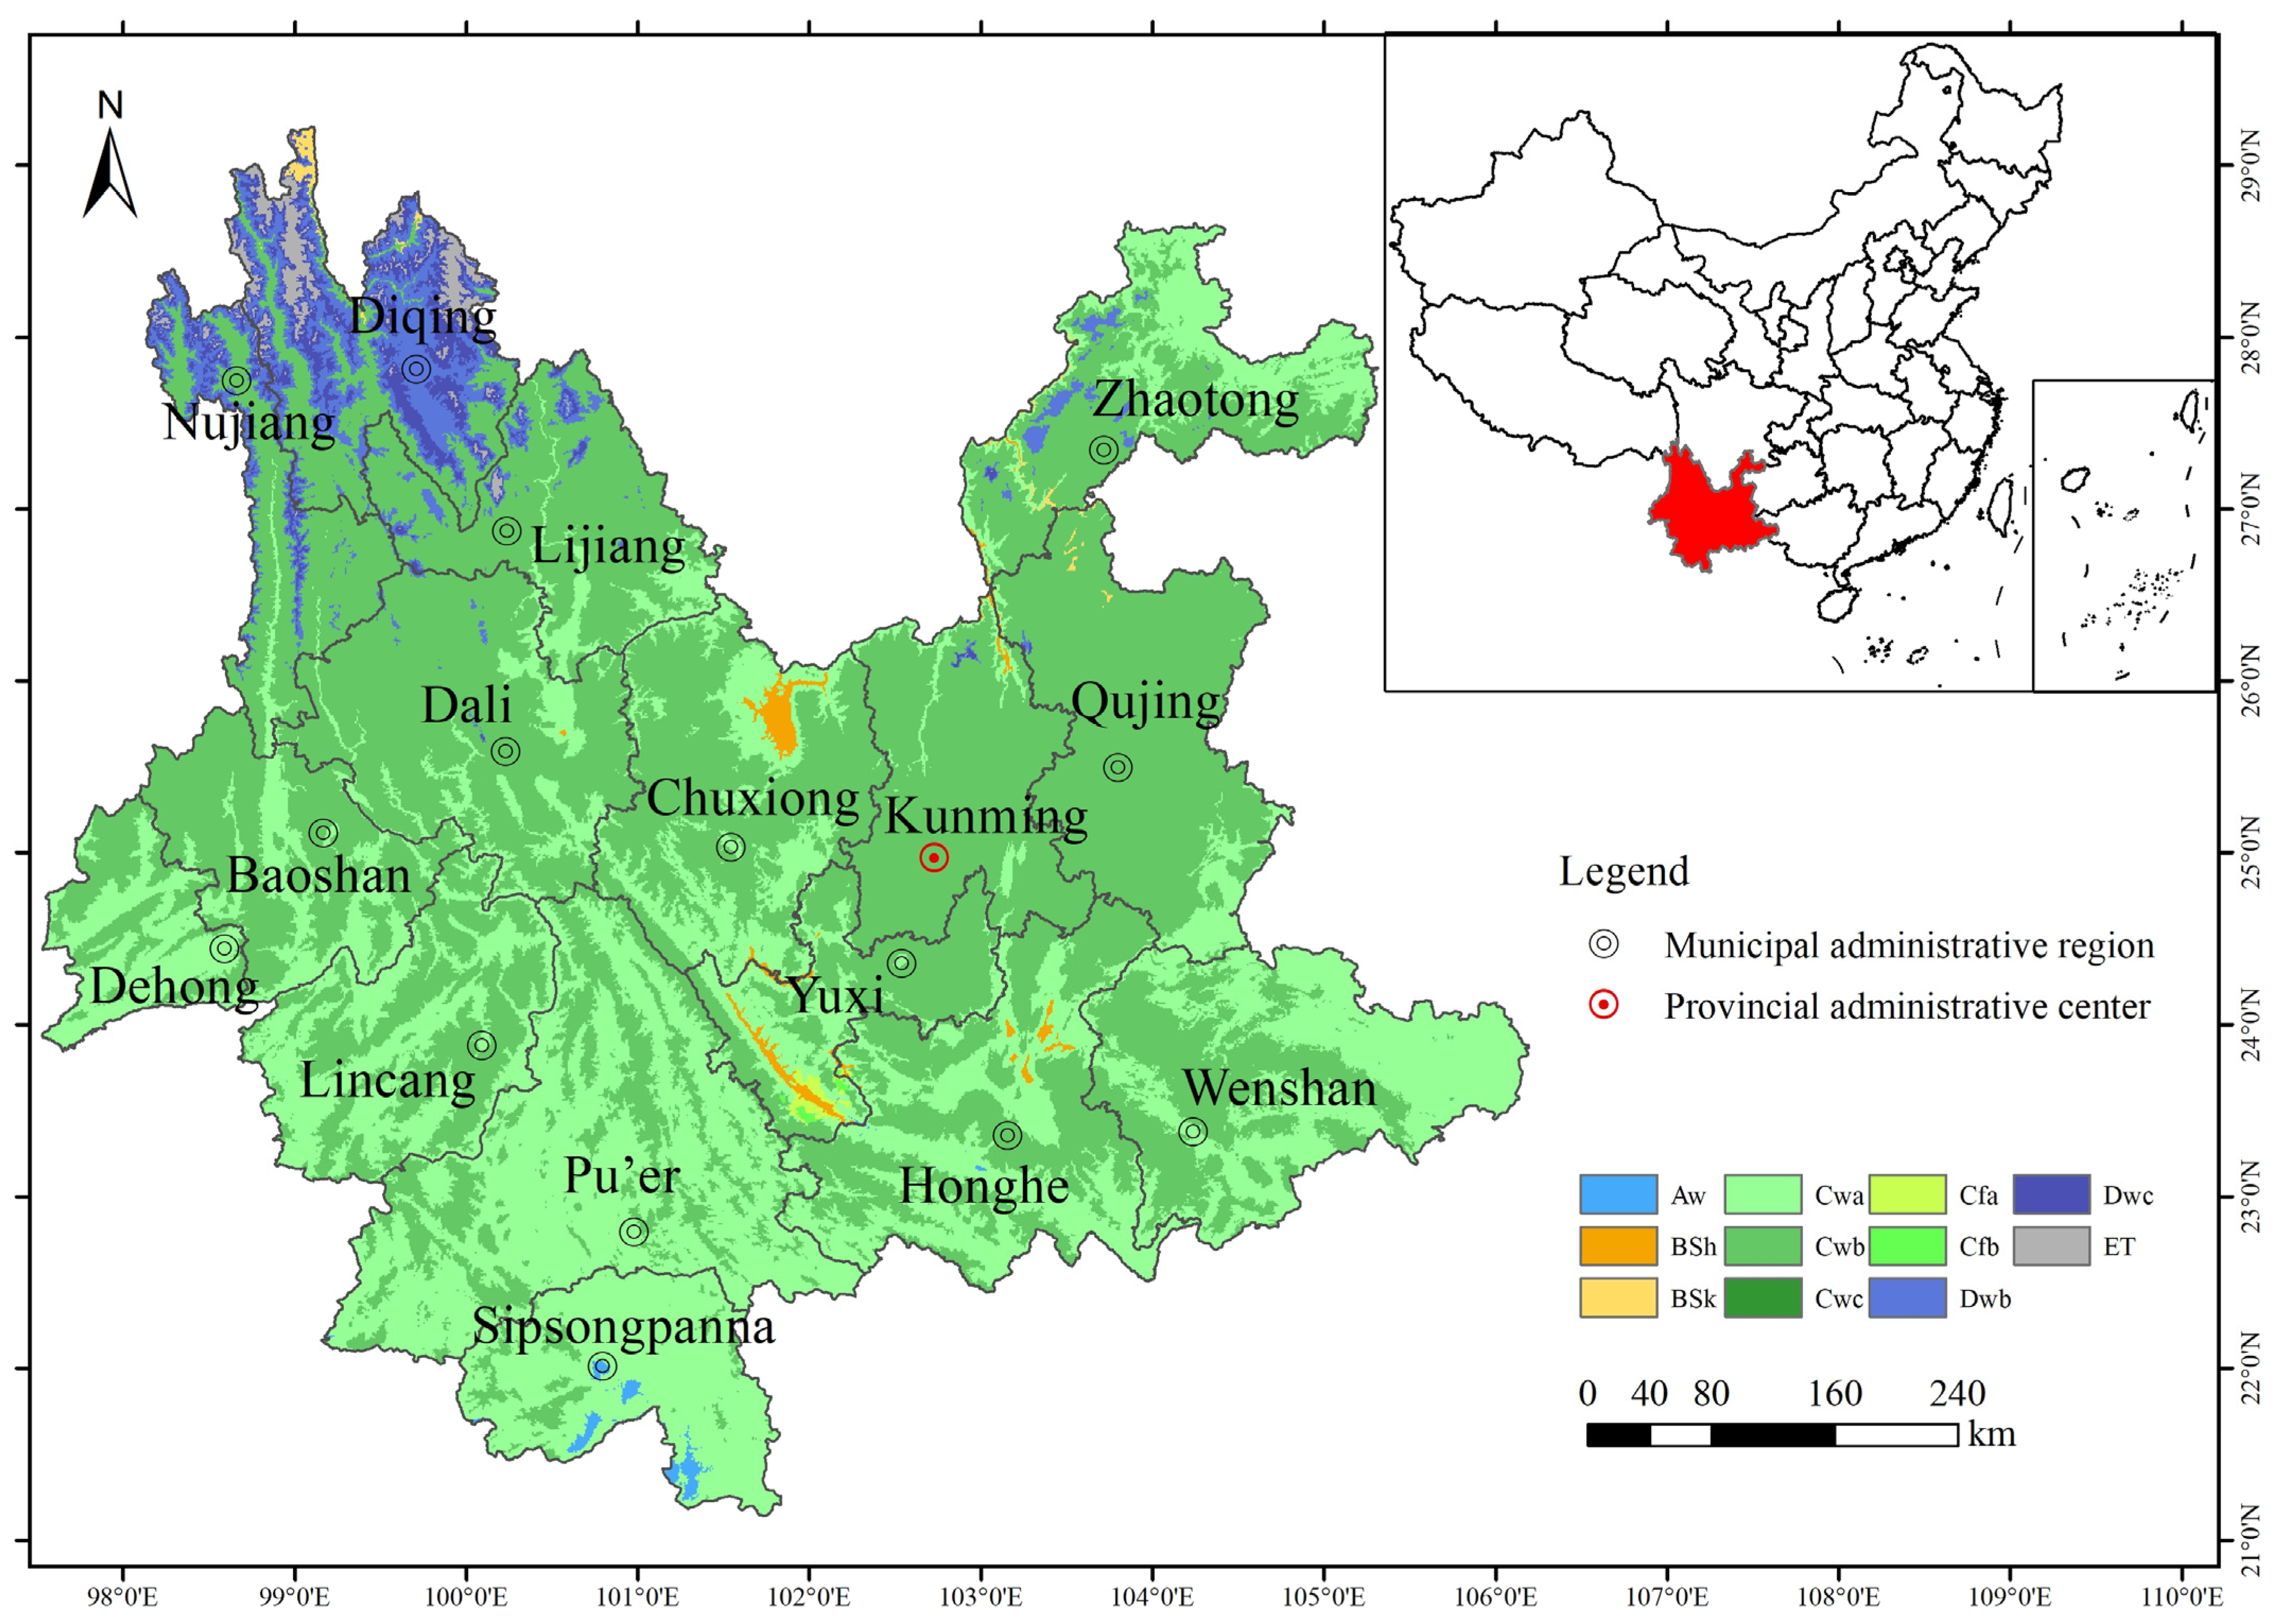
2.1. Study Area and Data Sources
2.1.1. Study Area
2.1.2. Data Sources
2.2. Index System Construction
2.3. Research Methods
2.3.1. Entropy Weight Resilience Measurement Model
2.3.2. Collaborative Degree Model of the Composite System
2.3.3. Geographical Detector
3. Empirical Results and Analysis
3.1. Weight Calculation and Analysis of Urban Ecological Resilience and Rural Ecological Resilience
3.2. Evolution Analysis of Comprehensive Measurement of Urban Ecological Resilience and Rural Ecological Resilience
3.2.1. Evolution Analysis of Comprehensive Measurement of Urban Ecological Resilience
3.2.2. Evolution Analysis of Comprehensive Measurement of Rural Ecological Resilience
3.3. Lag Analysis of Urban Ecological Resilience and Rural Ecological Resilience
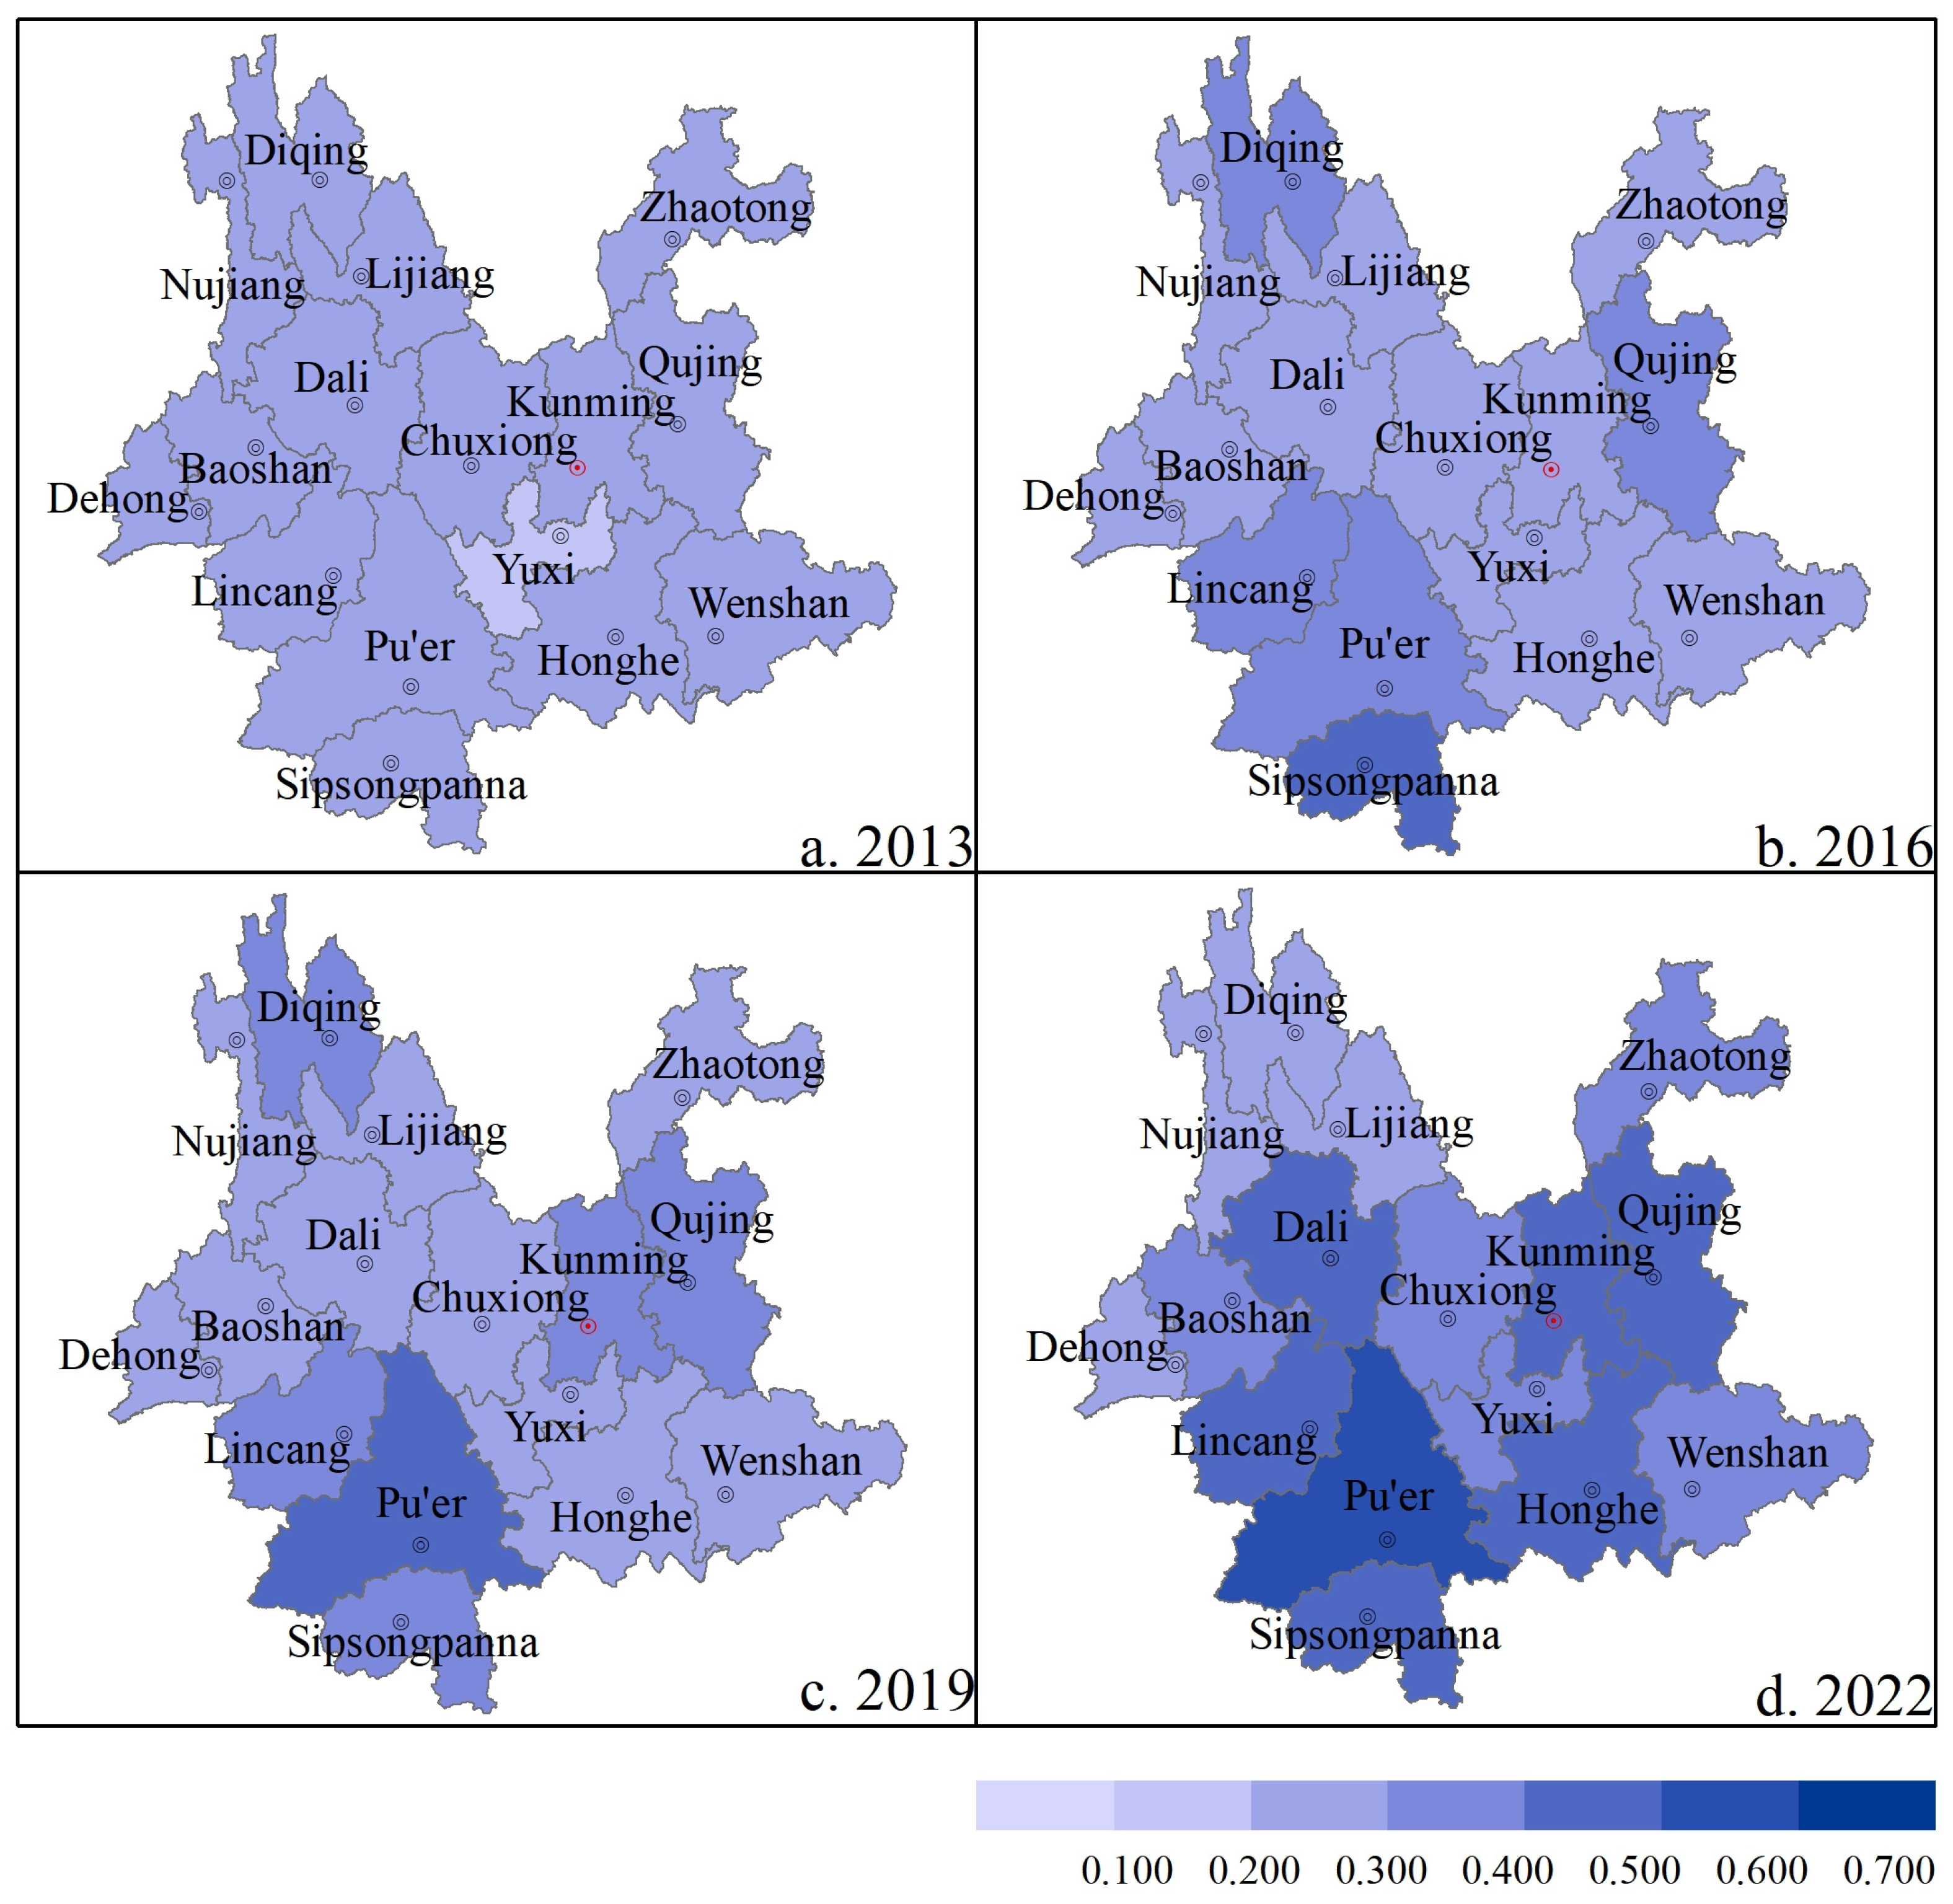
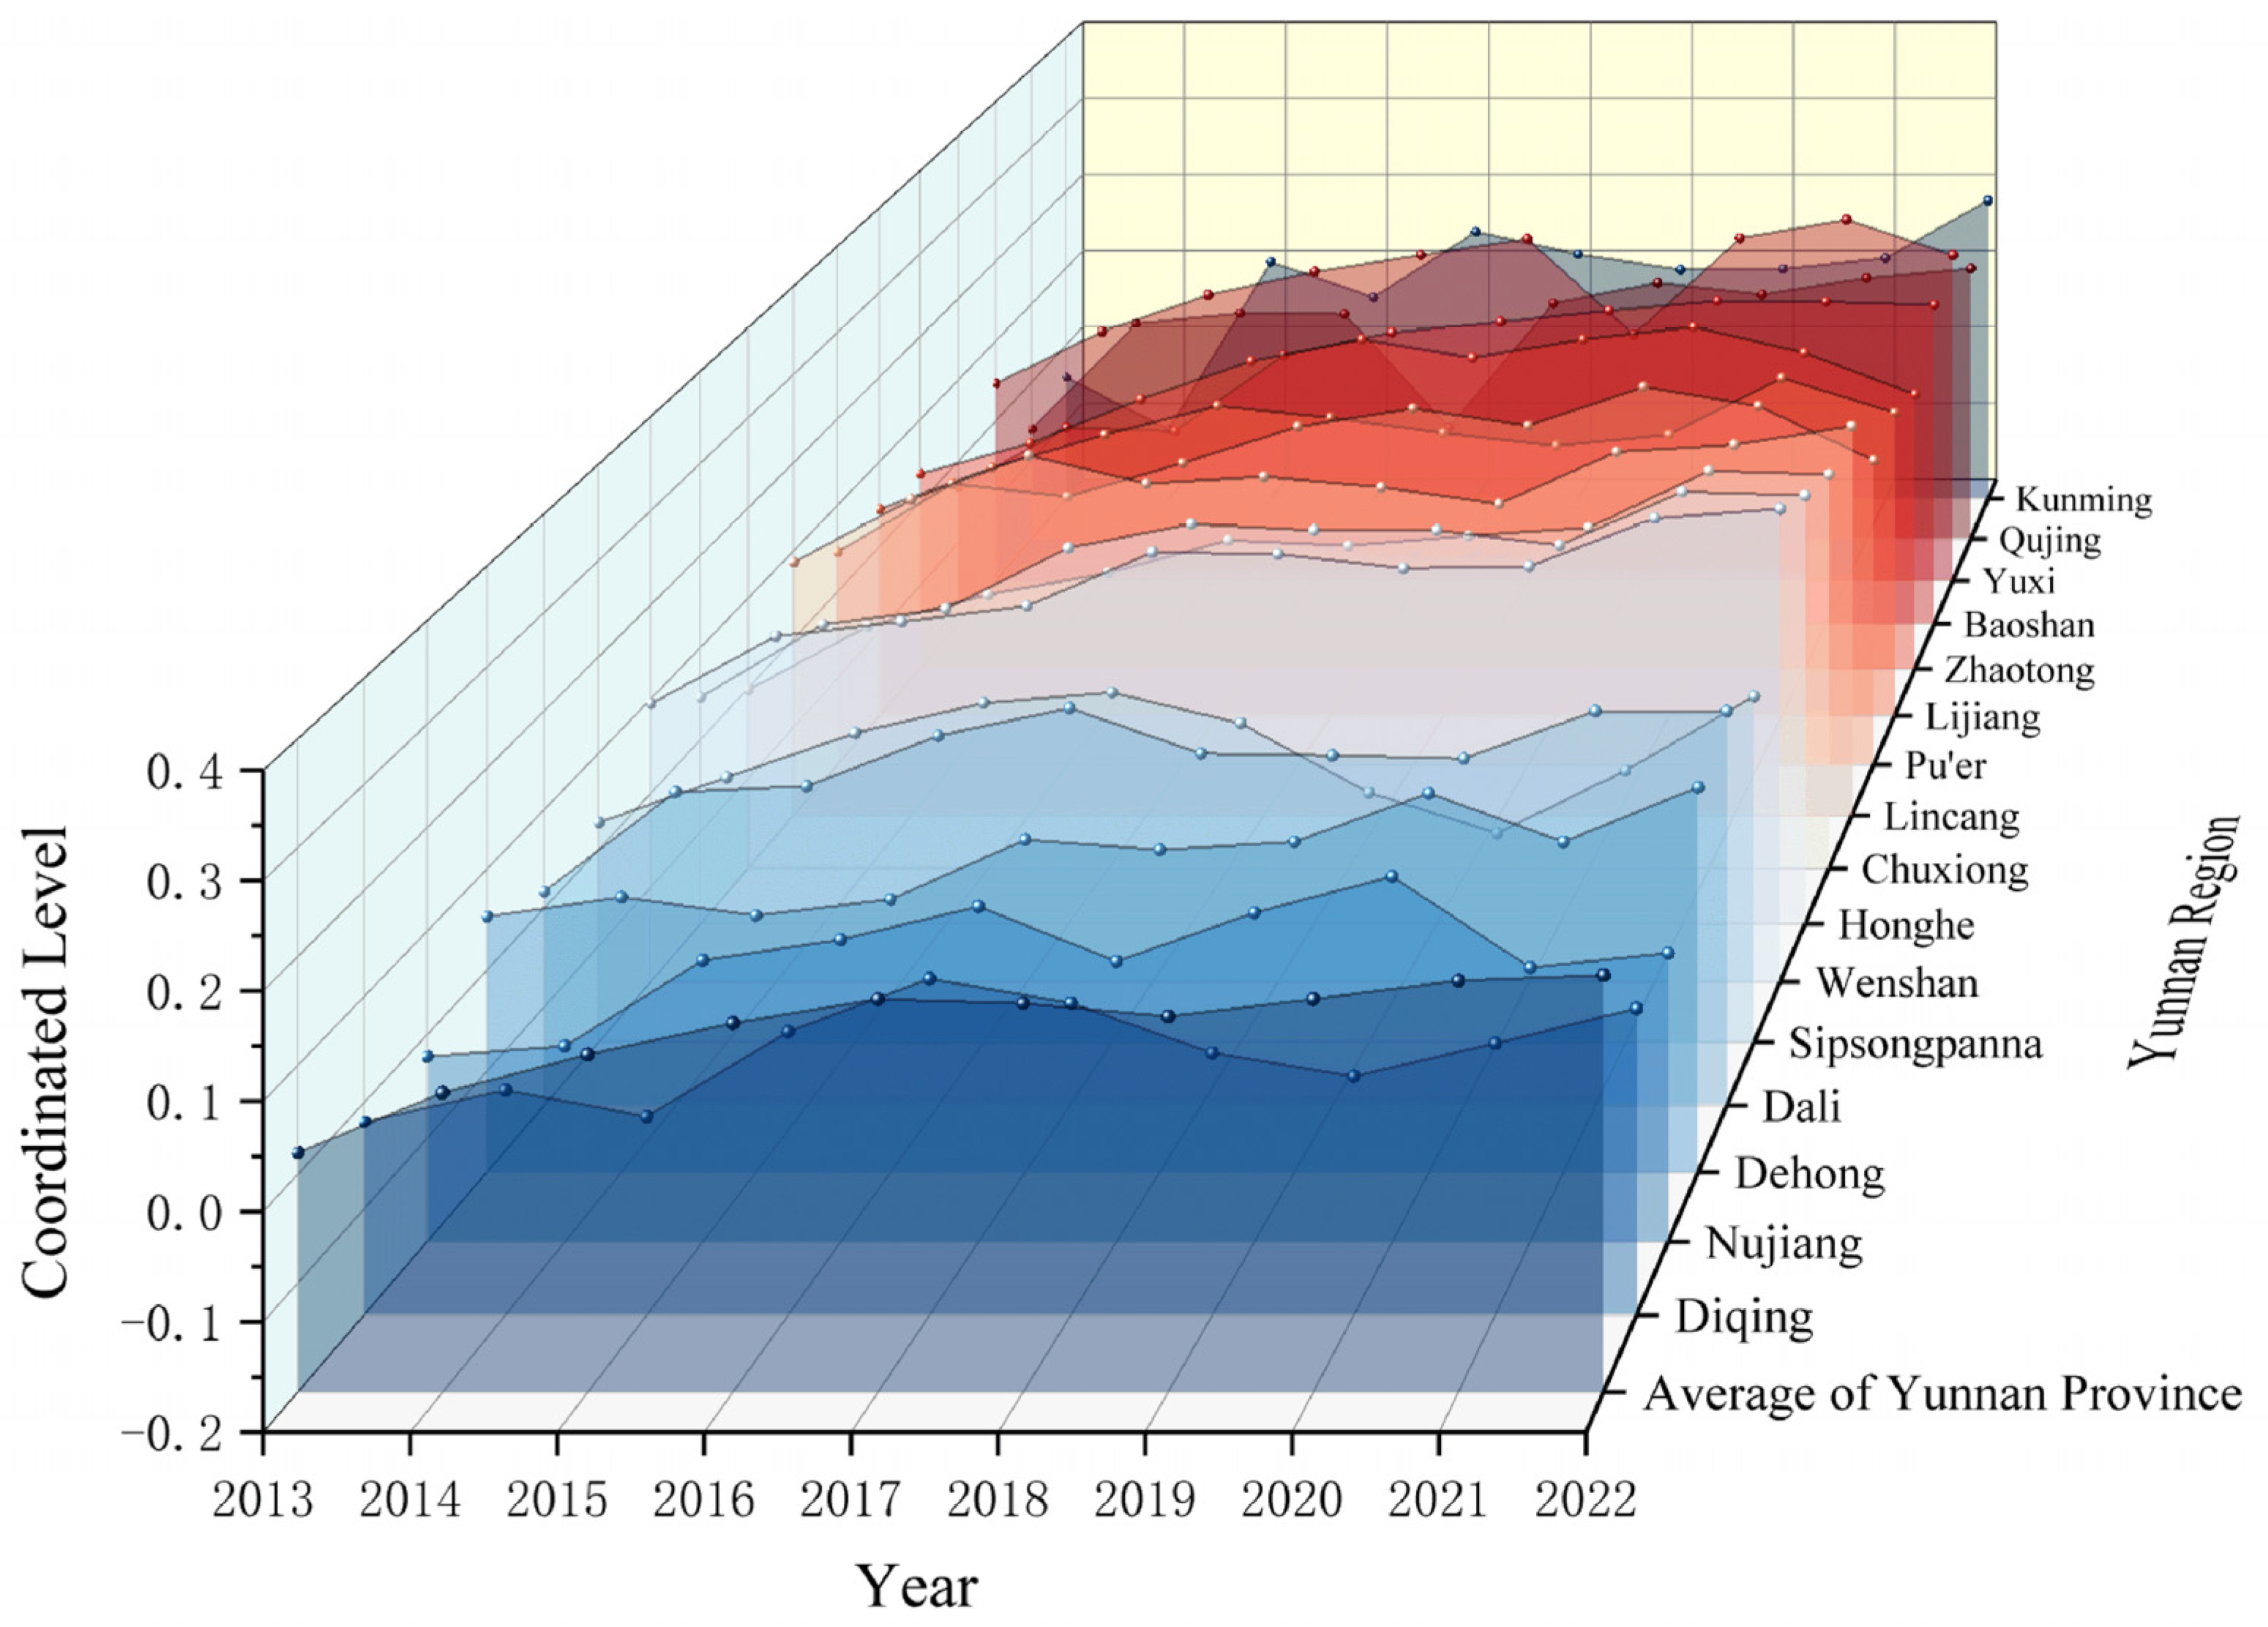
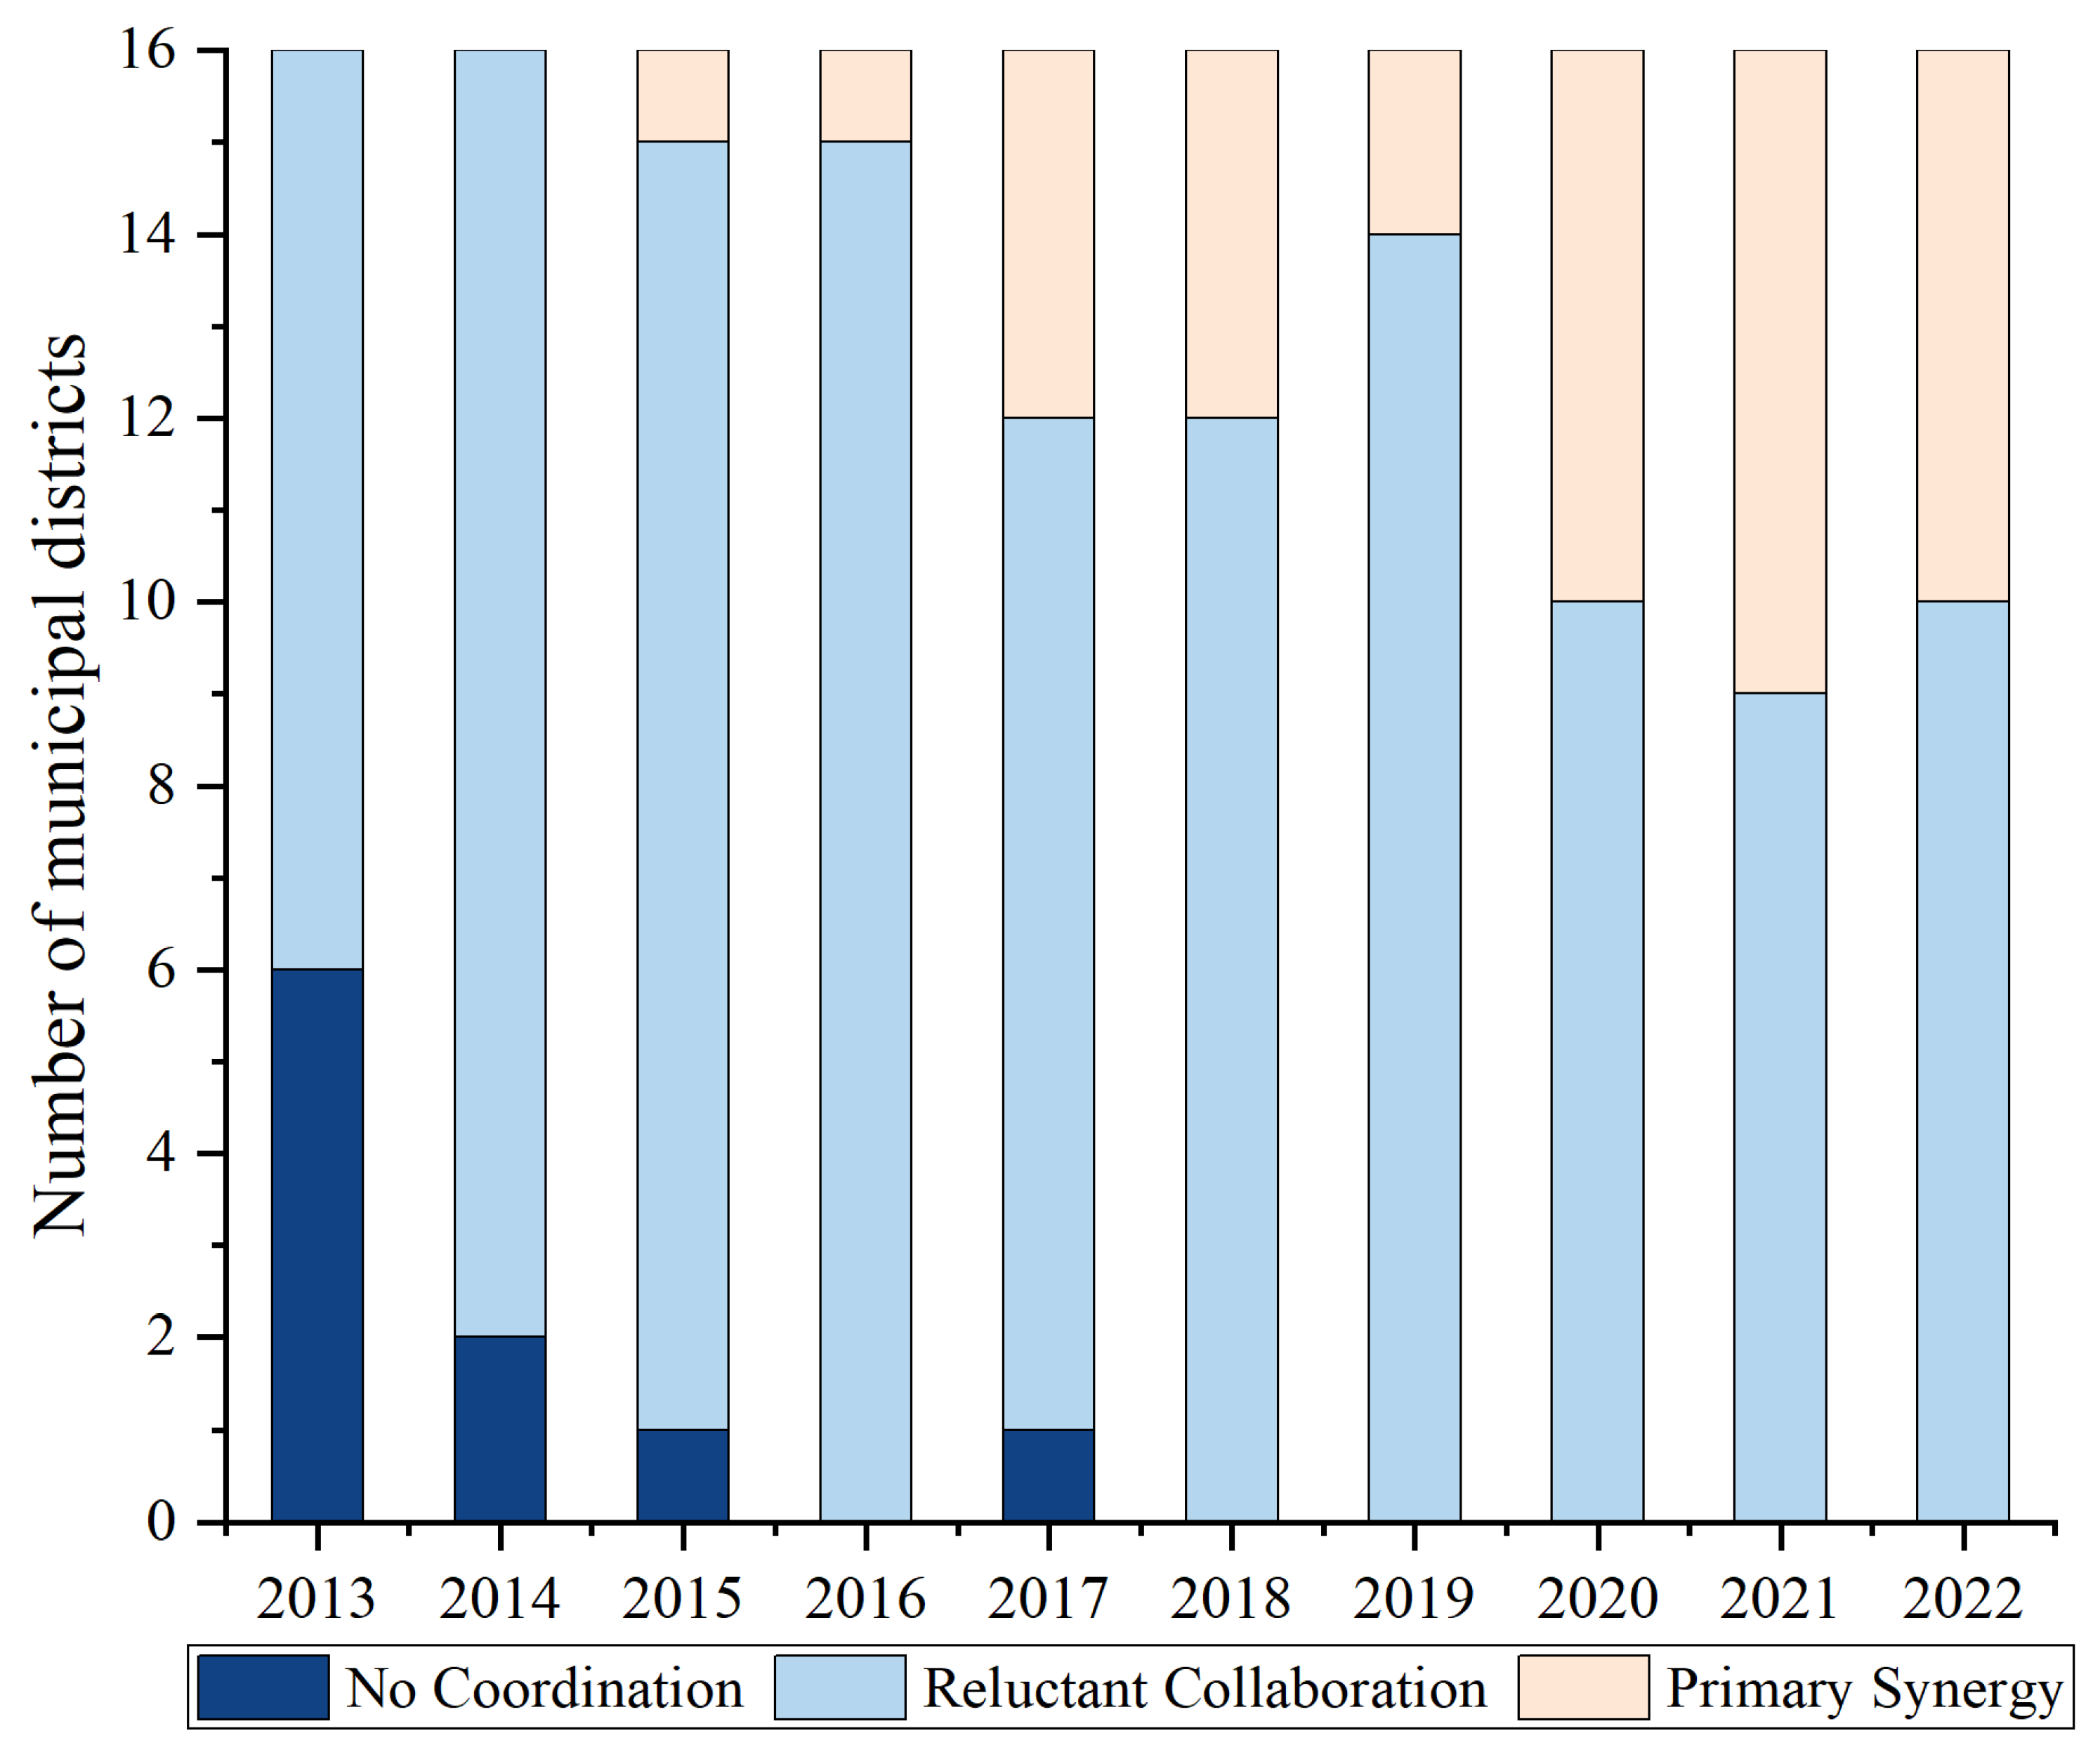
3.4. Analysis of the Synergy Level of an Urban–Rural Ecological Resilience Composite System
4. Study of the Heterogeneity of Forces Driving the Coordinated Development of Urban and Rural Ecological Resilience
4.1. Factor Detection Analysis
4.2. Interaction Detection Analysis
5. Discussion
- (1)
- Promote the coordinated development of urban and rural ecological resilience and enhance the ability of urban and rural ecological governance. From the lag analysis of urban ecological resilience and rural ecological resilience, it can be seen that the overall type of coordinated development of urban and rural ecological resilience in Yunnan Province has changed from urban lag to rural lag. Whether it is urban lag or rural lag, it is hindered by the development of ecological resilience. The study of interaction factor detection shows that most of the better interaction results are due to the coordinated development of urban and rural ecological driving forces. The combination of urban and rural driving factors is more conducive to improving urban and rural ecological resilience. Therefore, we should promote the coordinated development of urban and rural ecological resilience, balance the relationship between urban and rural ecological environment governance with the help of urban and rural mutual penetration, and improve the ability of urban and rural ecological two-way governance.
- (2)
- Strengthen scientific and technological support for the coordinated development of urban and rural ecological resilience and steadily improve urban and rural ecological resilience. Through interactive detection analysis, it can be observed that the interaction between per capita water supply and fertilizer consumption is the primary driving factor for the coordinated development level of urban and rural ecological resilience. Enhancing the interaction between per capita water supply and fertilizer consumption not only enhances its own driving effect on the coordinated development of urban and rural ecological resilience but also those of other factors. To improve the coordinated development level of urban and rural ecological resilience, we should make rational use of various advantageous resources in urban and rural areas. On the one hand, urban areas should increase investment in green industries, encourage enterprises to develop innovations, and use green and efficient process equipment to increase per capita water supply. Concurrently, the level of urban and rural water supply security can be improved by rationally planning water resources and strengthening water resource management. On the other hand, agriculture is the main industry in rural areas. Combined with the five core driving factors obtained from the single factor detection analysis, it was found that in order to promote the coordinated development of urban and rural ecological resilience and enhance urban and rural ecological resilience, it is necessary to increase investment in green agriculture, vigorously promote green technology agricultural production mode, and thoroughly implement zero growth action of chemical fertilizer and pesticide use and reduce the consumption of agricultural plastic film. At the same time, increasing investment in farmland water conservancy facilities can improve irrigation conditions, improve the utilization rate and irrigation efficiency of farmland water conservancy facilities, and reduce the wastage of agricultural water resources. On this basis, strengthening scientific and technological support will achieve the goal of improving the output efficiency of agricultural production.
- (3)
- Pay attention to the spatial imbalance in the coordinated development of urban and rural ecological resilience in Yunnan Province and explore the path of differentiated regional development. Combined with the overall level of coordinated development of urban and rural ecological resilience, the core factors in various regions are taken as the starting point for formulating a differentiated coordinated development strategy. For example, the development strategy of increasing the per capita afforestation area and per capita cultivated land area should be formulated for the ecological environment problems in Diqing. To increase per capita afforestation area, on the one hand, the government and the forestry sector should increase the existing forest area and improve the existing forest coverage and forest quality by implementing scientific protection and ecological restoration measures for forest and grassland resources. On the other hand, per capita afforestation area can be directly improved by adding new green areas for afforestation. To increase the per capita cultivated land area, it is necessary for the Diqing government to strictly control the scale of land development, carry out in-depth protection and improvement of cultivated land quality, and prevent land desertification and degradation.
6. Conclusions
- (1)
- From the perspective of time series, the overall urban and rural ecological resilience level of Yunnan Province increased annually from 2013 to 2022, and the urban ecological resilience level lagged behind the rural ecological resilience level. From the perspective of spatial distribution, the overall spatial difference in rural ecological resilience level is small, while the overall spatial difference in urban ecological resilience level is large.
- (2)
- The synergy level of urban and rural ecological resilience in Yunnan Province increased annually from 2013 to 2022, from “no collaboration” to “primary collaboration”. The urban–rural relationship based on the level of ecological resilience in various states and cities has continued to develop in a good direction; however, there are significant differences in the level of synergy of urban–rural ecological resilience between various prefectures and cities in Yunnan Province.
- (3)
- The trend of evolution of the level of synergy of urban and rural ecological resilience in Yunnan Province is affected by multiple driving factors. The interaction between various factors has a two-factor enhancement or non-linear enhancement relationship with the development of urban and rural ecological resilience. From the perspective of the evolution of the driving effect of interactive factors, the better interaction results are mostly those of the coordinated development of urban and rural ecological driving forces. The interaction between per capita water supply and fertilizer consumption is the primary and key driving factor for the coordinated development level of urban and rural ecological resilience. Based on the above analysis, the actual situation in Yunnan Province was considered in this study to formulate relevant collaborative governance strategies.
Author Contributions
Funding
Institutional Review Board Statement
Informed Consent Statement
Data Availability Statement
Conflicts of Interest
References
- United Nations Website. UN-Habitat: Urbanization Remains Unstoppable, with 68% of the Global Urban Population by 2050. Available online: https://news.un.org/zh/story/2022/06/1105282 (accessed on 13 September 2023).
- Das, M.; Das, A.; Saikh, S. Estimating supply-demand mismatches for optimization of sustainable land use planning in a rapidly growing urban agglomeration (India). Land Use Policy 2024, 139, 107061. [Google Scholar] [CrossRef]
- Hamnett, C. Is Chinese urbanisation unique? Urban Stud. 2020, 57, 690–700. [Google Scholar] [CrossRef]
- Pan, J.; Gao, S.; Li, Q.; Wang, J.; Wu, D.; Huang, C. Beautiful China: 70 Years Since 1949 and 70 People’s Views on Eco-Civilization Construction; Springer: New York, NY, USA, 2021. [Google Scholar] [CrossRef]
- China Statistical Yearbook Website. Available online: https://www.stats.gov.cn/sj/ndsj/ (accessed on 13 September 2023).
- Penazzi, S.; Accorsi, R.; Manzini, R. Planning low carbon urban-rural ecosystems: An integrated transport land-use model. J. Clean. Prod. 2019, 235, 96–111. [Google Scholar] [CrossRef]
- Ye, C.; Liu, Z.M. Rural-urban co-governance: Multi-scale practice. Sci. Bull. 2020, 65, 778–780. [Google Scholar] [CrossRef] [PubMed]
- Chen, M.X.; Zhou, Y.; Huang, X.R.; Ye, C. The Integration of New-Type Urbanization and Rural Revitalization Strategies in China: Origin, Reality and Future Trends. Land 2021, 10, 207. [Google Scholar] [CrossRef]
- Zhou, D.; Qi, J.L.; Zhong, W.Y. Review of urban-rural integration evaluation: Connotation identification, theoretical analysis, and system reconstruction. J. Nat. Resour. 2021, 36, 2634–2651. [Google Scholar] [CrossRef]
- Baffoe, G. Rural-urban studies: A macro analyses of the scholarship terrain. Habitat Int. 2020, 98, 102156. [Google Scholar] [CrossRef]
- Pan, W.; Wang, J.; Li, Y.R.; Chen, S.T.; Lu, Z. Spatial pattern of urban-rural integration in China and the impact of geography. Geogr. Sustain. 2023, 4, 404–413. [Google Scholar] [CrossRef]
- Zhang, Y.X.; Shao, X.W. Research on the measurement, evaluation and development path of urban-rural integration development level in Jilin Province. Agric. Econ. 2022, 2, 96–98. [Google Scholar] [CrossRef]
- Baffoe, G.; Zhou, X.; Moinuddin, M.; Somanje, A.N.; Kuriyama, A.; Mohan, G.; Saito, O.; Takeuchi, K. Urban-rural linkages: Effective solutions for achieving sustainable development in Ghana from an SDG interlinkage perspective. Sustain. Sci. 2021, 16, 1341–1362. [Google Scholar] [CrossRef]
- Somanje, A.N.; Mohan, G.; Lopes, J.; Mensah, A.; Gordon, C.; Zhou, X.; Moinuddin, M.; Saito, O.; Takeuchi, K. Challenges and Potential Solutions for Sustainable Urban-Rural Linkages in a Ghanaian Context. Sustainability 2020, 12, 507. [Google Scholar] [CrossRef]
- Liu, N.A.; Wang, S.Q.; Su, F.; Ye, J. Research on Coupling Coordination of China’s New-Type Urbanization and Urban Resilience-Taking Yangtze River Economic Belt as an Example. Sustainability 2023, 15, 456. [Google Scholar] [CrossRef]
- Leal, O.J.U.; Fekete, A.; Eudave, R.R.; Matos, J.C.; Sousa, H.; Teixeira, E.R. A Systematic Review of Integrated Frameworks for Resilience and Sustainability Assessments for Critical Infrastructures. Struct. Eng. Int. 2024, 34, 266–280. [Google Scholar] [CrossRef]
- Cimellaro, G.P.; Reinhorn, A.M.; Bruneau, M. Framework for analytical quantification of disaster resilience. Eng. Struct. 2010, 32, 3639–3649. [Google Scholar] [CrossRef]
- Holling, C.S. Resilience and stability of ecological systems. Annu. Rev. Ecol. Syst. 1973, 4, 1–23. [Google Scholar] [CrossRef]
- Li, T.Y. New Progress in Study on Resilient Cities. Urban Plan. Int. 2017, 32, 15–25. Available online: https://www.upi-planning.org.cn/Magazine/Issue_Content.aspx?ID=47161 (accessed on 2 July 2024). [CrossRef]
- Moser, S.; Meerow, S.; Arnott, J.; Jack-Scott, E. The turbulent world of resilience: Interpretations and themes for transdisciplinary dialogue. Clim. Chang. 2019, 153, 21–40. [Google Scholar] [CrossRef]
- Bush, J.; Doyon, A. Building urban resilience with nature-based solutions: How can urban planning contribute? Cities 2019, 95, 102483. [Google Scholar] [CrossRef]
- Cutter, S.L.; Ash, K.D.; Emrich, C.T. The geographies of community disaster resilience. Glob. Environ. Chang. Hum. Policy Dimens. 2014, 29, 65–77. [Google Scholar] [CrossRef]
- Chelleri, L.; Waters, J.J.; Olazabal, M.; Minucci, G. Resilience trade-offs: Addressing multiple scales and temporal aspects of urban resilience. Environ. Urban. 2015, 27, 181–198. [Google Scholar] [CrossRef]
- Büyüközkan, G.; Ilicak, Ö.; Feyzioglu, O. A review of urban resilience literature. Sustain. Cities Soc. 2022, 77, 103579. [Google Scholar] [CrossRef]
- Zhao, R.; Fang, C.; Liu, J.; Zhang, L. The evaluation and obstacle analysis of urban resilience from the multidimensional perspective in Chinese cities. Sustain. Cities Soc. 2022, 86, 104160. [Google Scholar] [CrossRef]
- McPhearson, T.; Cook, E.M.; Berbes-Blazquez, M.; Cheng, C.W.; Grimm, N.B.; Anderson, E.; Barbosa, O.; Chandler, D.G.; Chang, H.J.; Chester, M.V.; et al. A social-ecological-technological systems framework for urban ecosystem services. One Earth 2022, 5, 505–518. [Google Scholar] [CrossRef]
- Smith, G.; Nandwani, D.; Kankarla, V. Facilitating resilient rural-to-urban sustainable agriculture and rural communities. Int. J. Sustain. Dev. World Ecol. 2017, 24, 485–501. [Google Scholar] [CrossRef]
- Zhou, J.Z.; Hou, Q.H. Resilience assessment and planning of suburban rural settlements based on complex network. Sustain. Prod. Consum. 2021, 28, 1645–1662. [Google Scholar] [CrossRef]
- Chen, Z. Resilient Rural Construction under Urban-Rural lntegration: Logical lmplications, Action Processes, and Strategic Approaches. J. Humanit. 2023, 9, 113–121. [Google Scholar] [CrossRef]
- Shi, C.C.; Zhu, X.P.; Wu, H.W.; Li, Z.H. Urbanization Impact on Regional Sustainable Development: Through the Lens of Urban-Rural Resilience. Int. J. Environ. Res. Public Health 2022, 19, 15407. [Google Scholar] [CrossRef]
- Bo, J.S.; Wang, Y.T.; Bo, T.; Chen, Y.N. Research progress of resilient city and suggestions for resilient urban and rural construction. World Earthq. Eng. 2022, 38, 90–100. [Google Scholar] [CrossRef]
- Wu, W.X.; Wu, Y.M. Research on Measurement of Urban-Rural Resilience Level and Integrated Development-Empirical Experience from Three Provinces and One Municipal in the Yangtze River Delta. World Agric. 2022, 32, 106–119. [Google Scholar] [CrossRef]
- Díaz-López, C.; Verichev, K.; Holgado-Terriza, J.A.; Zamorano, M. Evolution of climate zones for building in Spain in the face of climate change. Sustain. Cities Soc. 2021, 74, 103223. [Google Scholar] [CrossRef]
- Xiao, D.Q.; Xu, X.C. Investigating interaction pattern between urban-rural integration and transport network: A dynamic evolution model. PLoS ONE 2022, 17, e0266063. [Google Scholar] [CrossRef] [PubMed]
- Tomal, M. Evaluation of coupling coordination degree and convergence behaviour of local development: A spatiotemporal analysis of all Polish municipalities over the period 2003–2019. Sustain. Cities Soc. 2021, 71, 102992. [Google Scholar] [CrossRef]
- Diamond, S.E.; Martin, R.A. Evolution in Cities. Annu. Rev. Ecol. Evol. Syst. 2021, 52, 519–540. [Google Scholar] [CrossRef]
- Des Roches, S.; Brans, K.I.; Lambert, M.R.; Rivkin, L.R.; Savage, A.M.; Schell, C.J.; Correa, C.; De Meester, L.; Diamond, S.E.; Grimm, N.B.; et al. Socio-eco-evolutionary dynamics in cities. Evol. Appl. 2021, 14, 248–267. [Google Scholar] [CrossRef] [PubMed]
- Tang, L.D.; Liang, G.D.; Gu, G.H.; Xu, J.; Duan, L.; Zhang, X.Y.; Yang, X.X.; Lu, R.C. Study on the spatial-temporal evolution characteristics, patterns, and driving mechanisms of ecological environment of the Ecological Security Barriers on China’s Land Borders. Environ. Impact Assess. Rev. 2023, 103, 107267. [Google Scholar] [CrossRef]
- Beck, H.E.; McVicar, T.R.; Vergopolan, N.; Berg, A.; Lutsko, N.J.; Dufour, A.; Zeng, Z.; Jiang, X.; van Dijk, A.I.; Miralles, D.G.J.S.d. High-resolution (1 km) Köppen-Geiger maps for 1901–2099 based on constrained CMIP6 projections. Sci. Data 2023, 10, 724. [Google Scholar] [CrossRef]
- Xie, X.L.; Zhou, G.A.; Yu, S.B. Study on Rural Ecological Resilience Measurement and Optimization Strategy Based on PSR-“Taking Weiyuan in Gansu Province as an Example”. Sustainability 2023, 15, 5462. [Google Scholar] [CrossRef]
- Liu, D.R.; Yang, K.; Sun, S. Spatio-temporal Dvnamic Characteristics of Digital Economy and Urban Ecological Resilience and its Coupling Coordination: An Empirical Analysis in the Pearl River Delta Region. West Forum Econ. Manag. 2023, 34, 1–14+99. [Google Scholar] [CrossRef]
- Liu, X.X.; Li, Z.F.; Guo, B.C. The measurement, spatial variation and agglomeration characteristics of the ecological civilization construction in the provinces in China. J. Hainan Univ. Humanit. Soc. Sci. 2024, 42, 75–84. [Google Scholar] [CrossRef]
- Liu, Y. Study on Youxian Rural Ecological Environmental Evaluation. Master’s Thesis, Central South University of Forestry and Technology, Changsha, China, 2020. [Google Scholar] [CrossRef]
- Perera, E.; Jayawardana, D.; Jayasinghe, P.; Ranagalage, M. Landslide vulnerability assessment based on entropy method: A case study from Kegalle district, Sri Lanka. Model. Earth Syst. Environ. 2019, 5, 1635–1649. [Google Scholar] [CrossRef]
- Birgani, Y.T.; Yazdandoost, F. An Integrated Framework to Evaluate Resilient-Sustainable Urban Drainage Management Plans Using a Combined-adaptive MCDM Technique. Water Resour. Manag. 2018, 32, 2817–2835. [Google Scholar] [CrossRef]
- Yang, X.; Guo, Y.; Liu, Q.; Zhang, D.M. Dynamic Co-evolution analysis of low-carbon technology innovation compound system of new energy enterprise based on the perspective of sustainable development. J. Clean. Prod. 2022, 349, 131330. [Google Scholar] [CrossRef]
- Yang, Z.W.; Liu, J.L.; Xing, Q.F. Evaluation of synergy between low-carbon development and socio-economic development based on a composite system: A case study of Anhui Province (China). Sci. Rep. 2022, 12, 20294. [Google Scholar] [CrossRef] [PubMed]
- Xin, Y.; Liu, X.Y. Coupling driving factors of eco-environmental protection and high-quality development in the yellow river basin. Front. Environ. Sci. 2022, 10, 951218. [Google Scholar] [CrossRef]
- Wang, J.F.; Xu, C.D. Geodetector: Principle and prospective. Acta Geogr. Sin. 2017, 72, 116–134. [Google Scholar] [CrossRef]
- Li, M.R.; Abuduwailia, J.; Liu, W.; Feng, S.; Saparov, G.; Ma, L. Application of geographical detector and geographically weighted regression for assessing landscape ecological risk in the Irtysh River Basin, Central Asia. Ecol. Indic. 2024, 158, 111540. [Google Scholar] [CrossRef]


| Composite Layer | System Layer | Subsystem Layer | Index Layer | Meaning of Indicators | Direction | |
|---|---|---|---|---|---|---|
| Comprehensive measurement system for coordinated development level of urban–rural ecological resilience | Urban ecological resilience system | Natural ecological environment | C1 | Population density | Ecological impact level | (−) |
| C2 | Urban sewage discharge | (−) | ||||
| C3 | Industrial wastewater emissions | (−) | ||||
| C4 | General industrial solid waste production | (−) | ||||
| C5 | Industrial sulfur dioxide emissions | (−) | ||||
| C6 | Proportion of built-up land area | (−) | ||||
| Protection of environmental resources | C7 | Per capita public green space area | Ecological adaptability level | (+) | ||
| C8 | Green coverage rate of built-up area | (+) | ||||
| C9 | Green coverage area of built-up area | (+) | ||||
| C10 | Total water resources per capita | (+) | ||||
| Ecological environment governance capacity | C11 | Per capita water supply | Ecological resilience level | (+) | ||
| C12 | Urban sewage treatment rate | (+) | ||||
| C13 | General industrial solid waste comprehensive utilization rate | (+) | ||||
| C14 | Industrial waste gas treatment facilities’ processing capacity | (+) | ||||
| C15 | Per capita GDP | (+) | ||||
| Rural ecological resilience system | Natural ecological environment | V1 | Fertilizer consumption | Ecological impact level | (−) | |
| V2 | Pesticide usage | (−) | ||||
| V3 | Agricultural plastic film usage | (−) | ||||
| V4 | Total agricultural water consumption | (−) | ||||
| V5 | Total domestic water consumption | (−) | ||||
| V6 | The proportion of agricultural intermediate consumption in total output value | (−) | ||||
| Protection of environmental resources | V7 | Per capita cultivated land area | Ecological adaptability level | (+) | ||
| V8 | Garden area | (+) | ||||
| V9 | Reservoir capacity | (+) | ||||
| V10 | Waters and water conservancy facilities land area | (+) | ||||
| Ecological environment governance capacity | V11 | Per capita afforestation area | Ecological resilience level | (+) | ||
| V12 | Effective irrigation area | (+) | ||||
| V13 | Per capita net income of farmers | (+) | ||||
| V14 | Total agricultural output value | (+) | ||||
| V15 | The proportion of primary industry in GDP | (+) | ||||
| Level of Synergy | No Collaboration | Reluctant Collaboration | Primary Collaboration | Intermediate Collaboration | Good Collaboration | High-Quality Collaboration |
|---|---|---|---|---|---|---|
| Degree of synergy | [−1, 0) | [0, 0.2) | [0.2, 0.4) | [0.4, 0.6) | [0.6, 0.8) | [0.8, 1] |
| Subsystem Layer | Urban Ecological Impact Level (0.088) | Urban Ecological Adaptability Level (0.257) | Urban Ecological Resilience Level (0.654) | ||||||||||||
| Index layer weight | C1 | C2 | C3 | C4 | C5 | C6 | C7 | C8 | C9 | C10 | C11 | C12 | C13 | C14 | C15 |
| 0.036 | 0.006 | 0.007 | 0.010 | 0.008 | 0.021 | 0.016 | 0.013 | 0.099 | 0.129 | 0.028 | 0.010 | 0.030 | 0.535 | 0.051 | |
| Subsystem Layer | Rural Ecological Impact Level (0.125) | Rural Ecological Adaptability Level (0.551) | Rural Ecological Resilience Level (0.325) | ||||||||||||
| Index layer weight | V1 | V2 | V3 | V4 | V5 | V6 | V7 | V8 | V9 | V10 | V11 | V12 | V13 | V14 | V15 |
| 0.020 | 0.017 | 0.022 | 0.028 | 0.009 | 0.028 | 0.108 | 0.176 | 0.103 | 0.163 | 0.130 | 0.044 | 0.036 | 0.070 | 0.043 | |
| Year | 2013 | 2016 | 2019 | 2022 | ||||||||
|---|---|---|---|---|---|---|---|---|---|---|---|---|
| Region | Urban | Rural | Type | Urban | Rural | Type | Urban | Rural | Type | Urban | Rural | Type |
| Kunming | 0.318 | 0.331 | U1 < U2 | 0.387 | 0.485 | U1 < U2 | 0.454 | 0.405 | U1 > U2 | 0.549 | 0.491 | U1 > U2 |
| Qujing | 0.333 | 0.373 | U1 < U2 | 0.410 | 0.495 | U1 < U2 | 0.514 | 0.398 | U1 > U2 | 0.529 | 0.417 | U1 > U2 |
| Yuxi | 0.325 | 0.319 | U1 > U2 | 0.434 | 0.470 | U1 < U2 | 0.457 | 0.347 | U1 > U2 | 0.478 | 0.472 | U1 > U2 |
| Baoshan | 0.321 | 0.322 | U1 < U2 | 0.418 | 0.451 | U1 < U2 | 0.496 | 0.461 | U1 > U2 | 0.520 | 0.446 | U1 > U2 |
| Zhaotong | 0.286 | 0.360 | U1 < U2 | 0.424 | 0.493 | U1 < U2 | 0.565 | 0.443 | U1 > U2 | 0.551 | 0.375 | U1 > U2 |
| Lijiang | 0.328 | 0.368 | U1 < U2 | 0.438 | 0.494 | U1 < U2 | 0.442 | 0.418 | U1 > U2 | 0.558 | 0.423 | U1 > U2 |
| Pu’er | 0.346 | 0.297 | U1 > U2 | 0.400 | 0.459 | U1 < U2 | 0.487 | 0.447 | U1 > U2 | 0.452 | 0.403 | U1 > U2 |
| Lincang | 0.362 | 0.330 | U1 > U2 | 0.426 | 0.451 | U1 < U2 | 0.420 | 0.408 | U1 > U2 | 0.504 | 0.499 | U1 > U2 |
| Chuxiong | 0.302 | 0.299 | U1 > U2 | 0.398 | 0.471 | U1 < U2 | 0.500 | 0.445 | U1 > U2 | 0.552 | 0.525 | U1 > U2 |
| Honghe | 0.314 | 0.288 | U1 > U2 | 0.428 | 0.516 | U1 < U2 | 0.515 | 0.434 | U1 > U2 | 0.519 | 0.512 | U1 > U2 |
| Wenshan | 0.345 | 0.297 | U1 > U2 | 0.392 | 0.496 | U1 < U2 | 0.471 | 0.462 | U1 > U2 | 0.575 | 0.478 | U1 > U2 |
| Sipsongpanna | 0.386 | 0.312 | U1 > U2 | 0.484 | 0.470 | U1 > U2 | 0.382 | 0.470 | U1 < U2 | 0.491 | 0.474 | U1 > U2 |
| Dali | 0.311 | 0.310 | U1 > U2 | 0.462 | 0.472 | U1 < U2 | 0.532 | 0.397 | U1 > U2 | 0.473 | 0.511 | U1 < U2 |
| Dehong | 0.379 | 0.366 | U1 > U2 | 0.375 | 0.454 | U1 < U2 | 0.466 | 0.414 | U1 > U2 | 0.476 | 0.534 | U1 < U2 |
| Nujiang | 0.276 | 0.351 | U1 < U2 | 0.403 | 0.510 | U1 < U2 | 0.492 | 0.445 | U1 > U2 | 0.542 | 0.378 | U1 > U2 |
| Diqing | 0.364 | 0.404 | U1 < U2 | 0.406 | 0.456 | U1 < U2 | 0.511 | 0.421 | U1 > U2 | 0.558 | 0.442 | U1 > U2 |
| Maximum | 0.386 | 0.404 | U1 < U2 | 0.484 | 0.516 | U1 < U2 | 0.565 | 0.470 | U1 > U2 | 0.575 | 0.534 | U1 > U2 |
| Minimum | 0.276 | 0.288 | U1 < U2 | 0.375 | 0.451 | U1 < U2 | 0.382 | 0.347 | U1 > U2 | 0.452 | 0.375 | U1 > U2 |
| Average of Yunnan Province | 0.331 | 0.333 | U1 < U2 | 0.418 | 0.478 | U1 < U2 | 0.481 | 0.426 | U1 > U2 | 0.521 | 0.461 | U1 > U2 |
| System Layer | Subsystem Layer | Indicator Layer | Factor Detection Force q Value | ||||
|---|---|---|---|---|---|---|---|
| 2019 | 2020 | 2021 | 2022 | Average | |||
| Urban ecological resilience driving force | Urban ecological impact | Population density (X1) | 0.606 ** | 0.425 ** | 0.263 ** | 0.277 ** | 0.393 |
| Industrial wastewater emissions (X2) | 0.351 ** | 0.213 * | 0.392 ** | 0.402 ** | 0.340 | ||
| Industrial sulfur dioxide emissions (X3) | 0.292 ** | 0.327 ** | 0.524 ** | 0.364 ** | 0.377 | ||
| Proportion of built-up land area (X4) | 0.461 ** | 0.371 ** | 0.191 ** | 0.201 ** | 0.306 | ||
| Urban ecological adaptability | Per capita public green space area (X5) | 0.309 ** | 0.248 ** | 0.215 ** | 0.532 ** | 0.326 | |
| Green coverage rate of built-up area (X6) | 0.389 ** | 0.461 ** | 0.219 ** | 0.277 ** | 0.336 | ||
| Green coverage area of built-up area (X7) | 0.585 ** | 0.540 ** | 0.611 ** | 0.501 ** | 0.559 | ||
| Total water resources per capita (X8) | 0.382 ** | 0.341 ** | 0.588 ** | 0.508 ** | 0.455 | ||
| Urban ecological resilience | Per capita water supply (X9) | 0.322 ** | 0.212 ** | 0.183 ** | 0.207 ** | 0.231 | |
| Urban sewage treatment rate (X10) | 0.126 * | 0.174 ** | 0.553 ** | 0.411 ** | 0.316 | ||
| General industrial solid waste comprehensive utilization rate (X11) | 0.139 ** | 0.196 ** | 0.185 ** | 0.221 ** | 0.185 | ||
| Driving force of rural ecological resilience | Rural ecological impact | Fertilizer consumption (X12) | 0.523 ** | 0.510 ** | 0.601 ** | 0.662 ** | 0.574 |
| Pesticide usage (X13) | 0.383 ** | 0.314 ** | 0.522 ** | 0.601 ** | 0.455 | ||
| Agricultural plastic film usage (X14) | 0.530 ** | 0.551 ** | 0.601 ** | 0.599 ** | 0.570 | ||
| Total agricultural water consumption (X15) | 0.502 ** | 0.387 ** | 0.539 ** | 0.598 ** | 0.506 | ||
| Total domestic water consumption (X16) | 0.574 ** | 0.467 ** | 0.667 ** | 0.705 ** | 0.603 | ||
| The proportion of agricultural intermediate consumption in total output value (X17) | 0.268 ** | 0.172 * | 0.311 ** | 0.399 ** | 0.288 | ||
| Rural ecological adaptability | Per capita cultivated land area (X18) | 0.472 ** | 0.461 ** | 0.380 ** | 0.335 ** | 0.412 | |
| Garden area (X19) | 0.352 ** | 0.461 ** | 0.536 ** | 0.564 ** | 0.478 | ||
| Reservoir capacity (X20) | 0.552 ** | 0.489 ** | 0.666 ** | 0.487 ** | 0.549 | ||
| Rural ecological resilience | Effective irrigation area (X21) | 0.658 ** | 0.540 ** | 0.564 ** | 0.593 ** | 0.589 | |
| Per capita net income of farmers (X22) | 0.499 ** | 0.447 ** | 0.508 ** | 0.529 ** | 0.496 | ||
| Total agricultural output value (X23) | 0.507 ** | 0.531 ** | 0.651 ** | 0.561 ** | 0.563 | ||
Disclaimer/Publisher’s Note: The statements, opinions and data contained in all publications are solely those of the individual author(s) and contributor(s) and not of MDPI and/or the editor(s). MDPI and/or the editor(s) disclaim responsibility for any injury to people or property resulting from any ideas, methods, instructions or products referred to in the content. |
© 2024 by the authors. Licensee MDPI, Basel, Switzerland. This article is an open access article distributed under the terms and conditions of the Creative Commons Attribution (CC BY) license (https://creativecommons.org/licenses/by/4.0/).
Share and Cite
Zhou, Y.; Wang, Y.; Fang, S.; Tian, Y.; Zhu, Y.; Han, L. The Synergistic Effect of Urban and Rural Ecological Resilience: Dynamic Trends and Drivers in Yunnan. Sustainability 2024, 16, 8285. https://doi.org/10.3390/su16198285
Zhou Y, Wang Y, Fang S, Tian Y, Zhu Y, Han L. The Synergistic Effect of Urban and Rural Ecological Resilience: Dynamic Trends and Drivers in Yunnan. Sustainability. 2024; 16(19):8285. https://doi.org/10.3390/su16198285
Chicago/Turabian StyleZhou, Ying, Yanwei Wang, Shuhong Fang, Yixi Tian, Yujia Zhu, and Lihong Han. 2024. "The Synergistic Effect of Urban and Rural Ecological Resilience: Dynamic Trends and Drivers in Yunnan" Sustainability 16, no. 19: 8285. https://doi.org/10.3390/su16198285
APA StyleZhou, Y., Wang, Y., Fang, S., Tian, Y., Zhu, Y., & Han, L. (2024). The Synergistic Effect of Urban and Rural Ecological Resilience: Dynamic Trends and Drivers in Yunnan. Sustainability, 16(19), 8285. https://doi.org/10.3390/su16198285