Article

A Multivariate Model and Correlation Study on the Impact of Typical Residential Spatial Forms in the Middle Reaches of the Hanjiang River on the Thermal Environment and Thermal Comfort

1
School of Architecture, Xi’an University of Architecture and Technology, Xi’an 710055, China
2
National Key Laboratory of Green Building, Xi’an 710055, China
3
School of Civil and Architectural Engineering, Hubei University of Arts and Sciences, Xiangyang 441000, China
4
Institute for Interdisciplinary and Innovate Research, Xi’an University of Architecture and Technology, Xi’an 710055, China
*
Authors to whom correspondence should be addressed.
Sustainability 2024, 16(19), 8297; https://doi.org/10.3390/su16198297
Submission received: 2 August 2024 / Revised: 14 September 2024 / Accepted: 23 September 2024 / Published: 24 September 2024

Abstract

:
Different spatial forms affect the indoor thermal environment and human thermal comfort. A good living environment largely depends on the flexibility of spatial forms, and spatial scale and proportion are the key factors affecting these forms. We selected typical residential houses in the middle reaches of the Hanjiang River in the hot summer and cold winter climate area as an example. Through on-site measurements and questionnaire surveys, we studied the impact of residential form indicators on the thermal environment and thermal comfort. We also established a multivariate model to explore the correlation among various parameters. The results showed that the spatial-real ratio of the residential spatial form index in the middle reaches of Hanjiang River was 5–58%. The height from the ground was 2.23–6.92 m. The open-space ratio was 0.04–4.55. The explanatory power of the spatial form index to indoor air temperature was 57.5%, with a strong correlation (R2 = 0.675). The explanatory power for humidity was 38.2%, with a weak correlation (R2 = 0.525). The explanatory power of SET was 30.6–50.1%, with a weak correlation (R2 = 0.466). The explanatory power of PMV was 6.5–31.7%, and PMV1.0 was weakly correlated (R2 = 0.474). The explanatory power for PPD was 15.5%, where PPD 1.0 was close to a weak correlation (R2 = 0.508). The results of this study provide reference values for the design methods of and decision-making process for green and energy-saving regional buildings.

1. Introduction

In recent years, energy conservation and emission reduction in the construction industry have received increasing attention. According to statistics, the energy consumption of buildings in China is 1 billion tce, accounting for 21% of the national energy consumption. It is predicted that the proportion will reach 29% by 2040 [1,2]. It is of great significance for research on building energy efficiency to solve energy shortage issues, reduce carbon emissions, and promote sustainable development. Previous studies have shown that the energy efficiency of a passive design strategy can be improved by 20% through spatial form regulation in the early stages of building design, and heating energy consumption and cooling energy consumption can also be reduced by 25% and 10–30% [3], respectively, which would significantly reduce costs compared with the selection of high-performance materials and improvement of active measures.
After thousands of years of trial and error, residents have learned to use local materials to live in a comfortable and low-energy manner while also adapting to climate and environmental changes under conditions of limited energy and technology, which reflects the wisdom of ecological construction technology [4,5]. They not only reflect the microcosm of local residents’ production and life styles but also externalize and express diversified spatial forms with regional characteristics [6,7]. Many studies have confirmed that different spatial forms affect the indoor thermal environment and human thermal comfort [8]. A good living environment largely depends on the flexibility of spatial forms, and spatial size, proportion, and orientation [9,10] are the key factors affecting them. We reference previous studies on the applicability of some spatial form indexes to improve the indoor thermal environment and thermal comfort as references for this study. Conclusions about the impact of indicators, such as the virtual-real ratio [11], the height above the ground [12,13], and the open-space ratio [14], on the thermal environment are more applicable to hot and humid climates. The spatial orientation and virtual-real ratio can effectively regulate temperature and wind speed. The causal relationship and proportion between them can also affect people’s use and communication and interaction [15]. For example, Gratia et al. [16] determined that the difference of heat load between the highest and lowest virtual-real ratio (1.24–0.84) was 18.6%. Ourghi [17] found that it was necessary to use surface area and compactness to represent the openness of spatial form.
The environmental parameters based on human thermal comfort include air temperature (Ta), relative humidity (RH), average radiation temperature, standard effective temperature (SET), actual thermal sensation, and thermal discomfort index [18,19,20,21]. These evaluation indicators are closely related to different spatial forms [22]. Several studies have shown that when indoor temperature and humidity are too high or too low, people feel uncomfortable. They can block strong solar radiation by adjusting spatial layout [23], spatial form [24], spatial interface [25], and plant configuration [26], which can reduce discomfort and enhance the vitality of space utilization to improve the level of the living environment. The SET can even be reduced by 6–10 °C by changing the spatial form [27]. Although previous studies have quantified the impact of building types in different climate zones on improving the indoor thermal environment [28], it may apply to one climate zone, but the impact degree and scope of other climate zones remains unknown. At present, most of the relevant studies have focused on cold [29] and mild climate areas [30], and few relevant studies have examined the middle reaches of Hanjiang River in China, which is a typical hot summer and cold winter climate area. Little research has studied the influence of spatial form, thermal environment, and thermal comfort in the middle reaches of Hanjiang River. Some scholars [31] have suggested that the spatial form of buildings should be quantitatively analyzed and optimized in combination with different regions and types. Therefore, it holds great significance and practical value to study the quantitative relationship between the spatial form of residential buildings in different regional environments, thermal environment, and thermal comfort.
In addition, multiple regression models and correlation analysis feature three main parts: data definition, data transformation, and data analysis. Previous studies have used multiple regression models in data analysis for data calculation, and scientifically and rigorously quantified three types of potentially related topics in the field of architecture, mainly distributed in the analysis of public building energy consumption, urban design, and street vitality. Traditional residential spatial forms also have been gradually explored, such as Zhang Qian’s first use of the SPSS software V 23.0 regression method to analyze the correlation between tunnel spatial characteristics and the indoor and outdoor thermal environment; Yang Tao constructed a relevant indicator system for the architectural and courtyard forms of traditional courtyard houses in Hongcun, Hanzhong, and Hancheng, and analyzed their climate adaptability and application strategies using linear correlation analysis in SPSS software. The specific analysis under different regional climate conditions, however, still needs further study. Correlation analysis has usually used the rank correlation coefficient to represent the degree or direction of linear correlation between variables in terms of classification level.
In this study, we focused on these practical problems, taking typical residential buildings in the middle reaches of the Hanjiang River as the research object. Through on-site measurements and questionnaire surveys, we studied the impact of residential form indicators on the thermal environment and thermal comfort. By quantifying statistics and analyzing data, we explored the mechanisms of mutual influence and explored the explanatory forms and strengths between various combinations of indicators and parameters. We also provided a reference value to promote the development of green and energy-saving design from the perspective of architectural space.

2. Materials and Methods

2.1. Research Methods

Statistically, a relationship involving more than two variables is often expressed as a linear relationship [32]. The technology road map of this study is shown in Figure 1.
According to the rank correlation method, two rank sequences are arranged with related relationships in a certain way, and then Spearman’s formula is used to determine the degree of correlation between the two rank orders. Usually, 0 indicates no correlation between the two, −1 indicates negative correlation, and 1 indicates positive correlation. The closer to −1 or 1, the stronger the correlation.

2.2. Regional Climate and Sample Characteristics

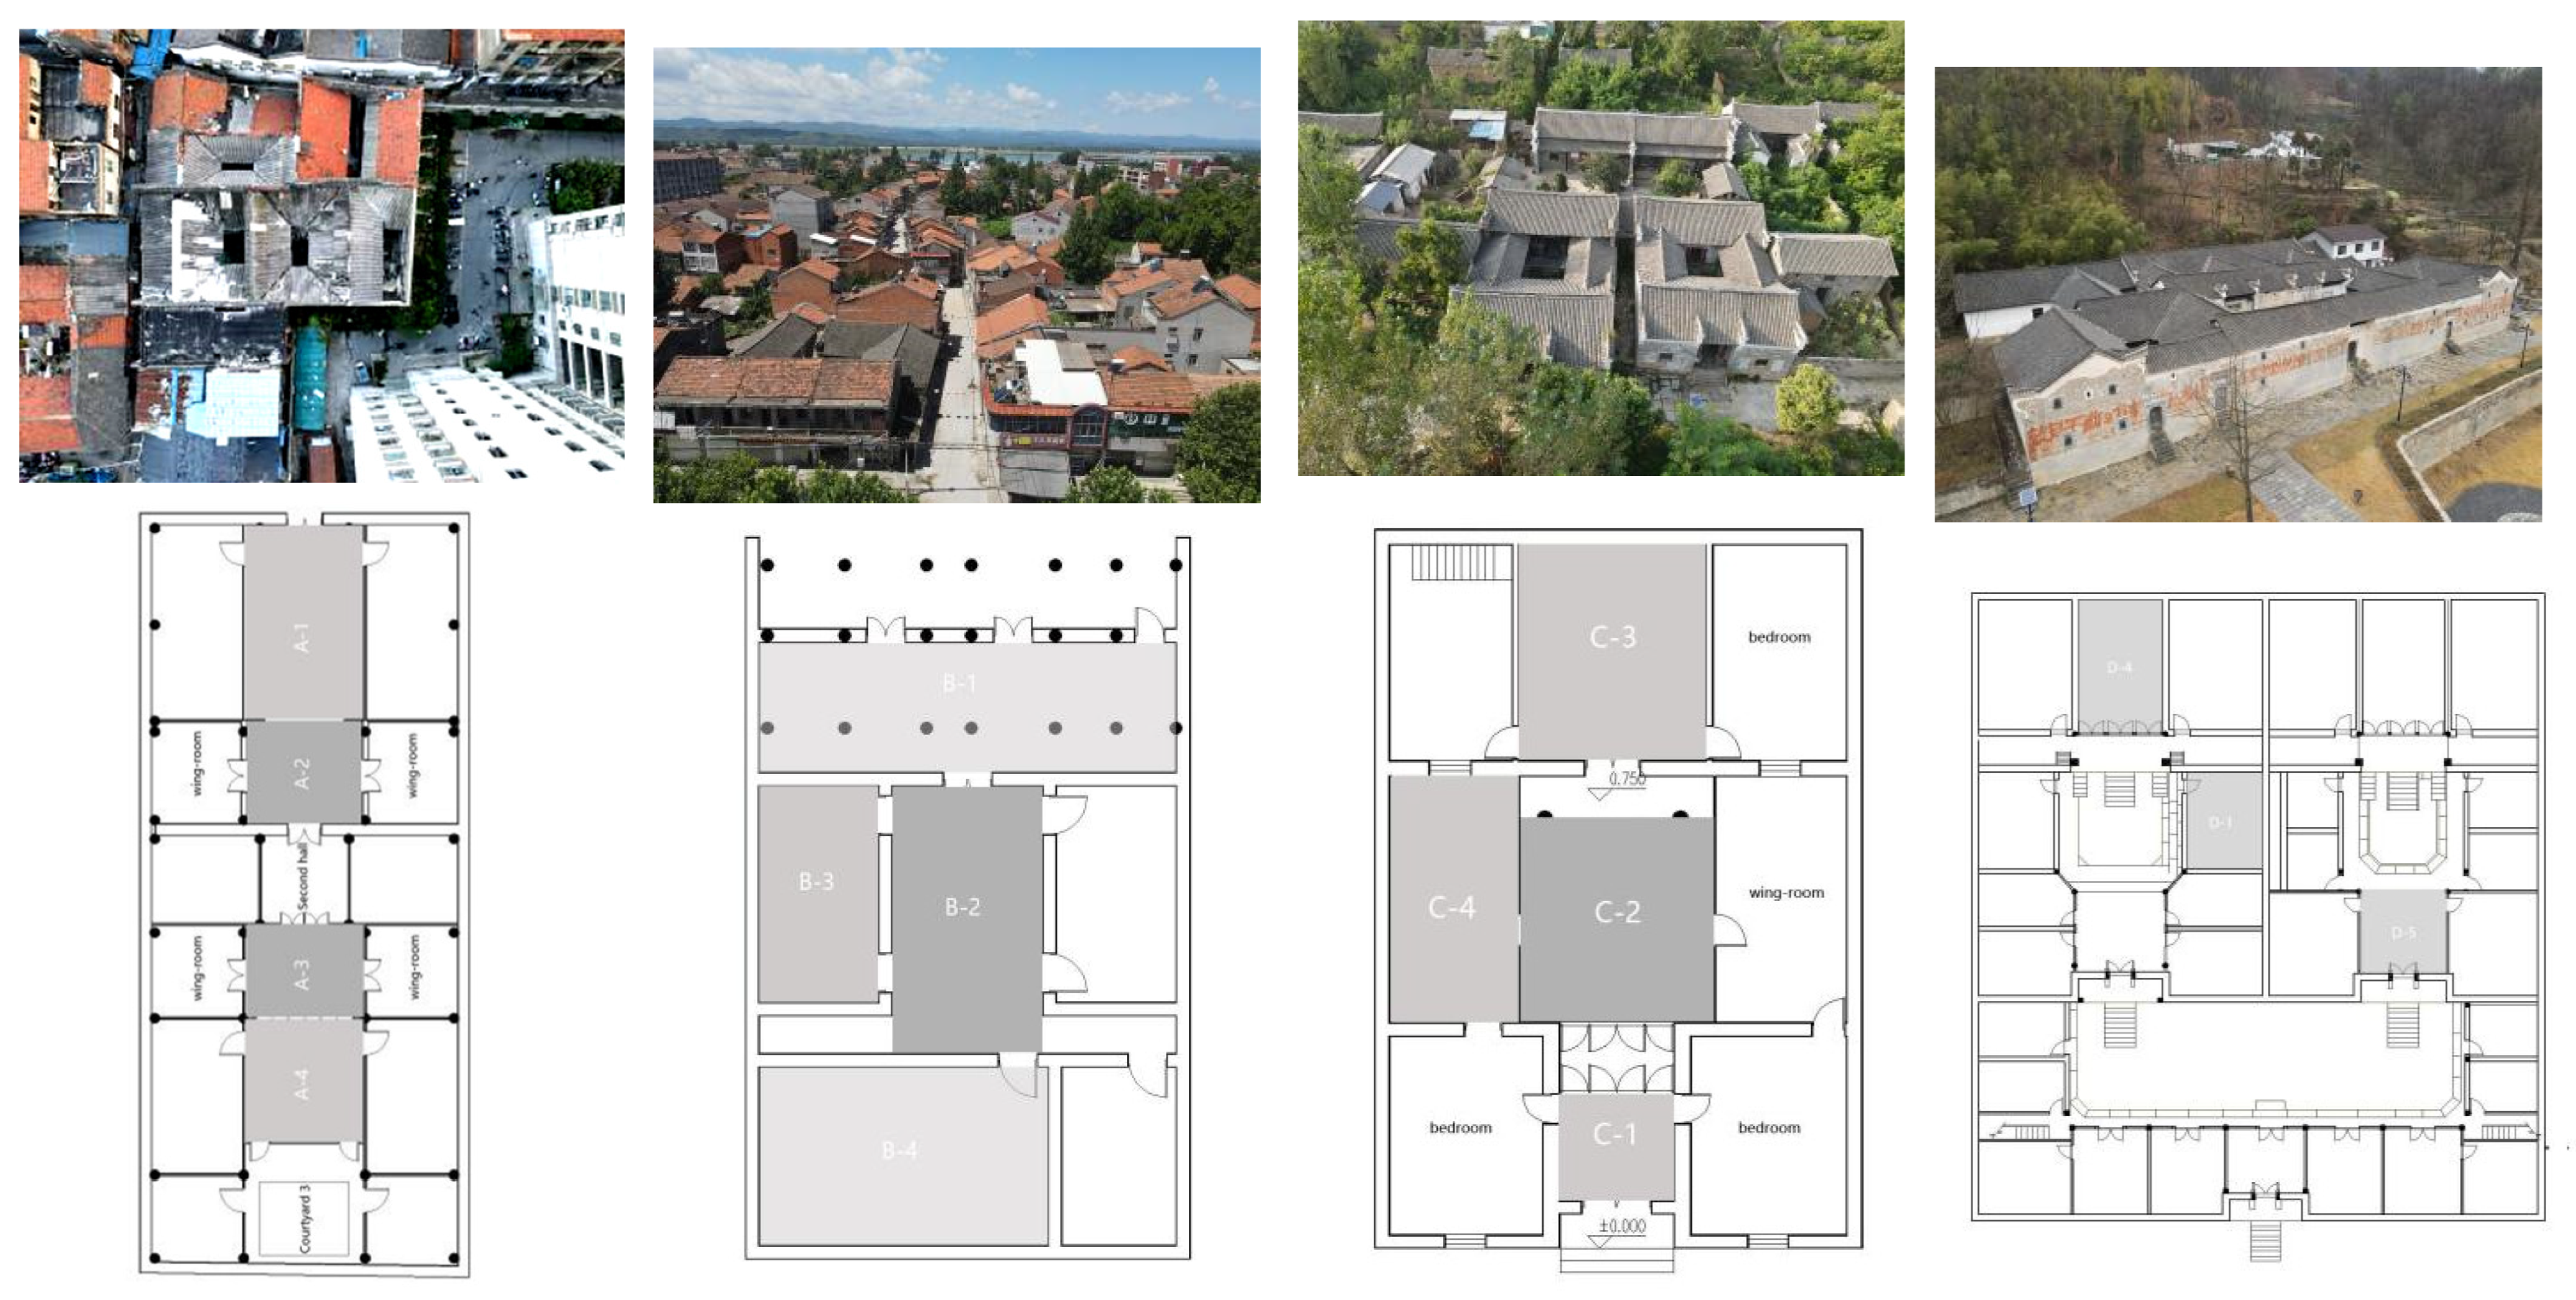
We sourced meteorological data for this study from the National Meteorological Information Center (http://data.cma.cn), accessed on 1 January 2024. The basic outdoor meteorological parameters were provided by the China Building Energy Efficiency Design Basic Data Platform. The Hanjiang River basin belongs to a transition zone of subtropical humid monsoon continental climate, and the seasonal temperature changes significantly. The annual average temperature is 16.7 °C, which follows a fluctuating upward trend. Affected by terrain and other factors, different areas in the same climate zone present different climate environments, and the spatial form characteristics of residential buildings are also different. Therefore, in this study, we took full account of the natural geographic characteristics when selecting samples, including the following research objects: the old street of Xiangyang Chenlao Lane, Ruan Xiangtai’s former residence (sample A), and Taiping Old Street Jiangxi Guild Hall (sample B), which were represented by the hilly land and plains; Qiushi residence (sample C) in Qianwan Town, Zaoyang City, which was mainly hilly; and Feng folk house (sample D) in Banqiao Town, Nanzhang County, which was represented by mountainous area. Details are shown in Figure 2 and Table 1.

2.3. Spatial Form Index

The virtual–solid ratio (VSR) was the ratio between the virtual area (doors and windows) and the solid area (walls) of the facade of residential buildings. Height from ground (HFG) was the distance between the top of a space and the ground. The open-space ratio (OSR) was the ratio of the length of the open space to the total perimeter. The formula is given in Table 2.

2.4. Thermal Environment Parameters and Thermal Comfort Indexes

The thermal comfort parameters were temperature (Ta) and relative humidity (RH), and the wind speed in most rooms was almost 0. Therefore, we did not consider the wind speed. Thermal comfort indicators included SET and predicted mean vote (PMV). Considering the fact that comfort varied from place to place, we also used the thermal discomfort index PPD to evaluate the degree of discomfort. According to the survey, the thermal resistance of clothing worn by local residents in summer was 0.3 clo (typical clothing was short sleeves, trousers, and sandals), and the activity level was 1.0 met (such as sitting), 1.5 met (standing), and 2.0 met (such as walking). Therefore, we selected SET, PMV, and PPD for analysis in this study.

2.5. Test Instruments

The test contents included indoor and outdoor air temperature, relative humidity, wind speed, and black sphere temperature required for the calculation of thermal comfort index. The test period was from 25 June to 18 August 2023, and the recording frequency was once every 10 min. Test instruments and parameters are shown in Table 3. The thermal comfort questionnaire was based on ASHRAE Standard 55-2013 and GB/T50785-2012 [33,34], “Evaluation Standards for Indoor Thermal and Humid Environment of Civil Buildings”.

3. Results

3.1. Spatial Form Index Distribution Characteristics of Residential Buildings

Based on the field survey and mapping data, the morphological index values of 19 typical spaces of the four sample dwellings are shown in Table 4.
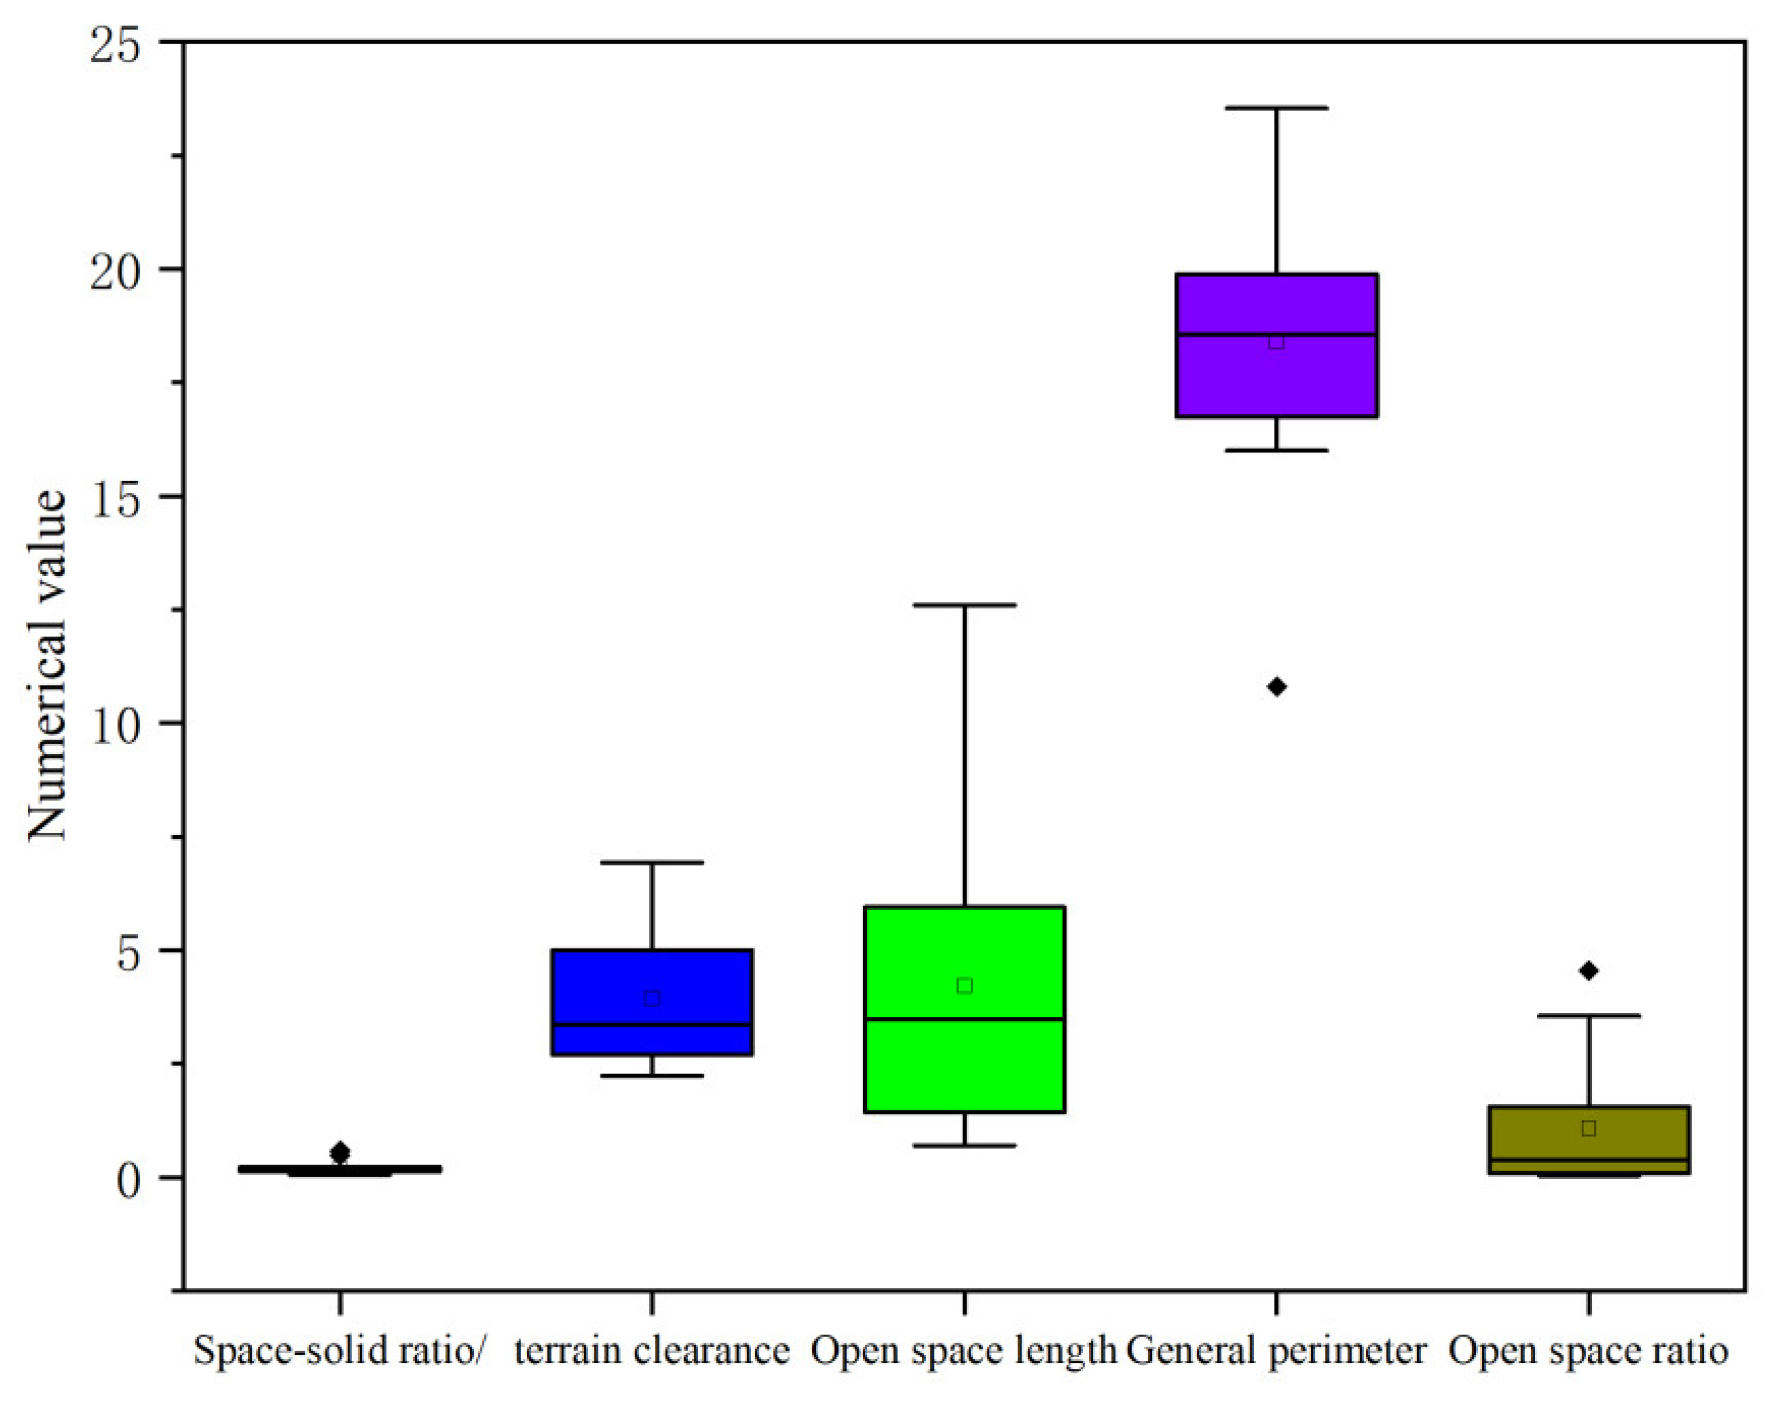
Figure 3 shows the numerical values of various morphological indicators of the spatial interface of the sample residential buildings.
As shown in Figure 3, the values for the morphological indicators were as follows: the average value of the virtual-real ratio was 20%, which ranged from 5% to 58%; the average height above the ground was 3.9 m, which ranged from 2.23 m to 6.92 m; and the average OSR was 1.07, which ranged from 0.04 to 4.55. The results showed that to block the summer radiation and sunshine, the window area of each space was small, the height of the first floor and the attic space of the second floor were appropriately increased, and the local open space was strengthened to improve the air convection to cope with the local environment’s high temperature and high humidity.

3.2. Influence of Spatial Form Index on Indoor and Outdoor Thermal Environment

3.2.1. Measured Thermal Environment on Site

The summer thermal environment characteristics of traditional residential houses in the Hanjiang River Basin are shown in Table 5.
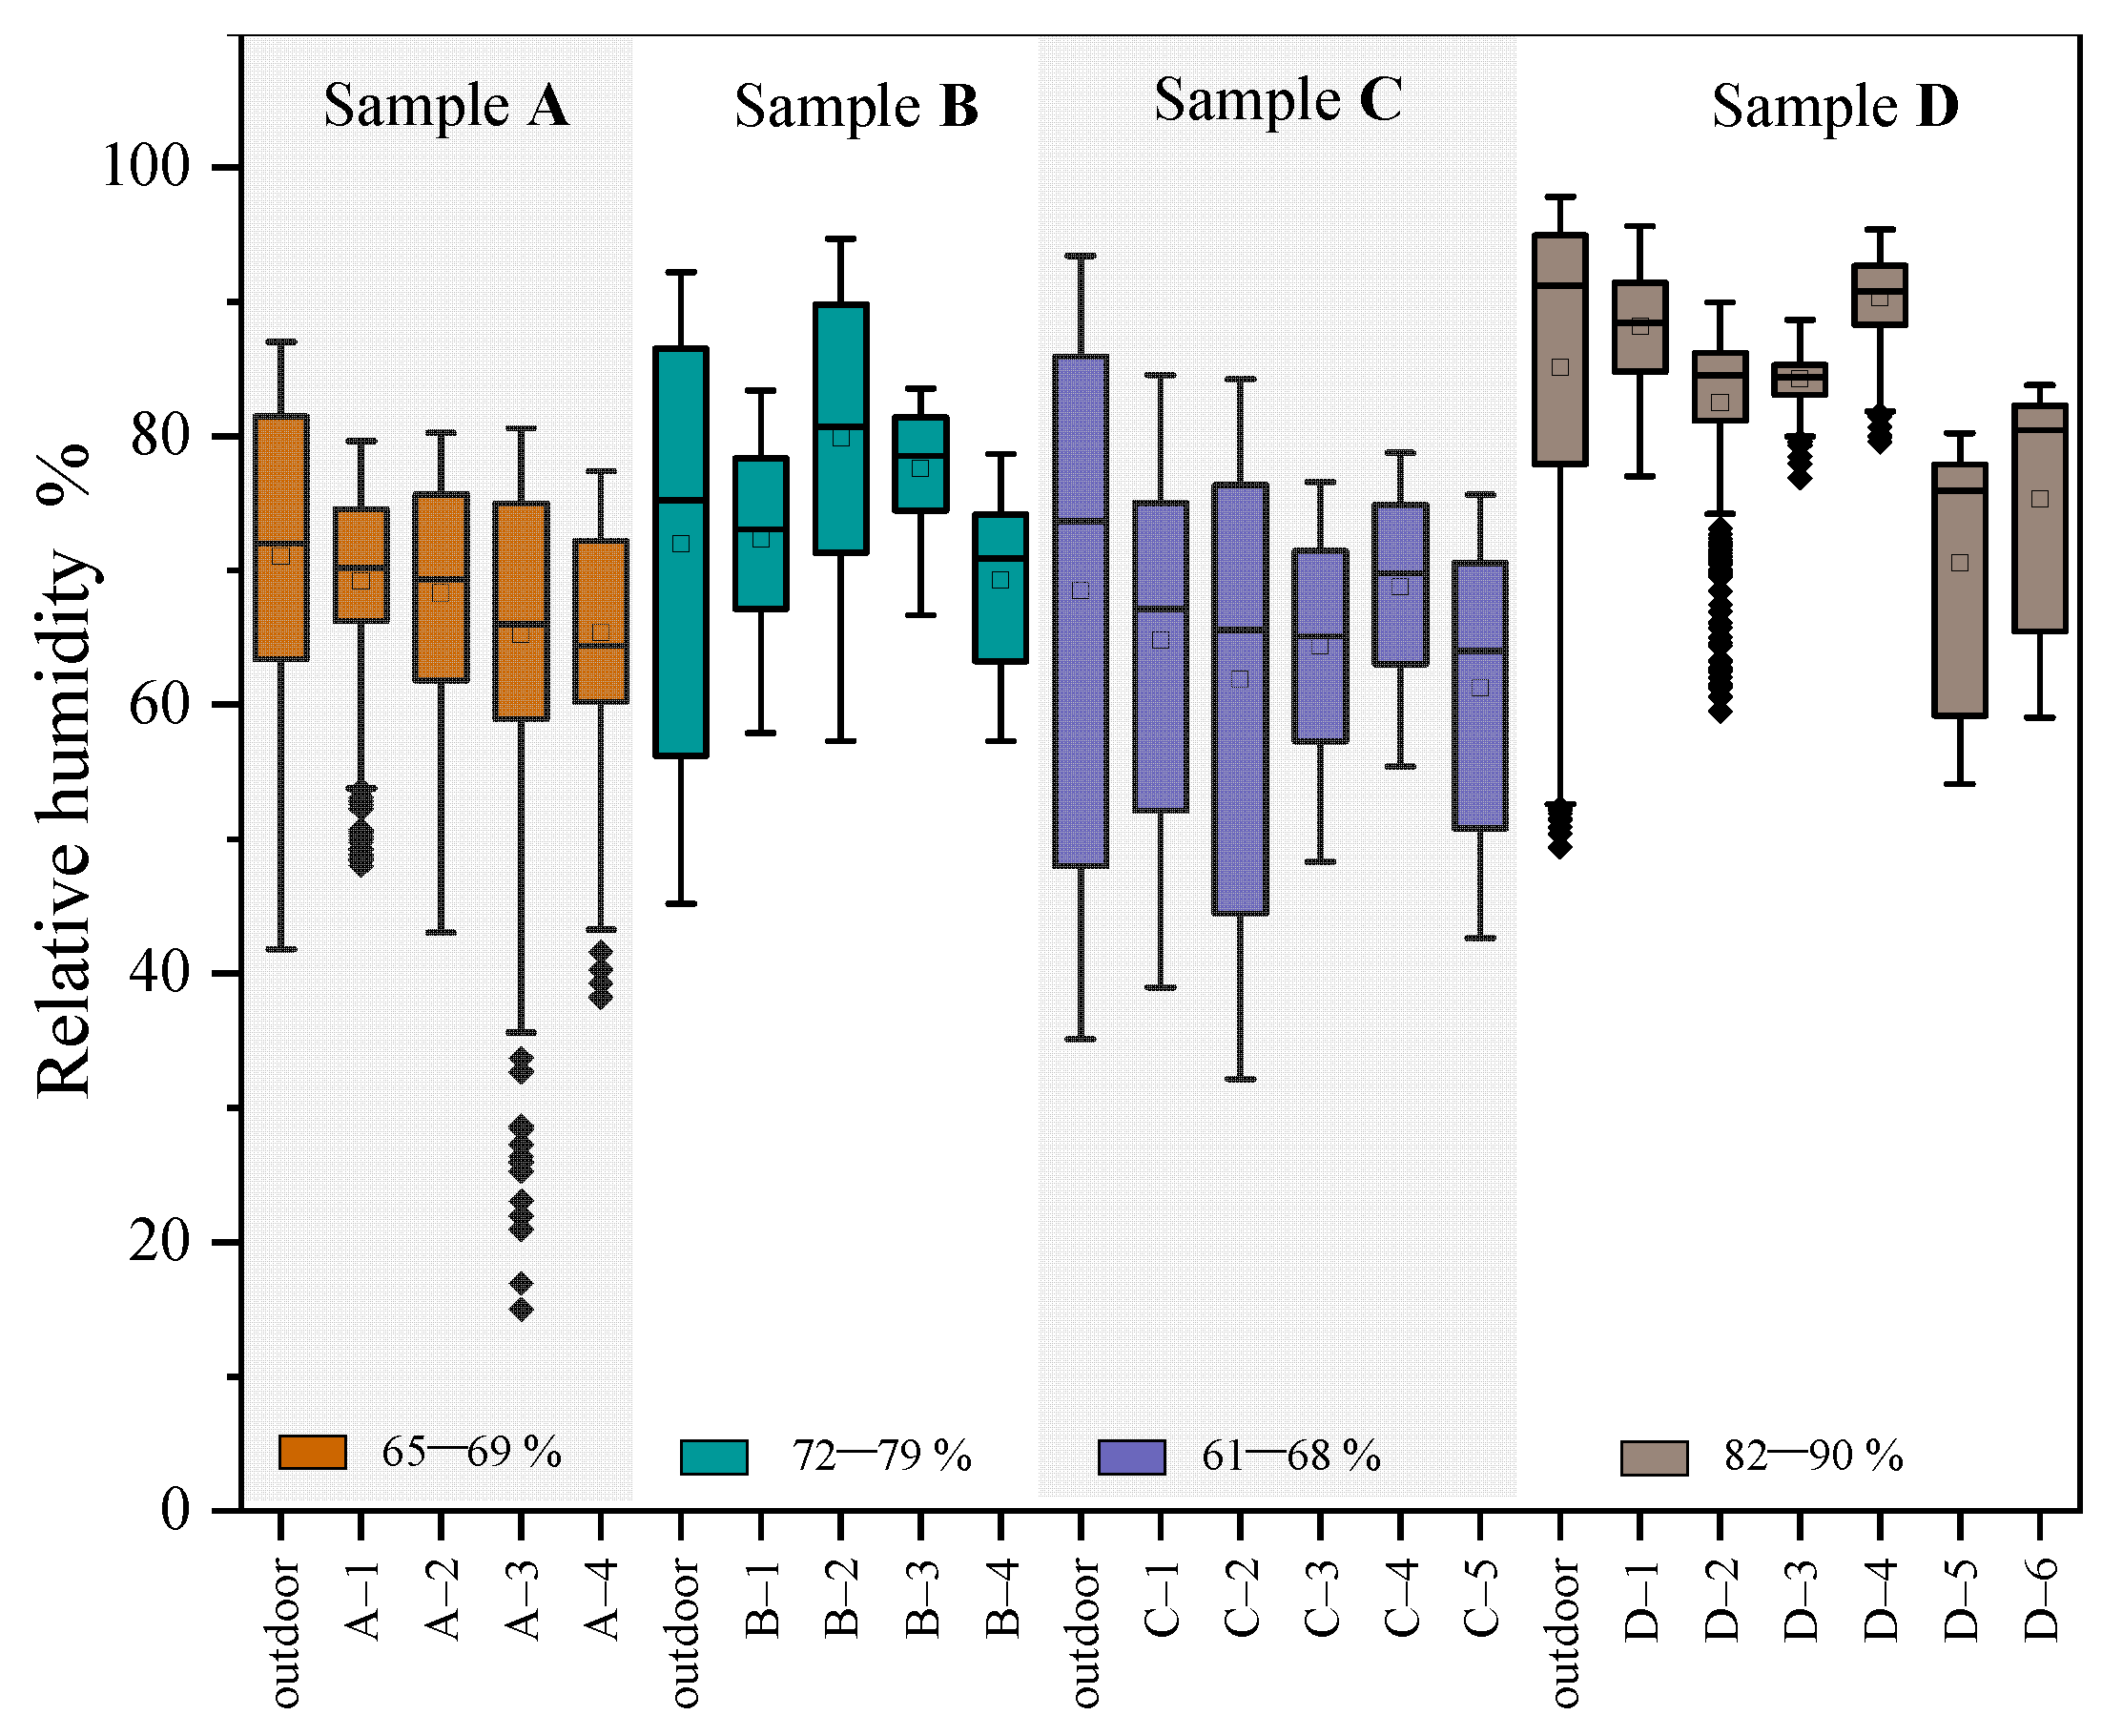
As shown in Table 5, traditional dwellings in the Hanjiang River Basin have the characteristics of high temperature, high humidity, strong radiation, and low wind speed in the summer in a typical climate area with a hot summer and cold winter. Under the action of outdoor climate conditions, 19 typical spatial forms also affected the temperature and humidity changes of the indoor thermal environment. The changing trends in air temperature and relative humidity are shown in Figure 4 and Figure 5, respectively.
We tested samples A–C in August and sample D in June, which showed differences in temperature and humidity as a result of seasonal factors. According to the results shown in Figure 4 and Figure 5, the temperature and humidity range in different spaces was 17.7–35.14 °C, and the temperature difference between the indoor and outdoor space was −2.46 °C–5.47 °C. The relative humidity was 36.07–88.97%. The indoor heterodyne value was between −15.86% and 13.46%.
From this analysis, the following conclusions were drawn: the courtyard was the first gradient to reduce the indoor and outdoor temperature difference; interior walls and shading components were the second gradient; the stratification of the longitudinal space layout caused the temperature difference to gradually increase—that is, the lower the indoor temperature was 1–2 °C. The influence of building height led to higher temperature in the front hall of Jiangxi Guild Hall and the second floor of Qiu family residence. It was obvious that the height, location, and open area of the indoor space was affected by temperature and humidity. For example, the humidity of the wing room was greater (the level of the floor), the humidity of the main room was greater than that of the second floor (the height of the floor was higher), the contact area between the front room and the outside was large, and the entrance was more open.

3.2.2. Multiple Regression Model

We conducted multiple linear regression analysis with VSR, HFG, and OSR as the independent variables, and average air temperature and relative humidity for each of the typical spaces as the dependent variables. The results are shown in Table 6.
The descriptive statistics showed that the average indoor air temperature was 26.15 °C, and the average relative humidity was 72.33%. The abstract of the regression model of air temperature showed that R2 = 0.675, which can be interpreted to mean that the three shape indexes of virtual-real ratio, OSR, and HFG can explain the change in air temperature from 57.8% to 67.5%, which indicated that the change of the shape index had a significant influence on air temperature. The regression model of relative humidity showed that R2 = 0.525, which can be interpreted to mean that the three morphological indexes of VSR, OSR, and HFG can explain 38.2% to 52.5% of the change in air temperature, which indicated that the change in the morphological index had a certain influence on the relative humidity. The results of the significance test showed that the F value = 6.94, p = 0.008 (p-value < 0.05 indicates that a linear correlation between the dependent variable and the independent variable), which indicated that there was a linear correlation between the independent variable of the three morphological indicators and the dependent variable of air temperature. The results of the significance test showed that the F value = 3.679, p-value = 0.051. The regression model can be assumed as follows:
Typical   mean   air   temperature = B 0 ( constant ) + B 1 V S R + B 2 0 S R + B 3 H F G
Typical   mean   air   temperature = 0.798 H F G
The significance test results of the respective variables in the model showed that p < 0.005, which was statistically significant. Because the OSR was p < 0.005, the regression model in this case (no constant was added when the standardized coefficient is used) was as follows:
Typical   spatial   mean   relative   humidity = B 0 + B 1 V S R + B 2 O S R + B 3 H F G
Typical   spatial   mean   relative   humidity = 1.607 H F G
The results of multiple regression analysis of the three indexes of spatial morphology and thermal environment parameters showed that the air temperature increased with an increase in the VR-real area, while the relative humidity decreased. This result showed that the larger the window area of indoor space in the summer, the higher the possibility of outdoor heat flow into the room, and the lower humidity could avoid certain indoor humidity. The HFG was negatively correlated with air temperature and was positively correlated with relative humidity, which indicated that the average temperature of the indoor space decreased and humidity increased with an increase in height. The OSR was positively correlated with mean temperature and relative humidity, which indicated that the more open the space, the stronger the convection and heat transfer effect.

3.2.3. Correlation Analysis

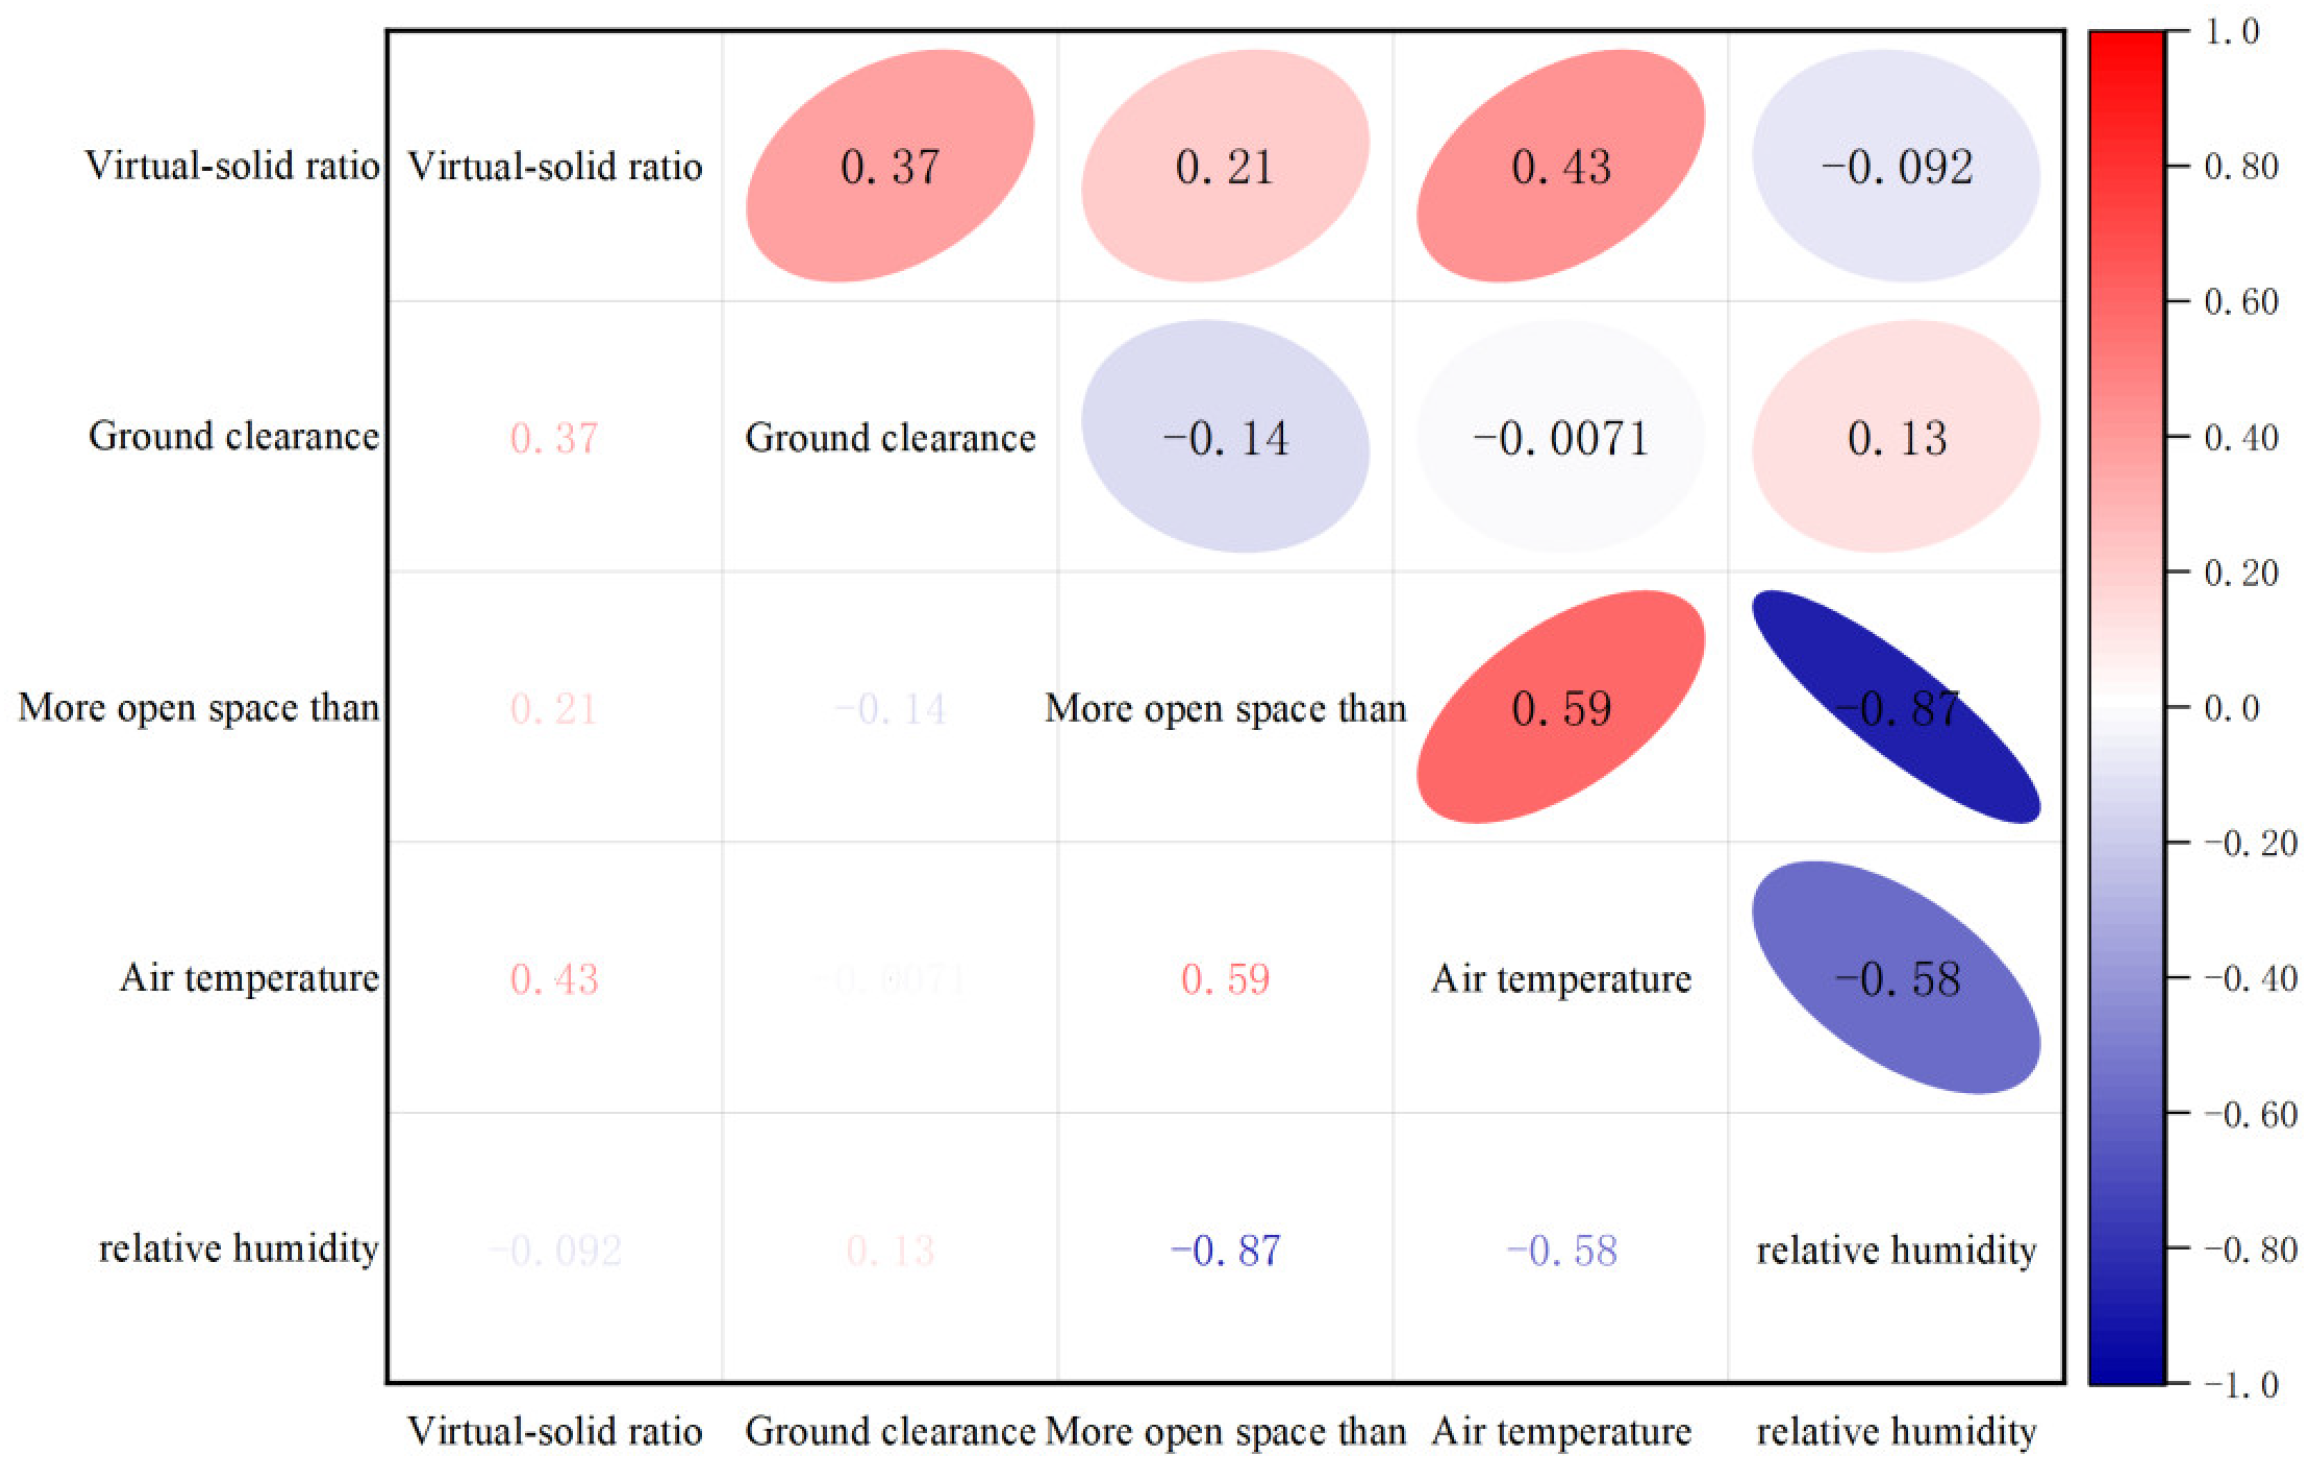
Figure 6 shows the Spearman correlation between spatial form indicators and the indoor thermal environment.
The test results of the Spearman correlation analysis in Figure 6 showed that the significance probability levels of the virtual-real ratio, HFG, OSR, and average temperature were 0.43, −0.0071, and 0.59, respectively; the significance probability levels with relative humidity were −0.092, 0.13, and 0.87, respectively. The significance probability level of the OSR was higher and the other variables were lower.

3.3. Influence of Spatial Form Index on Indoor Thermal Comfort Evaluation Index

3.3.1. Results of Questionnaire Survey

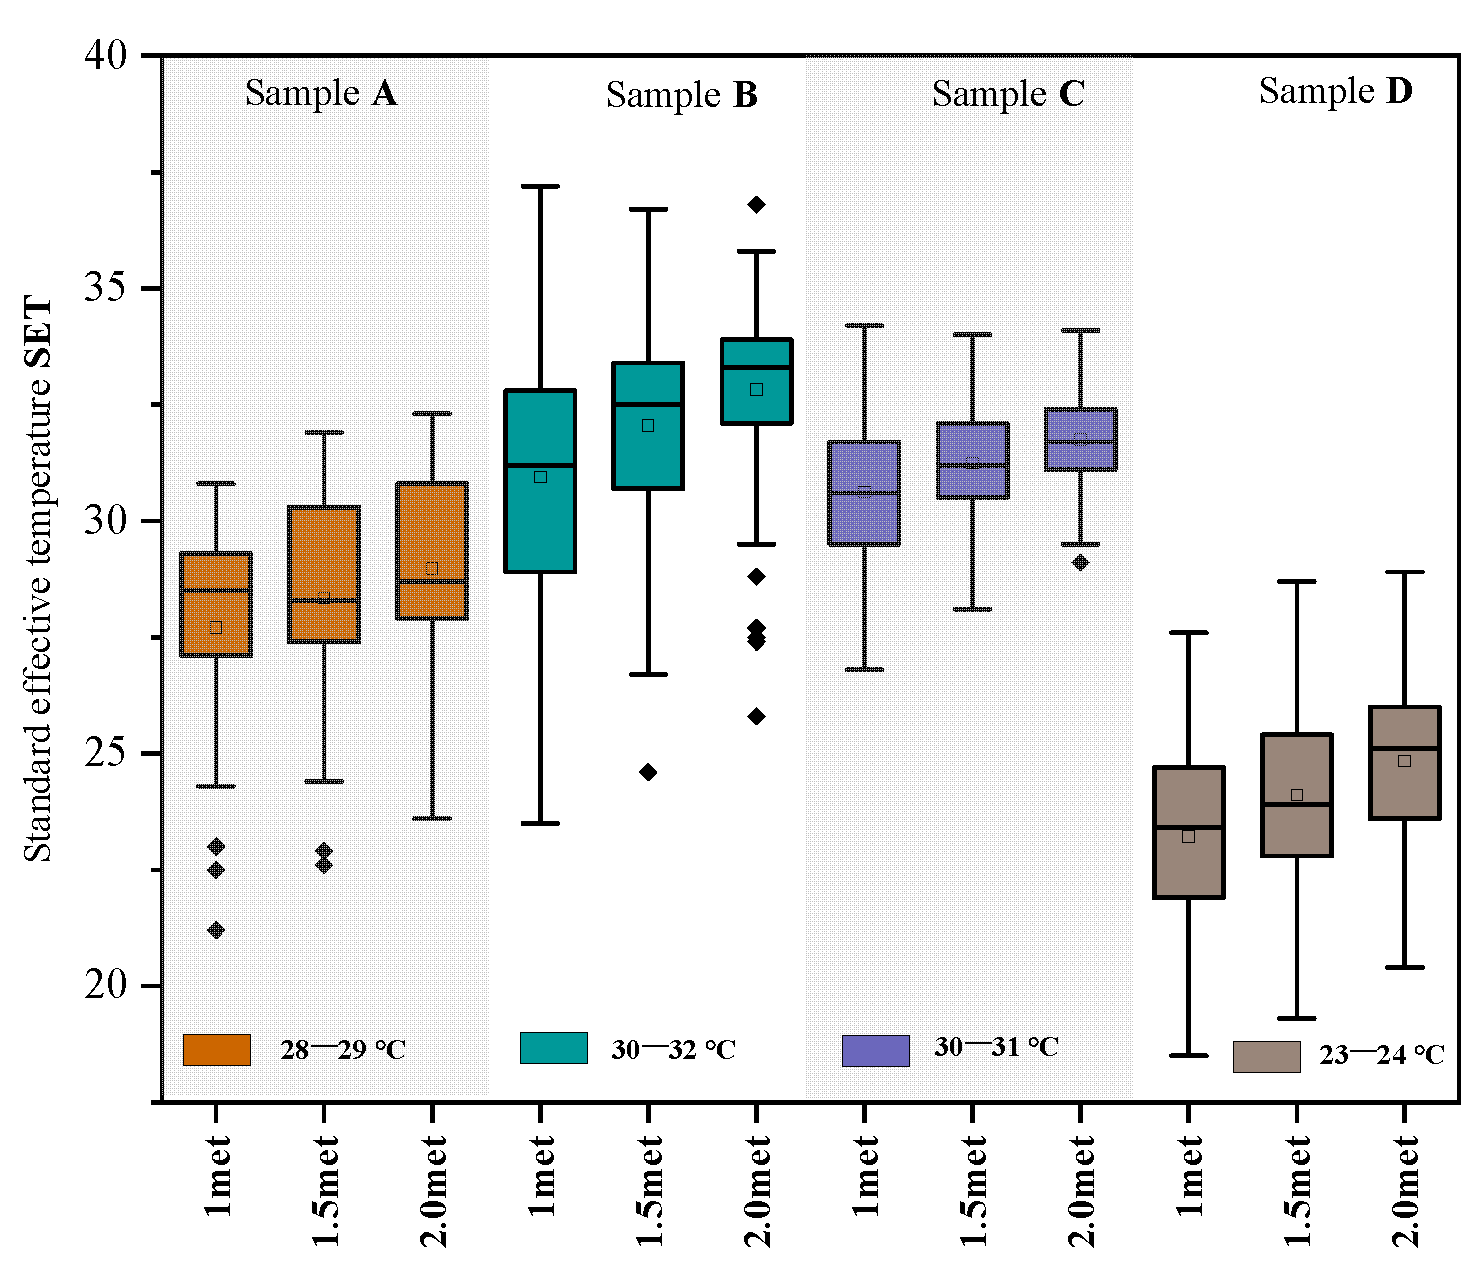
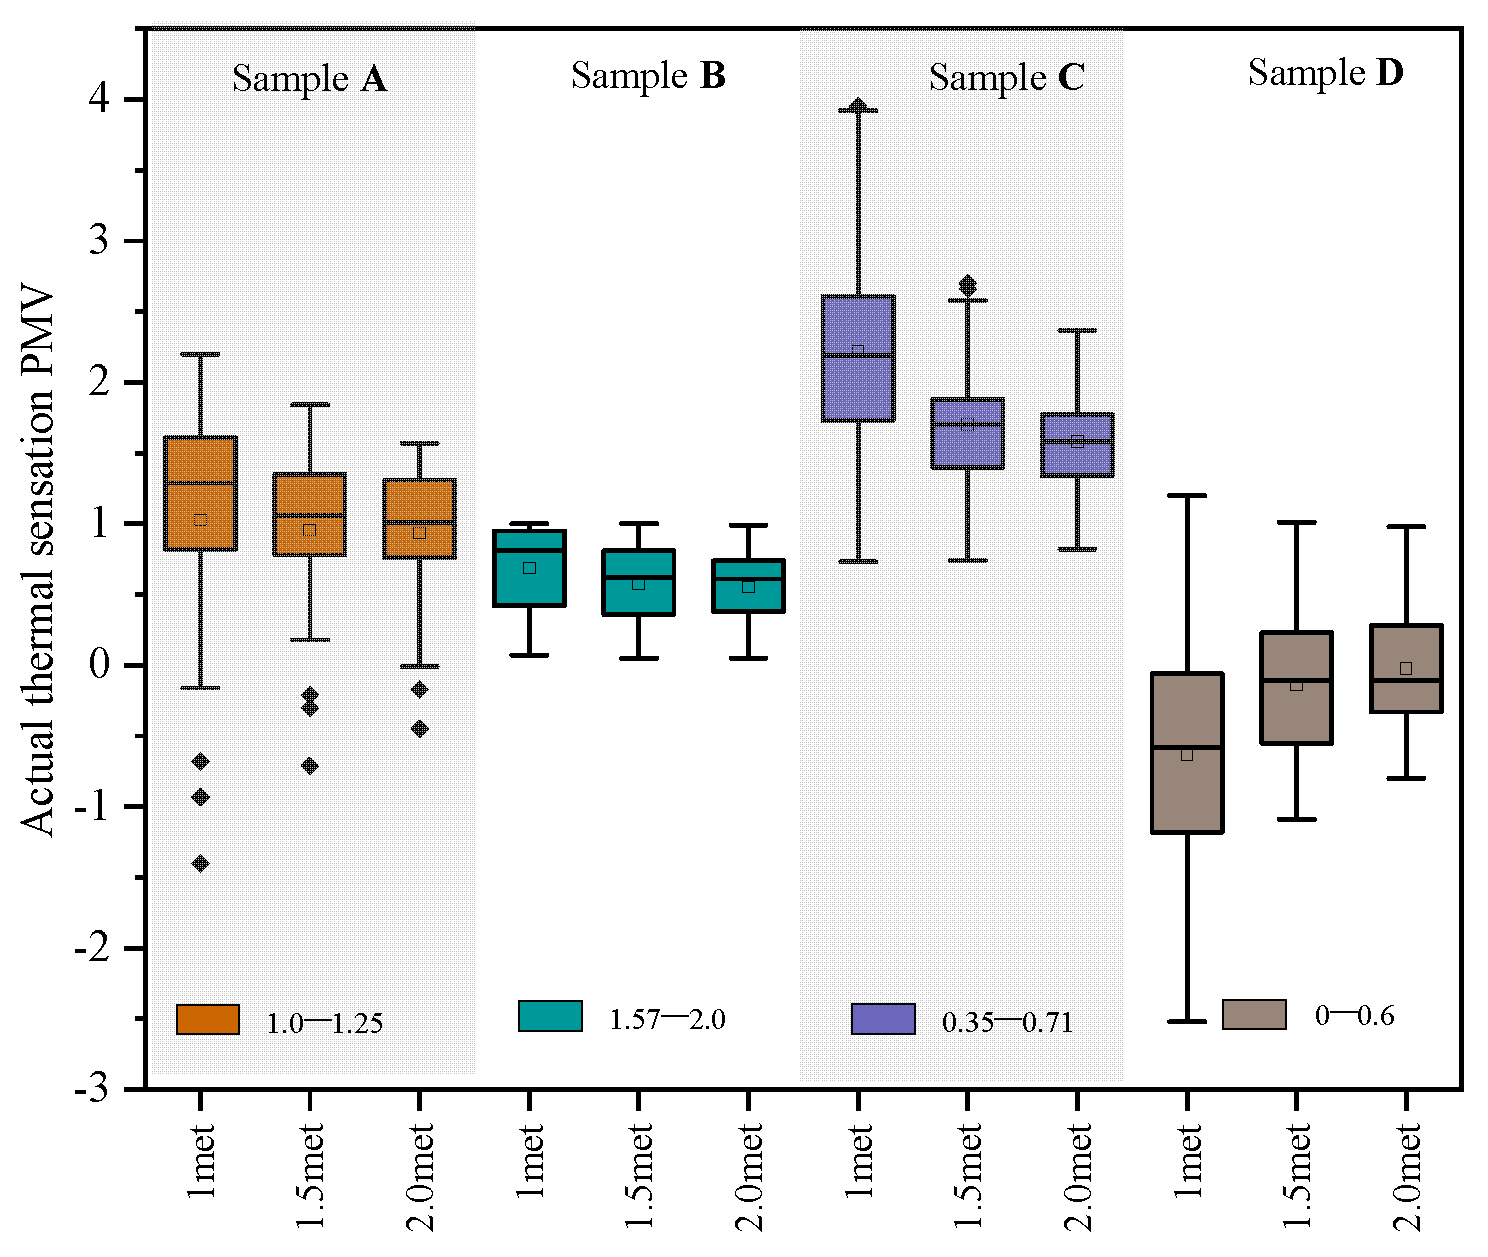
The thermal response of the human body to SETs and the calculation results are shown in Figure 7, Figure 8 and Figure 9.
According to results shown in Figure 7, Figure 8 and Figure 9, the SET was 18.5–36.7 °C, the actual thermal sensation PMV was −2.5 to 4.7, and the thermal discomfort index PPD was 5–100%. With the change in spatial form and the increase in activity frequency, the thermal sensation of the respondents changed from slightly cool and neutral (normal health state, no obvious sweating) to slightly warm and further transitioning to very hot and uncomfortable. Most respondents were in the medium and above category, that is, from a normal state of health to an uncomfortable state, with vasoconstriction and increased sweating. Additionally, the thermal comfort differences in different spaces were significantly affected by morphological changes.

3.3.2. Multiple Regression Model

The results of multiple linear regression analysis are shown in Table 7, with the three morphological indexes of virtual-real ratio (VSR), HFG, and OSR as the independent variables, and the thermal comfort indexes SET, PMV, and PPD (1.0 met, 1.5 met, and 2.0 met) at different active metabolic rates as dependent variables.
As shown in Table 7, the SETavg of the sample dwellings was 28.29–29.92 °C. PMVavg was 1.19–1.07; and PPDavg was 40.36–31.43%. The explanatory degree of the SET variation was 30.6–61.6%, that of actual thermal sensation PMV variation was 6.5–47.4%, and that of thermal discomfort index variation was 27.5–36%. The regression model summary was as follows: SET1.0 met, 1.5 met, and 2.0 met (R2 = 0.466, 0.585, 0.616); PMV1.0 met, 1.5 met, and 2.0 met (R2 = 0.474, 0.281, 0.395); and PPD1.0 met, 1.5 met, and 2.0 met (R2 = 0.508, 0.35, 0.442). The results of the significance test were as follows: SET1.0 met, 1.5 met, and 2.0 met (F value = 2.907, 4.694, 5.349; p = 0.088, 0.027, 0.019), and p-value < 0.05, which indicated that there was a linear correlation between the dependent variable and the independent variable. The results showed that there was a linear correlation between the independent variables of the three morphological indicators and the SET1.5 met/SET2.0 met dependent variables. PMV1.0 met (F = 3.009, p = 0.081), PMV1.5 met (F = 1.3, p = 0.327), and PMV2.0 met (F = 2.174, p = 0.154, p < 0.05), which indicated that there was a linear correlation between the dependent variable and the independent variable. The results showed that there was no linear correlation between the independent variables and PMV dependent variables. PPD1.0 met (F = 3.435, p = 0.06), PPD1.5 met (F = 1.3, p = 0.327), PPD2.0 met (F = 2.644, p = 0.107), and p < 0.05, which indicated that there was a linear correlation between the dependent variable and the independent variable. The results showed that there was no linear correlation between the independent variables and the PPD dependent variables. The regression model can be assumed as follows:
Typical   space   S E T = B 0 ( constant ) + B 1 V S R + B 2 0 S R + B 3 H F G
Typical   space   P P D = B 0 ( constant ) + B 1 V S R + B 2 0 S R + B 3 H F G .
The significance test results of the respective variables in the model showed that p < 0.005 was statistically significant (PMV regression model was not valid). Because only the OSR was p < 0.005, the regression model in this case (no constant was added when the standardized coefficient is used) was as follows:
Typical   space   S E T = ( 0.69 0.938 ) H F G
Typical   space   PPD = 0.084 HFG
The results of multiple regression analysis of the three indices of spatial form on the evaluation index of thermal comfort showed that changes in the three indices of virtual-real ratio, OSR, and HFG had a great influence on SET and had some effect on PMV. It had a certain degree of influence on PPD. The results of the significance test showed that there was a linear correlation between the independent variables of the three morphological indicators and the dependent variables of SET and PMV, but there was no linear correlation between the dependent variables of PPD.

3.3.3. Correlation Analysis

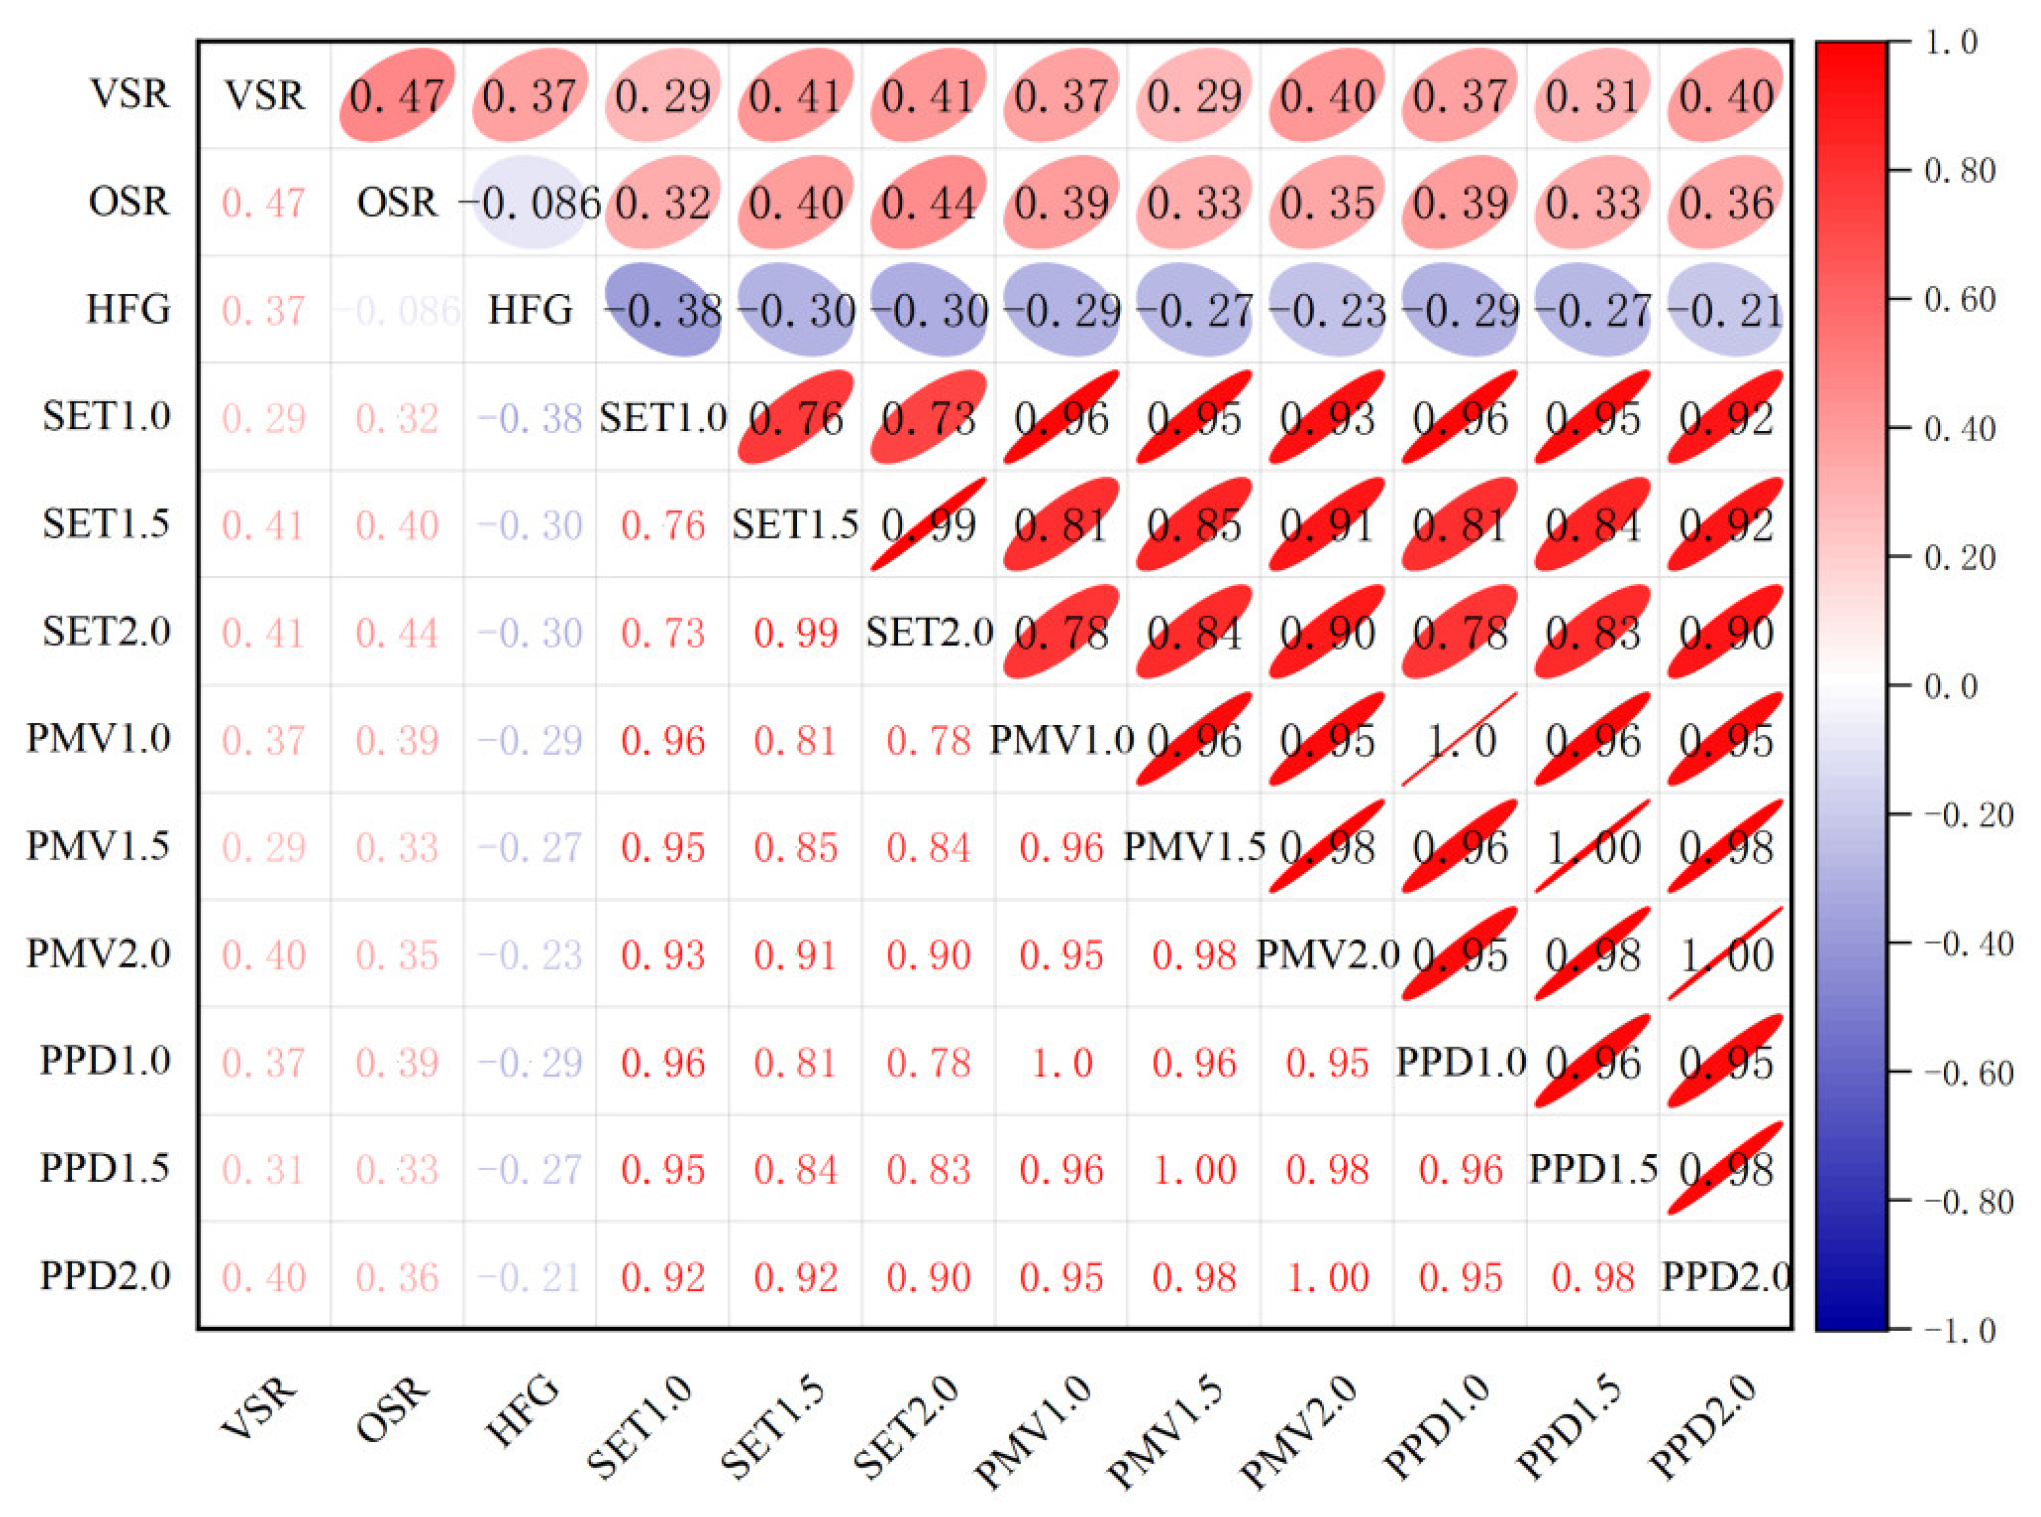
Figure 10 shows the Spearman correlation between spatial form indicators and thermal comfort parameters.
The test results of the Spearman correlation analysis shown in Figure 10 indicated that the significance probability levels of the virtual-real ratio, HFG, OSR, and SET were 0.29–0.41, 0.32–0.44, and −0.0.3 to −0.38. The significance probability levels of PMV were 0.29–0.4, 0.33–0.39, and 0.33–0.39. The significance probability levels of PPD and PPD were 0.31–0.4, 0.33–0.39, and −0.21 to −0.29. The SET was positively correlated with the actual thermal sensation PMV, whereas the thermal discomfort PPD was negatively correlated.

4. Conclusions

In this study, we used the Spearman-grade correlation coefficient to explore the influence of the residential spatial form on indoor thermal environment and thermal comfort in the middle reaches of the Hanjiang River, which was helpful to explore the internal correlation between spatial form and environmental parameters. The main conclusions are as follows:
  • We quantified the range value of the key spatial form index and the variation interval of thermal environment and thermal comfort through field measurement of typical residential buildings and questionnaire users, in which the virtual-real ratio was 5–58%; the HFG was 2.23–6.92 m; and the OSR was 0.04–4.55.
  • We established regression models for the three spatial form indexes, thermal environment parameters, and thermal comfort indexes. Among them, the explanatory power of the spatial form index to indoor air temperature was 57.5%, with strong correlation (R2 = 0.675). The explanatory power for humidity was 38.2%, with weak correlation (R2 = 0.525). The explanatory power of SET was 30.6–50.1%, with weak correlation (R2 = 0.466). The explanatory power of PMV ranged from 6.5% to 31.7%, and PMV1.0 was weakly correlated (R2 = 0.474). The explanatory power for PPD was 15.5%, where PPD1.0 was close to a weak correlation (R2 = 0.508).
  • Based on the correlation analysis of the indicator variables, we obtained the correlation coefficient between indicator parameters. When the permeability ratio of space form was larger, the air temperature and SET also increased, the humidity decreased, and the thermal sensation and thermal discomfort were significantly affected. The higher the altitude was from the ground, the lower the air temperature and SET; the higher the humidity was, the more general thermal sensation and thermal discomfort were affected. The more open the space was, the higher the air temperature and SET; the lower the humidity was, the more significant the influence of thermal sensation and thermal discomfort.
The discovery of these results was based on measured data of the thermal environment and thermal comfort in different spatial forms, which can realistically reflect a clear understanding of the mutual influence of these indicators. These results can serve as guiding principles in the design process, intuitively indicating passive cooling strategies in different spatial form combinations under different time states.
Note, however, that the correlation results among the different spatial forms, thermal environments, and thermal comfort analysis under humid and hot climate conditions may not necessarily be suitable under other climate conditions. Additional research is needed to apply these analytical methods to other climate zones and experimental data to further enrich the existing knowledge on the response mechanism of different spatial forms to the indoor thermal environment comfort and the design guidelines derived from these findings.

Author Contributions

Conceptualization, L.Y.; methodology, L.Y.; software, Y.L.; validation, Q.C.; formal analysis, Y.Q.; investigation, B.H. and Y.Q.; resources, L.Y. and Y.L.; data curation, L.Y. and B.H.; writing—original draft preparation, L.Y.; writing—review and editing, L.Y. and Q.C. All authors have read and agreed to the published version of the manuscript.

Funding

This study was funded by “the 14th Five-Year” National Science and Technology Major Project of China (No. 2022YFC3802700), and the Hubei Provincial Department of Education Philosophy and Social Science Research Project (202719020).

Institutional Review Board Statement

Not applicable.

Informed Consent Statement

Written informed consent has been obtained from the patient(s) to publish this paper.

Data Availability Statement

The data presented in this study are available on request from the corresponding author.

Conflicts of Interest

The authors declare no conflicts of interest.

References

  1. Zhang, R.; Li, W.; Li, Y.; Li, H. Job losses or gains? The impact of supply-side energy transition on employment in China. Energy 2024, 308, 132804. [Google Scholar] [CrossRef]
  2. Venkatraj, V.; Dixit, M.K.; Yan, W.; Lavy, S. Evaluating the impact of operating energy reduction measures on embodied energy. Energ. Build. 2020, 226, 110340. [Google Scholar] [CrossRef]
  3. Qian, F.; Sun, H.; Yang, L. Integrating Smart City Principles in the Numerical Simulation Analysis on Passive Energy Saving of Small and Medium Gymnasiums. Smart Cities 2024, 7, 1971–1991. [Google Scholar] [CrossRef]
  4. Zhang, M.; Liu, F.; Liu, Q.; Zhang, F.; Li, T. Climate Adaptation Analysis and Comfort Optimization Strategies for Traditional Residential Buildings in Hot-Summer, Cold-Winter Regions: A Case Study in Xuzhou, China. Sustainability 2024, 16, 3411. [Google Scholar] [CrossRef]
  5. Yang, L.; Fu, R.; He, W.; He, Q.; Liu, Y. Adaptive thermal comfort and climate responsive building design strategies in dry–hot and dry–cold areas: Case study in Turpan, China. Energ. Build. 2020, 209, 109678. [Google Scholar] [CrossRef]
  6. Buyukyazici, D.; Mazzoni, L.; Riccaboni, M.; Serti, F. Workplace skills as regional capabilities: Relatedness, complexity and industrial diversification of regions. Reg. Stud. 2024, 58, 469–489. [Google Scholar] [CrossRef]
  7. Dorcas Mobolade, T.; Pourvahidi, P. Bioclimatic approach for climate classification of Nigeria. Sustainability 2020, 12, 4192. [Google Scholar] [CrossRef]
  8. Kim, J.H.; Han, S.H. Applicability of preliminary standards for the hanok comfort evaluation based on spatial indices. Buildings 2021, 11, 497. [Google Scholar] [CrossRef]
  9. Dwikat, S.Y.; Arshad, D.; Mohd Shariff, M.N. Effect of competent human capital, strategic flexibility and turbulent environment on sustainable performance of SMEs in manufacturing industries in palestine. Sustainability 2023, 15, 4781. [Google Scholar] [CrossRef]
  10. Dagestani, A.A.; Chen, P.; Du, L.; Hu, J.; Bilan, Y. The impacts of urban development orientation of resource-based cities on environmental information disclosure and greenwashing behavior of listed firms in China. Environ. Dev. Sustain. 2024, 1–26. [Google Scholar] [CrossRef]
  11. Tao, Y.; Lau, S.S.Y.; Gou, Z.; Zhang, J.; Tablada, A. An investigation of semi-outdoor learning spaces in the tropics: Spatial settings, thermal environments and user perceptions. Indoor Built Environ. 2019, 28, 1368–1382. [Google Scholar] [CrossRef]
  12. Yuan, L.; Lu, W.; Xue, F.; Li, M. Building feature-based machine learning regression to quantify urban material stocks: A Hong Kong study. J. Ind. Ecol. 2023, 27, 336–349. [Google Scholar] [CrossRef]
  13. Deng, Z.; Chen, Y.; Yang, J.; Causone, F. AutoBPS: A tool for urban building energy modeling to support energy efficiency improvement at city-scale. Energ. Build. 2023, 282, 112794. [Google Scholar] [CrossRef]
  14. Gamero-Salinas, J.; Kishnani, N.; Monge-Barrio, A.; López-Fidalgo, J.; Sánchez-Ostiz, A. The influence of building form variables on the environmental performance of semi-outdoor spaces. A study in mid-rise and high-rise buildings of Singapore. Energ. Build. 2021, 230, 110544. [Google Scholar] [CrossRef]
  15. Henna, K.; Saifudeen, A.; Mani, M. Resilience of vernacular and modernising dwellings in three climatic zones to climate change. Sci. Rep. 2021, 11, 9172. [Google Scholar] [CrossRef] [PubMed]
  16. Gratia, E.; De Herde, A. Design of low energy office buildings. Energ. Build. 2003, 35, 473–491. [Google Scholar] [CrossRef]
  17. Ourghi, R.; Al-Anzi, A.; Krarti, M. A simplified analysis method to predict the impact of shape on annual energy use for office buildings. Energ. Convers. Manag. 2007, 48, 300–305. [Google Scholar] [CrossRef]
  18. Su, Y.; Wang, C.; Li, Z.; Meng, Q.; Gong, A.; Wu, Z.; Zhao, Q. Summer outdoor thermal comfort assessment in city squares—A case study of cold dry winter, hot summer climate zone. Sustain. Cities Soc. 2024, 101, 105062. [Google Scholar] [CrossRef]
  19. Taher Tolou Del, M.S.; Bayat, S.; Zojaji, N. The effect of building plan form on thermal comfort in the traditional residential patterns of the hot and dry climate of Qom. Herit. Sci. 2022, 10, 185. [Google Scholar] [CrossRef]
  20. Xiong, Y.; Zhang, J.; Yan, Y.; Sun, S.; Xu, X.; Higueras, E. Effect of the spatial form of Jiangnan traditional villages on microclimate and human comfort. Sustain. Cities Soc. 2022, 87, 104136. [Google Scholar] [CrossRef]
  21. Gamero-Salinas, J.; Kishnani, N.; Sánchez-Ostiz, A.; Monge-Barrio, A.; Benitez, E. Porosity, openness, and exposure: Identification of underlying factors associated with semi-outdoor spaces’ thermal performance and clustering in tropical high-density Singapore. Energ. Build. 2022, 272, 112339. [Google Scholar] [CrossRef]
  22. Chang, S.; He, W.; Yan, H.; Yang, L.; Song, C. Influences of vernacular building spaces on human thermal comfort in China’s arid climate areas. Energ. Build. 2021, 244, 110978. [Google Scholar] [CrossRef]
  23. Wang, S.S.; Yi, Y.K.; Liu, N.X. Multi-objective optimization (MOO) for high-rise residential buildings’ layout centered on daylight, visual, and outdoor thermal metrics in China. Build. Environ. 2021, 205, 108263. [Google Scholar] [CrossRef]
  24. Zhu, J.; Feng, J.; Lu, J.; Chen, Y.; Li, W.; Lian, P.; Zhao, X. A review of the influence of courtyard geometry and orientation on microclimate. Build. Environ. 2023, 236, 110269. [Google Scholar] [CrossRef]
  25. Xu, X.Y.; Sun, S.; Liu, W.; García, E.H.; He, L.; Cai, Q.; Xu, S.J.; Wang, J.J.; Zhu, J.N. The cooling and energy saving effect of landscape design parameters of urban park in summer: A case of Beijing, China. Energ. Build. 2017, 149, 91–100. [Google Scholar] [CrossRef]
  26. Bai, M.; Hu, R.; Lian, H.; Zhou, W. Correlation Study of Commercial Street Morphology and Pedestrian Activity in Cold Region Summers under Thermal Comfort Guidance: A Case Study of Sanlitun, Beijing. Buildings 2024, 14, 1751. [Google Scholar] [CrossRef]
  27. Gou, S.; Li, Z.; Zhao, Q.; Nik, V.M.; Scartezzini, J.L. Climate responsive strategies of traditional dwellings located in an ancient village in hot summer and cold winter region of China. Build. Environ. 2015, 86, 151–165. [Google Scholar] [CrossRef]
  28. Yang, Y.; Wang, Z.; Zhou, F.; Liu, C.; Duanmu, L.; Zhai, Y.; Lian, Z.; Cao, B.; Zhang, Y.; Zhou, X.; et al. Comparison of indoor thermal environments and human thermal responses in Northern and Southern China during winter. J. Build. Eng. 2024, 82, 108131. [Google Scholar] [CrossRef]
  29. Li, W.; Zhou, Z.; Wang, C.; Han, Y. Impact of outdoor microclimate on the performance of high-rise multi-family dwellings in cold areas and optimization of building passive design. Build. Environ. 2024, 248, 111038. [Google Scholar] [CrossRef]
  30. Sun, Q.; Qi, Y.; Long, Y. A comparative case study of volcanic-rock vernacular dwelling and modern dwelling in terms of thermal performance and climate responsive design strategies in Hainan Island. J. Asian Arch. Build. 2022, 21, 1381–1398. [Google Scholar] [CrossRef]
  31. Liang, C.; Yu, L.; Liu, X. Parametric Study on the Comfort of Outdoor Wind Environment of Traditional Dwelling—Taking Lius’ courtyard in Kaifeng as an Example. IOP Conference Series, Earth and Environmental Science. IOP Publ. 2021, 768, 012152. [Google Scholar]
  32. Li, E.; Zhu, J. Parametric analysis of the mechanism of creating indoor thermal environment in traditional houses in Lhasa. Build. Environ. 2022, 207, 108510. [Google Scholar] [CrossRef]
  33. ASHRAE Standard 55-2013; Thermal Environmental Conditions for Human Occupancy. ASHRAE: Peachtree Corners, GA, USA, 2013.
  34. GB/T50785-2012; Evaluation Standard for Indoor Thermal Environment in Civil Buildings. China Architecture Publishing & Media Co Ltd: Beijing, China, 2012.
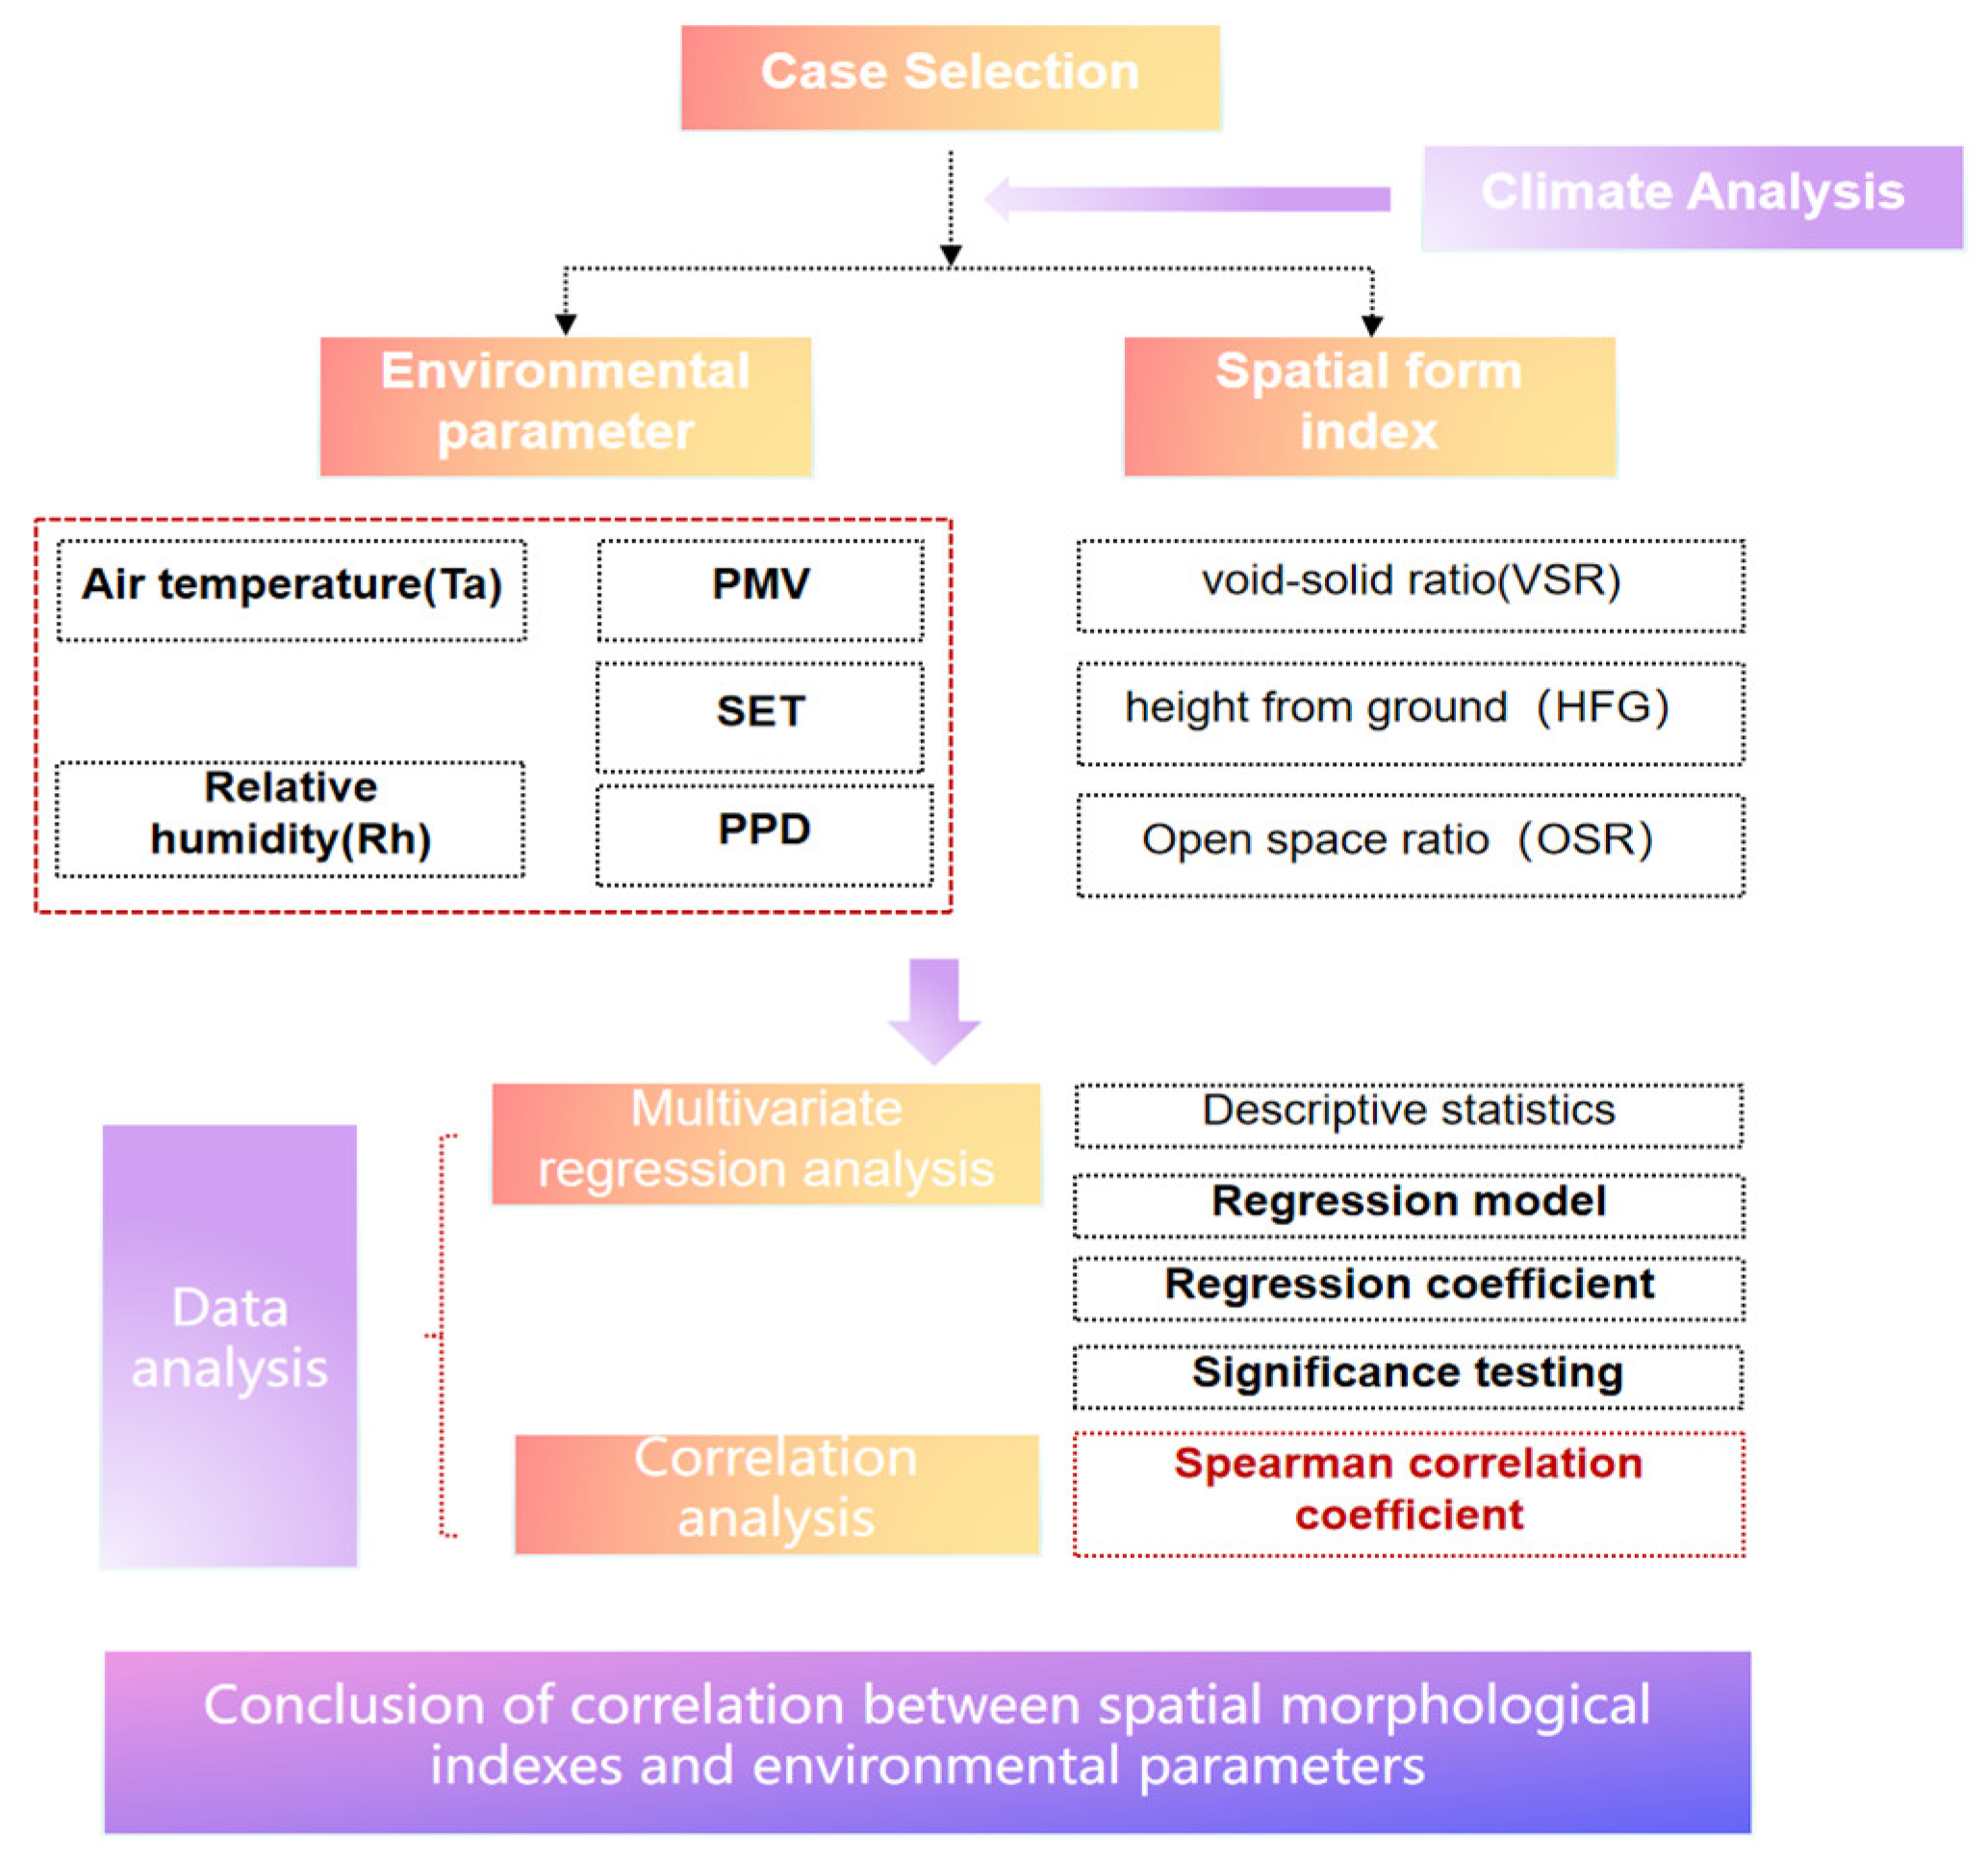
Figure 1. Technology road map.
Sustainability 16 08297 g001
Figure 2. From left to right: sample A, sample B, sample C, and sample D.
Sustainability 16 08297 g002
Figure 3. Interval value of spatial interface shape index of sample residential buildings.
Sustainability 16 08297 g003
Figure 4. Distribution of air temperature.
Sustainability 16 08297 g004
Figure 5. Distribution of relative humidity.
Sustainability 16 08297 g005
Figure 6. Spelman correlation matrix of spatial morphology index and indoor thermal.
Sustainability 16 08297 g006
Figure 7. Distribution of SET.
Sustainability 16 08297 g007
Figure 8. Distribution of PMV.
Sustainability 16 08297 g008
Figure 9. Distribution of PPD.
Sustainability 16 08297 g009
Figure 10. Spearman correlation matrix of spatial morphology index and thermal comfort parameter.
Sustainability 16 08297 g010
Table 1. List of basic information of research objects.
Research ObjectSample ASample BSample CSample D
Era buildQing dynastyQing dynastyQing dynastyQing dynasty
Permanent population6420
Building orientationWest facing
east
East facing westFacing southFacing south
Floor area319.92 m2200.82 m2244.42 m2841.51 m2
Building storiesLocal layer 2Local layer 2Local layer 2Local layer 2
Architectural structurePost and panel structurePost and panel structurePost and panel structurePost and panel structure
Building envelopeBlue brick wall; wood doors and windows Slope roof (wood purlin + wood rafters + gray tile)Blue brick wall; wood doors and windows Slope roof (wood purlin + wood rafters + gray tile)Blue brick wall; wood doors and windows Slope roof (wood purlin + wood rafters + gray tile)Blue brick wall wood doors and windows Slope roof (wood purlin + wood rafters + gray tile)
Heat transfer coefficient
W/m2·K
1.671.541.461.58
Thermal resistance
m2·K/W
0.660.370.750.68
Cooling methodNatural ventilationNatural ventilationNatural ventilationNatural ventilation
Table 2. Definition and calculation formula of residential space interface shape index.
Morphological IndexDefinitionComputational Formula
Delivery criterionThe distance between two adjacent transverse positioning axes, mL
DepthThe actual length between the front and back walls of the building, mW
Terrain clearanceHeight of roof surface (floor) to indoor floor, mH
Space-solid ratio/virtual-real ratioVirtual area divided by solid area, m2Svirtual/Sreal
Open-space ratioThe open length based on the perimeter divided by the total perimeterLopen/Ltoal
General perimeterThe sum of the lengths of all sides of the perimeterLtotal
Table 3. Test instruments and parameters.
Measurement ContentNameMeasuring RangePrecisionTest Cycle
Air temperature and humidityONSET HOBO UX100-011 High precision temperature and humidity recorder−20 °C to 70 °C,
1–95%
0.024 °C,
0.01%
72 h
wind speedWWFWZY-1 wireless universal wind speed and temperature recorder−260 °C
to 1370 °C
0.04 °C72 h
Black ball temperatureHeat index HD32.3TC−5 °C to 50 °CClassA 1/3DINinstantaneous
Subjective evaluation scaleSustainability 16 08297 i001
Table 4. Spatial interface shape index of each typical space of sample residential buildings.
EncodingRoom NameSpace-Solid Ratio/Virtual-Real RatioTerrain ClearanceOpen-Space LengthGeneral PerimeterOpen-Space Ratio
A-1Lobby0.136.927.7823.540.33
A-2Courtyard 10.135.734160.25
A-3Courtyard 20.586.2812.616.450.77
A-4Three halls0.224.048.2818.60.45
B-1Lobby0.293.69.1350.26
B-2Courtyard0.324.25.426.80.2
B-3Wing-room0.192.211.2312.12.65
B-4Principal room0.184.561.5217.5621.6
C-1Lobby0.472.75.9410.80.55
C-2Courtyard0.1355.6821.81.55
C-3Second hall0.132.552.9619.892.55
C-4Wing-room0.232.931.6618.523.55
C-5Second floor0.052.231.6416.744.55
D-1West to east wing0.092.590.717.380.04
D-2West to the second-floor west wing0.122.750.717.380.04
D-3West to the second floor0.123.81.419.70.07
D-4Two halls west0.224.964.2221.80.19
D-5East into the second floor0.122.761.4318.850.08
D-6East into the first floor0.313.32.5619.20.072
Table 5. Measured values of outdoor thermal environment.
Numerical ValueSolar RadiationOutdoor Air TemperatureOutdoor Relative HumidityOutdoor Wind Speed
Mean value203.7328.1774.16%
Maximum value926.8542.1597.8%12.67
Minimum value015.9435.1%0.08
Table 6. Coefficients of typical space and temperature and humidity.
Indoor Thermal EnvironmentModelNonnormalized
Coefficient
Standardization Coefficient
(Beta)
p-Value (p)Variance Inflation Factor (VIF)
(B)(Std. Dev.)
Air temperature(constant)16.7122.694 0.000
Virtual–solid ratio/air–solid ratio (VSR)9.5575.6650.3170.1221.085
Ground clearance m-OSR1.2460.5760.4310.0561.225
More open space than m-HFG2.4760.6010.7980.002 *1.155
Relative humidity(constant)89.2657.203-0.000
Virtual–solid ratio/air–solid ratio (VSR)−18.02315.117−0.2710.2611.085
Ground clearance m-OSR−2.051.540−0.3210.2131.225
More open space than m-HFG−4.9731.607−0.7250.011 *1.155
Note: VIF results are all ≤ 10, indicating that the data basically conforms to the hypothesis of multiple linear analysis, that is, there is no multicollinearity problem. Therefore, all data in this case meet the requirements and can be used for multiple linear regression operation. * is significant correlation (p < 0.05).
Table 7. Coefficients of each typical space and thermal comfort index SET.
Thermal Comfort ParameterModelNonnormalized CoefficientStandardization Coefficient (Beta)p-Value (p)VIF
BStd. Dev.
SETSET 1.0 met
(constant)27.8381.413 0
Virtual–solid ratio/air–solid ratio (VSR)2.3982.9660.1950.4381.085
Ground clearance m-OSR0.1830.3020.1550.5571.225
More open space than m-HFG−0.690.315−0.5440.054 *1.155
SET 1.5 met
(constant)28.6991.531
Virtual–solid ratio/air–solid ratio (VSR)4.3183.2120.2850.2091.085
Ground clearance m-OSR0.1850.3270.1280.5841.225
More open space than m-HFG−0.9380.342−0.6020.021 *1.155
SET 2.0 met
(constant)29.4221.449 0
Virtual–solid ratio/air–solid ratio (VSR)4.1463.0410.2780.2031.085
Ground clearance m-OSR0.1820.310.1280.5691.225
More open space than m-HFG−0.9640.323−0.6280.014 *1.155
PMVPMV 1.0 met
(constant)0.8220.461 0.105
Virtual–solid ratio/air–solid ratio (VSR)1.0470.9680.2580.3051.085
Ground clearance m-OSR0.0940.0990.2410.3641.225
More open space than m-HFG−0.1880.103−0.450.0971.155
PMV 1.5 met
(constant)0.8440.333 0.03
Virtual–solid ratio/air–solid ratio (VSR)0.7160.6990.2860.331.085
Ground clearance m-OSR0.0460.0710.1930.531.225
More open space than m-HFG−0.0690.074−0.2680.3751.155
PMV 2.0 met
(constant)0.8630.288 0.013
Virtual–solid ratio/air–solid ratio (VSR)0.7040.6050.2980.2711.085
Ground clearance m-OSR0.0430.0620.1890.5031.225
More open space than m-HFG−0.0950.064−0.390.1721.155
PPDPPD 1.0 met
(constant)0.3040.174 0.112
Virtual–solid ratio/air–solid ratio (VSR)0.4430.3660.280.2541.085
Ground clearance m-OSR0.0260.0370.1720.4991.225
More open space than m-HFG−0.0840.039−0.5170.056 *1.155
PPD 1.5 met
(constant)0.2760.12 0.045
Virtual–solid ratio/air–solid ratio (VSR)0.2910.2530.3060.2751.085
Ground clearance m-OSR0.0090.0260.10.7321.225
More open space than m-HFG−0.040.027−0.4050.171.155
PPD 2.0 met
(constant)0.2660.107 0.033
Virtual–solid ratio/air–solid ratio (VSR)0.2950.2250.3220.221.085
Ground clearance m-OSR0.010.0230.1110.6811.225
More open space than m-HFG−0.0450.024−0.4740.0911.155
Note: VIF results are all ≤ 10, indicating that the data basically conform to the hypothesis of multiple linear analysis, that is, there is no multicollinearity problem. Therefore, all data in this case meet the requirements and can be used for multiple linear regression operation. * is significant correlation (p < 0.05).
Disclaimer/Publisher’s Note: The statements, opinions and data contained in all publications are solely those of the individual author(s) and contributor(s) and not of MDPI and/or the editor(s). MDPI and/or the editor(s) disclaim responsibility for any injury to people or property resulting from any ideas, methods, instructions or products referred to in the content.