Article

Age-Friendly Urban Design for Older Pedestrian Road Safety: A Street Segment Level Analysis in Madrid

by
Daniel Gálvez-Pérez
1,*,
Begoña Guirao
1 and
Armando Ortuño
2
1
Departamento de Ingeniería del Transporte, Territorio y Urbanismo, Escuela Técnica Superior de Ingenieros de Caminos, Canales y Puertos, Universidad Politécnica de Madrid, Calle del Profesor Aranguren, 3, 28040 Madrid, Spain
2
Escuela Politécnica Superior, Universidad de Alicante, 03690 San Vicente del Raspeig, Spain
*
Author to whom correspondence should be addressed.
Sustainability 2024, 16(19), 8298; https://doi.org/10.3390/su16198298
Submission received: 6 August 2024 / Revised: 11 September 2024 / Accepted: 18 September 2024 / Published: 24 September 2024

Abstract

:
Walking benefits older pedestrians but exposes them to traffic crashes. With an aging population, designing age-friendly cities is crucial, yet research on older pedestrian safety at a micro-level is limited. This study aims to reduce older pedestrian–vehicle collisions and create more livable environments through infrastructure policies derived from statistical data analysis. Special attention is focused on collecting a holistic set of infrastructure variables to reflect most of the street built environment elements, which helps policymakers implement short-term safety measures. Using Bayesian Poisson regression, this study analyzes factors contributing to the occurrence of crashes involving older and non-older pedestrians on road segments in Madrid, Spain. The results indicate that different factors affect the occurrence of crashes for all pedestrians versus older pedestrians specifically. Traffic crashes involving all pedestrians are affected by leisure points of interest, bus stops, and crosswalk density. Older pedestrian traffic crashes are influenced by population density, the presence of trees and trash containers, and contour complexity. Proposed measures include relocating trees and trash containers, modifying bus stops, and adding crosswalks and traffic lights. This paper also shows that these countermeasures, aimed at creating age-friendly streets for older pedestrians, are not expected to worsen the road safety of other pedestrians.

1. Introduction

Walking offers substantial benefits for older adults (people aged above 65), serving as a cornerstone for maintaining physical health and promoting mental well-being. Regular walking helps to mitigate the risks of chronic diseases, cardiovascular diseases, diabetes, cognitive impairment and dementia, and even improve mental well-being, sleep, and longevity [1]. Moreover, older adults benefit from walking in terms of social inclusion and a reduction in isolation [2,3], which is closely related with their well-being [4,5,6]. In fact, older adults are particularly vulnerable to loneliness [7] and marginalization because of their age, namely ageism. Ageism can be defined as negative or positive stereotypes, prejudice, and discrimination against older adults [8]. This marginalization was exacerbated during the COVID-19 pandemic due to social isolation and physical limitations [9,10], and ageism was normalized because of the higher level of vulnerability of older adults [11]. Despite the physical activity benefits of walking, this demographic is particularly vulnerable as pedestrians to vehicle collisions.
Older pedestrian (an older adult acting as a pedestrian) road safety is an issue of concern, as the aging population has already impacted crash data. In Europe, the proportion of older adults among those killed in traffic crashes nearly doubled from 17% in 1992 to 29% in 2018 [12]. Specifically in 2020, older pedestrians accounted for 48% of pedestrian fatalities, despite comprising only 21% of the total population. This age group represents 28% of all road-related deaths [13]. Therefore, despite the effects of COVID-19, which significantly reduced traffic volumes, older pedestrians continued to be highly vulnerable on the roads. This vulnerability is particularly pronounced in urban areas. To illustrate, in Spain, 64% of pedestrians killed on urban roads in 2021 were aged 65 or above, while this group represented only 20% of the population [14]. Older pedestrians exhibit characteristics that increase their crash risk, such as chronic medication use, risk-taking behavior, distractions, and diminished self-regulation. In addition, their inherent physical frailty puts them at increased risk of injury [15]. The aim of this study is to identify key factors contributing to traffic crashes within urban scenarios involving older pedestrians and to propose countermeasures to create more age-friendly cities.
The population of older people is expected to grow in the next decades [16], so cities should be prepared to be safer and more inclusive to promote the benefits of walking and avoid social isolation because of poor safety perceptions related to traffic. Although there is an institutional willingness for the inclusion of the older population in public policies [17], the body of research with real traffic crash data is not substantial. Traffic safety studies should be more inclusive to recognize and address the unique needs and risks associated with older pedestrians, as older people are often forgotten among other priorities [18]. There is a need to detect which factors make streets riskier, particularly for older pedestrians, while countermeasures should promote safety but not reduce the operational performance of roads [19], conflict with other goals [20], or reduce the safety of other pedestrians. This is aligned with the definition of an age-friendly city, which is a place that adapts to be more inclusive to the needs of all ages [21] and to promote healthy, active, and successful aging [22], as it is based on minimizing the risk of disability (caused by traffic crashes) and maintaining physical functions (more safety implies more walking activity). This study is particularly in line with the health pillar of active aging [23], especially preventing and reducing disabilities and premature mortality by creating safe environments. Regarding the United Nations’ Sustainable Development Goals [24], this approach is aligned particularly with goals 10 (‘reduced inequalities’) and 11 (‘sustainable cities and communities’), and with the European ‘Vision Zero’ initiative [25], which aims to reduce road traffic fatalities and serious injuries to as close to zero as possible by 2050.
Research on older pedestrian traffic crashes reveals several key factors influencing older pedestrian safety, and methodologically, this research can be divided into four groups: observational studies, surveys, simulations, and crash database analyses. Observational and pedestrian survey analyses [26,27,28,29] have highlighted that street crossings are particularly problematic areas, which is shown in the traffic crash data as older adults are over-represented in crashes at intersections, although about 70% of older adult fatalities occur on road segments [30]. For example, Oxley et al. [26] noted increased crossing difficulties in complex environments, like two-way undivided roadways, where older pedestrians struggled to process information from multiple sources, thus being at greater risk compared to younger individuals. This led to the recommendation of installing median strips in such areas to simplify the crossing process, which was supported by findings by other authors [31,32]. Bernhoft et al. [33] showed that older pedestrians prefer routes with signalized intersections and smooth sidewalks, while younger pedestrians focus on the most direct route. Vine et al. [27] found that dangerous pedestrian crossings, cyclist activity, overcrowded or busy road pathways, sidewalks in bad condition, a lack of shading, and public seating undermined older pedestrians’ sense of safety. Likewise, Ravi et al. [34] identified older people’s preferences for better infrastructure, including better crosswalks with longer green lights, better-maintained sidewalks, and more lighting.
Simulation studies [35,36] underscored that education and training should be complemented with adjustments to infrastructure. Consequently, a focus on real crash data analysis is essential for reducing older pedestrian crashes. For example, early research by Zegeer et al. [31] using data from North Carolina and the U.S. Fatal Pedestrian Crashes database over 11 years highlighted that older adults are more likely to be fatally injured in crashes, particularly at intersections and wide streets due to slower walking speeds and difficulties in complex traffic situations. A similar study by Martin et al. [37] found that most crashes involving older pedestrians in Ireland occurred during daylight and in good weather conditions. Abou-Raya et al. [32] noted that older pedestrians often did not notice approaching vehicles with falls being a common cause of injuries.
Another group of studies has aimed to identify unique characteristics of older pedestrian crashes using statistical and machine learning techniques. Kim and Ulfarsson [38] utilized random-intercept logistic regression to discover that older pedestrians are more likely to be involved in crashes with older drivers, in scenarios involving vehicle turns, and they are less likely to be involved in crashes during darkness and summer. Das et al. [39] identified that failure to yield while crossing and while a vehicle is turning at intersections were associated with older pedestrians. In particular, females were associated with backing vehicles and males were associated with segment-related crashes and crashes while crossing the expressway at night.
Using traffic crash databases, research into the injury severity of older pedestrian crashes has also been conducted. Wang et al. [40] used an ordered probit model to analyze crash severity in Singapore, finding that more severe crashes tended to occur at night, on roads with high-speed limits, at three-legged intersections, and away from proper crossings, and they were lower at signalized intersections. Laković et al. [41] also highlighted that older men and those over 65 were more likely to suffer severe injuries especially during the day and in traffic conditions that transition from infrequent to normal traffic. These studies, however, did not separate older pedestrian data for specific comparisons with other age groups, which limits the conclusions that can be drawn.
Apart from these previous studies, a detailed built environment analysis using real traffic crash data at the micro-level [42] road segment level is largely missing. This gap in research prevents a comprehensive understanding of the infrastructure features that contribute to the frequency of crashes involving older pedestrians. A built environmental analysis of urban pedestrian crashes can be addressed at a territorial macro-level (e.g., at district or census tract level) or at a territorial micro-level (e.g., street intersection or street segment level), As explained below, micro-level studies are less common in the literature than macro-level ones or those only including exploratory analyses, and their scope is also quite different.
On the one hand, macro-level studies often analyze the number of crashes in larger spatial units like districts or neighborhoods. For example, Dumbaugh et al. [43] found that the number of older adults, arterial roads and big box stores increased crashes involving older pedestrians, while dense networks of lower-speed roads reduced them. Social equity in pedestrian crashes was analyzed by Lee et al. [44], studying the number of older and non-older pedestrians in Seoul (Korea) at the census block group level. This research showed that four-way intersections and crosswalks impacted the number of pedestrian crashes and the severity of older pedestrians only in low-priced-housing areas, implying that pedestrian measures may be unevenly distributed across the city. Research by Gálvez-Pérez et al. [45], developed at the city district level in Madrid (Spain), found that built environment features such as vehicle flow, the presence of traffic lights, and sidewalk surface had a more statistically significant effect on older pedestrian collisions than on younger pedestrian crashes. A more recent study by Gálvez-Pérez et al. [46], using all the Spanish municipalities as the case study, concluded that municipalities above 50,000 inhabitants were safer for older pedestrians, and that more populated provincial capitals had lower rates of older pedestrian traffic crashes. They also stated that countermeasures to improve the road safety of older pedestrians are not likely to worsen the safety of the rest of the pedestrians.
In relation to the scope of these territorial studies, the macro-level approach is suitable for medium- and long-term transportation planning, but short-term measures should be applied to street infrastructure, which is considered in these studies in an aggregated way. The specific location where the crashes take place is not considered with this spatial unit approach; thus, it is not possible to determine which specific road elements should be treated or redesigned.
Conversely, micro-level studies focus on specific road elements like segments or intersections. This approach allows for a more detailed examination of where crashes occur and the factors contributing to them. Unfortunately, due to data limitations, such detailed studies are scarce. Two exceptions are the paper by Kim [47] and Lv et al. [48]. Kim [47] analyzed pedestrian traffic crashes at intersections in the County of Los Angeles (U.S.). Multinomial logistic regression was used to examine factors related to intersections with a high concentration of older and younger pedestrian collisions. The research found that certain features like raised medians and proximity to recreational areas improved safety for older pedestrians, whereas bus stops increased collision risks. However, the results of this study cannot be extended to road segments, where a large number of crashes take place. Lv et al. [48] studied the number of older pedestrian traffic crashes occurring at each road segment in a Shanghai district using Poisson and Geographically Weighted Poisson regressions, revealing that the safety of older pedestrians was significantly influenced by the presence of green spaces, sidewalks, and road junctions. Additionally, this study identified roads near nursing homes, schools, bus stops, metro stations, traditional markets, and supermarkets as particularly dangerous for older pedestrians. However, the research did not compare results with traffic crashes involving the rest of the pedestrians (aged below 65). This omission is crucial for policymakers, as some road features might be riskier for all pedestrians, while others could affect older adults only. If only crashes involving older adults are studied, special measures for this demographic that should be applied to the entire population might be proposed. Furthermore, road segments are defined as 200 m segments and might include road junctions. Hence, this study includes crashes on road segments and road junctions but analyzes only the characteristics of the road segments. Finally, although they use a novel data collection technique through street-view imagery, some physical features (variables) that might interact with pedestrians were not included in the study.
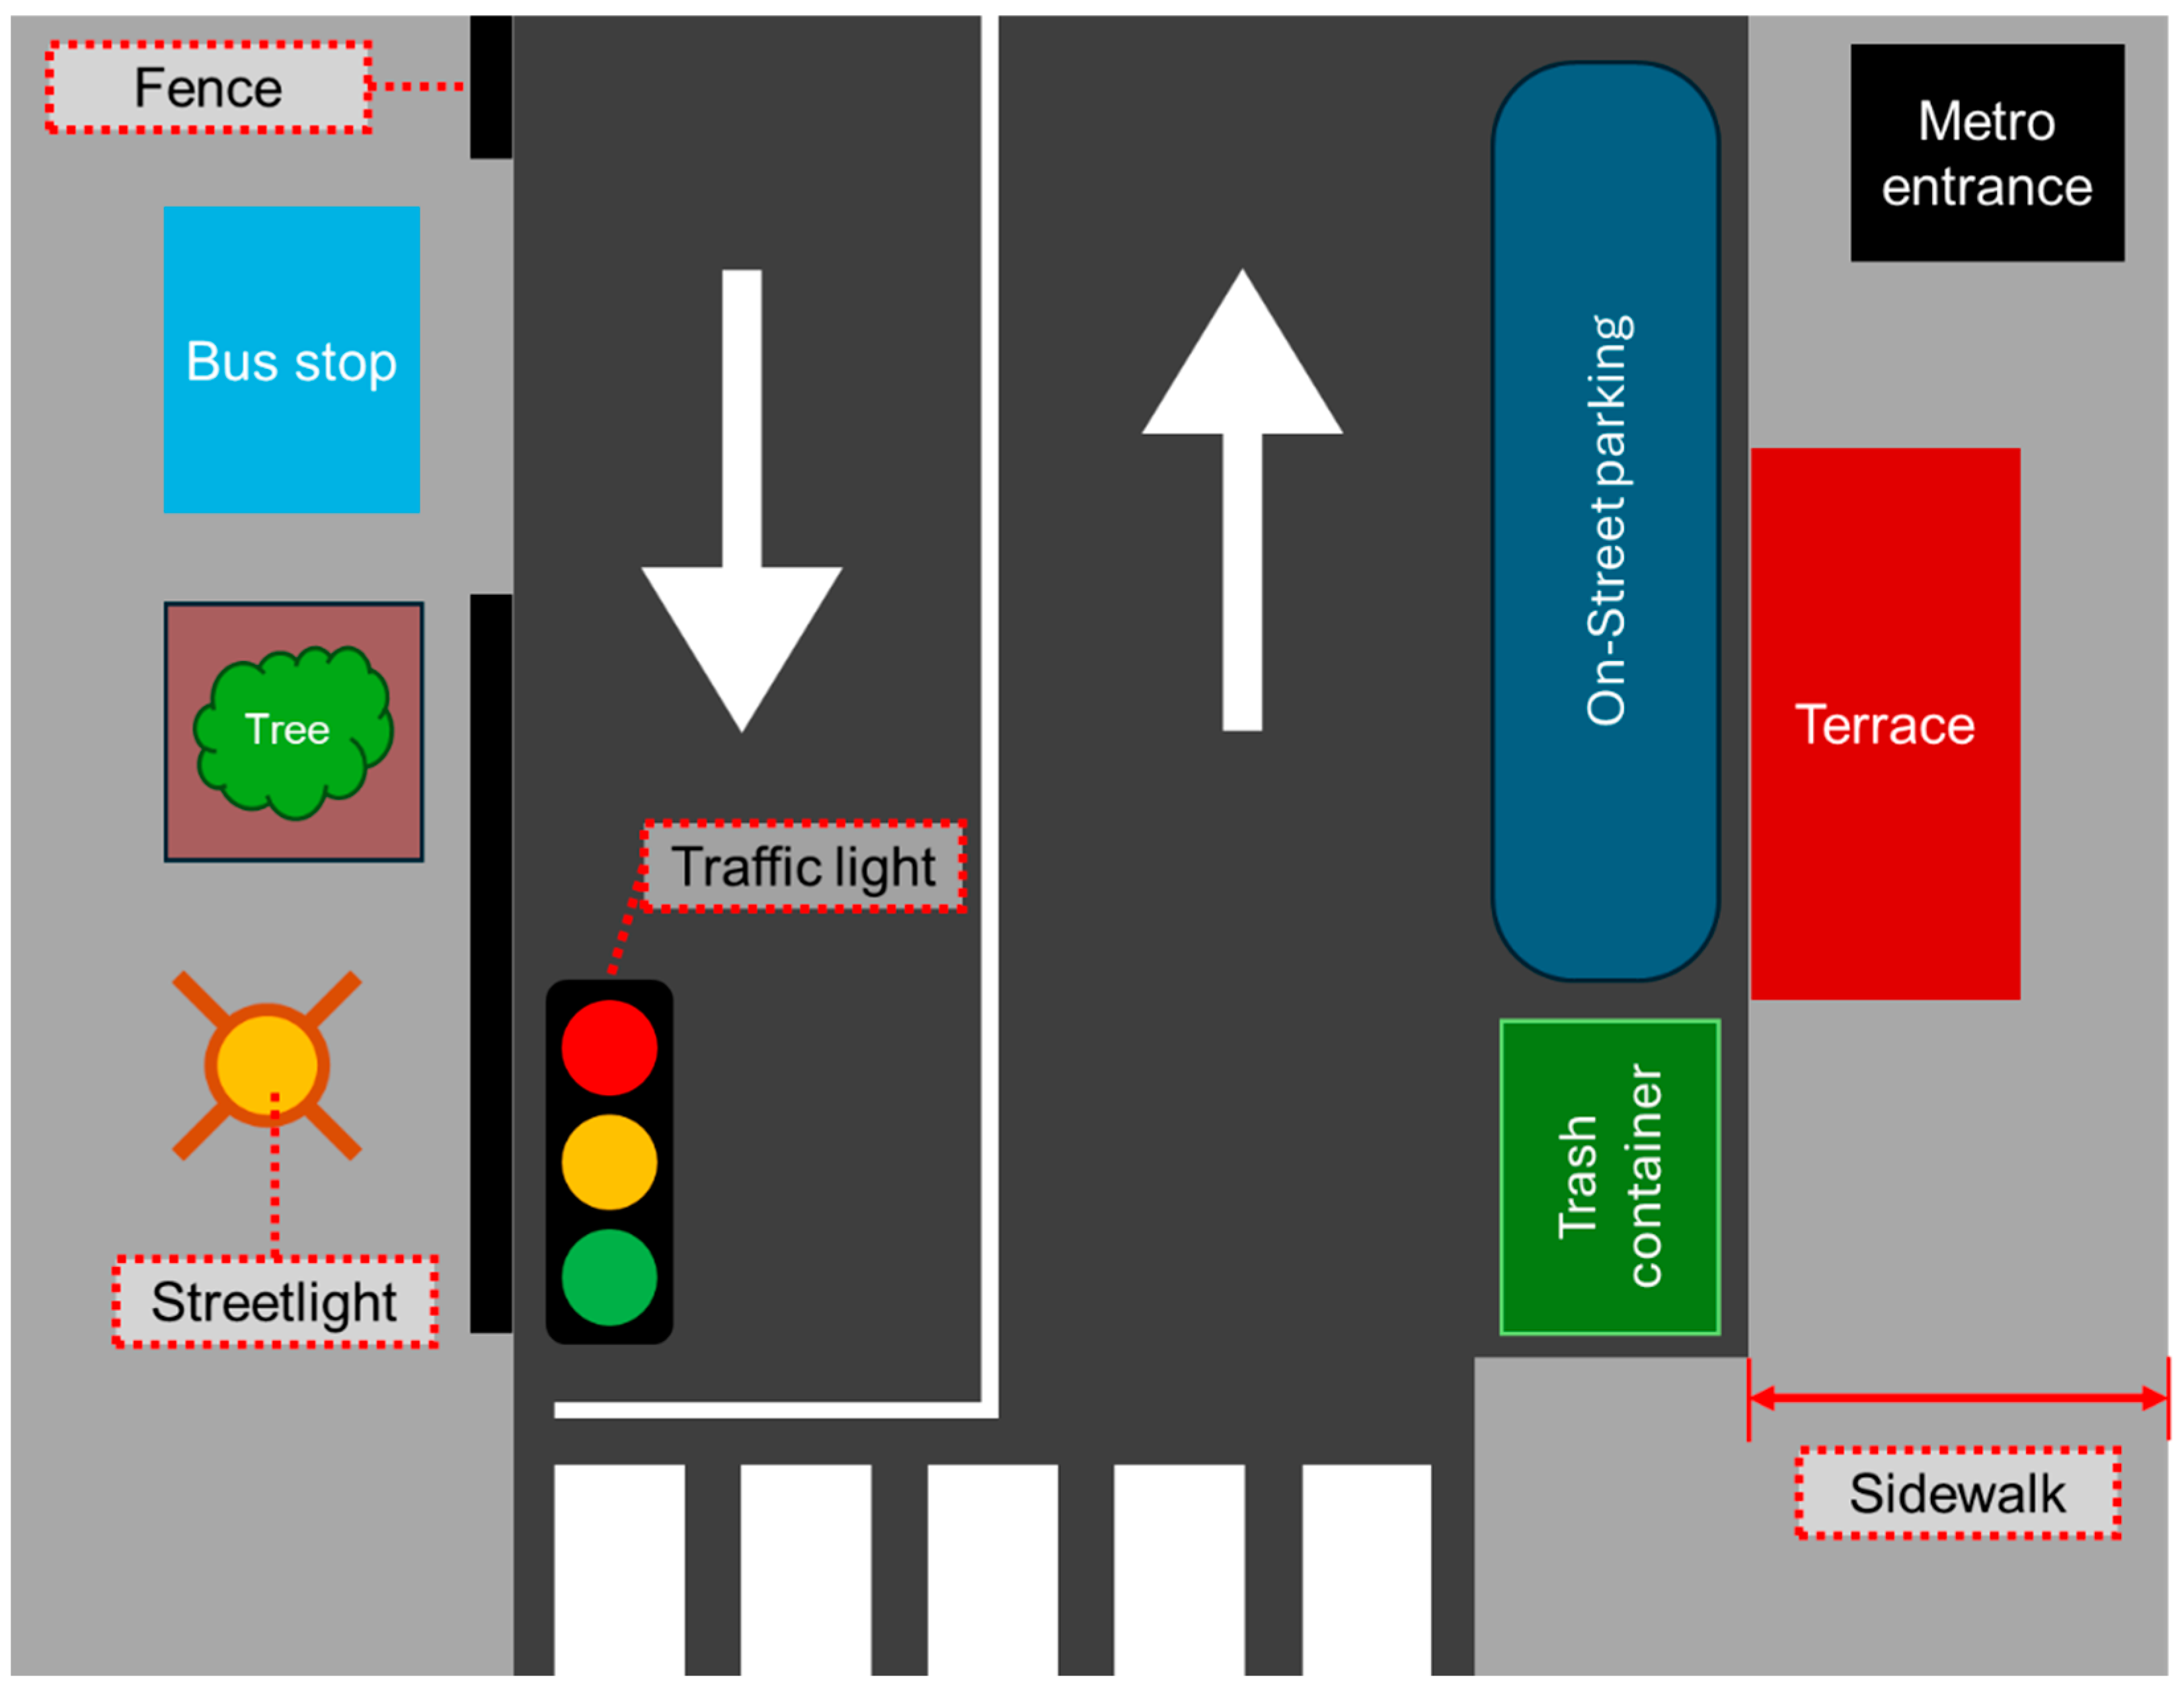
In this literature context, there is an absence of studies on older pedestrian road safety at the street segment level covering a holistic set of infrastructure variables to reflect most of the elements present in the streets, such as the presence of trees, trash containers, fences or terraces, and the intersections at the edges of the segment. There is also a lack of literature comparing older and non-older pedestrian traffic crashes at the segment level to identify factors related to the occurrence of all pedestrian crashes and those that affect specifically older pedestrians. The objective of this study is to identify critical factors influencing traffic crashes involving older pedestrians and propose countermeasures to create more age-friendly cities, especially focusing on infrastructure features. This approach holds significant value for policymakers and urban planners, as it will enable the identification of short-term infrastructure measures to mitigate older pedestrian traffic crashes. At this stage, traffic crashes on road segments were studied, as in Spanish urban roads, nearly two thirds of pedestrians were killed or injured on road segments [
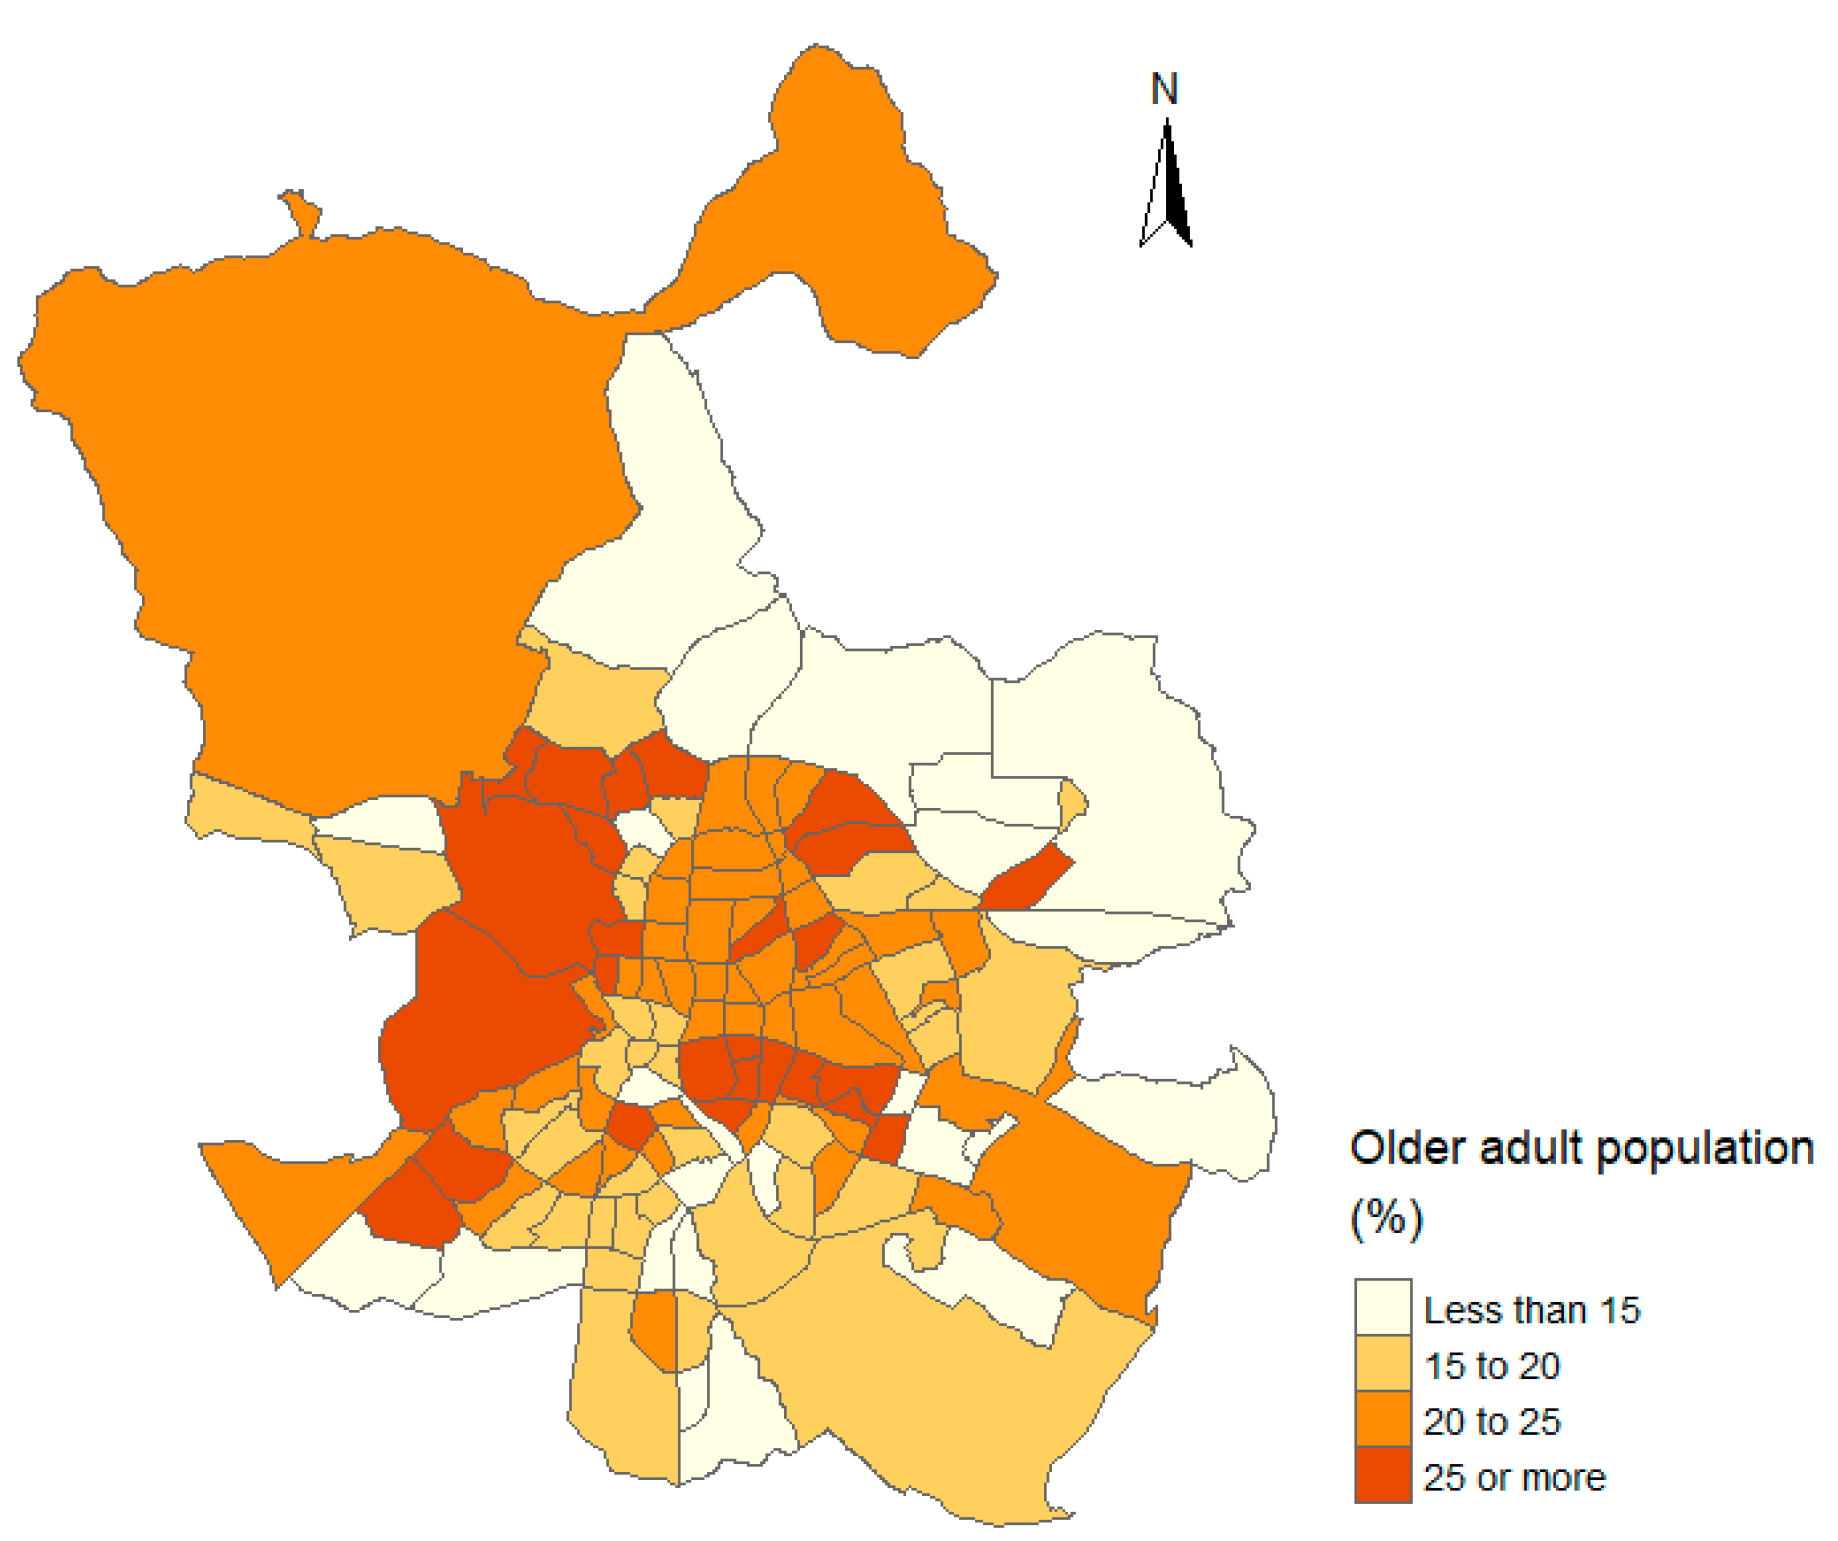
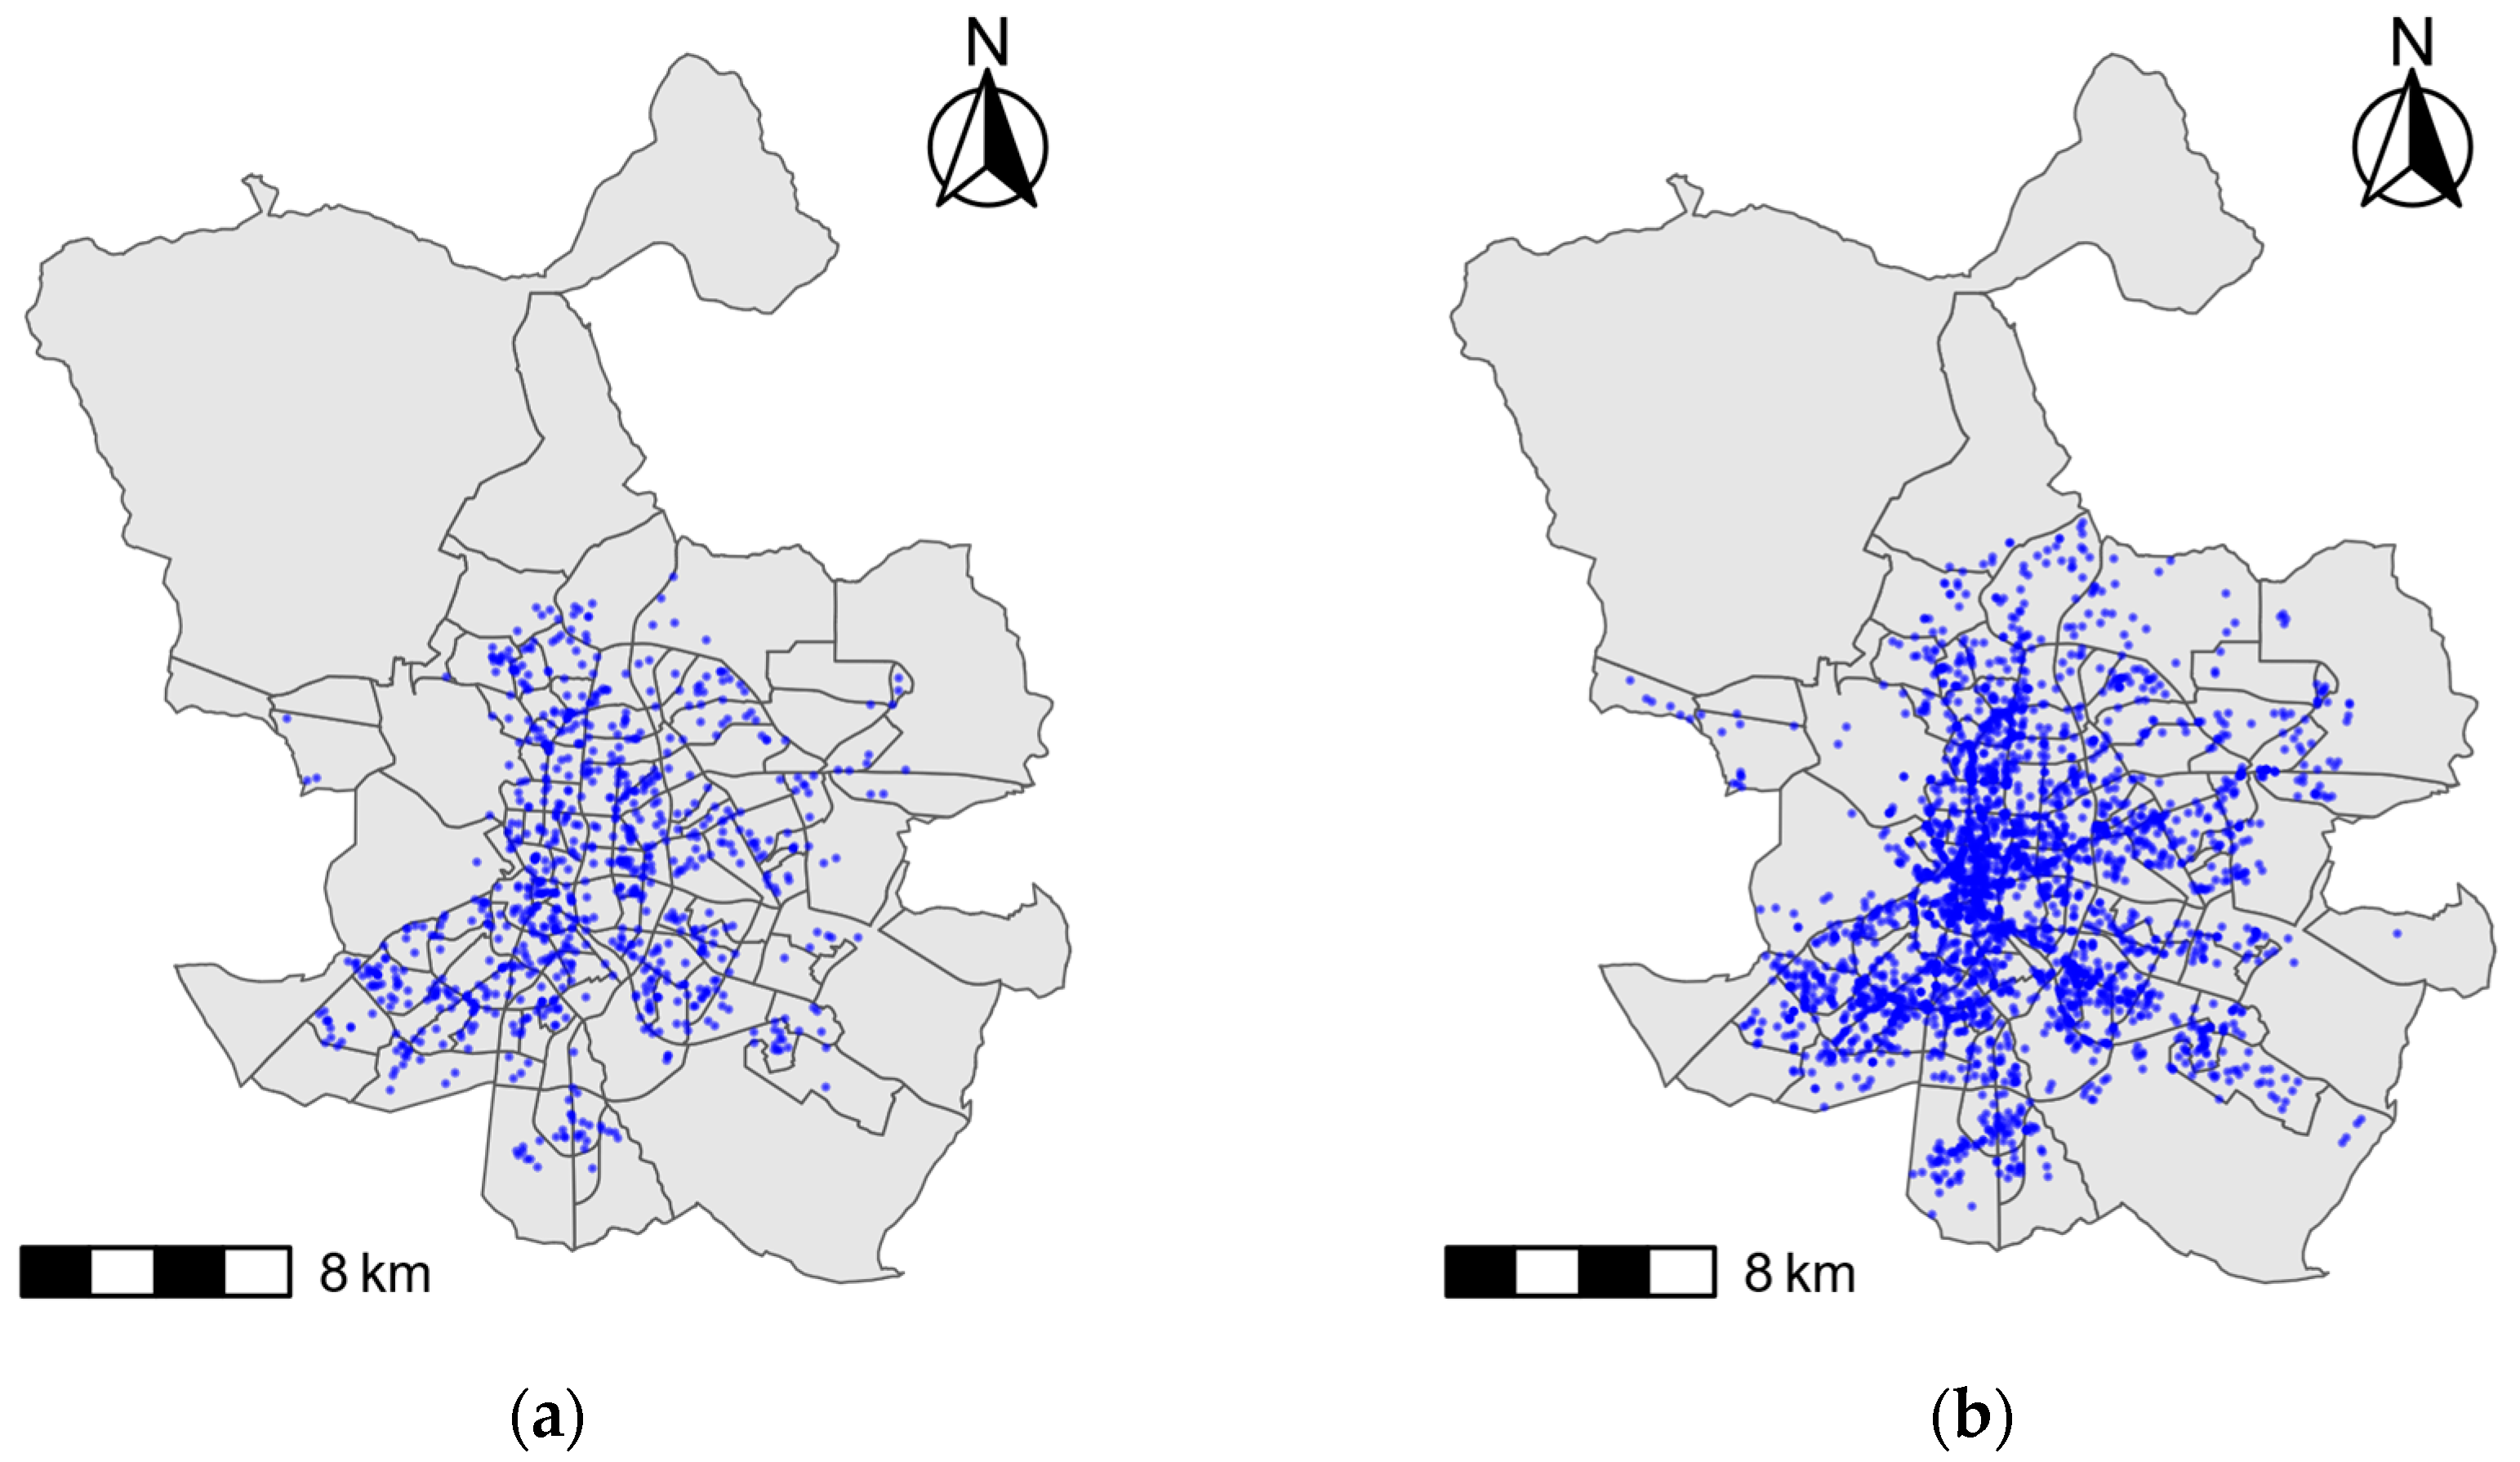
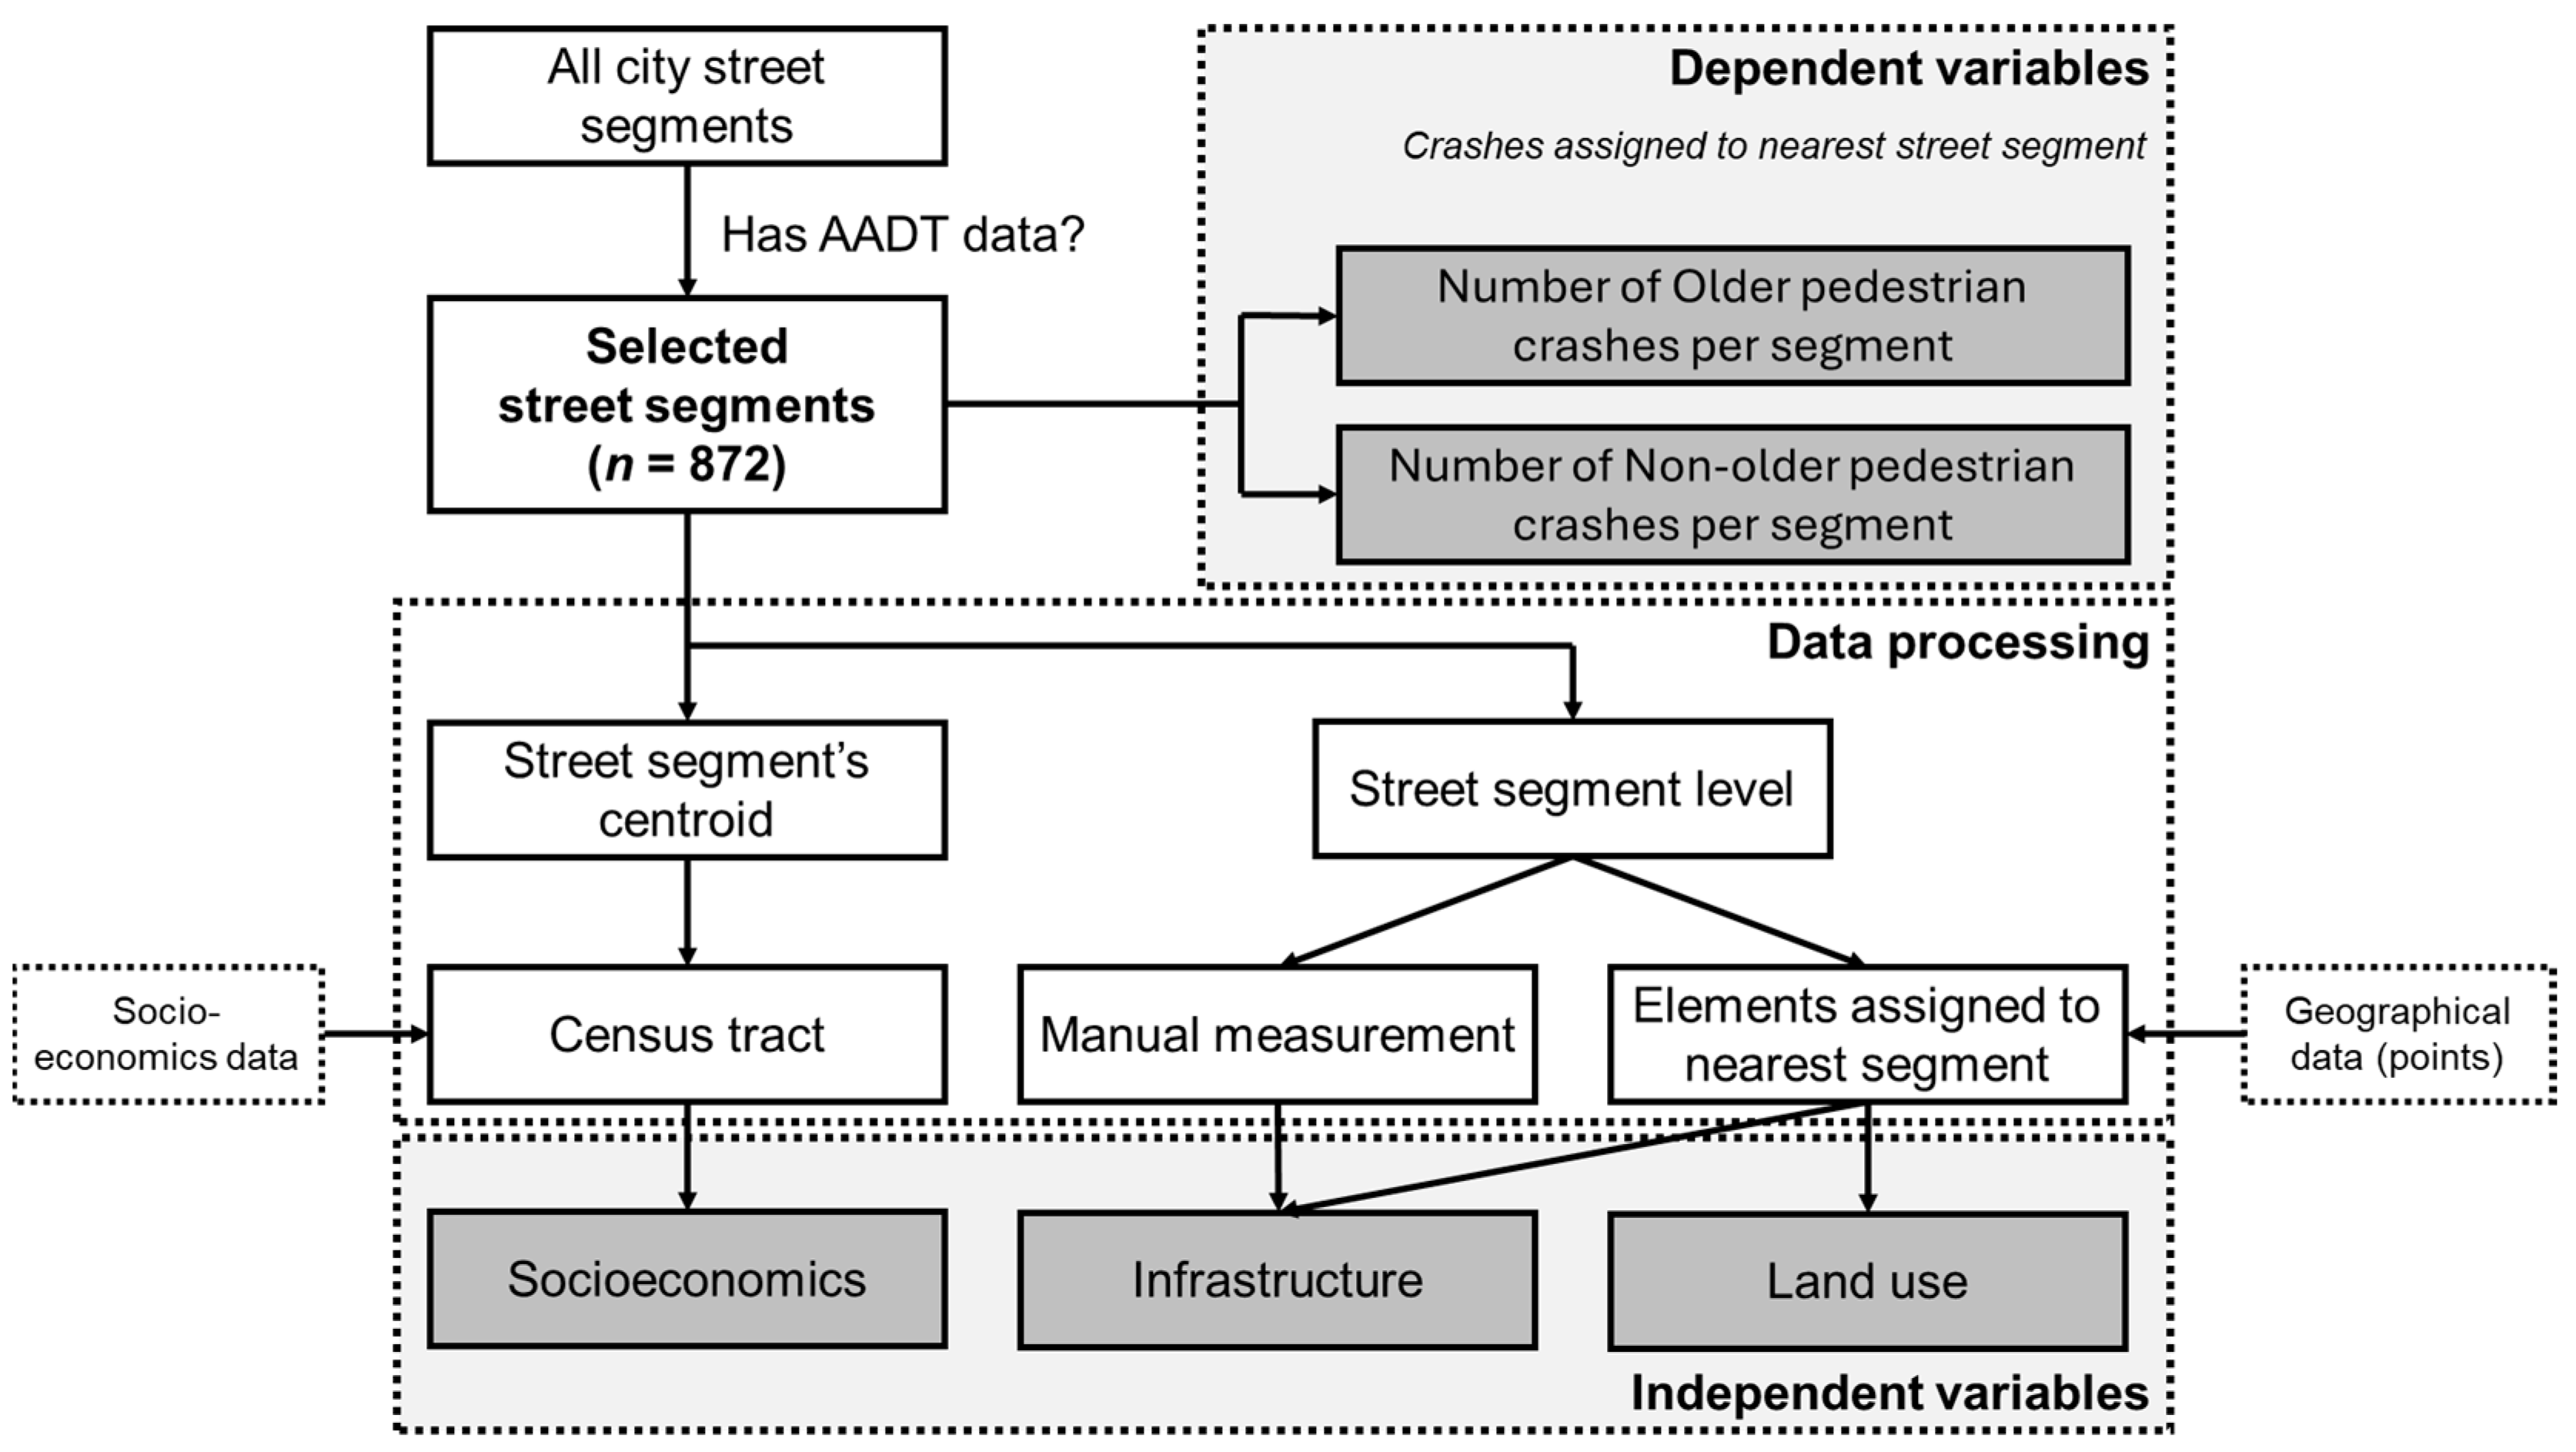
49], outside of intersections. The methodology relies on a Poisson model in a Bayesian framework utilizing the Integrated Nested Laplace Approximation (INLA) approach, which is employed to predict separately older and non-older pedestrian traffic crashes per road segment. The analysis utilizes a dataset spanning a 5-year period of pedestrian crashes in Madrid, Spain, in which 872 road segments have been studied.
The structure of this paper is as follows: Section 1 comprises the introduction, Section 2 describes the materials and methods, including the case study, database elaboration and description, and the statistical modelling approach; Section 3 includes the modeling results; Section 4 contains the discussion, and finally, Section 5 provides the conclusions, including future research lines.

2. Materials and Methods

2.1. Madrid Case Study

Spain is among the most aged countries globally, alongside Japan, Finland, Sweden, Greece, Italy, and Germany. In 2022, older adults (those over 65) represented 20% of the Spanish population with 6% over 80. Spain has a projected increase in the population over 65 from 20% in 2022 to 29% by 2040, and it also has notable life expectancies of 81 years for men and 87 years for women [16].
Regarding traffic crashes, older adults in Spain have a substantially higher fatality rate (number of dead people over number of injured people in traffic crashes) compared to the rest of the population (3.3 vs. 1.1). In 2021, the majority of older pedestrian deaths (82%) occurred in urban areas with 118 of the 144 total deaths [14]. This is higher than the 61% of all pedestrian traffic crashes that occur on urban roads, indicating older adults might walk more on urban roads. As stated by DGT [49], nearly two thirds of pedestrian fatalities in urban areas occurred on road segments (outside intersections) between 2016 and 2018 in Spain. These figures highlight the importance of studying traffic crashes involving older pedestrians on urban street segments.
Madrid, as Spain’s most populated city with a diverse population distribution, is a suitable case study. In 2022, the city had about 3.3 million residents, with those over 65 and over 80 comprising 20.3% and 7.1% of the population, respectively, which is above the national average. The city is divided into 21 districts and 131 neighborhoods. To illustrate these differences, Figure 1 shows the proportion of older adults in each neighborhood in 2022.
This study analyzed comprehensive traffic crash data over five years (2017, 2018, 2019, 2021, and 2022), excluding 2020 due to the COVID-19 pandemic’s impact on mobility patterns [50]. The data focused on pedestrian crashes on road segments, excluding intersection-related crashes. Street segments are defined as areas between road junctions, so no road junctions or crashes related to them were included in this analysis. Only single vehicle-pedestrian collisions (one pedestrian and one vehicle) were analyzed to focus on a single type of incident and to simplify assigning the pedestrian’s age. Older pedestrians were defined as those aged 65 and above. The final dataset included 3535 traffic crashes with 842 involving older pedestrians and 2692 involving non-older pedestrians. Figure 2 shows the locations of these crashes during the study period.

2.2. Database Description, Collection and Processing

2.2.1. Overview

Data collection and processing for this study involved intricate procedures. Detailed explanations are provided in the subsequent sections, but an overview is presented here for clarity and reproducibility, as illustrated in Figure 3.
Initially, all city road segments were considered. For this study, a subset of 872 road segments was selected because they had available Average Annual Daily Traffic (AADT) data, which provided crucial information for our analysis.
The dependent variables were identified by assigning crashes to the nearest road segment, categorizing them into older pedestrian crashes (individuals aged 65 and above) and non-older pedestrian crashes. This categorization helped with understanding the different factors that might affect these two groups differently. The number of crashes for each group was then calculated for each road segment.
Independent variables were collected for each road segment from various sources, systematically when possible, due to the high number of studied segments and to favor reproducibility. Socioeconomic data were derived from the census tract of the road segment’s centroid. Land use data, including points of interest (POIs) such as public, health, education, and leisure facilities, were assigned to the nearest road segment. Infrastructure data were obtained similarly whenever possible. When not feasible, such as with sidewalk width, manual measurements were taken to provide detailed information about each road segment’s physical characteristics.

2.2.2. Road Segment Selection

A crucial variable for each studied street segment is the AADT. In Madrid, there are more than two thousand AADT measurement points available for 2019. Two-way street segments had two measurement points to distinguish between traffic flows. The geometry of these road segments was carefully reviewed and corrected if necessary. Road segments containing tunnel entrances and bridges were excluded to avoid erroneous data collection. The remaining road segments all had sidewalks on both sides, except for five cases, which were removed from the sample. Therefore, only road segments with two sidewalks were considered. Finally, 872 road segments were included in this study. Despite this selection procedure, these segments are widely spread throughout the city (Figure 4), representing the most common segment types in a city.

2.2.3. Independent Variables

Independent variables were collected using established variables from the literature and additional factors deemed to influence the road safety of older pedestrians. This section describes the independent variables with the next section outlining data sources and data preparation.
The exposure variables are the length and Annual Average Daily Traffic (AADT) of the road segment, which are commonly used in road safety studies. Although pedestrian flow data would be ideal, they are only available for a few segments and do not account for the age of pedestrians [51]. Consequently, we could not include any pedestrian exposure variable, as is the case in other pedestrian road safety studies [52].
For socioeconomics, the population density and per capita income of the segment’s census tract were considered. These variables capture features that are difficult to measure directly, such as economic well-being. Higher-income areas typically have better infrastructure maintenance, so wealthier neighborhoods are expected to have better-maintained sidewalks and road surfaces.
The studied land use features are the points of interest (POIs) at the segment level. A POI is a specific location of significance within a geographic area. In this study, public (e.g., a police station), education and health (e.g., a school), and leisure (e.g., a restaurant) POIs were considered. Land use independent variables include the type-based number of POIs and the POIs distribution disparity index (PDDI) along the street segment. The PDDI (Equation (1)) is an ad hoc designed index that takes values from 0 (totally balanced distribution) to 1 (totally imbalanced distribution). If there are no POIs on the street segment, the PDDI value is set to 0.
P D D I i k = 0 ,   if   POI s i , A k = 0   and   POI s i , B k = 0 abs P O I s i , A k P O I s i , B k P O I s i , A k + P O I s i , B k ,   otherwise
where P D D I i k is the imbalance index of the POIs of the kth type in the ith road segment, P O I s i , A k is the number of POIs of type k in the side A of the ith road segment and P O I s i , B k is the number of POIs of type k in the side B of the ith road segment.
Infrastructure features were classified based on three primary issues regarding older pedestrians: ease of walking on the sidewalk, ease of crossing the street, and ease of detecting traffic. Certain features may fit into multiple categories, but they are grouped by their most pronounced impact. Figure 5 shows a diagram of the considered infrastructure variables.
Factors influencing the ease of walking on the sidewalk include sidewalk width and distribution (Equation (2)), the presence of trees, terraces, bus stops, metro entrances, streetlights, and street mean slope. Factors affecting the ease of crossing the street include the number of lanes, crosswalk density, traffic light density, and the presence of pedestrian fences. Factors influencing the ease of detecting traffic include the number of ways, the presence of on-street parking, and the presence of trash containers. An interaction term between the number of ways and the presence of a median was proposed based on the conclusions by Oxley et al. [26]. Detecting and processing traffic on a two-way street is easier on divided streets with medians. Hence, a two-way divided street is more similar to a one-way street than to a two-way undivided street.
s i d e w a l k   d i s t r i b u t i o n = a b s s i d e w a l k   w i d t h   A s i d e w a l k   w i d t h   B s i d e w a l k   w i d t h   A + s i d e w a l k   w i d t h   B
The contour conditions of road segments were considered, focusing on the intersection types at both ends of each segment. At three-legged intersections, pedestrians on the sidewalk opposite the third leg (pedestrian A, Figure 6) have an advantage in detecting oncoming traffic compared to those on the other sidewalk (pedestrian B, Figure 6), who must turn their heads more. Older pedestrians, who often have difficulty with neck rotation [15,53], are particularly affected. This disadvantage is mitigated at intersections with more than three legs. Intersections were categorized into three types: three legs, four legs, and more than four legs or roundabouts. Including these variables in the statistical model is challenging because the order of the intersections must be considered (which intersection is Intersection 1 and which is Intersection 2, Figure 6). To address this, these variables were transformed into a single feature representing the road segment’s level of complexity, ranging from A to C, as shown in Table 1.

2.2.4. Data Preparation

Data preparation consumed a significant portion of the overall time for this article. Independent variables were gathered from multiple data sources, involving both spatial and tabular data. Spatial data were processed using ArcMap software [54] (version 10.8.1), while tabular data were managed using R software [55] (version 4.4.1). Wherever possible, the characteristics of the studied street segments were acquired through automatic processes. Table 2 shows the descriptions of the collected variables.
Dependent variables, including the count per segment of traffic crashes involving both older and non-older pedestrians, were determined by assigning each crash to its closest road segment. The count of crashes for each road segment was then tabulated and analyzed.
For exposure variables, the length of each road segment was calculated using geometry from Madrid statistics in GIS format. The AADT was extracted from Madrid open data for 2019, excluding 2020 due to COVID-19 impacts. We meticulously curated this data, ensuring each point was as near as possible to the respective road segment.
Socioeconomic data were linked to each road segment by associating it with the census tract of its central point. The population density and per capita income from the census tract were then assigned to the corresponding road segment.
For land use, points of interest (POIs) in Madrid were extracted from OpenStreetMap (OSM [56]). POIs were categorized into public, education and health, and leisure groups. Each POI was assigned to the nearest road segment, capturing the distance and angle from each POI to the segment using ArcMap’s ‘Generate Near Table’ tool. Data processing derived the count of POIs by type on each side of the road segment, depending on the positive or negative sign of the angle (Figure 7). A threshold of 300 m was used to assign a POI to its nearest road segment. The categorized POI counts and the categorized POI distribution disparity index (PDDI) were computed.
Infrastructure features constituted most of the independent variables. Some variables were automatically collected, including bus stops, metro entrances, terraces, streetlights, traffic lights, on-street parking areas, and trash containers. However, the acquisition of the remaining variables could not be automated due to reliability concerns. For instance, the measurement of sidewalk width faced challenges due to the road axis geometry not perfectly aligning with the sidewalks.
Table 3 presents the summary statistics for the sample variables. Linear relationships among the independent variables were assessed using different techniques, depending on the nature of the variables. For pairs of numerical variables, Pearson’s correlation coefficient was applied; for pairs of dichotomous categorical variables, the phi coefficient was used; and for pairs of numerical and dichotomous categorical variables, the point-biserial correlation coefficient was employed. These three coefficients share a common interpretation: a value of ±1 indicates a perfect linear relationship between the variables, while a value of 0 indicates no relationship. Additionally, categorical variables with more than two levels (i.e., road type and contour complexity) were excluded from the analysis. The correlation matrix is presented in Table 4. Strong correlations (above 0.80) were identified for two pairs of variables: (1) the density of health and education POIs and health and education PDDI, and (2) the density of public POIs and public PDDI. These correlations are likely due to the fact that streets typically have either no health and education or public POIs, or only one in most cases. If there are 0 POIs, the PDDI is 0; if there is only 1 POI, the PDDI is 1, as that POI is necessarily located on one side of the street. Consequently, the PDDI for health and education POIs, as well as the PDDI of public POIs, does not add information to the database in most cases, and these variables have been excluded from the modeling process. There is also a notable correlation between AADT and the number of lanes (0.72); however, both variables were included in the modeling process, as AADT is a measure of crash risk exposure.

2.3. Statistical Modelling

2.3.1. Model Components

In traffic crash data modeling, current state-of-the-art approaches involve using a model that includes crash exposure, crash risk, a heterogeneity term, and a spatial autocorrelation term. The data generation process commonly follows a Poisson [57], Poisson gamma [58,59,60,61], also known as Negative Binomial, or a Poisson log-normal [62,63,64] distribution.
Crash exposure is typically measured using Annual Average Daily Traffic (AADT) and segment length, or vehicle–kilometers (a product of both). In pedestrian road safety studies, pedestrian flow volume is also an important factor. Researchers have used pedestrian counts [52], available only for segments with pedestrian sensors, and pedestrian density [65], which is measured in average walking meters per surface per day. However, the lack of such data is common, making it difficult to include pedestrian flow in studies [58,60]. Infrastructure factors affecting crash risk include exposure, road type, road surface, road environment, the presence of work zones, road alignment, cross-section, and traffic control measures [66].
The heterogeneity term accounts for unobserved heterogeneity by adding a unique term to each road element. The spatial term is usually calculated using a conditional autoregressive (CAR) model [67]. Other approaches include simultaneous autoregressive (SAR) models, generalized linear mixed models, generalized estimation equations [68], and geographically weighted regression [59]. The CAR model using a binary first-order neighborhood matrix, as defined by Wall [69], shows fair results [70] and is one of the most used models [63,71,72]. However, this approach is not suitable in our case, mostly due to the lack of neighboring segments for most studied segments, which is caused by selecting only those segments with available traffic volume data. Approximately 73% of these segments have no neighbors, and 21% have only one, making the introduction of a spatial term in the model unsuitable.

2.3.2. Model Formulation

The modeling process was conducted within a Bayesian framework using the INLA (Integrated Nested Laplace Approximations) approach, as proposed by Rue et al. [73]. INLA performs inference both faster and more accurately than the traditional Markov Chain Monte Carlo (MCMC) approach [74]. INLA was implemented using the R-INLA package (http://www.r-inla.org, accessed on 30 January 2024) in R software [55] (version 4.4.1).
In this study, the data generation process was set to follow a Poisson distribution, which is suitable for count data like traffic crashes. The number of traffic crashes in a road segment (Yi) depends on the Poisson parameter ( λ i ), as shown in Equation (3).
Y i | λ i ~ P o i s s o n ( λ i )
The logarithm of the Poisson parameter ( λ i ) is modeled as a linear function of the covariates (Equation (4)).
l o g λ i = α + l o g ( L ) + γ l o g ( A A D T ) + x i T β + v i
where α is the intercept, γ is the parameter of the exposure variables AADT, xi is the vector of covariates of the ith segment, and β is the vector of parameters of the covariates. Note that the exposure variable L is multiplied by 1. Finally, v i is the heterogeneity term (Equation (5)).
v i ~ N 0 , 1 τ v
where τ u is the precision of the normal distribution (inverse of the variance). Each v i is sampled from the same normal distribution. The hyperprior distribution of the precision is a log-gamma distribution with parameters 1 and 0.001 [ τ u ~ l o g g a m m a 1 ,   0.001 ].

3. Results

This section outlines the results derived from statistical modeling. Unlike deterministic methods, Bayesian statistics express uncertainty directly through inferred posterior distributions of the parameters. The mean of each parameter is presented along with its 95% and 90% Bayesian credible intervals (BCIs), which are represented by the 2.5% and 97.5% quantiles, and 5% and 95% quantiles of the posterior distribution, respectively. The effect of a variable is considered credible at a specific level when the corresponding BCI does not include zero. Unlike confidence intervals in frequentist statistics, which provide a range that would contain the true effect in a certain percentage of repeated samples, BCIs directly reflect the degree of certainty about the parameter’s value given the observed data. These results are illustrated in Table 5 (older adult pedestrian crashes model) and Table 6 (non-older adult pedestrian crashes model).
Both models reveal that certain variables influence all pedestrians with credible effects. These include Average Annual Daily Traffic (AADT), the density of leisure POIs, the presence of bus stops, and the density of crosswalks, all of which increase the expected number of crashes for all pedestrians. The precision value of the heterogeneity effect indicates that the covariates explain most of the data dispersion.
Apart from these effects, the number of traffic crashes involving older pedestrians is also affected by population density, the presence of trees on the sidewalk, the presence of trash containers, and the level of contour complexity. Higher population density increases collision risks. Trees and trash containers are also related to riskier streets. Roads ending in three-legged intersections (complexity A) are riskier compared to those without three-legged intersections (complexity C), while no credible effect is noted for complexity B. These variables have consistent but non-credible effects in the non-older pedestrian model.
Apart from the common patterns between both models stated above, the safety of non-older pedestrians is influenced by terraces, metro stations, and street type. Streets with terraces or metro entrances are riskier. Compared to one-way streets, two-way streets with a median are safer, while two-way streets without a median show no credible difference in safety. Interestingly, the effects of terraces and two-way streets with medians are opposite for older pedestrians, but these effects are not credible.
The remaining covariates did not show credible impacts in either model. Streets with no streetlights, less slope, fewer lanes, no traffic lights, and no on-street parking are riskier for all pedestrians. Additionally, two-way streets without medians and streets with intermediate contour complexity (complexity B) tend to have fewer pedestrian collisions. On the contrary, some variables demonstrated opposite effects between the two models. For instance, streets with more health and education POIs, fewer public POIs, and a more balanced distribution of leisure POIs are riskier for older pedestrians. Features contributing to safer conditions for older pedestrians included wider and better-balanced sidewalks and pedestrian fences. These effects are opposite in the non-older pedestrian crashes model.

4. Discussion

This section discusses the practical policies derived from the modeling results. The exposure variables, length and AADT, were associated with all pedestrian traffic crashes. Segment length was used as an offset variable, fixed at 1, which is in line with other authors [57,75]. AADT consistently increased pedestrian crashes, affirming its significance across all pedestrian groups.
Regarding the socioeconomic factors, population density showed a positive credible impact on older pedestrian crashes, which is consistent with previous literature [45], although it was not credible in the non-older pedestrians’ model. Higher average income per capita reduced all pedestrian collisions, which was expected due to better infrastructure maintenance and safer pedestrian behaviors [76]. The same result was found by other authors [45], but the effect of this variable was not credible.
Among land use factors, the presence of leisure points of interest (POIs) was the only credible variable, increasing crashes for both older and non-older pedestrians. Leisure POIs attract pedestrians who might walk around them without paying special attention to traffic and may feel safer due to crowded and well-maintained areas, leading to increased crashes. Similar results were reported by Lee et al. [44] for older pedestrians and by Zhu et al. [65] for pedestrians in general.
The most notable differences between the age groups were found in the infrastructure variables, which can be modified in the short-term to reduce crashes. Trees on sidewalks increased crashes for older pedestrians due to narrowed sidewalks and navigation hazards, making them more likely to walk on the pavement. This factor did not affect non-older pedestrians.
The most notable and interesting differences between the two age groups were found in the infrastructure variables, which are the most feasible factors to modify in order to reduce pedestrian crashes for older individuals or the general population.
Regarding the ease of walking on the sidewalk, the presence of trees was linked to increased crashes involving older pedestrians due to two main reasons. First, trees narrow the effective width of sidewalks with uncovered tree pits posing navigation hazards. This issue is exacerbated on narrow sidewalks, leading older adults to walk on the pavement, increasing their crash risk. Second, older individuals might prefer walking in areas with vegetation, resulting in higher pedestrian traffic and more crashes. This factor did not affect younger pedestrians, who navigate these sidewalks more easily.
The occurrence of non-older pedestrian crashes is influenced by two factors. First, restaurant terraces on sidewalks might impede pedestrian transit and reduce the ability to detect oncoming vehicles, increasing crashes. Non-older pedestrians may cross streets with terraces in undesignated areas, unlike older pedestrians who show a greater willingness than non-older people to cross at designated areas only [33]. Interestingly, the effect on older pedestrians is opposite, although not credible, which could indicate that terraces have a benefit for them serving as a barrier to vehicles. Second, metro station entrances on sidewalks are linked to more non-older pedestrian crashes, which is likely due to their attraction. Older pedestrians do not show this effect, which is possibly due to reduced metro usage by people over 64, who prefer the use of bus [77]. Similar results were found by Gálvez-Pérez et al. [45]. Streets with bus stops are riskier for all pedestrians, which was something already noted by Lv et al. [48] for the older pedestrian case. Buses might disrupt traffic flow and obstruct the view of oncoming vehicles with visibility further reduced at some bus stops due to opaque billboards.
In examining variables linked to the ease of crossing the street, crosswalk density is the only credible predictor, correlating with increased pedestrian crashes due to higher interactions between pedestrians and vehicles. Li et al. [78] found that older people feel safer in areas with more intersections, typically characterized by increased crosswalks, although these crosswalks would be located at intersections, which is outside the scope of our study. There is a need to protect these areas, especially for older pedestrians. Other non-credible variables show interesting effects. Traffic lights mitigate crashes by controlling traffic and reducing speeds. Pedestrian fences should lower crashes by acting as barriers, restricting crossings to designated areas. Older pedestrians, in particular, perceive a road safety benefit in streets with fences. However, younger pedestrians experience the opposite effect. This finding is similar to streets with terraces, where older individuals may tend to use designated crossing points, whereas younger ones might choose alternate paths, including potentially jumping fences, which is easier for them.
Regarding the ease of detecting traffic, credible variables are only found in the older pedestrian model. Trash containers, often placed on sidewalks or pavements, obstruct vision and make it more difficult for older individuals to detect traffic, especially those with visual or hearing impairment [15]. Streets with these containers were found to be riskier for older pedestrians. Streets with contour complexity level C (other than three-legged intersections at both ends) are associated with fewer crashes involving older pedestrians compared to streets with level A complexity (three-legged intersections).
Road safety education for older adults, which is already planned in Madrid [79], should be complemented with other measures. Regarding practical applications of this research for policymakers, modeling results suggest short-term road infrastructural measures that could be implemented to decrease the incidence of traffic crashes involving older pedestrians. Trees, while enhancing urban livability and providing benefits, including economic, social, and health benefits [80,81], may pose obstacles for older individuals on narrow or crowded sidewalks by significantly reducing available space. Furthermore, older adults may perceive fall risk if the tree pits are not properly maintained. It is advisable to avoid placing trees on streets with narrow sidewalks. More ideally, relocating trees to areas outside the sidewalks would potentially reduce on-street parking spaces, which would extend additional space for pedestrian use. It is important to select tree species that are appropriate for the given urban environment, particularly those that are suitable for narrower spaces. In wider sidewalks, covering tree pits with tree grates, usually metallic, can enhance safety by preventing potential trip hazards. In addition to improving the traffic safety, these measures would reduce the potential risk of falls, which is something especially beneficial for older people due to their longer recovery processes.
Trash containers, typically located near parking lots, present a more significant visual barrier for older pedestrians than parked vehicles due to their size and shape. Their placement can impair traffic detection, especially when positioned between pedestrians and approaching traffic. To improve traffic detection for older pedestrians, trash containers should be placed away from crosswalks and road junctions, avoiding any reduction in sight distance. Placing the containers between the pedestrians and the oncoming traffic should be avoided. It is recommended to position them close to the sidewalk edge despite the logistical challenges of moving them for emptying. Even minor increases in the gap between the sidewalk and a container can significantly improve sight distance. Marking optimal container placements on the pavement could ensure proper positioning.
Bus stops and crosswalks were found to increase all pedestrian crashes. Like trash containers, bus stops near crosswalks can block vehicle sightlines. To mitigate this, bus stops should avoid obstructing vision and could be replaced with posts. High-traffic bus stops crowd sidewalks and block sightlines, raising pedestrian crash risks and potentially leading to more severe injuries if a pedestrian is hit by a bus [82]. Safety could be improved by marking these areas and installing pedestrian fences where feasible. Regarding crosswalks, the main objective should be to properly mark and condition existing crosswalks, especially on wide streets, and extending green traffic light phases, as older pedestrians walk at slower speeds [28,29,83]. In older neighborhoods, this could enhance safety. Although the effect of traffic lights was not statistically significant, their installation could be beneficial by slowing down vehicle speeds, which is associated with less severe injuries in collisions [84,85].
It should be noted that all credible variables in both models show a consistent effect on the safety of both older and non-older pedestrians. Additionally, there are variables showing opposite effects on those age groups, but these are only credible in one or neither of the models. Consequently, none of the proposed countermeasures aimed at enhancing the safety of older pedestrians should result in a deterioration of safety for other pedestrians.

5. Conclusions

This study employed a Poisson model within a Bayesian framework, utilizing the Integrated Nested Laplace Approximation (INLA) approach, to analyze factors influencing traffic crashes involving both older and non-older pedestrians. A holistic view of the road segments was used through a wide set of infrastructure variables, including less common ones like restaurant terraces, trash containers, and on-street parking. These variables were analyzed to propose short-term countermeasures. Based on the results, we propose measures such as a better placement of trees, trash containers, and bus stops, installing more crosswalks and traffic lights, and extending the green phase of existing traffic lights. These improvements aim to enhance the safety of older pedestrians without compromising the safety of other pedestrians. Furthermore, they should be implemented without compromising the road’s operational performance or contributing to traffic jams.
The limitations of this study are mainly related to data availability. Average Annual Daily Traffic (AADT) data, crucial for analysis, was not available for all street segments, only for certain segments. Fortunately, these street segments are spread across various street types and areas, making them representative of the city network. Another limitation is the absence of pedestrian flow data, which is only collected on major streets in Madrid. For a more detailed analysis, pedestrian flow data categorized by age groups, specifically older versus non-older pedestrians, would be beneficial to better understand the dynamics and risks associated with each group.
Future research should address these issues to enhance the understanding of older pedestrian traffic safety. Ad hoc measurements of street and sidewalk widths limit data collection to a few records. While micro-studies are effective in developing infrastructure countermeasures, using small areal units in macro-studies (such as regular grids) could simplify data collection, reduce manual efforts, and minimize measurement errors. Additionally, calculating the ‘effective width’ of sidewalks and its impact on traffic crashes involving older pedestrians is a promising research direction. This would require precise measurements of actual sidewalk widths and the identification of elements that constrict these widths.
Despite a general willingness to develop inclusive urban spaces, prioritizing the integration of older pedestrians is crucial. This demographic faces a higher risk of fatalities and serious injuries from vehicle collisions and is vulnerable to social exclusion and isolation, which can result from reduced walking activity. Given the expected aging population in developed countries, additional efforts are needed to ensure their safety and inclusion in age-friendly urban planning initiatives. Such inclusion should not only create safer streets for older adults and promote walking activity among this group but also help to reduce ageist stereotypes.
The scientific community, particularly road safety experts, must be sensitive to the needs of the older population and their social integration challenges. This approach is essential for generating practical, applied research with effective policy proposals for road infrastructure interventions, aiding in the design of age-friendly cities.

Author Contributions

Conceptualization, D.G.-P. and B.G.; methodology, D.G.-P.; software, D.G.-P.; validation, B.G. and A.O.; formal analysis, D.G.-P.; investigation, D.G.-P., B.G. and A.O.; resources, D.G.-P.; data curation, D.G.-P.; writing—original draft preparation, D.G.-P., B.G. and A.O.; writing—review and editing, D.G.-P., B.G. and A.O.; visualization, D.G.-P.; supervision, B.G. and A.O.; project administration, B.G. All authors have read and agreed to the published version of the manuscript.

Funding

Daniel Gálvez-Pérez is conducting his doctoral thesis with the support of a grant from the Universidad Politécnica de Madrid through the “Programa Propio de I + D + I 2020: Ayudas para Contratos Predoctorales”.

Institutional Review Board Statement

Not applicable.

Informed Consent Statement

Not applicable.

Data Availability Statement

The data presented in this study are available on request from the corresponding author.

Acknowledgments

The authors wish to express their gratitude to the Dirección General de Tráfico (DGT) for providing the traffic crash data used in this study.

Conflicts of Interest

The authors declare no conflicts of interest. The funders had no role in the design of the study; in the collection, analyses, or interpretation of data; in the writing of the manuscript; or in the decision to publish the results.

References

  1. Ungvari, Z.; Fazekas-Pongor, V.; Csiszar, A.; Kunutsor, S.K. The multifaceted benefits of walking for healthy aging: From Blue Zones to molecular mechanisms. GeroScience 2023, 45, 3211–3239. [Google Scholar] [CrossRef] [PubMed]
  2. Shellito, N.; Roldan, N.V. Walking away from loneliness: The mediating role of social isolation. Innov. Aging 2019, 3 (Suppl. S1), S836–S837. [Google Scholar] [CrossRef]
  3. Liu, J.; Zhong, S.; Huang, Y.; Wang, Z. How does the preference heterogeneity affect the elderly’s evaluation of bus accessibility? Evidence from Guangzhou, China. J. Transp. Health 2021, 22, 101094. [Google Scholar] [CrossRef]
  4. Gabriel, Z.; Bowling, A. Quality of life from the perspectives of older people. Ageing Soc. 2004, 24, 675–691. [Google Scholar] [CrossRef]
  5. Musselwhite, C.; Holland, C.; Walker, I. The role of transport and mobility in the health of older people. J. Transp. Health 2015, 2, 1–4. [Google Scholar] [CrossRef]
  6. Nordbakke, S.; Schwanen, T. Well-being and Mobility: A Theoretical Framework and Literature Review Focusing on Older People. Mobilities 2014, 9, 104–129. [Google Scholar] [CrossRef]
  7. Mizuta, S.; Uchida, K.; Sawa, R.; Nakamura, J.; Encho, H.; Akisue, T.; Ono, R. Context of walking and loneliness among community-dwelling older adults: A cross-sectional study. BMC Geriatr. 2023, 23, 326. [Google Scholar] [CrossRef]
  8. Iversen, T.N.; Larsen, L.; Solem, P.E. A conceptual analysis of Ageism. Nord. Psychol. 2012, 61, 4–22. [Google Scholar] [CrossRef]
  9. Lee, K.; Hyun, K.; Mitchell, J.; Saha, T.; Gibson, N.O.; Krejci, C. Exploring Factors Enhancing Resilience Among Marginalized Older Adults During the COVID-19 Pandemic. J. Appl. Gerontol. 2022, 41, 610–618. [Google Scholar] [CrossRef]
  10. Irvine, K.N.; Fisher, D.; Marselle, M.R.; Currie, M.; Colley, K.; Warber, S.L. Social Isolation in Older Adults: A Qualitative Study on the Social Dimensions of Group Outdoor Health Walks. Int. J. Environ. Res. Public Health 2022, 19, 5353. [Google Scholar] [CrossRef]
  11. D’Cruz, M.; Banerjee, D. ‘An invisible human rights crisis’: The marginalization of older adults during the COVID-19 pandemic—An advocacy review. Psychiatry Res. 2020, 292, 113369. [Google Scholar] [CrossRef] [PubMed]
  12. European Commission. European Road Safety Observatory. Road Safety Thematic Report—Seniors.; European Commission: Brussels, Belgium, 2021.
  13. European Commission. European Road Safety Observatory. Facts and Figures—Pedestrians 2023.; European Commission: Brussels, Belgium, 2023.
  14. DGT. Las principales cifras de la Siniestralidad Vial España 2021. 2021. Available online: https://www.dgt.es/export/sites/web-DGT/.galleries/downloads/dgt-en-cifras/24h/Principales_cifras_2021_web_accesible_con_Meta.pdf (accessed on 15 June 2024).
  15. European Commission. ElderSafe-Risks and Countermeasures for Road Traffic of Elderly in Europe (No. MOVE/C4/2014-244); European Commission–Directorate-General for Mobility and Transport (DG-MOVE): Brussels, Belgium, 2015.
  16. European Commission. 2024 Ageing Report: Underlying Assumptions and Projection Methodologies; European Commission: Brussels, Belgium, 2023.
  17. Rémillard-Boilard, S.; Buffel, T.; Phillipson, C. Developing Age-Friendly Cities and Communities: Eleven Case Studies from around the World. Int. J. Environ. Res. Public Health 2021, 18, 133. [Google Scholar] [CrossRef] [PubMed]
  18. World Health Organization. Hidden Cities: Unmasking and Overcoming Health Inequities in Urban Settings; Word Health Organization, Centre for Health Development: Geneva, Switzerland, 2010.
  19. Dumbaugh, E. Designing Communities to Enhance the Safety and Mobility of Older Adults. J. Plan. Lit. 2008, 23, 17–36. [Google Scholar] [CrossRef]
  20. Schmeidler, K. Safe and Secure Cities for Pedestrians and Senior Citizens. IOP Conf. Ser. Mater. Sci. Eng. 2020, 960, 042099. [Google Scholar] [CrossRef]
  21. World Health Organization. Global Age-Friendly Cities: A Guide: World Health Organization; World Health Organization: Geneva, Switzerland, 2007.
  22. Estebsari, F.; Dastoorpoor, M.; Khalifehkandi, Z.R.; Nouri, A.; Mostafaei, D.; Hosseini, M.; Esmaeili, R.; Aghababaeian, H. The Concept of Successful Aging: A Review Article. Curr. Aging Sci. 2019, 13, 4–10. [Google Scholar] [CrossRef]
  23. World Health Organization. Active Ageing: A Policy Framework. 2002. Available online: https://iris.who.int/handle/10665/67215 (accessed on 15 June 2024).
  24. United Nations. Resolution Adopted by the General Assembly on 25 September 2015; United Nations: New York, NY, USA, 2015.
  25. European Commission. EU Road Safety: Towards “Vision Zero”; European Commission: Brussels, Belgium, 2022.
  26. Oxley, J.; Fildes, B.; Ihsen, E.; Charlton, J.; Day, R. Differences in traffic judgements between young and old adult pedestrians. Accid. Anal. Prev. 1997, 29, 839–847. [Google Scholar] [CrossRef]
  27. Vine, D.; Buys, L.; Aird, R. Experiences of Neighbourhood Walkability Among Older Australians Living in High Density Inner-City Areas. Plan. Theory Pract. 2012, 13, 421–444. [Google Scholar] [CrossRef]
  28. Ortuño, R.R. La regulación de los semáforos peatonales en España: ¿tienen las personas mayores tiempo suficiente para cruzar? Rev. Española Geriatría Y Gerontol. 2010, 45, 199–202. [Google Scholar] [CrossRef]
  29. Van Hoof, J.; Dikken, J.; Buttiġieġ, S.C.; van den Hoven, R.F.; Kroon, E.; Marston, H.R. Age-friendly cities in the Netherlands: An explorative study of facilitators and hindrances in the built environment and ageism in design. Indoor Built Environ. 2020, 29, 417–437. [Google Scholar] [CrossRef]
  30. European Commission. European Road Safety Observatory. Facts and Figures Seniors 2021.; European Commission: Brussels, Belgium, 2021.
  31. Zegeer, C.V.; Stutts, J.C.; Huang, H.; Zhou, M.; Lodgman, E. Analysis of Elderly Pedestrian Accidents and Recommended Countermeasures. Transp. Res. Rec. 1993, 1405, 56–63. [Google Scholar]
  32. Abou-Raya, S.; ElMeguid, L.A. Road traffic accidents and the elderly. Geriatr. Gerontol. Int. 2009, 9, 290–297. [Google Scholar] [CrossRef]
  33. Bernhoft, I.M.; Carstensen, G. Preferences and behaviour of pedestrians and cyclists by age and gender. Transp. Res. Part F Traffic Psychol. Behav. 2008, 11, 83–95. [Google Scholar] [CrossRef]
  34. Ravi, K.E.; Fields, N.L.; Dabelko-Schoeny, H. Outdoor spaces and buildings, transportation, and environmental justice: A qualitative interpretive meta-synthesis of two age-friendly domains. J. Transp. Health 2021, 20, 100977. [Google Scholar] [CrossRef]
  35. Dommes, A.; Cavallo, V.; Vienne, F.; Aillerie, I. Age-related differences in street-crossing safety before and after training of older pedestrians. Accid. Anal. Prev. 2012, 44, 42–47. [Google Scholar] [CrossRef]
  36. Dommes, A.; Cavallo, V.; Oxley, J. Functional declines as predictors of risky street-crossing decisions in older pedestrians. Accid. Anal. Prev. 2013, 59, 135–143. [Google Scholar] [CrossRef] [PubMed]
  37. Martin, A.; Hand, E.; Trace, F.; O’neill, D. Pedestrian Fatalities and Injuries Involving Irish Older People. Gerontology 2010, 56, 266–271. [Google Scholar] [CrossRef] [PubMed]
  38. Kim, S.; Ulfarsson, G.F. Traffic safety in an aging society: Analysis of older pedestrian crashes. J. Transp. Saf. Secur. 2019, 11, 323–332. [Google Scholar] [CrossRef]
  39. Das, S.; Bibeka, A.; Sun, X.; Zhou, H.; Jalayer, M. Elderly Pedestrian Fatal Crash-Related Contributing Factors: Applying Empirical Bayes Geometric Mean Method. Transp. Res. Rec. J. Transp. Res. Board 2019, 2673, 254–263. [Google Scholar] [CrossRef]
  40. Wang, Y.; Haque, M.; Chin, H.-C. Elderly pedestrian injuries in Singapore. J. Transp. Saf. Secur. 2017, 9, 273–300. [Google Scholar] [CrossRef]
  41. Laković, S.; Tollazzi, T.; Gruden, C. Elderly Pedestrians and Road Safety: Findings from the Slovenian Accident Database and Measures for Improving Their Safety. Sustainability 2023, 15, 1631. [Google Scholar] [CrossRef]
  42. Ziakopoulos, A.; Yannis, G. A review of spatial approaches in road safety. Accid. Anal. Prev. 2020, 135, 105323. [Google Scholar] [CrossRef] [PubMed]
  43. Dumbaugh, E.; Zhang, Y. The Relationship between Community Design and Crashes Involving Older Drivers and Pedestrians. J. Plan. Educ. Res. 2013, 33, 83–95. [Google Scholar] [CrossRef]
  44. Lee, S.; Yoon, J.; Woo, A. Does elderly safety matter? Associations between built environments and pedestrian crashes in Seoul, Korea. Accid. Anal. Prev. 2020, 144, 105621. [Google Scholar] [CrossRef] [PubMed]
  45. Gálvez-Pérez, D.; Guirao, B.; Ortuño, A.; Picado-Santos, L. The Influence of Built Environment Factors on Elderly Pedestrian Road Safety in Cities: The Experience of Madrid. Int. J. Environ. Res. Public Health 2022, 19, 2280. [Google Scholar] [CrossRef]
  46. Gálvez-Pérez, D.; Guirao, B.; Ortuño, A. Analysis of the elderly pedestrian traffic accidents in urban scenarios: The case of the Spanish municipalities. Int. J. Inj. Control. Saf. Promot. 2024, 31, 376–395. [Google Scholar] [CrossRef]
  47. Kim, D. The transportation safety of elderly pedestrians: Modeling contributing factors to elderly pedestrian collisions. Accid. Anal. Prev. 2019, 131, 268–274. [Google Scholar] [CrossRef]
  48. Lv, M.; Wang, N.; Yao, S.; Wu, J.; Fang, L. Towards Healthy Aging: Influence of the Built Environment on Elderly Pedestrian Safety at the Micro-Level. Int. J. Environ. Res. Public Health 2021, 18, 9534. [Google Scholar] [CrossRef]
  49. DGT. Las principales cifras de la siniestralidad de los peatones España 2018. 2018. Available online: https://www.dgt.es/menusecundario/dgt-en-cifras/dgt-en-cifras-resultados/dgt-en-cifras-detalle/Las-principales-cifras-de-la-Sinestralidad-de-los-Peatones-2018/ (accessed on 15 June 2024).
  50. Shaik, M.E.; Ahmed, S. An overview of the impact of COVID-19 on road traffic safety and travel behavior. Transp. Eng. 2022, 9, 100119. [Google Scholar] [CrossRef]
  51. Ayuntamiento de Madrid. Estado de la Movilidad de la Ciudad de Madrid. Informe Anual 2019. Madrid. 2019. Available online: https://transparencia.madrid.es/FWProjects/transparencia/Movilidad/Trafico/InformesMovilidad/InformeMovilidad2019.pdf (accessed on 15 June 2024).
  52. Zhu, M.; Sze, N.; Newnam, S. Effect of urban street trees on pedestrian safety: A micro-level pedestrian casualty model using multivariate Bayesian spatial approach. Accid. Anal. Prev. 2022, 176, 106818. [Google Scholar] [CrossRef]
  53. Dunbar, G.; Holland, C.A.; Maylor, E.A. Older Pedestrians: A Critical Review of the Literature; Department of Transport: London, UK, 2004. [Google Scholar]
  54. ArcMap, 10.8.1; Esri Inc.: Redlands, CA, USA, 2020.
  55. R Core Team. R: A Language and Environment for Statistical Computing. R Foundation for Statistical Computing; R Core Team: Viena, Austria, 2013. [Google Scholar]
  56. OpenStreetMap Contributors. OpenStreetMap. Available online: https://www.openstreetmap.org/ (accessed on 15 June 2024).
  57. Satria, R.; Aguero-Valverde, J.; Castro, M. Spatial analysis of road crash frequency using Bayesian models with Integrated Nested Laplace Approximation (INLA). J. Transp. Saf. Secur. 2021, 13, 1240–1262. [Google Scholar] [CrossRef]
  58. Kraidi, R.; Evdorides, H. Pedestrian safety models for urban environments with high roadside activities. Saf. Sci. 2020, 130, 104847. [Google Scholar] [CrossRef]
  59. Liu, J.; Khattak, A.J.; Wali, B. Do safety performance functions used for predicting crash frequency vary across space? Applying geographically weighted regressions to account for spatial heterogeneity. Accid. Anal. Prev. 2017, 109, 132–142. [Google Scholar] [CrossRef] [PubMed]
  60. Soltani, N.; Saffarzadeh, M.; Naderan, A. Modeling crash frequencies by transportation mode using micro/macro level variables. AUT J. Civ. Eng. 2021, 5, 161–170. [Google Scholar] [CrossRef]
  61. Thakali, L.; Fu, L.; Chen, T. Model-Based Versus Data-Driven Approach for Road Safety Analysis: Do More Data Help? Transp. Res. Rec. J. Transp. Res. Board 2016, 2601, 33–41. [Google Scholar] [CrossRef]
  62. Aguero-Valverde, J. Full Bayes Poisson gamma, Poisson lognormal, and zero inflated random effects models: Comparing the precision of crash frequency estimates. Accid. Anal. Prev. 2013, 50, 289–297. [Google Scholar] [CrossRef]
  63. Barua, S.; El-Basyouny, K.; Islam, T. A Full Bayesian multivariate count data model of collision severity with spatial correlation. Anal. Methods Accid. Res. 2014, 3-4, 28–43. [Google Scholar] [CrossRef]
  64. Ma, J.; Kockelman, K.M.; Damien, P. A multivariate Poisson-lognormal regression model for prediction of crash counts by severity, using Bayesian methods. Accid. Anal. Prev. 2008, 40, 964–975. [Google Scholar] [CrossRef]
  65. Zhu, M.; Li, H.; Sze, N.; Ren, G. Exploring the impacts of street layout on the frequency of pedestrian crashes: A micro-level study. J. Saf. Res. 2022, 81, 91–100. [Google Scholar] [CrossRef]
  66. Papadimitriou, E.; Filtness, A.; Theofilatos, A.; Ziakopoulos, A.; Quigley, C.; Yannis, G. Review and ranking of crash risk factors related to the road infrastructure. Accid. Anal. Prev. 2019, 125, 85–97. [Google Scholar] [CrossRef]
  67. Besag, J. Spatial Interaction and the Statistical Analysis of Lattice Systems. 1974. Available online: https://www.jstor.org/stable/2984812 (accessed on 15 June 2024).
  68. Dormann, C.F.; McPherson, J.M.; Araújo, M.B.; Bivand, R.; Bolliger, J.; Carl, G.; Davies, R.G.; Hirzel, A.; Jetz, W.; Kissling, W.D.; et al. Methods to account for spatial autocorrelation in the analysis of species distributional data: A review. Ecography 2007, 30, 609–628. [Google Scholar] [CrossRef]
  69. Wall, M.M. A close look at the spatial structure implied by the CAR and SAR models. J. Stat. Plan. Inference 2004, 121, 311–324. [Google Scholar] [CrossRef]
  70. Aguero-Valverde, J.; Jovanis, P.P. Analysis of Road Crash Frequency with Spatial Models. Transp. Res. Rec. J. Transp. Res. Board 2008, 2061, 55–63. [Google Scholar] [CrossRef]
  71. Wang, C.; Quddus, M.A.; Ison, S.G. Impact of traffic congestion on road accidents: A spatial analysis of the M25 motorway in England. Accid. Anal. Prev. 2009, 41, 798–808. [Google Scholar] [CrossRef] [PubMed]
  72. Ahmed, M.; Huang, H.; Abdel-Aty, M.; Guevara, B. Exploring a Bayesian hierarchical approach for developing safety performance functions for a mountainous freeway. Accid. Anal. Prev. 2011, 43, 1581–1589. [Google Scholar] [CrossRef]
  73. Rue, H.; Martino, S.; Chopin, N. Approximate Bayesian inference for latent Gaussian models by using integrated nested Laplace approximations. J. R. Stat. Soc. Ser. B Stat. Methodol. 2009, 71, 319–392. [Google Scholar] [CrossRef]
  74. Rue, H.; Riebler, A.; Sørbye, S.H.; Illian, J.B.; Simpson, D.P.; Lindgren, F.K. Bayesian Computing with INLA: A Review. Annu. Rev. Stat. Its Appl. 2017, 4, 395–421. [Google Scholar] [CrossRef]
  75. Aguero-Valverde, J. Direct Spatial Correlation in Crash Frequency Models: Estimation of the Effective Range. J. Transp. Saf. Secur. 2014, 6, 21–33. [Google Scholar] [CrossRef]
  76. Rosenbloom, T.; Sapir-Lavid, Y.; Perlman, A. Risk factors in road crossing among elderly pedestrians and readiness to adopt safe behavior in socio-economic comparison. Accid. Anal. Prev. 2016, 93, 23–31. [Google Scholar] [CrossRef]
  77. CRTM. Encuesta domiciliaria de movilidad en día laborable de 2018 en la Comunidad de Madrid. Caracterización socioeconómica de la movilidad. 2019. Available online: https://www.crtm.es/media/jjcn0svt/edm18_doc2_socio_econ.pdf (accessed on 15 June 2024).
  78. Li, F.; Fisher, K.J.; Brownson, R.C.; Bosworth, M. Multilevel modelling of built environment characteristics related to neighbourhood walking activity in older adults. J. Epidemiol. Community Health 2005, 59, 558–564. [Google Scholar] [CrossRef]
  79. Ayuntamiento de Madrid. Madrid, Ciudad Amigable Con Las Personas Mayores. Plan de Acción 2021–2023. 2021. Available online: https://transparencia.madrid.es/FWProjects/transparencia/PlanesYMemorias/Planes/Mayores/Plan%20Madrid_Amigable%202021_2023.pdf (accessed on 15 June 2024).
  80. Roy, S.; Byrne, J.; Pickering, C. A systematic quantitative review of urban tree benefits, costs, and assessment methods across cities in different climatic zones. Urban For. Urban Green. 2012, 11, 351–363. [Google Scholar] [CrossRef]
  81. Turner-Skoff, J.B.; Cavender, N. The benefits of trees for livable and sustainable communities. Plants People Planet 2019, 1, 323–335. [Google Scholar] [CrossRef]
  82. Moradi, A.; Ameri, P.; Rahmni, K.; Najafi, M.; Jamshidi, E.; Fakhri, Y.; Khazaei, S.; Moeini, B.; Amjadian, M. Factors affecting the severity of pedestrian traffic crashes. Arch. Trauma Res. 2019, 8, 46–56. [Google Scholar] [CrossRef]
  83. Bailey, S.S.; Jones, S.A.; Stout, R.J.; Bailey, J.H.; Kass, S.; Morgan, B.B. Issues of Elderly Pedestrians. Transp. Res. Rec. 1992, 1375, 68–73. [Google Scholar]
  84. Rosén, E.; Stigson, H.; Sander, U. Literature review of pedestrian fatality risk as a function of car impact speed. Accid. Anal. Prev. 2011, 43, 25–33. [Google Scholar] [CrossRef] [PubMed]
  85. Hussain, Q.; Feng, H.; Grzebieta, R.; Brijs, T.; Olivier, J. The relationship between impact speed and the probability of pedestrian fatality during a vehicle-pedestrian crash: A systematic review and meta-analysis. Accid. Anal. Prev. 2019, 129, 241–249. [Google Scholar] [CrossRef]
Figure 1. Proportion of older adults per city neighborhood (2022).
Sustainability 16 08298 g001
Figure 2. Location of traffic crashes suffered by older (a) and non-older (b) pedestrians in Madrid (2017–2019, and 2021–2022).
Sustainability 16 08298 g002
Figure 3. Scheme of the data collection approach.
Sustainability 16 08298 g003
Figure 4. Map of road segments included in the study.
Sustainability 16 08298 g004
Figure 5. Infrastructure variables considered in the study of street segments.
Sustainability 16 08298 g005
Figure 6. Example of street segment with contour complexity B and pedestrians’ field of view.
Sustainability 16 08298 g006
Figure 7. Sign convention for assigning the side of the POIs in a road segment.
Sustainability 16 08298 g007
Table 1. Combinations of possible types of intersections at street edges and definition of level of complexity of the road segment contour.
Intersection 1Intersection 2
3 Legs+3 Legs or Roundabout
3 LegsAB
+3 Legs or RoundaboutBC
Table 2. Variable description.
VariableDescriptionUnit
Dependent variables
Older pedestrian traffic crashesNumber of older pedestrian crashes in 5-year period #
Non-older pedestrian traffic crashesNumber of non-older pedestrian crashes in 5-year period#
Independent variables
Exposure
LengthLength of the road segmentkm
AADTAnnual average daily traffic in the road segmentveh/day
Socioeconomics
Population densityPopulation density of the census track of the centroid of the road segmentinh/ha
Per capita incomePer capita income of the census track of the centroid of the road segment
Land use
Public POIsPublic POIs per segment length#/km
Health and education POIsHealth and education POIs per segment length#/km
Leisure POIsLeisure POIs per segment length#/km
Public PDDIPublic PDDI
Health and education PDDIHealth and education PDDI
Leisure PDDILeisure PDDI
Infrastructure
Ease of walking on the sidewalk
Sidewalk widthMean width of both sidewalksm
Sidewalk disparitySidewalk disparity index (Equation (2))
Trees If trees in sidewalk = 1, otherwise = 0
TerraceIf terraces in sidewalk = 1, otherwise = 0
Bus stopIf bus stops in sidewalk = 1, otherwise = 0
Metro entranceIf metro entrances in sidewalk = 1, otherwise = 0
StreetlightIf streetlights in sidewalk = 1, otherwise = 0
SlopeMean slope of the road segment%
Ease of crossing the street
Number of lanesTotal number of traffic lanes of the road segment#
Crosswalk densityNumber of pedestrian crosswalks per road segment length#/km
Traffic lightsIf traffic lights in segment = 1, otherwise = 0
Pedestrian fenceIf pedestrian fence in sidewalk and/or in median = 1, otherwise = 0
Ease of detecting traffic
Number of ways & medianOne-way = 0, Two-ways and no median = 1, Two-ways and median = 2
On-street parkingIf on-street parking = 1, otherwise = 0
Trash containersIf trash containers = 1, otherwise = 0
Contour complexityContour level of complexity A to C (Table 1)
Table 3. Summary statistics of the sample.
VariableMeanSDMedianMin.Max.
Older pedestrian crashes0.100.31002
Non-older pedestrian crashes0.270.58004
Length0.150.100.120.020.99
AADT11,632.7110,110.38882116072,331
Population density240.85182.09219.370.07881.77
Avg. income per person20,133.157282.3819,261580132,183
POI density leisure14.3223.884.290176.23
POI density health education1.864.150029.56
POI density public1.163.690035.23
PIID leisure0.360.44001
PIID health education0.200.40001
PIID public0.120.32001
Sidewalk width4.262.143.80.920
Sidewalk distribution0.120.150.070.000.75
Trees0.70
Terraces0.31
Bus stop0.36
Metro entrance0.04
Streetlights0.99
Slope0.020.020.020.000.14
Number of lanes3.201.823111
Traffic lights0.69
Crosswalk density10.646.4510.320.0040.7
Fence0.13
Road type
 One-way0.31
 Two-way no median0.46
 Two-way median0.23
On-street parking0.770.42101
Trash container0.420.49001
Contour complexity
 Complexity A0.22
 Complexity B0.43
 Complexity C0.35
Table 4. Correlation matrix of the independent variables of the sample.
Variable[1][2][3][4][5][6][7][8][9][10][11][12][13][14][15][16][17][18][19][20][21][22][23][24]
[1] Length-−0.01−0.290.05−0.15−0.06−0.070.010.050.03−0.07−0.04−0.140.010.18−0.04−0.09−0.070.020.08−0.27−0.120.040.13
[2] AADT−0.01-−0.040.150.080.080.020.080.120.020.320.020.180.200.230.120.02−0.100.720.40−0.180.24−0.24−0.14
[3] Population density−0.29−0.04-−0.270.260.160.120.150.120.09−0.04−0.140.100.22−0.090.090.130.03−0.110.000.140.160.110.07
[4] Avg. income per person0.050.15−0.27-0.060.03−0.030.080.060.020.10−0.050.090.110.03−0.03−0.05−0.030.110.05−0.020.00−0.08−0.21
[5] Leisure POIs−0.150.080.260.06-0.300.100.240.200.090.00−0.110.090.36−0.030.080.06−0.070.000.080.100.21−0.07−0.07
[6] Health and education POIs−0.060.080.160.030.30-0.020.100.810.02−0.04−0.120.090.170.020.040.050.000.010.070.030.160.03−0.01
[7] Public POIs−0.070.020.12−0.030.100.02-0.080.020.800.04−0.030.060.080.040.050.030.000.000.050.050.060.010.04
[8] Leisure PDDI0.010.080.150.080.240.100.08-0.120.130.08−0.100.090.230.100.070.04−0.060.050.110.010.120.030.07
[9] Health and education PDDI0.050.120.120.060.200.810.020.12-0.05−0.03−0.120.060.210.080.060.050.010.050.080.010.060.060.08
[10] Public PDDI0.030.020.090.020.090.020.800.130.05-0.06−0.040.050.130.080.010.040.000.020.070.020.060.010.08
[11] Sidewalk width−0.070.32−0.040.100.00−0.040.040.08−0.030.06-0.210.380.170.170.13−0.06−0.130.450.23−0.070.10−0.05−0.02
[12] Sidewalk disparity−0.040.02−0.14−0.05−0.11−0.12−0.03−0.10−0.12−0.040.21-−0.08−0.08−0.02−0.02−0.050.050.01−0.01−0.06−0.040.02−0.01
[13] Trees−0.140.180.100.090.090.090.060.090.060.050.38−0.08-0.190.090.070.02−0.080.260.120.000.100.020.00
[14] Terraces0.010.200.220.110.360.170.080.230.210.130.17−0.080.19-0.140.120.07−0.110.160.19−0.010.120.030.14
[15] Bus stop0.180.23−0.090.03−0.030.020.040.100.080.080.17−0.020.090.14-0.100.01−0.070.270.29−0.060.07−0.100.00
[16] Metro entrance−0.040.120.09−0.030.080.040.050.070.060.010.13−0.020.070.120.10-0.02−0.020.130.120.020.20−0.09−0.02
[17] Streetlights−0.090.020.13−0.050.060.050.030.040.050.04−0.06−0.050.020.070.010.02-0.010.040.020.100.040.120.03
[18] Slope−0.07−0.100.03−0.03−0.070.000.00−0.060.010.00−0.130.05−0.08−0.11−0.07−0.020.01-−0.14−0.090.05−0.06−0.03−0.04
[19] Number of lanes0.020.72−0.110.110.000.010.000.050.050.020.450.010.260.160.270.130.04−0.14-0.40−0.180.29−0.22−0.16
[20] Traffic lights0.080.400.000.050.080.070.050.110.080.070.23−0.010.120.190.290.120.02−0.090.40-0.030.16−0.15−0.03
[21] Crosswalk density−0.27−0.180.14−0.020.100.030.050.010.010.02−0.07−0.060.00−0.01−0.060.020.100.05−0.180.03-0.030.05−0.02
[22] Fence−0.120.240.160.000.210.160.060.120.060.060.10−0.040.100.120.070.200.04−0.060.290.160.03-−0.36−0.19
[23] On-street parking0.04−0.240.11−0.08−0.070.030.010.030.060.01−0.050.020.020.03−0.10−0.090.12−0.03−0.22−0.150.05−0.36-0.38
[24] Trash container0.13−0.140.07−0.21−0.07−0.010.040.070.080.08−0.02−0.010.000.140.00−0.020.03−0.04−0.16−0.03−0.02−0.190.38-
Table 5. Main statistics of the older adult pedestrian model (credible variables at 10% in bold).
VariableMeanSD2.5%5%95%97.5%
Intercept−5.6912.093−9.795−9.135−2.247−1.587
log(AADT)0.4700.2120.0550.1210.8180.885
Population density0.0020.0010.0010.0010.0030.003
Avg. income per person−0.0000.000−0.000−0.0000.0000.000
Leisure POIs0.0110.0040.0030.0040.0190.020
Health and education POIs0.0240.025−0.026−0.0180.0660.074
Public POIs0.0100.024−0.036−0.0290.0490.057
Leisure PDDI−0.0310.268−0.557−0.4720.4100.495
Sidewalk width−0.0520.069−0.187−0.1650.0610.083
Sidewalk disparity1.0230.835−0.614−0.3512.3962.659
Trees0.5010.295−0.0780.0160.9871.080
Terraces0.0090.267−0.514−0.4300.4470.531
Bus stop0.4840.2390.0150.0900.8770.952
Metro entrance0.3420.407−0.457−0.3281.0111.140
Streetlights−0.2121.068−2.307−1.9701.5461.882
Slope−4.3466.645−17.376−15.2816.5898.684
Number of lanes0.0020.109−0.211−0.1770.1820.216
Crosswalk density0.0620.0210.0210.0280.0960.103
Traffic lights−0.0460.340−0.713−0.6060.5150.622
Fence−0.1200.367−0.840−0.7240.4850.601
Road type: Two way no median−0.1530.318−0.777−0.6770.3700.470
Road type: Two way with median0.0630.406−0.733−0.6050.7310.859
On-street parking−0.2710.339−0.935−0.8280.2860.393
Trash container0.5350.2720.0010.0870.9831.069
Contour: complexity B−0.3170.296−0.897−0.8040.1690.263
Contour: complexity C−0.7790.327−1.421−1.318−0.241−0.138
τv104.54
DIC574.16
Effective number of parameters 29.31
Table 6. Main statistics of the rest of pedestrian model (credible variables at 10% in bold).
VariableMeanSD2.5%5%95%97.5%
Intercept−4.4831.260−6.956−6.558−2.412−2.016
log(AADT)0.5110.1280.2590.3000.7220.763
Population density0.0000.000−0.001−0.0010.0010.001
Avg. income per person−0.0000.000−0.000−0.0000.0000.000
Leisure POIs0.0110.0030.0060.0060.0150.016
Health and education POIs−0.0140.017−0.049−0.0430.0140.020
Public POIs0.0130.015−0.017−0.0120.0380.043
Leisure PDDI0.2040.162−0.114−0.0630.4710.522
Sidewalk width0.0610.038−0.013−0.0010.1240.136
Sidewalk disparity−0.2050.534−1.252−1.0830.6740.842
Trees0.0540.174−0.288−0.2330.3410.396
Terraces0.3560.1630.0360.0880.6250.677
Bus stop0.3290.1430.0490.0940.5650.610
Metro entrance0.7290.2100.3180.3841.0761.143
Streetlights−0.0140.614−1.219−1.0250.9961.190
Slope−0.9734.026−8.870−7.6005.6506.919
Number of lanes−0.0370.067−0.168−0.1460.0730.094
Crosswalk density0.0340.0140.0070.0120.0570.061
Traffic lights−0.1300.210−0.543−0.4760.2160.282
Fence0.1430.211−0.270−0.2040.4890.556
Road type: Two way no median−0.0150.187−0.381−0.3220.2930.352
Road type: Two way with median−0.6850.261−1.195−1.113−0.256−0.174
On-street parking−0.1680.191−0.542−0.4810.1460.206
Trash container0.0220.168−0.307−0.2550.2980.351
Contour: complexity B−0.1630.194−0.544−0.4830.1570.218
Contour: complexity C−0.2410.200−0.633−0.5700.0870.150
τv84.28
DIC1047.70
Effective number of parameters35.45
Disclaimer/Publisher’s Note: The statements, opinions and data contained in all publications are solely those of the individual author(s) and contributor(s) and not of MDPI and/or the editor(s). MDPI and/or the editor(s) disclaim responsibility for any injury to people or property resulting from any ideas, methods, instructions or products referred to in the content.

