

Determinants of Carbon Inventory and Systematic Innovation Methods to Analyze the Strategies of Carbon Reduction: An Empirical Study of Green Lean Management in Electroplating an Factory


Abstract
:1. Introduction
1.1. Background
1.2. Research Questions
- What is the relationship between lean management, carbon inventory, and carbon reduction, and what factors influence factory carbon inventory and reduction?
- 2.
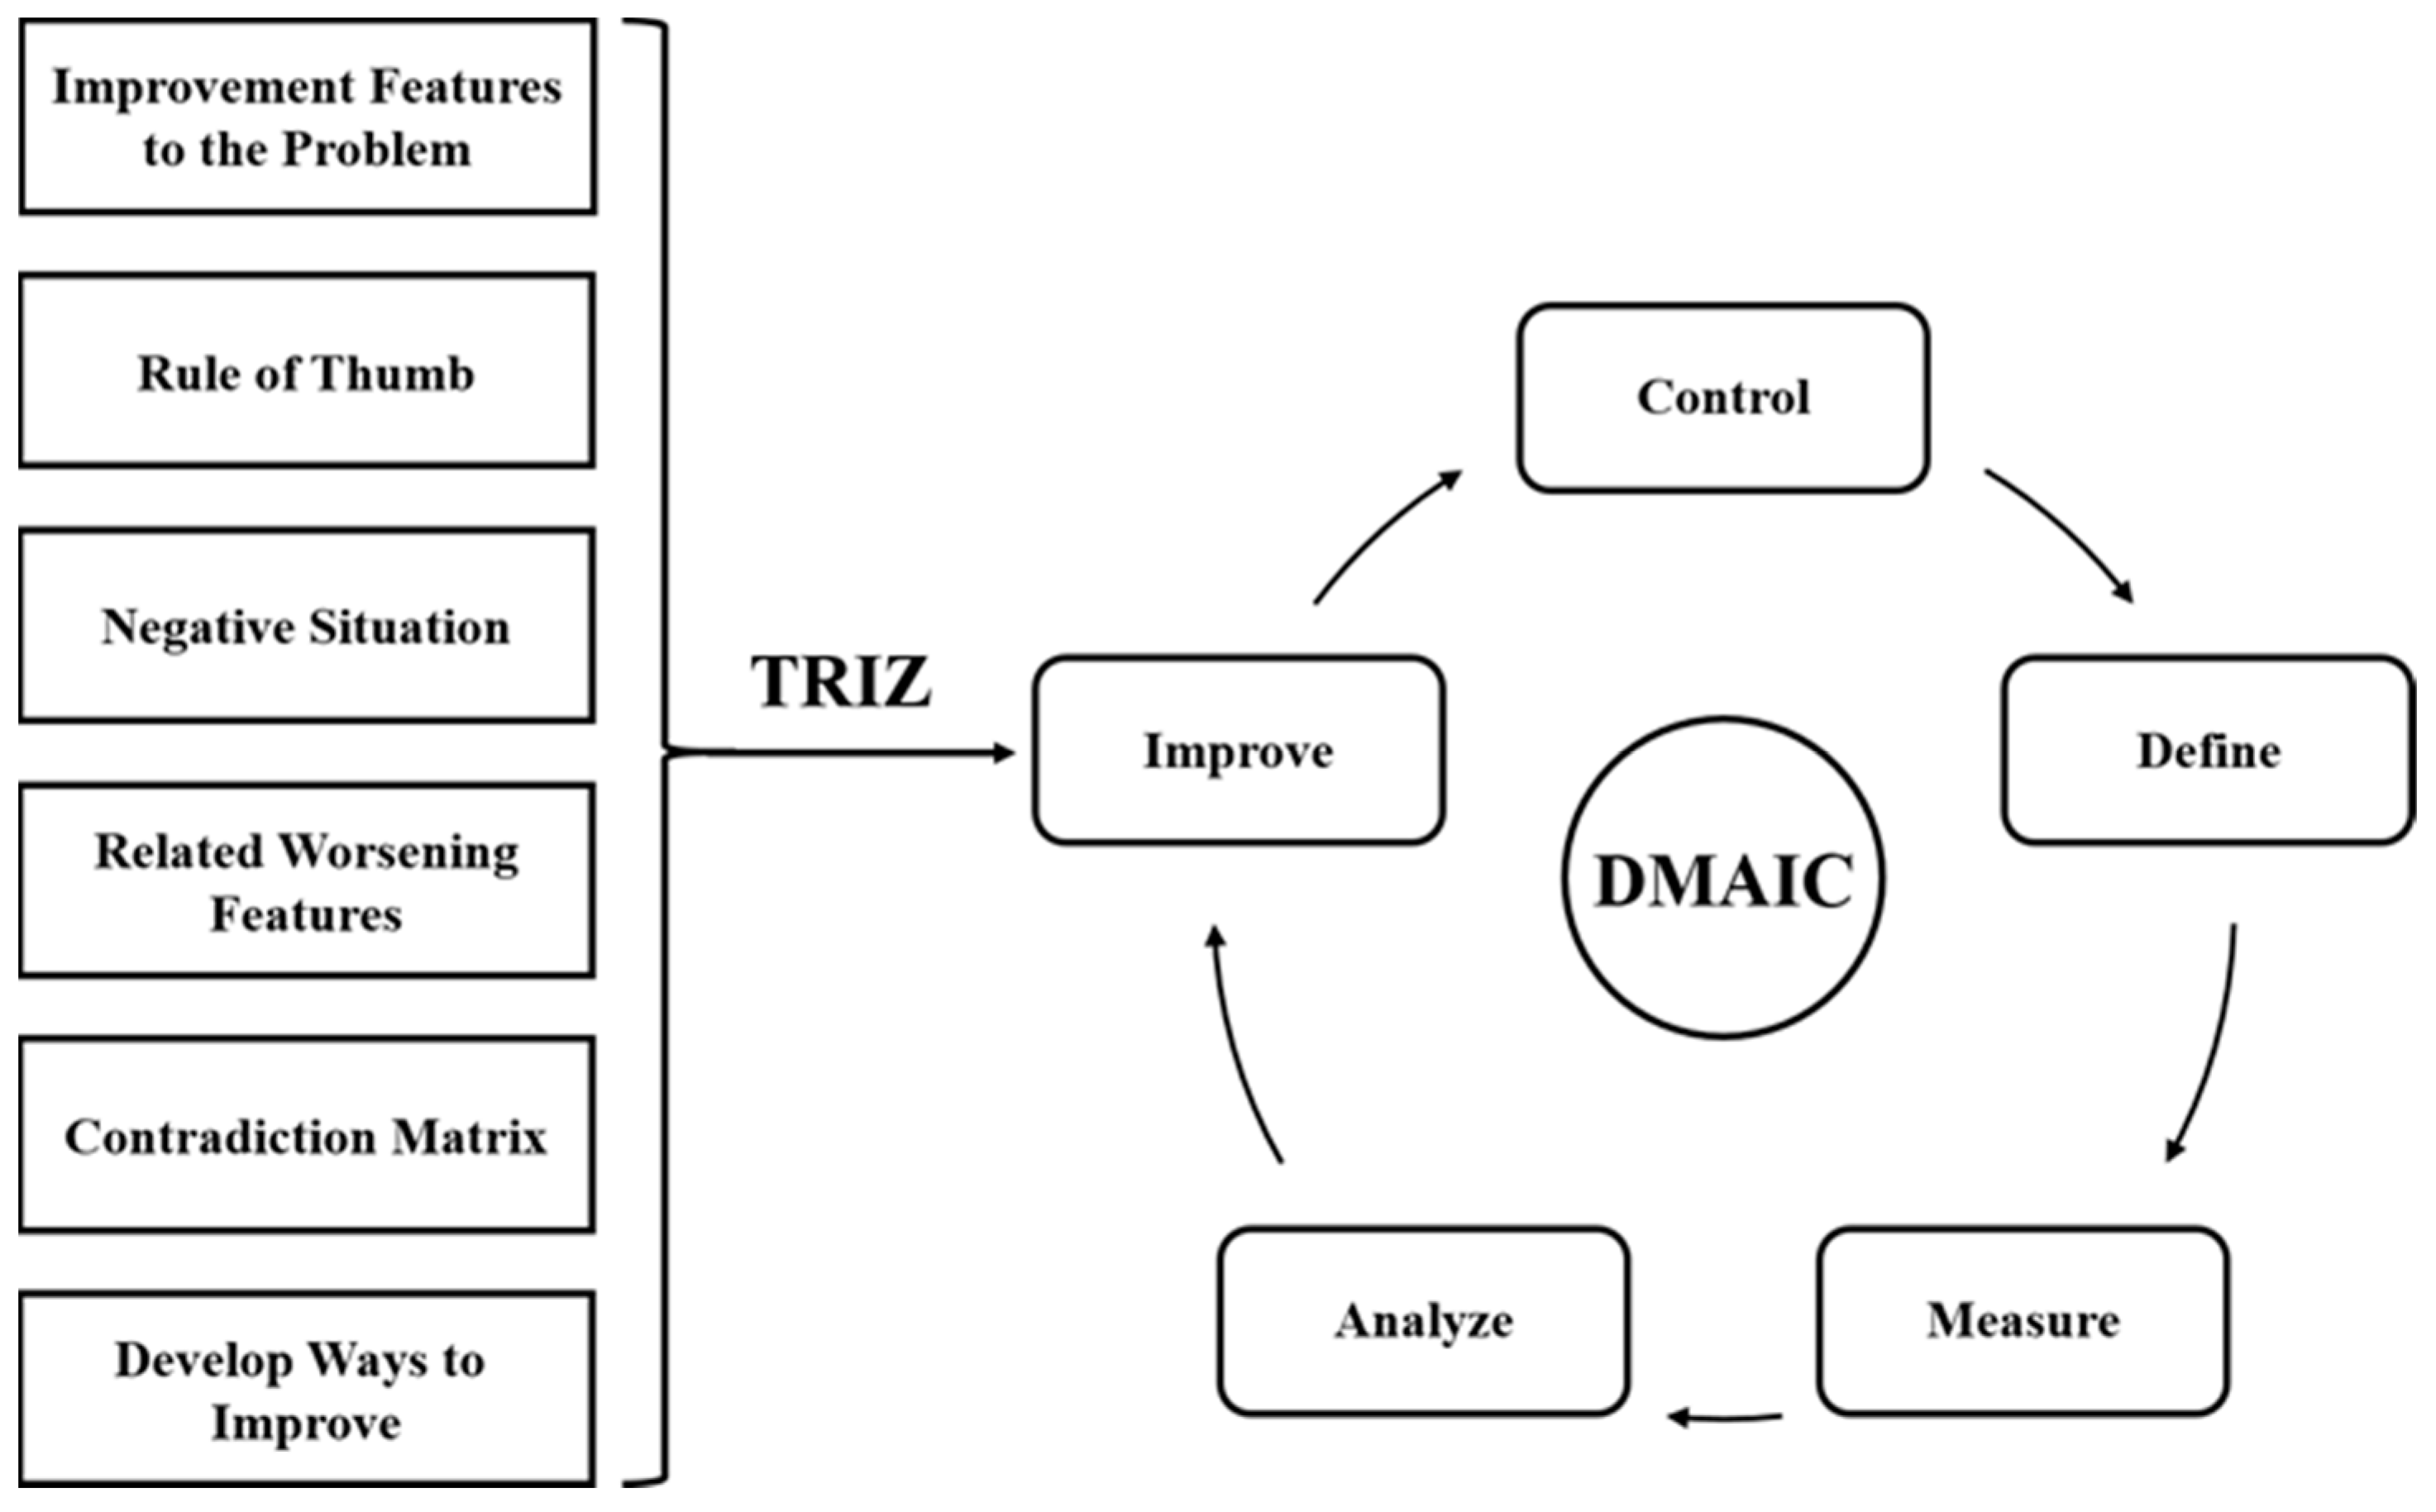
- How can we develop a carbon reduction strategy through DMAIC combined with the TRIZ method?
2. Literature Review
2.1. Carbon Inventory Methods
2.2. Lean Management
2.3. Green Production
2.4. Green Value Stream
- In the food industry, the implementation of the GVSM must be customized such that experiments with the future-state GVSM do not affect the quality of the final product.
- FGDs are very effective in generating ideas for improving and ensuring that production personnel are committed to implementing these improvements.
2.5. Relationship between Lean Management and Green Manufacturing
2.6. Standards and Scope of Carbon Inventory
2.7. Carbon-Neutral Strategy
3. Methods and Design
3.1. Study Subject
3.2. Methods
- Secondary Data
- 2.
- Expert Meeting
- 3.
- Field Study
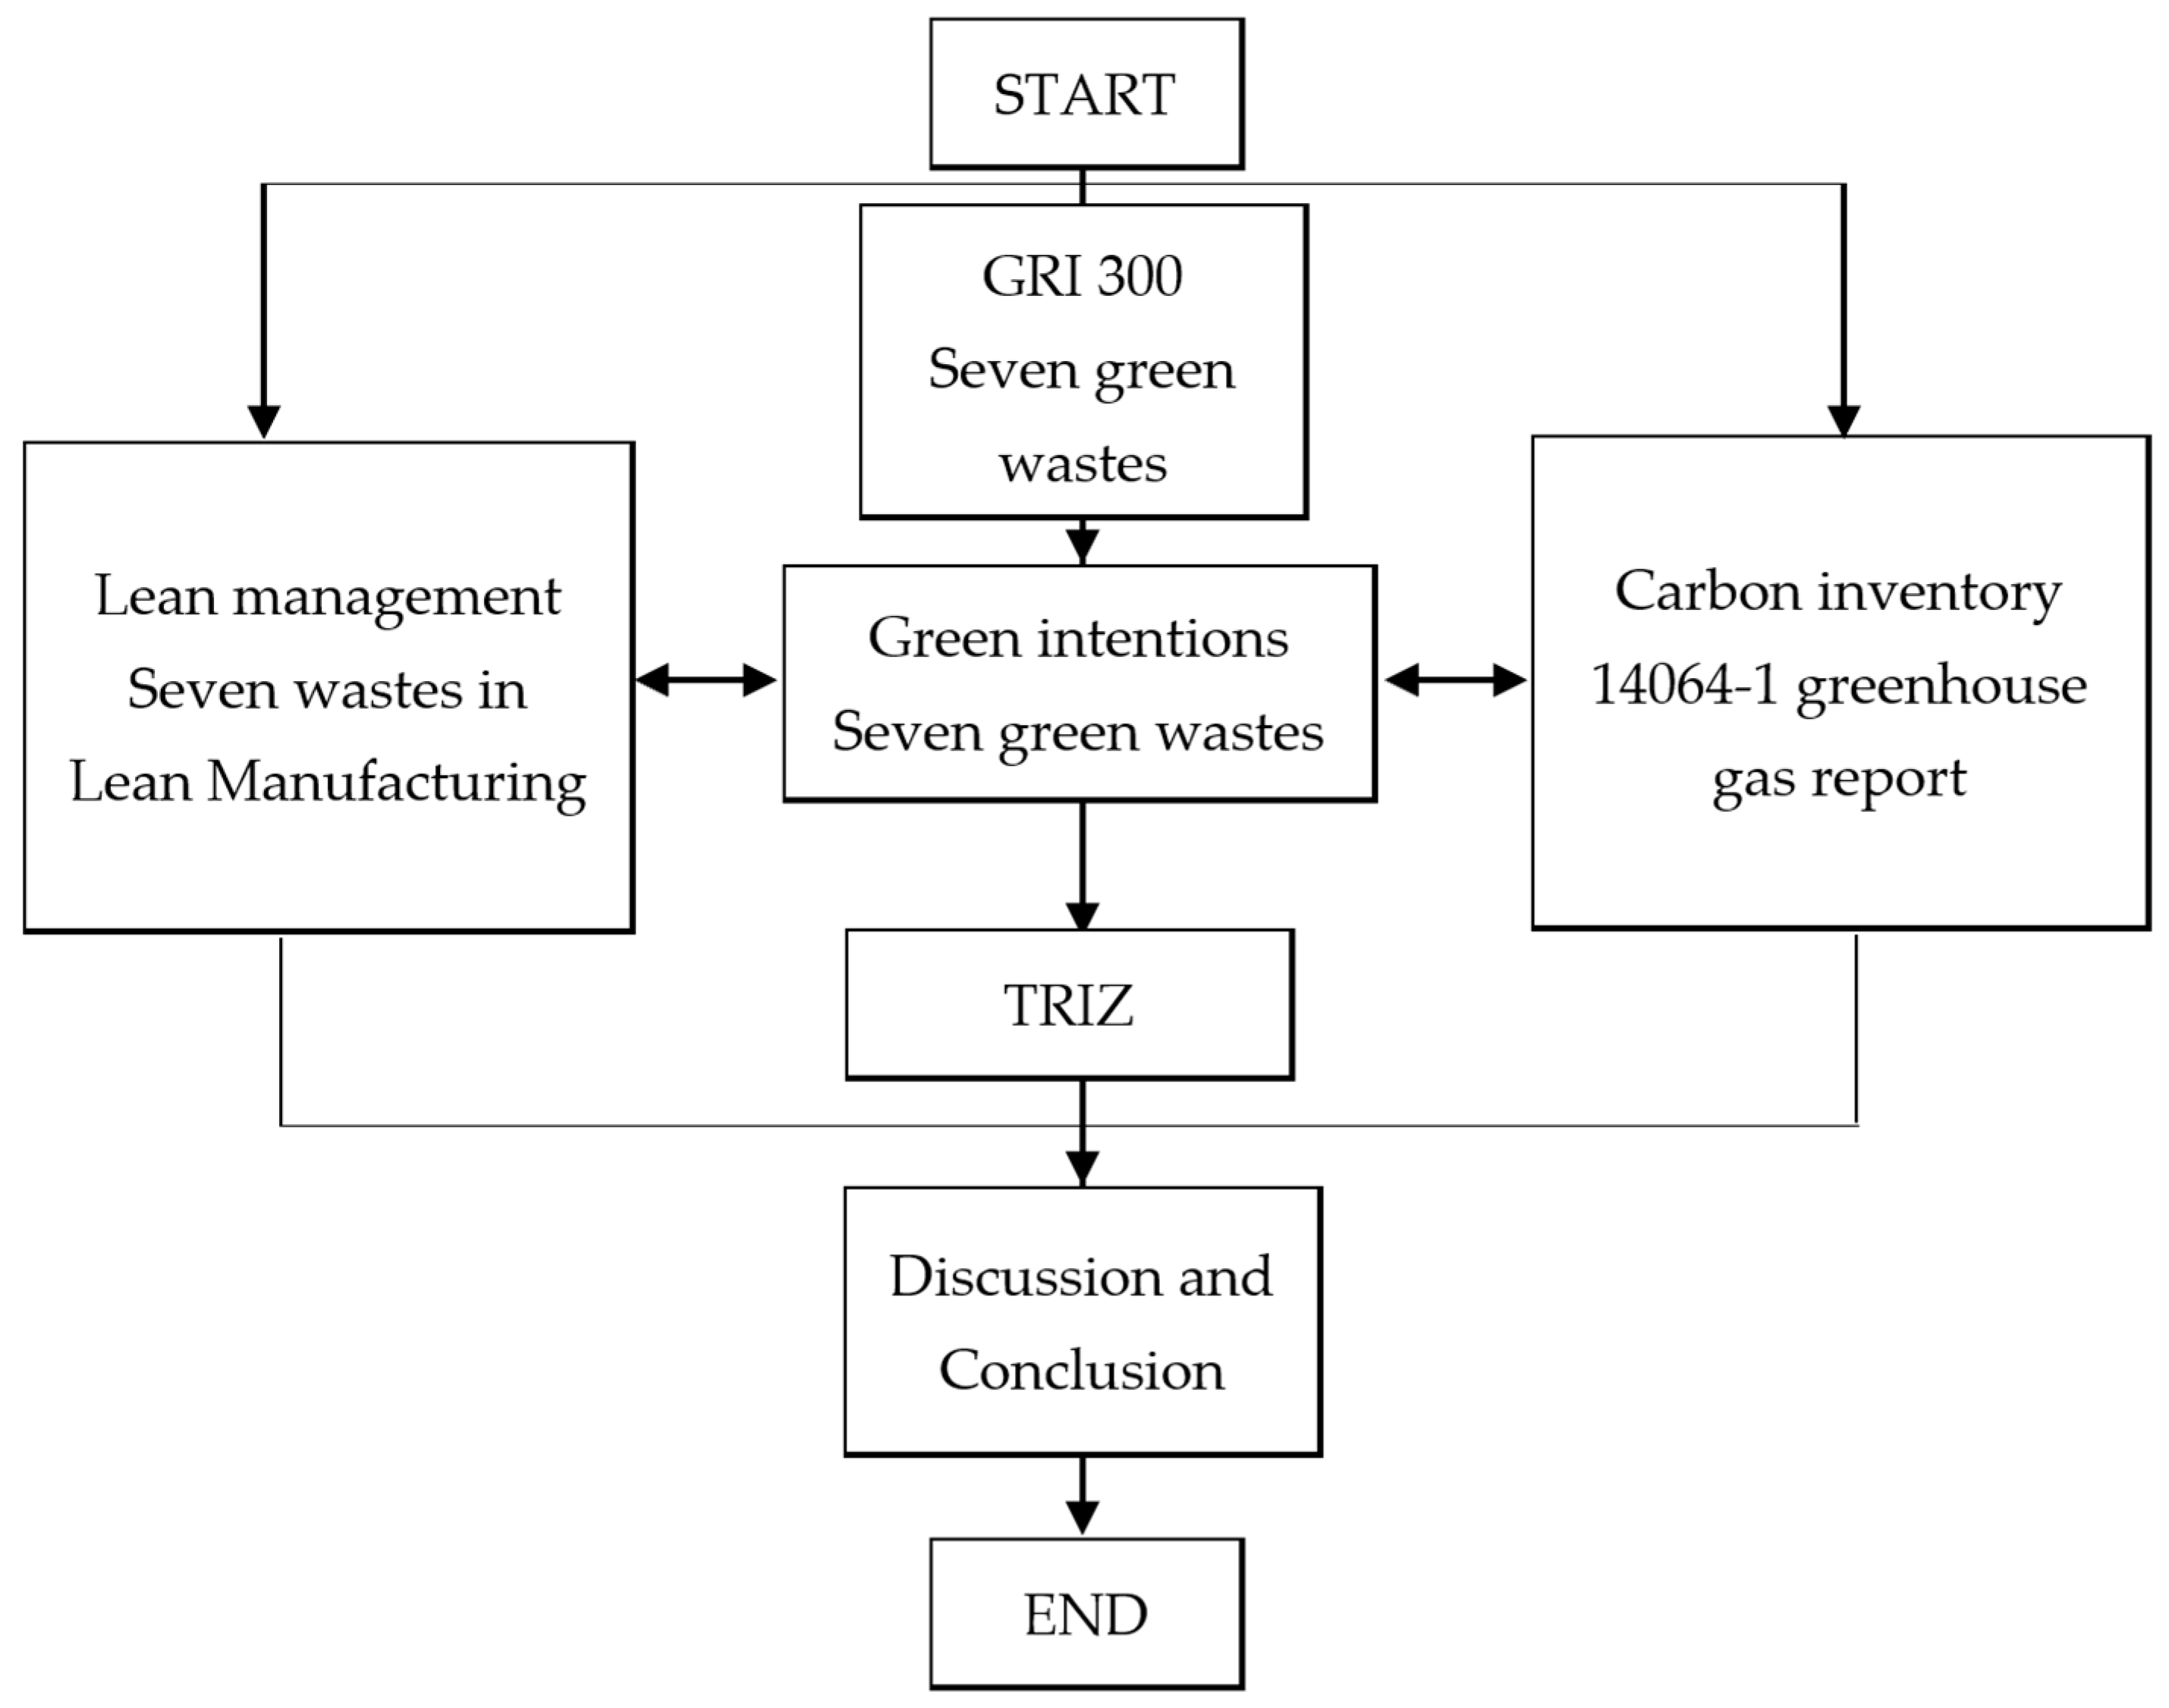
3.3. Framework
3.4. Instrument
3.5. Procedures and Data Analysis
4. Results
4.1. Carbon Inventory Results
4.1.1. Predominance of Electricity Consumption
4.1.2. Assessment of Green Wastes
4.1.3. Data Collection and Methodology
4.1.4. Emphasis on DMAIC Framework
4.2. Electroplating Factory Carbon Emission Reduction Strategy
4.3. Assessment of Greenhouse Gas Emissions
5. Discussion and Conclusions
5.1. Conclusions
5.2. Suggestions for Management Practices
5.3. Management Implications
Author Contributions
Funding
Institutional Review Board Statement
Informed Consent Statement
Data Availability Statement
Conflicts of Interest
References
- Hussain, J.; Lee, C.-C.; Chen, Y. Optimal green technology investment and emission reduction in emissions generating companies under the support of green bond and subsidy. Technol. Forecast. Soc. Chang. 2022, 183, 121952. [Google Scholar] [CrossRef]
- Shabir, I.; Dash, K.K.; Dar, A.H.; Pandey, V.K.; Fayaz, U.; Srivastava, S.; Nisha, R. Carbon footprints evaluation for sustainable food processing system development: A comprehensive review. Future Foods 2023, 7, 100215. [Google Scholar] [CrossRef]
- Ohno, T. Toyota Production System: Beyond Large-Scale Production; Productivity Press: New York, NY, USA, 1988. [Google Scholar]
- Pettersen, J. Defining lean production: Some conceptual and practical issues. Total Qual. Manag. Bus. Excell. 2009, 21, 127–142. [Google Scholar] [CrossRef]
- Roosen, T.; Pons, D. Environmentally lean production: The development and incorporation of an environmental impact index into value stream mapping. J. Ind. Eng. 2013, 2013, 298103. [Google Scholar] [CrossRef]
- Lakshmanan, R.; Nyamekye, P.; Virolainen, V.M.; Piili, H. The convergence of lean management and additive manufacturing: Case of manufacturing industries. Clean. Eng. Technol. 2023, 13, 100620. [Google Scholar] [CrossRef]
- Fiorello, M.; Gladysz, B.; Corti, D.; Wybraniak-Kujawa, M.; Ejsmont, K.; Sorlini, M. Towards a smart lean green production paradigm to improve operational performance. J. Clean. Prod. 2023, 413, 137418. [Google Scholar] [CrossRef]
- Sezen, B.; Cankaya, S.Y. Effects of green manufacturing and eco-innovation on sustainability performance. Procedia-Soc. Behav. Sci. 2013, 99, 154–163. [Google Scholar] [CrossRef]
- Rao, P.; Holt, D. Do Green supply chains lead to competitiveness and economic performance? Int. J. Oper. Prod. Manag. 2005, 25, 898–916. [Google Scholar] [CrossRef]
- Environmental Protection Agency (EPA). Lean and Environment Training Module 2—Lean and Environment Toolkit; Environmental Protection Agency: Washington, DC, USA, 2006.
- Rusinko, C.A. Green manufacturing: An evaluation of environmentally sustainable manufacturing practices and their impact on competitive outcomes. IEEE Trans. Eng. Manag. 2007, 54, 445–454. [Google Scholar] [CrossRef]
- Azeez, K.A.; Mahdi, I.A.H.A. Value Stream Mapping within Green accounting: Opportunities and challenges. Res. Mil. 2023, 13, 1401–1411. [Google Scholar]
- Budihardjo, R.; Hadipuro, W. Green Value Stream Mapping: A Tool for Increasing Green Productivity (The Case of PT. NIC). J. Manag. Bus. Environ. 2022, 4, 1–19. [Google Scholar] [CrossRef]
- Sajan, M.P.; Shalij, P.R.; Ramesh, A.; Augustine, P.B. Lean manufacturing practices in Indian manufacturing SMEs and their effect on sustainability performance. J. Manuf. Technol. Manag. 2017, 28, 772–793. [Google Scholar] [CrossRef]
- Abreu, M.F.; Alves, A.C.; Moreira, F. Lean-Green models for eco-efficient and sustainable production. Energy 2017, 137, 846–853. [Google Scholar] [CrossRef]
- Hussain, M.; Al-Aomar, R.; Melhem, H. Assessment of lean-green practices on the sustainable performance of hotel supply chains. Int. J. Contemp. Hosp. Manag. 2019, 31, 2448–2467. [Google Scholar] [CrossRef]
- Martínez León, H.C.; Calvo-Amodio, J. Towards lean for sustainability: Understanding the interrelationships between lean and sustainability from a systems thinking perspective. J. Clean. Prod. 2017, 142, 4384–4402. [Google Scholar] [CrossRef]
- Martínez-Jurado, P.J.; Moyano-Fuentes, J. Lean management, supply chain management, and sustainability: A literature review. J. Clean. Prod. 2014, 85, 134–150. [Google Scholar] [CrossRef]
- Dues, C.M.; Tan, K.H.; Lim, M. Green as the new lean: How to use Lean practices as a catalyst to greening your supply chain. J. Clean. Prod. 2013, 40, 93–100. [Google Scholar] [CrossRef]
- Yang, M.G.; Hong, P.; Modi, S. Impact of lean manufacturing and environmental management on business performance: An empirical study of manufacturing firms. Int. J. Prod. Econ. Econ. 2011, 129, 210–220. [Google Scholar] [CrossRef]
- Wills, B. Green Intentions: Creating a Green Value Stream to Compete and Win, 1st ed.; Productivity Press: New York, NY, USA, 2009. [Google Scholar]
- ISO 14001:2015; Environmental Management Systems—Requirements with Guidance for Use. International Organization for Standardization: Geneva, Switzerland, 2015.
- Sheng, Y.Y.; Yang, F.; Xi, T.F.; Lai, C.; Ye, H.Q. Influence of heat treatment on interface of Cu/Al bimetal composite fabricated by cold rolling. Compos. Part B 2011, 42, 1468–1473. [Google Scholar] [CrossRef]
- Shen, F.H.; Wang, L.H.; Chen, Y.U.; Lu, Y.J. Organizational carbon inventory and product carbon footprint—Help to achieve corporate carbon management goals. Sustain. Ind. Dev. 2022, 92, 58–65. [Google Scholar]
- Li, W.B. Net-zero emissions and carbon-neutral development trends. Circuit Board Q. 2021, 91, 122–125. [Google Scholar]
- PAS 2060:2014; Specification for the Demonstration of Carbon Neutrality. British Standards Institution (BSI): London, UK, 1929.
- Xu, S.L.; Lin, J.H.; Wang, P.R. Discussion on the path to constructing an enterprise’s low-carbon business strategy—From greenhouse gas inventory and product carbon footprint to low-carbon production/carbon neutrality. Sustain. Ind. Dev. 2020, 49, 55–62. [Google Scholar] [CrossRef]
- Hicks, C. A functional model of supply chains and waste. Int. J. Prod. Econ. 2004, 89, 165–174. [Google Scholar] [CrossRef]
- Fercoq, A.; Lamouri, S.; Carbone, V. Lean/Green integration focused on waste reduction techniques. J. Clean. Prod. 2016, 137, 567–578. [Google Scholar] [CrossRef]
- Vaidya, S.; Bhosle, S.; Ambad, P. DMAIC Approach to Improve Carbon Weighing Compliance of Banbury Machine. In Computing in Engineering and Technology, Proceedings of ICCET 2019, Aurangabad, India, 10–11 January 2019; Springer: Singapore, 2020; pp. 803–816. [Google Scholar] [CrossRef]
- Ishak, M.S.; Jusoh, M.S.; Rosli, A.G.M.; Yusuf, D.H.M.; Ismail, M.S. Defining-Measuring-Analyzing-Improving-Controlling (DMAIC): Process and Improve Stability in Carbon Steel Industry. J. Phys. Conf. Ser. 2021, 2129, 012029. [Google Scholar] [CrossRef]
- Altshuller, G. 40 Principles: TRIZ Keys to Technical Innovation; Technical Innovation Center: Newark, DE, USA, 2020. [Google Scholar]
- Spreafico, C. Quantifying the advantages of TRIZ in sustainability through life cycle assessment. J. Clean. Prod. 2021, 303, 126955. [Google Scholar] [CrossRef]

| Seven Types of Wastes | Definition |
|---|---|
| Defects | Errors or faults that require rework or correction. |
| Inventory | Excess or unnecessary stock of materials or products. |
| Overprocessing | Performing more work or using more resources than required. |
| Waiting | Delays in the production process, where no value is added. |
| Unnecessary Motion | Unproductive movements of people or equipment. |
| Transportation | Excessive or inefficient movement of materials or products. |
| Overproduction | Producing more than what is needed or demanded. |
| Seven Types of Green Waste | Definition |
|---|---|
| Energy | Inefficient use or excessive consumption of energy resources |
| Water | Excessive or unnecessary use of water resources |
| Materials | Wasteful use of raw materials or resources in the production process |
| Garbage | The generation of unnecessary waste or harmful pollutants |
| Transportation | Unnecessary carbon emissions from transportation activities |
| Emissions | Overuse of packaging materials that contribute to environmental waste |
| Biodiversity Impact | Harmful effects on ecosystems and biodiversity due to production processes or practices |
| Seven Types of Green Waste | Reduce | Reduce | Recycle |
|---|---|---|---|
| Energy | V | ||
| Water | V | V | V |
| Materials | V | V | V |
| Garbage | V | V | V |
| Transportation | V | ||
| Emissions | V | ||
| Biodiversity Impact | V |
| Name | Quantity | Type |
|---|---|---|
| Project plans | 2 | Qualitative and Quantitative |
| Lean diagnostic reports | 12 | Qualitative and Quantitative |
| Carbon inventory records | 12 | Qualitative and Quantitative |
| Expert meetings | 3 | Qualitative and Quantitative |
| 14064-1 greenhouse gas report | 1 | Qualitative and Quantitative |
| Inventory EXCEL | 1 | Quantitative |
| No. | Feature | Application |
|---|---|---|
| 22 | Loss of Energy |
|
| 23 | Loss of Substance | Air compressors lead to high electricity bills, resulting in a negative situation and increased costs. |
| 31 | Object-Generated Harmful Substances | CO and HC concentrations produced by trucks are considered harmful factors generated by the object. |
| No. | Inventive Principle | Application |
|---|---|---|
| 2 | Taking Out | By taking out the provision of disposable tableware and two vegetarian days per month, the company can reduce 50.7 kg of carbon emissions annually. |
| 21 | Skipping | To introduce AI to replace manual work for fast identification of defective products, thereby controlling control, improving product quality, and reducing resource waste. |
| 22 | Blessing in Disguise | The emission problem of the 6.5-ton truck can be regarded as a blessing in disguise, prompting the introduction of environmentally friendly trucks. |
| 27 | Cheap Short-Living Objects | Reduce the cost of energy by replacing the air conditioning and refrigeration equipment with R32 refrigerant models’ equipment. |
| 35 | Parameter Changes | Installation of individual meters for each machine of the company, utilizing the power consumption of each machine as an independent parameter to adjust the improvement in power wastage. |
| Item | Current State | Recommended Improvement | Projected Effect |
|---|---|---|---|
| Air Compressors | Fixed-frequency compressors account for 14.2% of total power use | Switch to variable-frequency compressors | 25% reduction in energy consumption, 2–3% overall factory savings |
| Trucks | 6.5-ton truck meets 2004 phase 4 standards but not the current standards | Upgrade to trucks meeting phase 6 environmental standards | CO concentration reduced from 3% to 2%, HC concentration halved from 2000 ppm to 1000 ppm |
| Category | Subcategory | Facility | Project (Emission Source) | CO2 | CH4 | N2O | HFCs | PFCs, SF6, NF3 | NF3 Emission Equivalent (Metric Tons CO2/Year | Emissions Share |
|---|---|---|---|---|---|---|---|---|---|---|
| Direct emission source | Stationary combustion source | Dynamo | Diesel fuel | 0.0417 | 0.0000 | 0.0001 | 0.0000 | 0.0000 | 0.0418 | 0.0024% |
| Mobile combustion source | Official car | Gasoline | 9.7709 | 0.0983 | 0.3079 | 0.0000 | 0.0000 | 10.1772 | 0.5860% | |
| Diesel fuel | 35.6621 | 0.0524 | 0.5124 | 0.0000 | 0.0000 | 36.2269 | 2.0861% | |||
| Production process | Electroplating production line | Nitric acid | 0.0000 | 0.0000 | 0.0197 | 0.0000 | 0.0000 | 0.0197 | 0.0011% | |
| Laboratory | Acetylene | 0.1362 | 0.0000 | 0.0000 | 0.0000 | 0.0000 | 0.1362 | 0.007% | ||
| Fugitive emission | Environmentally friendly Hailong fire extinguisher | HFC-227EA | 0.1440 | 0.0000 | 0.0000 | 0.0000 | 0.0000 | 0.1440 | 0.0083% | |
| Ice water host | R-134A | 0.0000 | 0.0000 | 0.0000 | 14.8716 | 0.0000 | 14.8716 | 0.8564% | ||
| Air conditioners for residential and combustion buildings | R-410A | 0.0000 | 0.0000 | 0.0000 | 1.5086 | 0.0000 | 1.5086 | 0.0869% | ||
| Mobile air purifier | HFC-134A | 0.0000 | 0.0000 | 0.0000 | 0.7436 | 0.0000 | 0.7436 | 0.0428% | ||
| R-134A | 0.0000 | 0.0000 | 0.0000 | 1.3036 | 0.0000 | 1.3036 | 0.0751% | |||
| Household freezing and refrigeration equipment | HFC-134A | 0.0000 | 0.0000 | 0.0000 | 0.0012 | 0.0000 | 0.0012 | 0.0001% | ||
| R-124A | 0.0000 | 0.0000 | 0.0000 | 0.0009 | 0.0000 | 0.0009 | 0.0001% | |||
| R-407C | 0.0000 | 0.0000 | 0.0000 | 0.0276 | 0.0000 | 0.0276 | 0.0015% | |||
| R-134A | 0.0000 | 0.0000 | 0.0000 | 0.0069 | 0.0000 | 0.0069 | 0.0004% | |||
| R-134A (water dispenser) | 0.0000 | 0.0000 | 0.0000 | 0.06532 | 0.0000 | 0.06532 | 0.0376% | |||
| Example 1 Emissions Subtotal | 45.7550 | 0.1508 | 0.8401 | 19.1163 | 0.0000 | 65.8621 | 3.7926% | |||
| Energy indirect emission sources | Purchased electricity | Electricity usage | Purchased electricity | 1670.7542 | 0.0000 | 0.0000 | 0.0000 | 0.0000 | 1670.7542 | 96.2074% |
| Example 2 Emissions Subtotal | 1670.7542 | 0.0000 | 0.0000 | 0.0000 | 0.0000 | 1670.754 | 96.2074% | |||
| Category 1 and 2 emissions total | 1736.6163 | 100.0000% | ||||||||
Disclaimer/Publisher’s Note: The statements, opinions and data contained in all publications are solely those of the individual author(s) and contributor(s) and not of MDPI and/or the editor(s). MDPI and/or the editor(s) disclaim responsibility for any injury to people or property resulting from any ideas, methods, instructions or products referred to in the content. |
© 2024 by the authors. Licensee MDPI, Basel, Switzerland. This article is an open access article distributed under the terms and conditions of the Creative Commons Attribution (CC BY) license (https://creativecommons.org/licenses/by/4.0/).
Share and Cite
Chen, W.-H.; Yang, Y.-M.; Chen, H.-N. Determinants of Carbon Inventory and Systematic Innovation Methods to Analyze the Strategies of Carbon Reduction: An Empirical Study of Green Lean Management in Electroplating an Factory. Sustainability 2024, 16, 8301. https://doi.org/10.3390/su16198301
Chen W-H, Yang Y-M, Chen H-N. Determinants of Carbon Inventory and Systematic Innovation Methods to Analyze the Strategies of Carbon Reduction: An Empirical Study of Green Lean Management in Electroplating an Factory. Sustainability. 2024; 16(19):8301. https://doi.org/10.3390/su16198301
Chicago/Turabian StyleChen, Wei-Hung, Yen-Ming Yang, and Hsin-Na Chen. 2024. "Determinants of Carbon Inventory and Systematic Innovation Methods to Analyze the Strategies of Carbon Reduction: An Empirical Study of Green Lean Management in Electroplating an Factory" Sustainability 16, no. 19: 8301. https://doi.org/10.3390/su16198301