Abstract
Corporate green technology innovation is an important driver to promote the green transformation of the manufacturing industry 4.0 and an important engine to achieve China’s carbon peak, carbon neutrality, and high-quality economic development. Based on the theory of informal environmental regulation of social systems, this study empirically analyzes the impact of ESG rating events on corporate green technology innovation by constructing a multi-period DID model using panel data of Chinese listed companies from 2010 to 2022 as the research sample. The findings suggest that ESG rating events and ESG scores can stimulate corporate green technology innovation. ESG rating uncertainty can inhibit corporate green technology innovation. The mediation effect analysis shows that ESG rating events can stimulate firms’ green technology innovation by reducing financing constraints, increasing the degree of corporate internal control, and increasing R&D investment. In addition, heterogeneity analyses indicate that ESG rating events have a better stimulating effect on the quantity of innovation of non-state-owned enterprises than state-owned enterprises, while the stimulating effect on the quality of innovation of non-state-owned enterprises is inferior to that of state-owned enterprises. Moreover, the innovation stimulation effect of ESG rating events shows a trend of east-high and west-low in geographical distribution. Therefore, the government should accelerate the construction of the ESG rating system, promote the degree of convergence with international standards, and improve the level of enterprises’ utilization of digital technology while paying attention to informal environmental regulation.
1. Introduction
During the last four decades of China’s reform and opening up, China has made significant achievements in the areas of globalization and industrialization. Simultaneously, the economic activities of human society have exerted substantial effects on the environment [1], such as air pollution [2], water pollution [3], urban smog pollution [4], and solid waste pollution [5]. Under the increasingly severe pressure of environmental governance, enterprises should be responsible for environmental governance [6]. Among the many green practice activities carried out by enterprises, Green Technology Innovation (GTI) has become an essential measure and the core means of environmental governance [7]. GTI can reduce energy consumption in production, consumption, and transport and eliminate environmental pollution, which not only plays a crucial role in promoting social development but can also reverse the promotion of economic development [8,9]. Nevertheless, the advancement of GTI by businesses necessitates increased investment in research and development and entails a longer period for recouping the initial investment. As a result, certain businesses choose to incur fines from regulatory authorities rather than investing in green technological innovation [10]. Hence, whether environmental regulation can promote enterprises’ green technological innovation has become an important theoretical and practical issue.
However, as the world’s largest developing country, China still faces a significant gap in environmental regulation compared to developed nations. A systematic and effective environmental regulatory framework has yet to be established [11]. Environmental regulations can be categorized into two types based on regulatory subjects and methods: formal environmental regulations promulgated by the government and informal environmental regulations that rely on public and social group participation [1]. Currently, China’s primary environmental regulatory approach is the government-led, “top-down” formal environmental regulation [12]. While this regulatory method has produced limited effects, it is also accompanied by numerous limitations. Due to the central–local relationship in China, local governments tend to prioritize local interests and competition among governments at the same level when implementing central decisions, resulting in a “prisoner’s dilemma” of environmental competition [13]. Moreover, local governments, as the primary subjects of formal environmental regulation, face higher costs for environmental monitoring and governance [14]. In some cases, to reduce implementation costs, they collaborate with local enterprises, leading to regulatory capture [15].
The emergence of informal environmental regulation as a means of environmental governance has become a new topic of interest. To ensure the effective implementation of green technology innovation in enterprises, informal environmental regulation, acting as the government’s “invisible hand”, has played an increasingly important role, becoming a powerful complement to formal environmental regulation [16]. The objectives of informal environmental regulation align with those of formal environmental regulation, namely, achieving quality and efficiency in environmental governance [1]. In terms of regulatory subjects, informal environmental regulation is implemented by the public and civil society organizations [17]. Regarding regulatory mechanisms, informal environmental regulation primarily achieves societal co-regulation through the dissemination of environmental information by social organizations, such as negotiation, media exposure, and advocacy [17,18]. Furthermore, compared to formal environmental regulation, the unique characteristics of informal environmental regulation are also reflected in its implementation methods, costs, and effectiveness, as shown in Table 1. Consequently, informal environmental regulation has become a crucial force in a country’s pursuit of ecological collaborative governance, potentially even more significant than formal environmental regulation [19].

Table 1.
Comparison of the characteristics of formal and informal environmental regulation.
China’s heightened environmental regulation has stimulated business eco-friendly innovation, propelled by the concepts of Environmental, Social, and Governance (ESG). The state has made efforts to enhance the ESG disclosure system for listed companies, urging them to provide information regarding their environmental and social responsibilities. ESG ratings play a crucial role for companies seeking to implement environmentally friendly technological advancements and achieve sustainable, low-carbon growth. While green technology primarily aligns with the environmental dimension of ESG, the integration of all three ESG dimensions is vital for fostering comprehensive and responsible innovation. ESG ratings not only facilitate the connection between firms and society by enhancing the external information environment of enterprises, but they also enable society to effectively supervise corporate environmental and social responsibility practices.
According to resource dependency theory, firms with higher ESG ratings are more likely to secure resources or obtain informational support from stakeholders, thereby enhancing their capacity for innovation and sustainable development [20]. From a social impact perspective, ESG ratings assist corporations in improving their social and environmental performance, as posited by social capital theory, which suggests that strong ESG performance enhances a company’s social capital, leading to a more favorable societal reputation [21,22]. Although the primary focus of green technology is on the environmental dimension, the social and governance dimensions are equally critical for the successful implementation of these technologies. The social dimension addresses the impact of green technology on communities and labor practices, ensuring that technological innovation is both environmentally sound and socially inclusive [23]. The governance dimension ensures that companies maintain transparency and accountability in their green technology initiatives, preventing the risk of greenwashing [24].
Most current studies primarily examine the effects and processes of official environmental restrictions imposed by the government on the development of green technology in businesses. There has been a lack of extensive study on the impact and processes of informal environmental rules, such as ESG ratings and other kinds of social public engagement, on the development of environmentally friendly technology innovations by businesses. This article analyzes the impact and process of ESG ratings on the Green Technological Innovation (GTI) of firms, focusing on the informal control of the environment.
The potential incremental contributions of this work are as follows: (1) The proposal suggests that by incorporating ESG rating events and corporate GTI into a unified analytical framework, ESG ratings enhance the external information environment of companies and establish market-based governance mechanisms that align with incentives for corporate GTI. This work enhances the current body of knowledge on ESG research. (2) This research builds upon the examination of the variables that influence corporate Green Technology Innovation (GTI), with a specific emphasis on informal environmental regulation. The existing corpus of study mostly investigates the impact of formal environmental restrictions on the development of eco-friendly technologies by enterprises. Nevertheless, this research proposes and verifies that events associated with ESG ratings might enhance both the quantity and quality of corporate GTI. This research seeks to clarify the mechanism via which informal environmental restrictions impact the advancement of Green Technology Innovation (GTI) inside enterprises. (3) This research employs SynTao’s first released ESG rating data for publicly listed companies and implements a multi-period double-difference model to investigate the impact of ESG ratings on the progress of environmentally friendly technology inside enterprises. Unlike other studies that directly use ESG rating data for regression, the approach used in this research is more successful in addressing the problem of endogeneity.
2. Literature Review
2.1. Research on the ESG Rating
Environmental, Social, and Governance (ESG) ratings have emerged as a significant tool for assessing corporate sustainability practices. While extensive research has been conducted on ESG ratings, a critical examination of the literature reveals several inconsistencies and gaps that warrant further investigation.
The impact of ESG ratings on corporate value has been a primary focus of research, encompassing both economic and non-economic implications. However, the literature presents conflicting findings, highlighting the complex nature of ESG’s influence on business performance. While approximately 90% of studies report a positive correlation between ESG ratings and corporate success [25], particularly in terms of stock returns [26], this near-consensus raises questions about potential publication bias or methodological limitations in existing research. Moreover, the contrasting finding that ESG ratings can negatively impact a firm’s performance when sustainability reporting is inadequately managed [27] suggests a more nuanced relationship that deserves further exploration.
In the realm of risk mitigation, the literature generally supports the positive role of ESG ratings. Studies indicate that ESG ratings can achieve corporate risk reduction by reducing monitoring pressure [28], building reputational capital [29], and mitigating agency problems between firms and significant shareholders [30]. However, the mechanisms through which ESG ratings influence different types of risks (e.g., market risk, financial risk) remain underexplored. Furthermore, the long-term sustainability of these risk reduction effects and their applicability across different industries and market conditions have not been thoroughly investigated.
The impact of ESG ratings on investment decisions presents another area of divergence in the literature. While some studies suggest that both professional and retail investors consider ESG ratings comprehensively [31], the extent to which these considerations translate into actual investment behaviors and long-term portfolio performance is less clear. This gap in understanding the practical implications of ESG ratings in investment strategies represents a significant area for future research.
From a non-economic perspective, the literature has focused on the positive effects of ESG ratings on report credibility and readability [32], as well as their potential to reduce carbon emissions [33] and information asymmetry [34,35]. However, these studies often treat ESG ratings as a homogeneous concept, failing to account for the variability in rating methodologies and the potential discrepancies between different ESG rating providers. This oversimplification may lead to overgeneralized conclusions about the effectiveness of ESG ratings in promoting sustainable practices.
2.2. Research on the Corporate GTI
Recent academic literature has extensively explored Green Technology Innovation (GTI) in enterprises, encompassing various aspects such as government regulations, internal corporate factors, external policy support, and stakeholder influences. Studies have identified a strong correlation between government environmental legislation and corporate GTI, exhibiting a “U-shaped” pattern, with China purportedly at a critical juncture preceding a restrictive phase [36]. The impact of environmental constraints on GTI expansion varies depending on implementation periods, local economic conditions, and specific legal frameworks. Research suggests that environmental regulations may impede GTI adoption in economically underdeveloped regions, while potentially fostering environmental progress in more developed areas [37]. Notably, the effect of legal regulations on corporate GTI is dynamic, with different types of regulations potentially yielding contrasting outcomes [38]. Furthermore, the decentralization of environmental monitoring [39] and the establishment of economic growth targets [40] may inhibit firms’ green technological innovation. From an internal perspective, the deployment of industrial robots [41] and enhanced green management skills among executives [42] have been associated with the promotion of corporate GTI.
External policy support and stakeholder influence have also been identified as crucial factors in GTI development. Studies emphasize the importance of specialized green policy support, such as bank-led financial structures [43], green education investments, and green technology investments [44] in facilitating corporate GTI. Additionally, the influence of stakeholders, including internal decision-makers, external media, and the public, has been recognized as a potential driver of green technology innovation, particularly through mechanisms such as environmental information disclosure [45]. However, despite these valuable insights, the existing body of research exhibits several limitations. Many studies struggle to establish causal relationships, often demonstrating correlations rather than causality. Contradictory findings, particularly regarding the impact of environmental regulations in regions with varying levels of economic development, highlight the need for further investigation. Some research may oversimplify complex issues, such as stakeholder dynamics and policy impacts. Moreover, there is a tendency to focus predominantly on the positive effects of GTI, with insufficient exploration of potential negative consequences, such as changes in employment structures and short-term cost increases.
3. Theoretical Analysis and Research Hypothesis
3.1. ESG Ratings and GTI
The ESG (Environmental, Social, and Governance) concept emphasizes the synergy among environmental, social, and governance factors, aligning with the global trend towards green development. A well-defined ESG strategic framework can provide clear direction for emerging enterprises, enhancing their ability to integrate resources, improve competitiveness, and achieve technological breakthroughs. Consequently, this study posits that ESG ratings can facilitate corporate green technology innovation.
From the perspective of external regulation, Suchman proposed legitimacy theory, which is grounded in stakeholder theory [46]. Legitimacy theory posits that social systems comprise multiple levels of subject structures, and legitimacy is characterized by the congruence between social values and the normative expectations within the social system [47]. When an organization’s compliance deviates from social norms, public perception of its sustainability performance declines, potentially jeopardizing the organization’s long-term viability [48]. Consequently, the proactive disclosure of stakeholder-expected information serves as a critical mechanism for enterprises to secure social legitimacy. In the context of ESG ratings participation, stakeholders, predicated on the enterprise’s adherence to social legitimacy, are more inclined to allocate resources, thereby facilitating green technology innovation within the enterprise.
Conversely, from the standpoint of internal capacity enhancement, social identity theory, as propounded by Tajfel and Turner [49], elucidates the process by which individuals define their self-concept and engage in social interactions through group membership. The theory posits that individuals tend to categorize themselves and others into distinct social groups, deriving aspects of their self-concept from these group affiliations [50]. The application of this theoretical framework provides insights into the catalytic effect of ESG ratings on corporate green technology innovation. ESG ratings establish a social classification system, positioning high-rated enterprises within the “in-group” of sustainable development [51]. This categorization influences organizational identity, compelling enterprises to internalize the role of “green innovator” as a core component of their identity [52]. Through inter-organizational comparison of ESG performance, enterprises are incentivized to intensify their innovative efforts to maintain or enhance their comparative advantage [53]. This intensification may manifest in both the quantity and quality of green technology innovations. Enterprises may increase the number of green projects and patent applications to solidify their position within the sustainable development in-group. Simultaneously, to distinguish themselves further and reinforce their ‘green innovator’ identity, they may also strive to enhance the quality and impact of their innovations, potentially leading to more groundbreaking and influential green technologies. The identification with high ESG performance cohorts impacts resource allocation strategies, often resulting in increased investment in green technology innovation [54]. Furthermore, self-enhancement motivations and innovation-supportive organizational cultures serve as additional drivers for sustained innovation [55,56]. This social identity-based theoretical perspective underscores the significance of organizational identity and group dynamics in propelling sustainable innovation, offering a novel analytical framework for comprehending the impact of ESG ratings on corporate behavior [57]. In summary, this paper proposes:
H1.
ESG ratings can significantly promote corporate GTI.
3.2. ESG Ratings, Financing Constraints, and GTI
Innovation theory posits that sustained financial investment is crucial for technological innovation. However, compared to conventional investments, innovation investments are characterized by higher risks, longer reporting periods, and higher sunk costs, necessitating superior quality and continuity of capital investment. The challenge lies in the information asymmetry between managers and investors, which can impede sustained investment in green technological innovation [58]. ESG ratings emerge as a potential solution to this issue. By mitigating information asymmetry, ESG ratings can alleviate financing constraints, potentially influencing both the quantity and quality of green technology innovations. Enhanced capital access may enable firms to initiate more green projects, while also supporting more resource-intensive, high-quality innovations that could lead to significant technological breakthroughs.
Third-party ESG rating agencies play a vital role by disclosing corporate ESG information, enabling investors to understand financial materiality. This addresses the limitations of voluntary corporate disclosures, which often fail to meet investors’ needs [59,60]. The Sustainability Accounting Standards Board (SASB) framework, adopted by various ESG rating agencies, including the SynTao ESG Rating Index used in this study, emphasizes the financial materiality of ESG issues. This approach allows for cross-sectional comparisons of financial materiality across different industries, enhancing investor decision-making capabilities.
Of course, there are current studies that question ESG’s emphasis on a single financial materiality. Skeptics argue that ESG disclosures overemphasize financial materiality, with the real aim of securing shareholders’ interests, without focusing on the impact of firms on society and the environment [61]. Some scholars have also argued that emphasizing the financial materiality of ESG leads firms to consider only sustainability topics that affect profitability, while other topics are excluded [62]. However, despite some skepticism in the academic community, it is indisputable that ESG information that includes financial materiality enables investors to make better decisions, increases the share price of listed companies, and thus alleviates financing constraints [63]. To summarize, this paper puts out the following hypothesis:
H2.
ESG ratings promote corporate GTI by easing financing constraints.
3.3. ESG Ratings, Corporate Internal Control, and GTI
For enterprises to carry out green technological innovation, both external capital support and internal capital management are crucial. The ESG performance of enterprises creates a favorable environment for green technological innovation by enhancing the quality of internal control. According to the resource-based view, an enterprise’s ESG performance can be regarded as a strategic resource, enhancing the effectiveness of the internal governance structure and supporting the implementation of internal control [64]. Stakeholder theory emphasizes that enterprises need to coordinate the interests of all parties in their operations, with the internal control system mitigating the negative impacts of agency problems, information asymmetry, and innovation risks on green technological innovation [65]. Furthermore, Internal Control Theory (ICT) argues that sound internal control improves operational efficiency and provides necessary risk management tools for innovation activities, ensuring the successful implementation of green technology innovation [66]. This improvement in internal control can influence both the quantity and quality of green innovations. Enhanced operational efficiency may enable enterprises to initiate and manage a greater number of green projects, while optimized risk management and resource allocation can contribute to the development of higher-quality, more impactful green technologies. To summarize, this study presents the following hypothesis:
H3.
ESG ratings promote GTI in companies by improving the quality of internal controls in enterprises.
3.4. ESG Ratings, R&D Investment, and GTI
Many organizations are increasingly focused on expediting their green transformation through Green Technological Innovation (GTI). However, the implementation of environmentally friendly technical advancements in businesses faces challenges such as substantial capital expenditure, extended periods for financial returns, and significant risks. The societal benefits often outweigh the firm-specific advantages, resulting in positive externalities and reduced incentives for businesses to invest in R&D [67]. While government subsidies aim to address this issue, they have limitations in terms of eligibility and effectiveness.
ESG ratings can potentially address these shortcomings by incentivizing firms to augment their R&D expenditure. According to resource-based theory, internal organizational elements are crucial for implementing green technology innovation and establishing sustainable competitive advantages. ESG ratings can promote the introduction of green technology resources and optimize resource allocation in enterprises. Better ESG performance can facilitate the exchange of internal and external information, attracting investors and enhancing the firm’s green technology innovation capability. Under the ESG framework, enterprises are encouraged to make strategic decisions on green innovation, increasing investment in green technology R&D and improving independent technology innovation capability [68]. This increased R&D investment can potentially lead to both a higher quantity of green innovation projects and improved quality of innovations, as firms allocate more resources to develop advanced and impactful green technologies.
Furthermore, ESG ratings can strengthen stakeholder supervision of enterprises. As ESG ratings are dynamic, highly-rated enterprises obtain a better social image and increased attention. To maintain their ratings and manage relationships with shareholders and consumers, enterprises typically increase pollution control costs. In the long term, this may drive companies to seek cost reduction through green technologies, leading to increased investment in GTI for longer-term benefits.
Based on these considerations, this study proposes the following hypothesis:
H4.
ESG ratings promote corporate GTI by increasing corporate R&D investment.
This research develops a methodology to analyze the process via which ESG rating events impact company GTI, based on the aforementioned rationale. This framework includes corporate financing constraints, corporate internal control, and R&D investment. The analytical framework of this paper is shown in Figure 1.
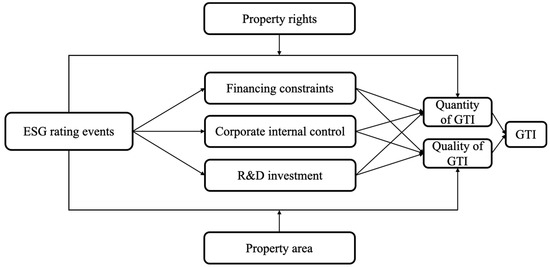
Figure 1.
Framework for analysis.
4. Research Design
4.1. Data Source and Sample Processing
Given the limitations of ESG rating events and corporate green technology innovation data, we select Chinese A-share companies listed on Shanghai and Shenzhen stock exchanges from 2010–2022 as the sample for research. The level of enterprises’ green technology innovation is obtained by matching the green invention patent data released by the State Intellectual Property Office of China with the number of listed companies’ green invention patents in the CNRDS database. The green technology innovation data of enterprises mainly includes two categories: the number of independently filed green invention patents and the number of independently filed green invention patents being cited. The ESG data are obtained from the SynTao database. Firm-level economic data are from the CSMAR database. Economic data at the regional level are derived from the China Statistical Yearbook (CSY).
To assure the credibility of the research findings, this publication preprocesses the data in the following manner:
- Companies in the finance and real estate sectors are not included. Financial and real estate companies operate under unique regulatory environments and have distinct accounting practices that differ significantly from other industries. Including these sectors could potentially introduce bias into the analysis due to their specific capital structures and valuation methods, which are not directly comparable to companies in other sectors [69,70].
- Companies listed on PT, ST, and *ST are not included. PT (Particular Transfer), ST (Special Treatment), and *ST (Special Treatment with risk of delisting) designations indicate companies facing severe financial difficulties or regulatory issues. Including these firms could introduce extreme outliers and distort the overall picture of normal business operations, potentially leading to biased results [71].
- Listed companies with significant gaps in patent data and economic data are excluded. Companies with incomplete data could lead to inaccurate analyses and unreliable conclusions. Gaps in patent data may indicate inconsistent innovation activities or reporting issues, while missing economic data could suggest unstable financial reporting. By focusing on companies with complete datasets, we ensure a more robust and consistent analysis [72,73].
4.2. Variable Selection
4.2.1. Dependent Variable
At present, academics usually use patent information to measure the technological innovation of enterprises, and the patent level is an important indicator of an enterprise’s technological innovation ability. In this regard, this paper refers to the study of [74] and selects the number of green invention patent applications of listed companies as a proxy variable for the amount of GTI, . At the same time, in order to avoid the phenomenon of “patent bubble” caused by the surge in the number of patents and to enhance the robustness and reliability of the benchmark regression, this paper takes the number of citations of green invention patents as a proxy variable for the quality of GTI, . In addition, in order to avoid the influence of a zero value and heteroskedasticity, the quantity and quality of enterprises’ GTI are treated by adding 1 and taking the natural logarithm.
4.2.2. Independent Variable
Due to factors such as potential greenwashing, corporate CSR reports and ESG disclosures may be limited and potentially misleading. Companies’ voluntary disclosures often result in selective provision of ESG information [75,76]. In contrast, third-party ESG rating agencies can offer more accurate, comprehensive, and systematic ESG information.
This study selects SynTao’s ESG ratings as the analytical case for several reasons. Firstly, SynTao is China’s pioneering institution in publishing ESG rating data and the first domestic service organization to sign the United Nations Principles for Responsible Investment (UNPRI). Its rating standards align with global benchmarks, and its rating results are widely recognized internationally. Secondly, as a professional third-party institution, SynTao not only collects voluntarily disclosed company information but also gathers data from media, regulatory bodies, and other sources. It operates a real-time online monitoring system to identify ESG controversies among target companies and assess risks. This process provides an objective and comprehensive evaluation of corporate ESG performance. Thirdly, SynTao selects companies covered by the CSI (China Securities Index), which makes the corporate data less susceptible to manipulation [77]. Consequently, the coverage scope of SynTao is exogenous, and the rating agency is independent and comprehensive, effectively mitigating endogeneity concerns.
Thus, this article utilizes the SynTao ESG rating data as the standard to create the primary explanatory variables and adopts the approach of [78]. If SynTao provides ESG ratings of enterprise i in year t, it is in the experimental group, and takes the value of 1. Otherwise, it is in the control group, and takes the value of 0. It is important to note that this study overcomes the endogeneity of the study by considering the rating of firms by ESG rating agencies as an informal environmental regulation policy. Under such a research perspective, for enterprises with different ESG performances, even for the worst and the best ESG performers, their core explanatory variables correspond to 1 in this study.
In addition to examining the impact of ESG rating events on companies, we also examine corporate ESG performance scores. SynTao has rated the ESG of firms in ten grades from low to high: D, C−, C, C+, B−, B, B+, A−, A, A+. Based on the results of corporate ESG ratings, we construct the non-core explanatory variable , which takes the values of 1–10, which corresponds to the ten grades of ESG, from low to high, respectively.
4.2.3. Control Variables
In this paper, we control the important variables of firms’ green technology innovation, including:
- Firm size (Size). Larger firms typically have more resources to invest in R&D activities. Firm size is generally associated with a positive relationship to green technology innovation capability, as larger firms may have stronger financial resources and more comprehensive R&D facilities [79].
- Gearing ratio (Lev). The gearing ratio may have complex effects on green technology innovation. Moderate debt levels might incentivize innovation, but excessive debt could inhibit it. The relationship might be non-linear, possibly exhibiting an inverted U-shape [80].
- Net profit margin on total assets (ROA). Firms with stronger profitability typically have more resources for innovation. ROA is often positively associated with green technology innovation, as high-ROA firms may have more capacity to engage in R&D investment.
- Firm age (FirmAge). Firm age may have a dual impact on green technology innovation. Older firms may have accumulated more experience, but may also be affected by organizational inertia. The relationship between firm age and green technology innovation is often uncertain and context dependent [81].
- Tobin’s Q value (TobinQ). A high Tobin’s Q typically indicates market optimism about a firm’s future growth potential. Tobin’s Q is often positively associated with green technology innovation, as it may reflect a firm’s innovation potential and market recognition [82].
- Insolvency (tot_liability). Higher debt levels may limit a firm’s innovation input. Total liabilities are often negatively associated with green technology innovation, as high debt may reduce resources available for innovation.
- Whether it is audited by a Big 4 accounting firm (Big 4). High-quality audits may increase the reliability of firm information, influencing investors’ assessment of innovation activities. Being audited by a Big 4 firm is often positively associated with green technology innovation [83].
- Percentage of Shares Held by the Firm’s Management (Mshare). Higher management shareholding may promote long-term investment decisions. Management shareholding is often positively associated with green technology innovation, as it may incentivize focus on long-term sustainable development.
- Percentage of shares held by institutional investors (INST). Institutional investors are often considered more concerned with long-term value creation, including environmental sustainability. Institutional ownership is frequently positively associated with green technology innovation [84].
- Percentage of fixed assets (FIXED). The fixed asset ratio reflects a firm’s asset structure, which may influence its innovation capability. The relationship between the fixed asset ratio and green technology innovation is often uncertain and requires empirical testing in specific contexts.
Table 2 shows the variable definitions.
Table 2.
Variable definitions.
4.3. Modelling Design
The current ESG rating data are primarily sourced from third-party rating agencies, as government departments have not yet established uniform standards for ESG ratings. The rating data of these agencies are subject to the attention and supervision of various investors and corporate stakeholders in the capital market. Therefore, the ESG rating results of third-party agencies can be regarded as a kind of informal environmental regulation. Such regulation can have a significant impact on corporate behavior. This paper takes the event of SynTao’s first announcement of listed companies’ ESG ratings as a quasi-natural experiment, adopts a multi-period double-difference model to identify the impact of ESG ratings on enterprises’ green technological innovations, and constructs the model as follows:
where the explanatory variables and represent the quantity and quality of firm i’s green technology innovations in year t, respectively; is an explanatory variable, if SynTao Green publishes data on firm i’s ESG ratings in year t, = 1, otherwise = 0; is a control variable; and are the individual fixed and time fixed effects, respectively; and is a random error term.
Meanwhile, in order to examine the impact of ESG rating scores on corporate GTI, this paper constructs a panel regression model. The specific model is as follows:
where is the ESG rating score of firm i in year t. SynTao publishes a rating score of D, C−, C, C+, B−, B, B+, A−, A, A+ with 10 grades, assigning ESG grades of listed firms from low to high from 1 to 10, respectively.
As ESG ratings are still in development, the rating agencies still need to form a unified standard and have yet to disclose the indicator weights and scoring rules, leading to frequent differences in the ESG rating results of different evaluation agencies for the same enterprise. It has been shown that the six mainstream international ESG rating agencies have significant differences in the rating scope, measurement methods, indicator weights, etc., and the correlation coefficient of the rating results released by the six agencies is only 0.54 [85]. Given this, this paper refers to the design of [86]. It adds ESG rating uncertainty indicators to the benchmark regression to further explore whether the enhancement of ESG on corporate GTI is affected by its uncertainty. The specific model is as follows:
where denotes the uncertainty of the ESG rating of firm i in year t. The steps for constructing this indicator are as follows: First, the five rating agencies, SynTao, Chindices, Bloomberg, MSCI, and Hexun, are paired two-by-two to generate 10 rating pairs. Second, for each rating pair, firms that are rated by both rating agencies are screened. The purpose of this treatment is to get firms that can be rated by two and more agencies so that there may be rating divergence. If a corporation is in the rating range of five rating agencies at the same time, then after such treatment, the business will have 10 rating pairs; if a corporation is in the range of four rating agencies at the same time, then the corporation will get six rating pairs, and so on. Sorting based on the raw scores of the rating agencies generates percentile rankings for each firm in each year. Third, for each firm in each rating pair, the standard deviation of this firm’s percentile rank is computed as the uncertainty of this firm’s paired ratings for that year. Specifically, if a firm has 10 rating pairs, then it also has 10 pairwise uncertainties; if a firm has 6 rating pairs, then it also has 6 pairwise uncertainties. Finally, the mean value of pairwise uncertainty for each firm is calculated as the value of the rating uncertainty indicator for that firm for the year.
In conducting the mechanism test, this study uses the following model for the test:
where is the variable measuring financing constraints, corporate internal control, and R&D investment, and the rest of the variables are consistent with the baseline regression model.
5. Results of Empirical Analyses
5.1. Descriptive Statistical Analysis
Table 3 displays the quantitative characteristics of the primary variables. China’s company ESG score has a maximum value of 9, a mean value of 0.581, and a standard deviation of 1.707. These statistics suggest that there is significant potential for development in China’s business ESG rating. Furthermore, the disparity in ESG ratings is readily apparent, indicating an imbalance in development. The upper limits for the quantity and quality of green technological innovation in enterprises are 6.328 and 7.211, respectively. The average values are 0.235 and 0.34, respectively. The standard deviations are 0.630 and 0.844, respectively. These figures suggest that there is a significant disparity in the level of development of green technological innovation among enterprises.
Table 3.
Descriptive statistical analysis.
5.2. Correlation Analysis
Table 4 displays the correlation coefficients for each of the main variables. According to the data in the table, it is clear that the correlation coefficients between each variable are all less than 0.5, suggesting that there is no substantial problem of covariance. The correlation coefficients between events that score corporate environmental, social, and governance (ESG) factors and the amount and quality of corporate greenhouse gas emissions intensity (GTI) are 0.1581 and 0.2027, respectively. The correlation values exhibit statistical significance at the 1% level. This research presents the first evidence indicating that ESG rating events have a positive and incentivizing effect on company GTI.
Table 4.
Correlation coefficients of the main variables.
5.3. Benchmark Regression Results
The benchmark regressions in Table 5 and Table 6 analyze the impact of ESG rating events on the quantity and quality of GTI. The findings indicate that the estimated coefficients of the primary explanatory variable ESG are consistently and significantly positive, irrespective of the inclusion of control variables. This implies that ESG grading events have the potential to greatly improve both the amount and the quality of GTI in companies. H1 has been confirmed. Meanwhile, the estimated coefficient of is also significantly positive, which indicates that the higher the ESG rating score, the more enterprises tend to carry out GTI. The ESG rating event plays a crucial role in encouraging firms to engage in GTI. Firms with a strong ESG rating demonstrate their effective management and long-term operational stability, hence fostering positive advancements in their GTI.
Table 5.
Benchmark regression results on NGI.
Table 6.
Benchmark regression results of QTI.
Furthermore, the coefficients of and exhibit a strong negative correlation, irrespective of whether the amount or quality of GTI is the explanatory variable. Put simply, the lack of assurance in ESG ratings will hinder the development of environmentally friendly technology by corporations and diminish the positive impact that ESG ratings have on such innovation. This conclusion can be explained through financial constraint theory. The theory suggests that information asymmetry caused by market imperfections is a major factor in corporate financial constraints [87]. ESG rating uncertainty reflects the uncertainty risks of ESG performance and information asymmetry, significantly increasing firms’ financial constraints and financing costs. The reasons are twofold. First, ESG rating uncertainty signifies various uncertain factors and risks in related areas, sending negative signals about the firm’s unclear prospects, deterring investors or creditors from engaging with the company due to risk aversion. Thus, ESG rating uncertainty becomes a market friction hindering firms’ access to external capital [88]. Second, ESG rating uncertainty makes it difficult for investors and creditors to discern the firm’s true ESG performance and accurately assess its green operations and future sustainability. This exacerbates information asymmetry. Insufficient information leads investors and creditors to demand higher returns to compensate for potential moral hazard risks [89], forcing firms to bear high financing costs and ultimately negatively impacting their green technology innovation.
5.4. Robustness Check
5.4.1. Parallel Trends Test
The twofold difference analysis of the experimental and control groups is based on the premise that both groups show similar trends before the policy is introduced. Before the ESG rating, there is a clear and significant change in the pattern of company GTI between the experimental and control groups. Figure 1 demonstrates that there is no notable disparity in the caliber or amount of business green technology advancement prior to ESG grading. This suggests that both the experimental and control groups conform to the expected pattern hypothesis.
Following the ESG rating event, there is a notable increase in the coefficients of the policy dummy variables depicted in Figure 2a,b. Additionally, the regression coefficient of the quantity of corporate GTI is only significant in the second year. This indicates that the development of GTI involves a substantial initial expenditure and a lengthy period of time before the investment is recouped. It also requires organizations to dedicate a specific amount of time to implementing GTI.
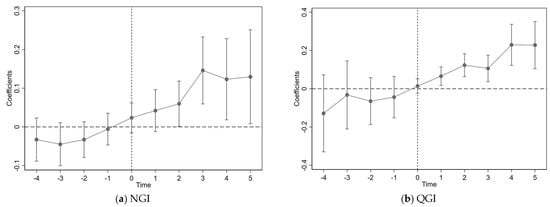
Figure 2.
Parallel trend test.
5.4.2. Placebo Testing
This study performed a placebo test by randomly choosing one year from the sample to serve as the ESG rating year. To improve the test validity of the placebo test, the aforementioned experimental procedure is duplicated 1000 times. The results are displayed in Figure 3, where the predicted coefficients are predominantly close to 0 and largely statistically insignificant at the 10% level. The calculated coefficients have a distribution that closely approximates a normal distribution. The results suggest that unrelated factors have no effect on the impact of ESG rating events on firms’ GTI, therefore confirming the credibility of the aforementioned conclusions.
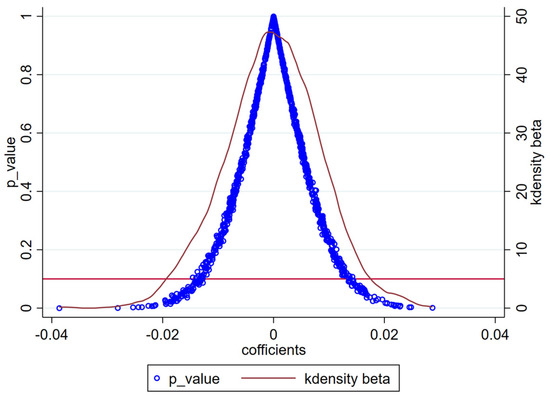
Figure 3.
Placebo test.
5.4.3. Counterfactual Testing: Advancing the Timing of Policy Implementation
To evaluate the long-term sustainability of the benchmark regression results, this research consistently advances the ESG rating events by three years, two years, and one year, respectively. Counterfactual tests are performed by creating artificial variables and including them in the reference regression model. Following Table 7, the results indicate that the dummy variables, which were created by shifting the policy implementation period by three years, two years, and one year, are not statistically significant, regardless of the quantity and quality of green technology patents held by enterprises. This finding suggests that there is no additional consistent bias in the experimental and control groups, and the occurrence of the ESG rating event can greatly stimulate the development of GTI.
Table 7.
Counterfactual test.
5.4.4. PSM-DID
When third-party rating agencies release ESG rating information, there may be a bias in the sample selection of large enterprises that have more detailed information, which can affect the model mentioned above. Hence, this paper employs the PSM-DID method to reassign the control group to the treatment group, thereby reducing the issue of sample selection bias. The kernel matching method accurately matches control variables, such as company size and return on assets, as covariates. Following Table 8, the findings indicate that the regression results of the ESG rating are consistently positive, irrespective of the extent or excellence of company GTI. This suggests that ESG grading events have the potential to stimulate environmentally friendly corporate innovation. The initial model does not exhibit significant sample selection bias issues, and the derived findings are trustworthy.
Table 8.
PSM-DID test.
5.5. Heterogeneity Analysis
5.5.1. Heterogeneity Test Results Based on Property Rights
The relationship between ESG ratings and the development of environmentally friendly technology by companies may be impacted by the attributes of corporate property rights. From a political standpoint, State-Owned Enterprises (SOEs) are typically subjected to more stringent governmental regulations regarding the environment, take on greater social obligations, and have a specific political objective. Due to the growing need for sustainable development, State-Owned Enterprises (SOEs) have become crucial for the government to facilitate high-quality development. When comparing private enterprises to State-Owned Enterprises (SOEs), it is observed that SOEs are typically subjected to more stringent environmental regulations and social oversight. This research aims to investigate the influence of corporate property rights on the relationship between ESG ratings and the growth of GTI in firms.
The sample businesses are categorized into state-owned enterprises and non-state-owned enterprises. The findings are displayed in Table 9. The effects are consistently good, irrespective of the extent and caliber of the business GTI. This suggests that ESG grading events have a substantial impact on promoting GTI in both state-owned and private firms. State-owned firms have a lower ESG coefficient compared to private enterprises when it comes to the quantity of GTI within the corporate sector.
Table 9.
Heterogeneity test results based on property rights.
However, it is important to note that state-owned firms have a higher ESG coefficient than nonstate-owned enterprises when it comes to the quality of corporate GTI. One probable explanation for this is that private firms, faced with intense market competition, are more inclined to develop innovative green technologies in order to maximize profits. State-owned firms possess exclusive access to national monopoly resources, which enables them to exert influence in leading the industry through their GTI. Consequently, the quality of GTI in state-owned enterprises surpasses that of private enterprises.
5.5.2. Heterogeneity Test Results Based on Property Area
China is a geographically expansive nation, with distinct roles in its growth being played by the eastern, central, and western areas. The impact of ESG rating events on enterprises in various locations lacks consistency. To mitigate the issue of regional disparities, further policy measures may need to be implemented. This study categorizes the sample enterprises into eastern, central, and western firms based on the geographical distribution of China and recalculates the benchmark model. Following Table 10, the findings indicate that for companies situated in the eastern region, ESG rating events have a notably positive effect on both the quantity and quality of corporate GTI. For companies located in the central region, ESG rating events have a significantly positive impact on the quality of corporate GTI, but their effect on the quantity is not significant. On the other hand, for companies located in the western region, ESG ratings have an insignificant impact on both the quantity and quality of corporate GTI. Consequently, the impact of ESG rating events on GTI growth is more advantageous for eastern-region firms than for central- and western-region enterprises.
Table 10.
Heterogeneity test results based on area.
The regional disparities in ESG rating events’ impact on green technology innovation (GTI) stem primarily from three factors. The eastern region’s economic advantage provides greater financial resources for GTI investment [90]. Its more developed institutional environment, including stronger market mechanisms and supportive policies, facilitates ESG practice implementation [91]. Additionally, the concentration of skilled talent and research institutions in the east creates a robust innovation ecosystem [92]. These combined advantages enable eastern firms to more effectively translate ESG ratings into GTI compared to their central and western counterparts.
6. Mechanical Testing
The above text presents the empirical evidence supporting the notion that ESG ratings contribute to the advancement of GTI in corporations. This section elucidates the operational principles of this component through three distinct viewpoints: financial limitations, corporate internal control, and R&D investment, as deduced from theoretical examinations. A model is being constructed.
6.1. ESG Ratings and Financing Constraints
Companies with outstanding ESG ratings have the opportunity to secure affordable capital by issuing environmentally friendly financial instruments known as green credits. ESG ratings can help reduce the imbalance of knowledge between companies and external investors, thereby easing funding limitations. Thus, this paper opts for the SA index as a means to gauge financing restrictions. Table 11 displays the finance constraint mechanism test regression findings. The regression coefficient of the SA index in column (1) has a statistically significant negative value, suggesting that ESG ratings have the potential to mitigate funding limitations. Columns (2) and (3) include more research about the influence of financial constraints on both the quantity and quality of green technological advancements made by businesses. The findings show a considerable negative effect. ESG ratings can facilitate business GTI by mitigating funding limitations. H2 is valid.
Table 11.
Mechanism test: ESG ratings, financing constraints, and firms’ GTI.
6.2. ESG Ratings and Corporate Internal Control
Good ESG ratings help to enhance the effectiveness of internal controls, and high-quality internal controls can mitigate the negative effects of agency problems, information asymmetry, and innovation risk on firms’ green technological innovation through the synergistic effects of its elements. Based on this, this paper examines whether ESG ratings can improve the level of green technological innovation by promoting the level of corporate internal control. For the measurement of internal control level, this paper selects the Dibble internal control index/100. Table 12 reports the regression results of the mechanism test. As can be seen from column (1), the regression result of firms’ internal control on ESG ratings is positive, indicating that ESG rating events can significantly improve the level of firms’ internal control. The regression coefficient between firms’ internal control and firms’ green technology innovation is significantly positive, indicating that firms’ internal control can promote firms’ green technology innovation. It can be concluded that ESG ratings can improve the level of corporate internal control and then promote corporate green technology innovation. H3 is valid.
Table 12.
Mechanism test: ESG ratings, corporate internal control, and GTI.
6.3. ESG Ratings and R&D Investment
ESG rating events can partially internalize the external costs and benefits of R&D activities, so encouraging firms to boost their investment in research and development and fostering their environmentally friendly innovation. This article chooses the aggregate R&D expenditure (yftr) variable as the metric for measuring R&D investment. Table 13 presents the findings of the regression analysis conducted to test the R&D investment mechanism. The regression analysis of R&D investment on ESG rating, based on the data in column (1), reveals a significant positive relationship. This suggests that ESG rating events have a substantial impact on increasing enterprises’ R&D expenditure. Columns (2) and (3) analyze the influence of research and development (R&D) spending on the progress of eco-friendly technologies by corporations. The correlation between enterprises’ R&D spending and the number of green technology inventions is strongly positive, suggesting that an increase in R&D investment leads to a higher number of green technology breakthroughs. ESG ratings facilitate the advancement of GTI by stimulating enterprises’ research and development (R&D) expenditure. H4 is valid.
Table 13.
Mechanism test: ESG ratings, R&D investment, and firms’ GTI.
7. Conclusions and Enlightenments
7.1. Conclusions and Replication
Under the background of carbon peak and carbon neutral strategy, GTI has become an essential driving force to achieve ecological civilization construction and open a new chapter of green development, and how enterprises can make good use of ESG ratings to enhance their GTI level is a hot topic at present. This study empirically analyzes the impact of ESG rating events on corporate GTI by constructing a multi-period DID model using panel data of Chinese listed companies from 2010 to 2022 as the research sample. The findings suggest that ESG rating events and ESG scores can stimulate corporate GTI. ESG rating uncertainty can inhibit corporate GTI. The mediation effect analysis shows that ESG rating events can stimulate firms’ GTI by reducing financing constraints, increasing the degree of corporate internal control, and increasing R&D investment. In addition, heterogeneity analyses indicate that ESG rating events have a better stimulating effect on the quantity of GTI of non-state-owned enterprises than state-owned enterprises, while the stimulating effect on the quality of innovation of non-state-owned enterprises is inferior to that of state-owned enterprises. Moreover, the innovation stimulation effect of ESG rating events shows a trend of east-high and west-low in geographical distribution.
Given that this study focuses on Chinese firms, it is important to consider how these findings might translate to different regulatory environments or international markets. For instance, in the European Union, where ESG disclosure is becoming mandatory under the Corporate Sustainability Reporting Directive (CSRD), the impact of ESG ratings on GTI might be even more pronounced. The reduced uncertainty in ESG reporting could potentially amplify the positive effects observed in this study. In contrast, in countries with less stringent ESG regulations, such as some developing economies in Southeast Asia or Africa, the relationship between ESG ratings and GTI might be weaker, necessitating additional policy interventions to stimulate green innovation. The finding that state-owned enterprises in China show a stronger stimulating effect on the quality of innovation might be particularly relevant for countries with significant state involvement in the economy, such as Russia or Brazil. However, in markets dominated by private enterprises, such as the United States, the dynamics could differ, possibly showing a more uniform effect across firms. The observed east-west disparity in China suggests that similar regional differences might exist in large, diverse countries like India or the United States, where economic development and environmental policies vary across regions. Future research could explore these variations, examining how differences in ownership structures, regional development levels, and ESG rating practices across countries influence the relationship between ESG ratings and corporate green innovation. Such studies would provide valuable insights for policymakers and corporate leaders seeking to leverage ESG ratings to promote sustainable development in various global contexts.
7.2. Enlightenments
The research in this paper focuses on the Chinese market where the level of corporate green technology development is limited. Along with the deep implementation of national strategies such as peak carbon and carbon neutrality, regulators are paying more and more attention to corporate ESG ratings. As the world’s largest developing country and emerging economy, China’s sustainable development practices can provide development concepts and lessons for other developing countries to implement ESG strategies, as well as other sustainable development strategies.
First, at the national level, for countries around the world, especially developing countries, there is a need to further improve the domestic ESG evaluation system and actively explore ESG development concepts. The empirical results of this study show that ESG rating events can significantly promote the quantity and quality of green technological innovation of enterprises. Therefore, it is crucial to expand the influence of ESG in enterprise development. The government needs to construct a more comprehensive ESG evaluation system. It not only needs to guide enterprises to participate in ESG evaluation but also to emphasize the importance of the results of ESG ratings. For example, the government can incorporate ESG rating results into the evaluation system of government incentives, and reward enterprises that participate in ESG ratings and those that perform well in ESG rating results. This approach aligns with our findings on the positive impact of ESG rating events on corporate GTI and can further motivate enterprises to prioritize ESG performance. At the same time, when improving the ESG rating system, the country not only needs to be in line with international ESG standards but also needs to mobilize the enthusiasm and motivation of local ESG rating agencies and encourage them to explore ESG rating standards that are suitable for the sustainable development of the country. Third-party rating agencies are induced to evaluate corporate ESG information, thus reducing the regulatory costs of the city government. The findings of this paper show that the promotion effect of ESG rating events on corporate green technology innovation has a large gap between different regions in China, with a trend of high in the east and low in the west. In this regard, to fully leverage the induced effect of ESG ratings on firms’ green innovation, the government can strengthen the level of local environmental regulation in a targeted manner, particularly by providing additional ESG rating incentives or GTI support in western regions, to achieve the holistic and coordinated nature of the country’s sustainable development.
Second, for enterprises, they should actively respond to the national call for green development in the management process and strengthen the top-level institutional design of ESG. This study finds that enterprises’ participation in ESG ratings can alleviate their financing constraints and can help them get more support from investors. Therefore, in the context of the global advocacy of the green economy and high-quality development, enterprises should consider their investment in environmental protection, green transformation, and social responsibility as a kind of ‘value investment’ rather than an additional cost from the perspective of long-term interests. On the contrary, enterprises should actively participate in ESG ratings and disclose ESG information to improve the transparency of corporate information, so as to maintain a good relationship between enterprises and investors and avoid financing constraints due to information asymmetry. At the same time, enterprises should learn from the effective management measures of excellent enterprises around the world and incorporate the concept of ESG ratings into the management concepts and compliance standards of enterprises, so as to make the internal management standards of enterprises consistent with the direction of social development. Our research also reveals that increasing the degree of internal control and R&D investment are important pathways through which ESG rating events stimulate corporate GTI. In addition, enterprises in the pollution industry and in growth and decline periods should insist on integrating ESG concepts into their development strategies and management, efficiently and reasonably utilizing resources to invest in innovation and constantly searching for innovation points.
Thirdly, for ESG rating agencies, rating agencies should firmly play the role of promoters and supervisors of national sustainable development. Along with the deepening of green economy development, ESG rating information plays an increasingly obvious role in the development of enterprises. In other words, these ESG rating agencies have become the main body of environmental regulation, and to a certain extent, they can fill in the formal environmental regulation failure effect, as these rating agencies already possess the power of environmental regulation in fact. The findings of this paper can also prove this view. Against this background, ESG rating agencies should take social responsibility as a priority for enterprises, and when rating enterprises, ESG rating agencies should insist on treating each enterprise fairly and impartially to ensure that no rent-seeking phenomenon can occur. In addition, ESG rating agencies should also actively explore forms and ways to participate in environmental governance. For example, ESG rating agencies can use information technology, especially digital information network technology as a tool for environmental regulation, thus ensuring the accuracy and efficiency of ESG ratings. Considering our finding that ESG rating uncertainty can inhibit corporate GTI, rating agencies should strive to improve the consistency and transparency of their ratings to reduce uncertainty. Moreover, it is recommended that rating agencies develop specific assessment indicators for GTI to better reflect corporate performance in this area.
Fourth, for investors, they should establish the concept of ESG responsible investment and vigorously promote ESG investment. The concept of investors practicing ESG investment is not only conducive to enterprises alleviating financing constraints and providing a resource base for the green transformation and development of enterprises, but is also conducive to investors identifying potential investment risks and protecting investor interests. Actively advocating the concept of ESG investment and vigorously developing ESG investment funds, ESG investment can not only motivate enterprises to pay attention to their own ESG performance and promote their ESG practice, but also help promote the green and sustainable development of the whole society. Based on our research findings that ESG ratings promote corporate GTI by reducing financing constraints, it is recommended that investors pay special attention to companies’ GTI performance when evaluating enterprises, making it an important consideration factor in ESG investment decisions.
Finally, to better promote GTI development, it is suggested a collaboration mechanism is established between the government, enterprises, rating agencies, and investors, such as a cross-sectoral GTI promotion working group or platform. Meanwhile, a regular assessment mechanism should be established to monitor the long-term effects of ESG ratings on corporate GTI and dynamically adjust policies based on the assessment results. At the international level, cooperation should be strengthened, best practices in ESG rating and GTI promotion shared, and global sustainable development promoted, which is of great significance for achieving China’s carbon peak and carbon neutrality strategic goals.
7.3. Limitations and Future Prospects
This study still has some limitations for further research in the future. Firstly, there is currently no recognized definition of ESG ratings, and there is no uniform measurement. Although this study chooses to use ESG rating events as a policy shock, there is still some subjectivity. Moreover, the research object of this paper focuses on China, and although this study has used some columns of robustness tests to verify the accuracy of the results, the empirical results may still have sample selection bias. Therefore, it is necessary to consider the use of more advanced econometric tools in future studies to address this issue. Moreover, the sample of the study should not be limited to China, but also consider more developing countries globally, as well as going into more detailed industries. Second, different ESG rating agencies in China have not standardized their evaluation criteria for ESG. This study selected the more authoritative SynTao agency. Although the SynTao agency has used internationally recognized standards to construct the evaluation system, some indicators may not be suitable for developing countries, thus causing some interference in the results. In the future, we can absorb the experience and practices of international authoritative rating agencies and act on the basis of the national conditions of developing countries so as to make ESG evaluation standards suitable for their own countries. Thirdly, as SynTao has only published the ESG rating level and not the rating scores of E (environment), S (society), and G (governance), this study can only assess the impact of ESG ratings on enterprises’ green technological innovations from the overall level. With more disclosure of various data on domestic ESG ratings, future research can be expanded from more dimensional perspectives on the basis of this study.
Author Contributions
Data curation, H.Y.; formal analysis, H.Y.; funding acquisition, X.W.; investigation, H.L.; methodology, H.Y.; project administration, X.W.; resources, H.Y. and H.L.; software, H.Y.; validation, H.Y.; writing—original draft, H.Y.; writing—review and editing, H.Y. and X.W. All authors have read and agreed to the published version of the manuscript.
Funding
Jiangsu Law Society Research Project, “Research on Improving Judicial Protection of Intellectual Property Rights of Traditional Chinese Medicine” ( SFH2023D018); Jiangsu Provincial Social Science Fund Key Project, “Research on the Theory and Practice of Local Environmental Legislation” (19FXA002); Nanjing Law Society Project, “Boundary and Balance between Patent Protection and Antitrust” (NJFX(2024)D47 ); Southeast University Innovation Capability Enhancement Plan for Doctoral Students (CXJH_SEU24206).
Institutional Review Board Statement
Not applicable.
Informed Consent Statement
Not applicable.
Data Availability Statement
Data are available from the authors upon request.
Conflicts of Interest
Author Haiyan Luan was employed by the company V&T Law Firm (Nanjing). The remaining authors declare that the research was conducted in the absence of any commercial or financial relationships that could be construed as a potential conflict of interest.
References
- Guo, L.; Hu, C.; Fan, M.; Mao, J.; Tian, M.; Wang, Z.; Wei, Y. Does Informal Environmental REGULATION matter? Evidence on the Different Impacts of Communities and ENGOs on Heavy-Polluting Firms’ Green Technology Innovation. J. Environ. Plan. Manag. 2023, 67, 2668–2694. [Google Scholar] [CrossRef]
- Bai, L.; Wang, J.; Ma, X.; Lu, H. Air Pollution Forecasts: An Overview. Int. J. Environ. Res. Public Health 2018, 15, 780. [Google Scholar] [CrossRef] [PubMed]
- Wu, C.; Maurer, C.; Wang, Y.; Xue, S.; Davis, D.L. Water Pollution and Human Health in China. Environ. Health Perspect. 1999, 107, 251–256. [Google Scholar] [CrossRef] [PubMed]
- Xie, R.; Wei, D.; Han, F.; Lu, Y.; Fang, J.; Liu, Y.; Wang, J. The effect of traffic density on smog pollution: Evidence from Chinese cities. Technol. Forecast. Soc. 2019, 144, 421–427. [Google Scholar] [CrossRef]
- Tian, H.; Gao, J.; Hao, J.; Lu, L.; Zhu, C.; Qiu, P. Atmospheric Pollution Problems and Control Proposals Associated with Solid Waste Management in China: A review. J. Hazard. Mater. 2013, 252–253, 142–154. [Google Scholar] [CrossRef]
- Wang, X.; Wang, L. State-Enterprise Relation, Local Economic Priority, and Corporate Environmental Responsibility. Appl. Econ. 2019, 51, 995–1009. [Google Scholar] [CrossRef]
- Wang, Q.; Qu, J.; Wang, B.; Wang, P.; Yang, T. Green Technology Innovation Development in China in 1990–2015. Sci. Total Environ. 2019, 696, 134008. [Google Scholar] [CrossRef]
- Ganda, F. The impact of innovation and technology investments on carbon emissions in selected organisation for economic Co-operation and development countries. J. Clean. Prod. 2019, 217, 469–483. [Google Scholar] [CrossRef]
- D’Attoma, I.; Ieva, M. Determinants of Technological Innovation Success and Failure: Does Marketing Innovation Matter? Ind. Market. Manag. 2020, 91, 64–81. [Google Scholar] [CrossRef]
- Hu, J.; Hu, M.; Zhang, H. Has the Construction of Ecological Civilization Promoted Green Technology Innovation? Environ. Technol. Innov. 2023, 29, 102960. [Google Scholar] [CrossRef]
- Blackman, A.; Li, Z.; Liu, A.A. Efficacy of Command-and-Control and Market-Based Environmental Regulation in Developing Countries. Annu. Rev. Resour. Econ. 2018, 10, 381–404. [Google Scholar] [CrossRef]
- Cheng, Z.; Li, L.; Liu, J. The Emissions Reduction Effect and Technical Progress Effect of Environmental Regulation Policy Tools. J. Clean. Prod. 2017, 149, 191–205. [Google Scholar] [CrossRef]
- Cai, H.; Chen, Y.; Gong, Q. Polluting Thy Neighbor: Unintended Consequences of China’s Pollution Reduction Mandates. J. Environ. Econ. Manag. 2016, 76, 86–104. [Google Scholar] [CrossRef]
- Tietenberg, T. Disclosure strategies for pollution control. Environ. Resour. Econ. 1998, 11, 587–602. [Google Scholar] [CrossRef]
- Biswas, A.K.; Farzanegan, M.R.; Thum, M. Pollution, Shadow Economy and Corruption: Theory and Evidence. Ecolog. Econ. 2012, 75, 114–125. [Google Scholar] [CrossRef]
- Cheng, X.; Wu, F.; Long, R.; Li, W. Uncovering the Effects of Learning Capacity and Social Interaction on the Experienced Utility of Low-Carbon Lifestyle Guiding Policies. Energy Policy 2021, 154, 112307. [Google Scholar] [CrossRef]
- Yuan, H. Investigating the Nexus Between Environmental Information Disclosure and Green Development Efficiency: The Intermediary Role of Green Technology Innovation—A PSM-DID Analysis. J. Knowl. Econ. 2023, 1–31. [Google Scholar] [CrossRef]
- Zhang, Y.; Wang, J.; Xue, Y.; Yang, J. Impact of Environmental Regulations on Green Technological Innovative Behavior: An Empirical Study in China. J. Clean. Prod. 2018, 188, 763–773. [Google Scholar] [CrossRef]
- Zheng, S.Q.; Wan, G.H.; Sun, W.Z.; Luo, D.L. Public appeal and urban environmental governance. Manag. World 2013, 6, 72–84. [Google Scholar]
- Gao, D.; Wong, C.W.Y.; Lai, K. Development of Ecosystem for Corporate Green Innovation: Resource Dependency Theory Perspective. Sustainability 2023, 15, 5450. [Google Scholar] [CrossRef]
- Zheng, W. A Social Capital Perspective of Innovation from Individuals to Nations: Where Is Empirical Literature Directing Us? Int. J. Manag. Rev. 2010, 12, 151–183. [Google Scholar] [CrossRef]
- Alguezaui, S.; Filieri, R. Investigating the Role of Social Capital in Innovation: Sparse Versus Dense Network. J. Knowl. Manag. 2010, 14, 891–909. [Google Scholar] [CrossRef]
- Feng, S.; Chong, Y.; Yu, H.; Ye, X.; Li, G. Digital Financial Development and Ecological Footprint: Evidence from Green-Biased Technology Innovation and Environmental Inclusion. J. Clean. Prod. 2022, 380, 135069. [Google Scholar] [CrossRef]
- Hale, T.N. Transparency, Accountability, and Global Governance. Glob. Gov. A Rev. Multilater. Int. Organ. 2008, 14, 73–94. [Google Scholar] [CrossRef]
- Friede, G.; Busch, T.; Bassen, A. ESG and Financial Performance: Aggregated Evidence from More than 2000 Empirical Studies. J. Sustain. Financ. Investig. 2015, 5, 210–233. [Google Scholar] [CrossRef]
- Shanaev, S.; Ghimire, B. When ESG Meets AAA: The Effect of ESG Rating Changes on Stock Returns. Financ. Res. Lett. 2022, 46, 102302. [Google Scholar] [CrossRef]
- Oprean-Stan, C.; Oncioiu, I.; Iuga, I.C.; Stan, S. Impact of Sustainability Reporting and Inadequate Management of ESG Factors on Corporate Performance and Sustainable Growth. Sustainability 2020, 12, 8536. [Google Scholar] [CrossRef]
- He, F.; Ding, C.; Yue, W.; Liu, G. ESG Performance and Corporate Risk-Taking: Evidence from China. Int. Rev. Financ. Anal. 2023, 87, 102550. [Google Scholar] [CrossRef]
- Reber, B.; Gold, A.; Gold, S. ESG Disclosure and Idiosyncratic Risk in Initial Public Offerings. J. Bus. Ethic 2022, 179, 867–886. [Google Scholar] [CrossRef]
- Fu, C.; Yu, C.; Guo, M.; Zhang, L. ESG Rating and Financial Risk of Mining Industry Companies. Resour. Pol. 2024, 88, 104308. [Google Scholar] [CrossRef]
- van Duuren, E.; Plantinga, A.; Scholtens, B. ESG Integration and the Investment Management Process: Fundamental Investing Reinvented. J. Bus. Ethic 2016, 138, 525–533. [Google Scholar] [CrossRef]
- Kao, F.C. How Do ESG Activities Affect Corporate Performance? Manag. Decis. Econ. 2023, 44, 4099–4116. [Google Scholar] [CrossRef]
- Li, J.; Xu, X. Can ESG Rating Reduce Corporate Carbon Emissions?–An Empirical Study from Chinese Listed Companies. J. Clean. Prod. 2024, 434, 140226. [Google Scholar] [CrossRef]
- Nguyen, V.H.; Agbola, F.W.; Choi, B. Does Corporate Social Responsibility Reduce Information Asymmetry? Empirical Evidence from Australia. Aust. J. Manag. 2019, 44, 188–211. [Google Scholar] [CrossRef]
- Cui, J.; Jo, H.; Na, H. Does corporate social responsibility reduce information asymmetry. J. Bank. Financ. 2012, 5206, 1–43. [Google Scholar]
- Guo, Y.; Xia, X.; Zhang, S.; Zhang, D. Environmental Regulation, Government R&D Funding and Green Technology Innovation: Evidence from China Provincial Data. Sustainability 2018, 10, 940. [Google Scholar] [CrossRef]
- Du, K.; Cheng, Y.; Yao, X. Environmental Regulation, Green Technology Innovation, and Industrial Structure Upgrading: The Road to the Green Transformation of Chinese Cities. Energy Econ. 2021, 98, 105247. [Google Scholar] [CrossRef]
- Zhang, J.; Ouyang, Y.; Ballesteros-Pérez, P.; Li, H.; Philbin, S.P.; Li, Z.; Skitmore, M. Understanding the Impact of Environmental Regulations on Green Technology Innovation Efficiency in the Construction Industry. Sustain. Cities Soc. 2021, 65, 102647. [Google Scholar] [CrossRef]
- Zhang, W.; Li, G. Environmental Decentralization, Environmental Protection Investment, and Green Technology Innovation. Environ. Sci. Pollut. Res. 2022, 29, 12740–12755. [Google Scholar] [CrossRef]
- Shen, F.; Liu, B.; Luo, F.; Wu, C.; Chen, H.; Wei, W. The Effect of Economic Growth Target Constraints on Green Technology Innovation. J. Environ. Manag. 2021, 292, 112765. [Google Scholar] [CrossRef]
- Lee, C.-C.; Qin, S.; Li, Y. Does Industrial Robot Application Promote Green Technology Innovation in the Manufacturing Industry? Technol. Forecast. Soc. 2022, 183, 121893. [Google Scholar] [CrossRef]
- Sahoo, S.; Kumar, A.; Upadhyay, A. How Do Green Knowledge Management and Green Technology Innovation Impact Corporate Environmental Performance? Understanding the Role of Green Knowledge Acquisition. Bus. Strategy Environ. 2023, 32, 551–569. [Google Scholar] [CrossRef]
- Lv, C.; Shao, C.; Lee, C.-C. Green Technology Innovation and Financial Development: Do Environmental Regulation and Innovation Output Matter? Energy Econ. 2021, 98, 105237. [Google Scholar] [CrossRef]
- Li, G.; Xue, Q.; Qin, J. Environmental Information Disclosure and Green Technology Innovation: EMPIRICAL Evidence from China. Technol. Forecast. Soc. 2022, 176, 121453. [Google Scholar] [CrossRef]
- Li, Z.; Huang, Z.; Su, Y. New Media Environment, Environmental Regulation and Corporate Green Technology Innovation: Evidence from China. Energy Econ. 2023, 119, 106545. [Google Scholar] [CrossRef]
- Suchman, M.C. Managing Legitimacy: Strategic and Institutional Approaches. Acad. Manag. Rev. 1995, 20, 571. [Google Scholar] [CrossRef]
- Deegan, C.M. Legitimacy Theory. AAAJ 2019, 32, 2307–2329, ahead-of-print. [Google Scholar] [CrossRef]
- O’Donovan, G. Environmental Disclosures in the Annual Report. Account. Audit. Account. J. 2002, 15, 344–371. [Google Scholar] [CrossRef]
- Tajfel, H. An Integrative Theory of Intergroup Conflict. In The Social Psychology of Intergroup Relations; Brooks/Cole: Monterey, CA, USA, 1979. [Google Scholar]
- Hogg, M.A.; Reid, S.A. Social Identity, Self-Categorization, and the Communication of Group Norms. Commun. Theory 2006, 16, 7–30. [Google Scholar] [CrossRef]
- Al Amosh, H. From Home to Boardroom: MARITAL Status and its Influence on ESG Disclosure. Bus. Strat. Dev. 2024, 7, e402. [Google Scholar] [CrossRef]
- Song, W.; Yu, H. Green Innovation Strategy and Green Innovation: The Roles of Green Creativity and Green Organizational Identity. Corp. Soc. Responsib. Environ. 2018, 25, 135–150. [Google Scholar] [CrossRef]
- Liu, X. Substantial Innovation or Strategic Innovation: The Influence of ESG Performance on Corporate Innovation Strategy. In Proceedings of the SHS Web of Conferences; EDP Sciences: Les Ulis, France, 2023; Volume 169, p. 01063. [Google Scholar]
- Nie, L.; Gong, H.; Lai, X. Green Research Intensity and Diversified Performance: The Moderating Role of Environmental Regulation. EJIM 2024, 27, 447–473. [Google Scholar] [CrossRef]
- Florea, L.; Cheung, Y.H.; Herndon, N.C. For All Good Reasons: Role of Values in Organizational Sustainability. J. Bus. Ethic 2013, 114, 393–408. [Google Scholar] [CrossRef]
- Zhang, Y. From Courts to Markets: On the Effect of Judicial Efficiency on Financial Markets Development. Appl. Econ. Lett. 2024, 1–5. [Google Scholar] [CrossRef]
- Ko, K.-C.; Nie, J.; Ran, R.; Gu, Y. Corporate Social Responsibility, Social Identity, and Innovation Performance in China. Pac. Basin Financ. J. 2020, 63, 101415. [Google Scholar] [CrossRef]
- Guariglia, A.; Liu, P. To What Extent Do Financing Constraints Affect Chinese Firms’ Innovation Activities? Int. Rev. Financ. Anal. 2014, 36, 223–240. [Google Scholar] [CrossRef]
- Junior, R.M.; Best, P.J.; Cotter, J. Sustainability Reporting and Assurance: A Historical Analysis on a World-Wide Phenomenon. J. Bus. Ethics 2014, 120, 1–11. [Google Scholar] [CrossRef]
- Diouf, D.; Boiral, O. The Quality of Sustainability Reports and IMPRESSION management. AAAJ 2017, 30, 643–667. [Google Scholar] [CrossRef]
- The ESG Mirage-Bloomberg. Available online: https://www.bloomberg.com/news/audio/2021-12-10/the-esg-mirage-podcast (accessed on 14 August 2024).
- Delgado-Ceballos, J.; Ortiz-De-Mandojana, N.; Antolín-López, R.; Montiel, I. Connecting the Sustainable Development Goals to Firm-Level Sustainability and ESG Factors: The Need for Double Materiality. BRQ Bus. Res. Q. 2023, 26, 2–10. [Google Scholar] [CrossRef]
- Madison, N.; Schiehll, E. The Effect of Financial Materiality on ESG Performance Assessment. Sustainability 2021, 13, 3652. [Google Scholar] [CrossRef]
- Lockett, A.; Thompson, S.; Morgenstern, U. The Development of the Resource-Based View of the Firm: A Critical Appraisal. Int. J. Manag. Rev. 2009, 11, 9–28. [Google Scholar] [CrossRef]
- Schaltegger, S.; Hörisch, J.; Freeman, R.E. Business Cases for Sustainability: A Stakeholder Theory Perspective. Organ. Environ. 2019, 32, 191–212. [Google Scholar] [CrossRef]
- Maijoor, S. The Internal Control Explosion. Int. J. Audit. 2000, 4, 101–109. [Google Scholar] [CrossRef]
- Jones, C.I.; Williams, J.C. Measuring the Social Return to R&D. Quart. J. Econ. 1998, 113, 1119–1135. [Google Scholar] [CrossRef]
- Lee, K.-H.; Min, B. Green R&D for Eco-Innovation and its Impact on Carbon Emissions and Firm Performance. J. Clean. Prod. 2015, 108, 534–542. [Google Scholar] [CrossRef]
- FAMA, E.F.; FRENCH, K.R. The Cross-Section of Expected Stock Returns. J. Financ. 1992, 47, 427–465. [Google Scholar] [CrossRef]
- Demirgüç-Kunt, A.; Huizinga, H. Bank Activity and Funding Strategies: The Impact on Risk and Returns. J. Financ. Econ. 2010, 98, 626–650. [Google Scholar] [CrossRef]
- Jiang, G.; Wang, H. Should Earnings Thresholds Be Used as Delisting Criteria in Stock Market? J. Account. Public Policy 2008, 27, 409–419. [Google Scholar] [CrossRef]
- Hall, B.H. Market Value and Patent Citations: A First Look 2000. RAND J. Econ. 2005, 36, 16–38. [Google Scholar]
- Koh, P.-S.; Reeb, D.M. Missing R&D. J. Account. Econ. 2015, 60, 73–94. [Google Scholar] [CrossRef]
- Jiang, L.; Bai, Y.; Jiang, L.; Bai, Y. Strategic or substantive innovation? -The Impact of Institutional Investors’ Site Visits on Green Innovation Evidence from China. Technol. Soc. 2022, 68, 101904. [Google Scholar] [CrossRef]
- Delmas, M.A.; Burbano, V.C. The Drivers of Greenwashing. Calif. Manag. Rev. 2011, 54, 64–87. [Google Scholar] [CrossRef]
- Gatti, L.; Pizzetti, M.; Seele, P. Green Lies and Their Effect on Intention to Invest. J. Bus. Res. 2021, 127, 228–240. [Google Scholar] [CrossRef]
- Wang, J.; Ma, M.; Dong, T.; Zhang, Z. Do ESG Ratings Promote Corporate Green Innovation? A Quasi-Natural Experiment Based on SynTao Green Finance’s ESG Ratings. Int. Rev. Financ. Anal. 2023, 87, 102623. [Google Scholar] [CrossRef]
- Tan, Y.; Zhu, Z.; Tan, Y.; Zhu, Z. The Effect of ESG Rating Events on Corporate Green Innovation in China: The Mediating Role of Financial Constraints and Managers’ Environmental Awareness. Technol. Soc. 2022, 68, 101906. [Google Scholar] [CrossRef]
- Cohen, W.M.; Klepper, S. Firm Size and the Nature of Innovation within Industries: The Case of Process and Product R&D. Rev. Econ. Stat. 1996, 78, 232. [Google Scholar] [CrossRef]
- Chen, Y.; Zhang, J. The Interdependence of Debt and Innovation Sustainability: Evidence from the Onset of Credit Default Swaps. Sustainability 2019, 11, 2946. [Google Scholar] [CrossRef]
- Hansen, J.A. Innovation, Firm Size, and Firm Age. Small Bus. Econ. 1992, 4, 37–44. [Google Scholar] [CrossRef]
- Rubera, G.; Droge, C. Technology versus Design Innovation’s Effects on Sales and Tobin’s Q: The Moderating Role of Branding Strategy. J. Prod. Innov. Manag. 2013, 30, 448–464. [Google Scholar] [CrossRef]
- Eshleman, J.D.; Guo, P. Do Big 4 Auditors Provide Higher Audit Quality after Controlling for the Endogenous Choice of Auditor? Audit. A J. Pract. Theory 2014, 33, 197–219. [Google Scholar] [CrossRef]
- Zhao, J.; Qu, J.; Wei, J.; Yin, H.; Xi, X. The Effects of Institutional Investors on Firms’ GREEN innovation. J. Prod. Innov. Manag. 2023, 40, 195–230. [Google Scholar] [CrossRef]
- Berg, F.; Kölbel, J.F.; Rigobon, R. Aggregate Confusion: The Divergence of ESG Ratings. Rev. Financ. 2022, 26, 1315–1344. [Google Scholar] [CrossRef]
- Avramov, D.; Cheng, S.; Lioui, A.; Tarelli, A.; Avramov, D.; Cheng, S.; Lioui, A.; Tarelli, A. Sustainable investing with ESG rating uncertainty. J. Financ. Econ. 2022, 145, 642–664. [Google Scholar] [CrossRef]
- Santos, A.; Cincera, M. Determinants of Financing Constraints. Small Bus. Econ. 2022, 58, 1427–1439. [Google Scholar] [CrossRef]
- Christensen, D.M.; Serafeim, G.; Sikochi, A. Why is Corporate Virtue in the Eye of The Beholder? The Case of ESG Ratings. Account. Rev. 2022, 97, 147–175. [Google Scholar] [CrossRef]
- Hall, B.H. The Financing of Research and Development. Oxf. Rev. Econ. Policy 2002, 18, 35–51. [Google Scholar] [CrossRef]
- Qian, H. Talent, Creativity and Regional Economic Performance: The Case of China. Ann. Reg. Sci. 2010, 45, 133–156. [Google Scholar] [CrossRef]
- Zhao, S.; Zhang, B.; Shao, D.; Wang, S. Can Top Management Teams’ Academic Experience Promote Green Innovation Output: Evidence from Chinese Enterprises. Sustainability 2021, 13, 11453. [Google Scholar] [CrossRef]
- Ge, G.; Xiao, X.; Li, Z.; Dai, Q. Does ESG Performance Promote High-Quality Development of Enterprises in China? The Mediating Role of Innovation Input. Sustainability 2022, 14, 3843. [Google Scholar] [CrossRef]

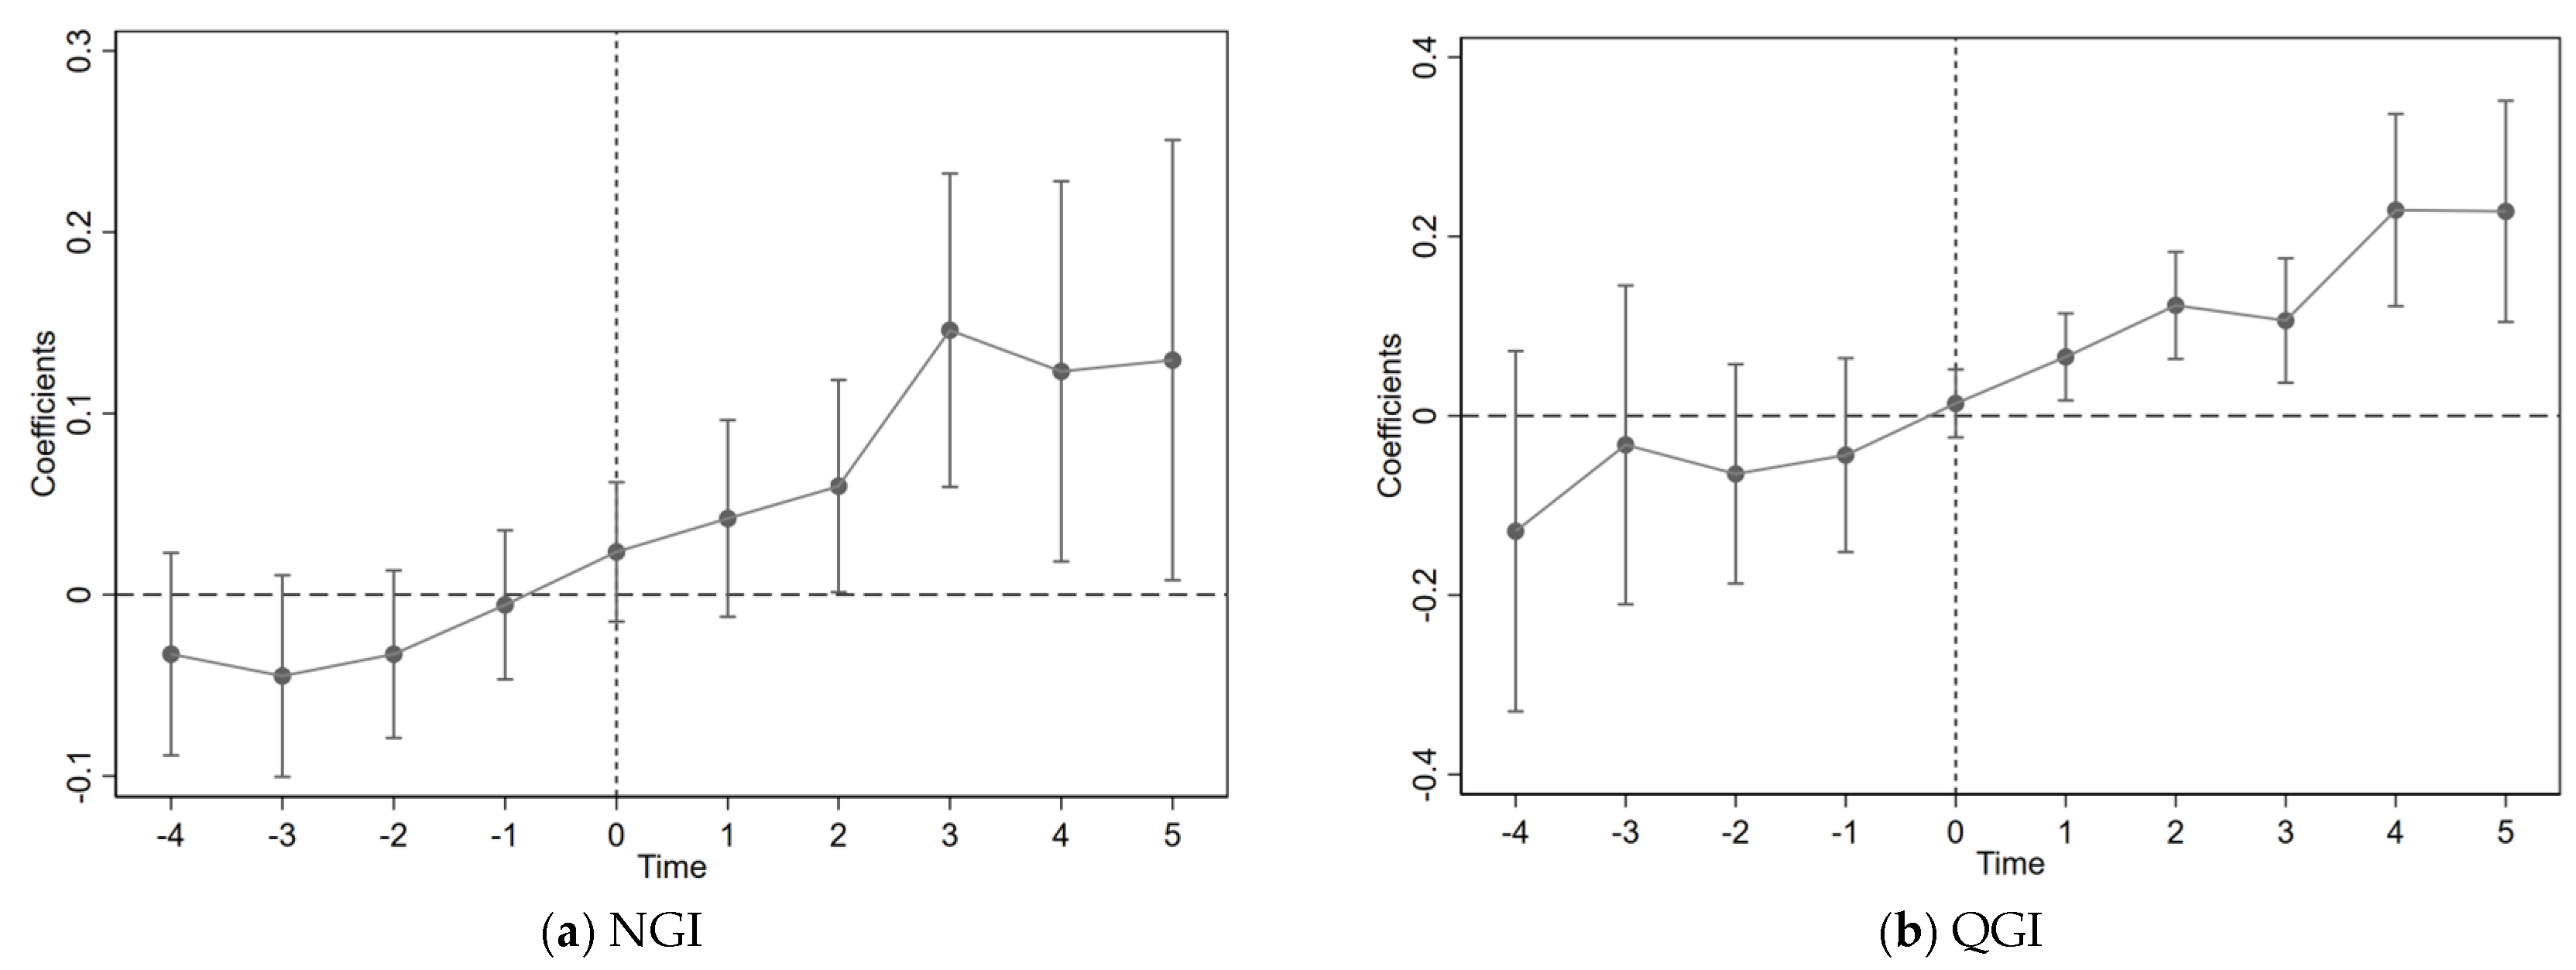
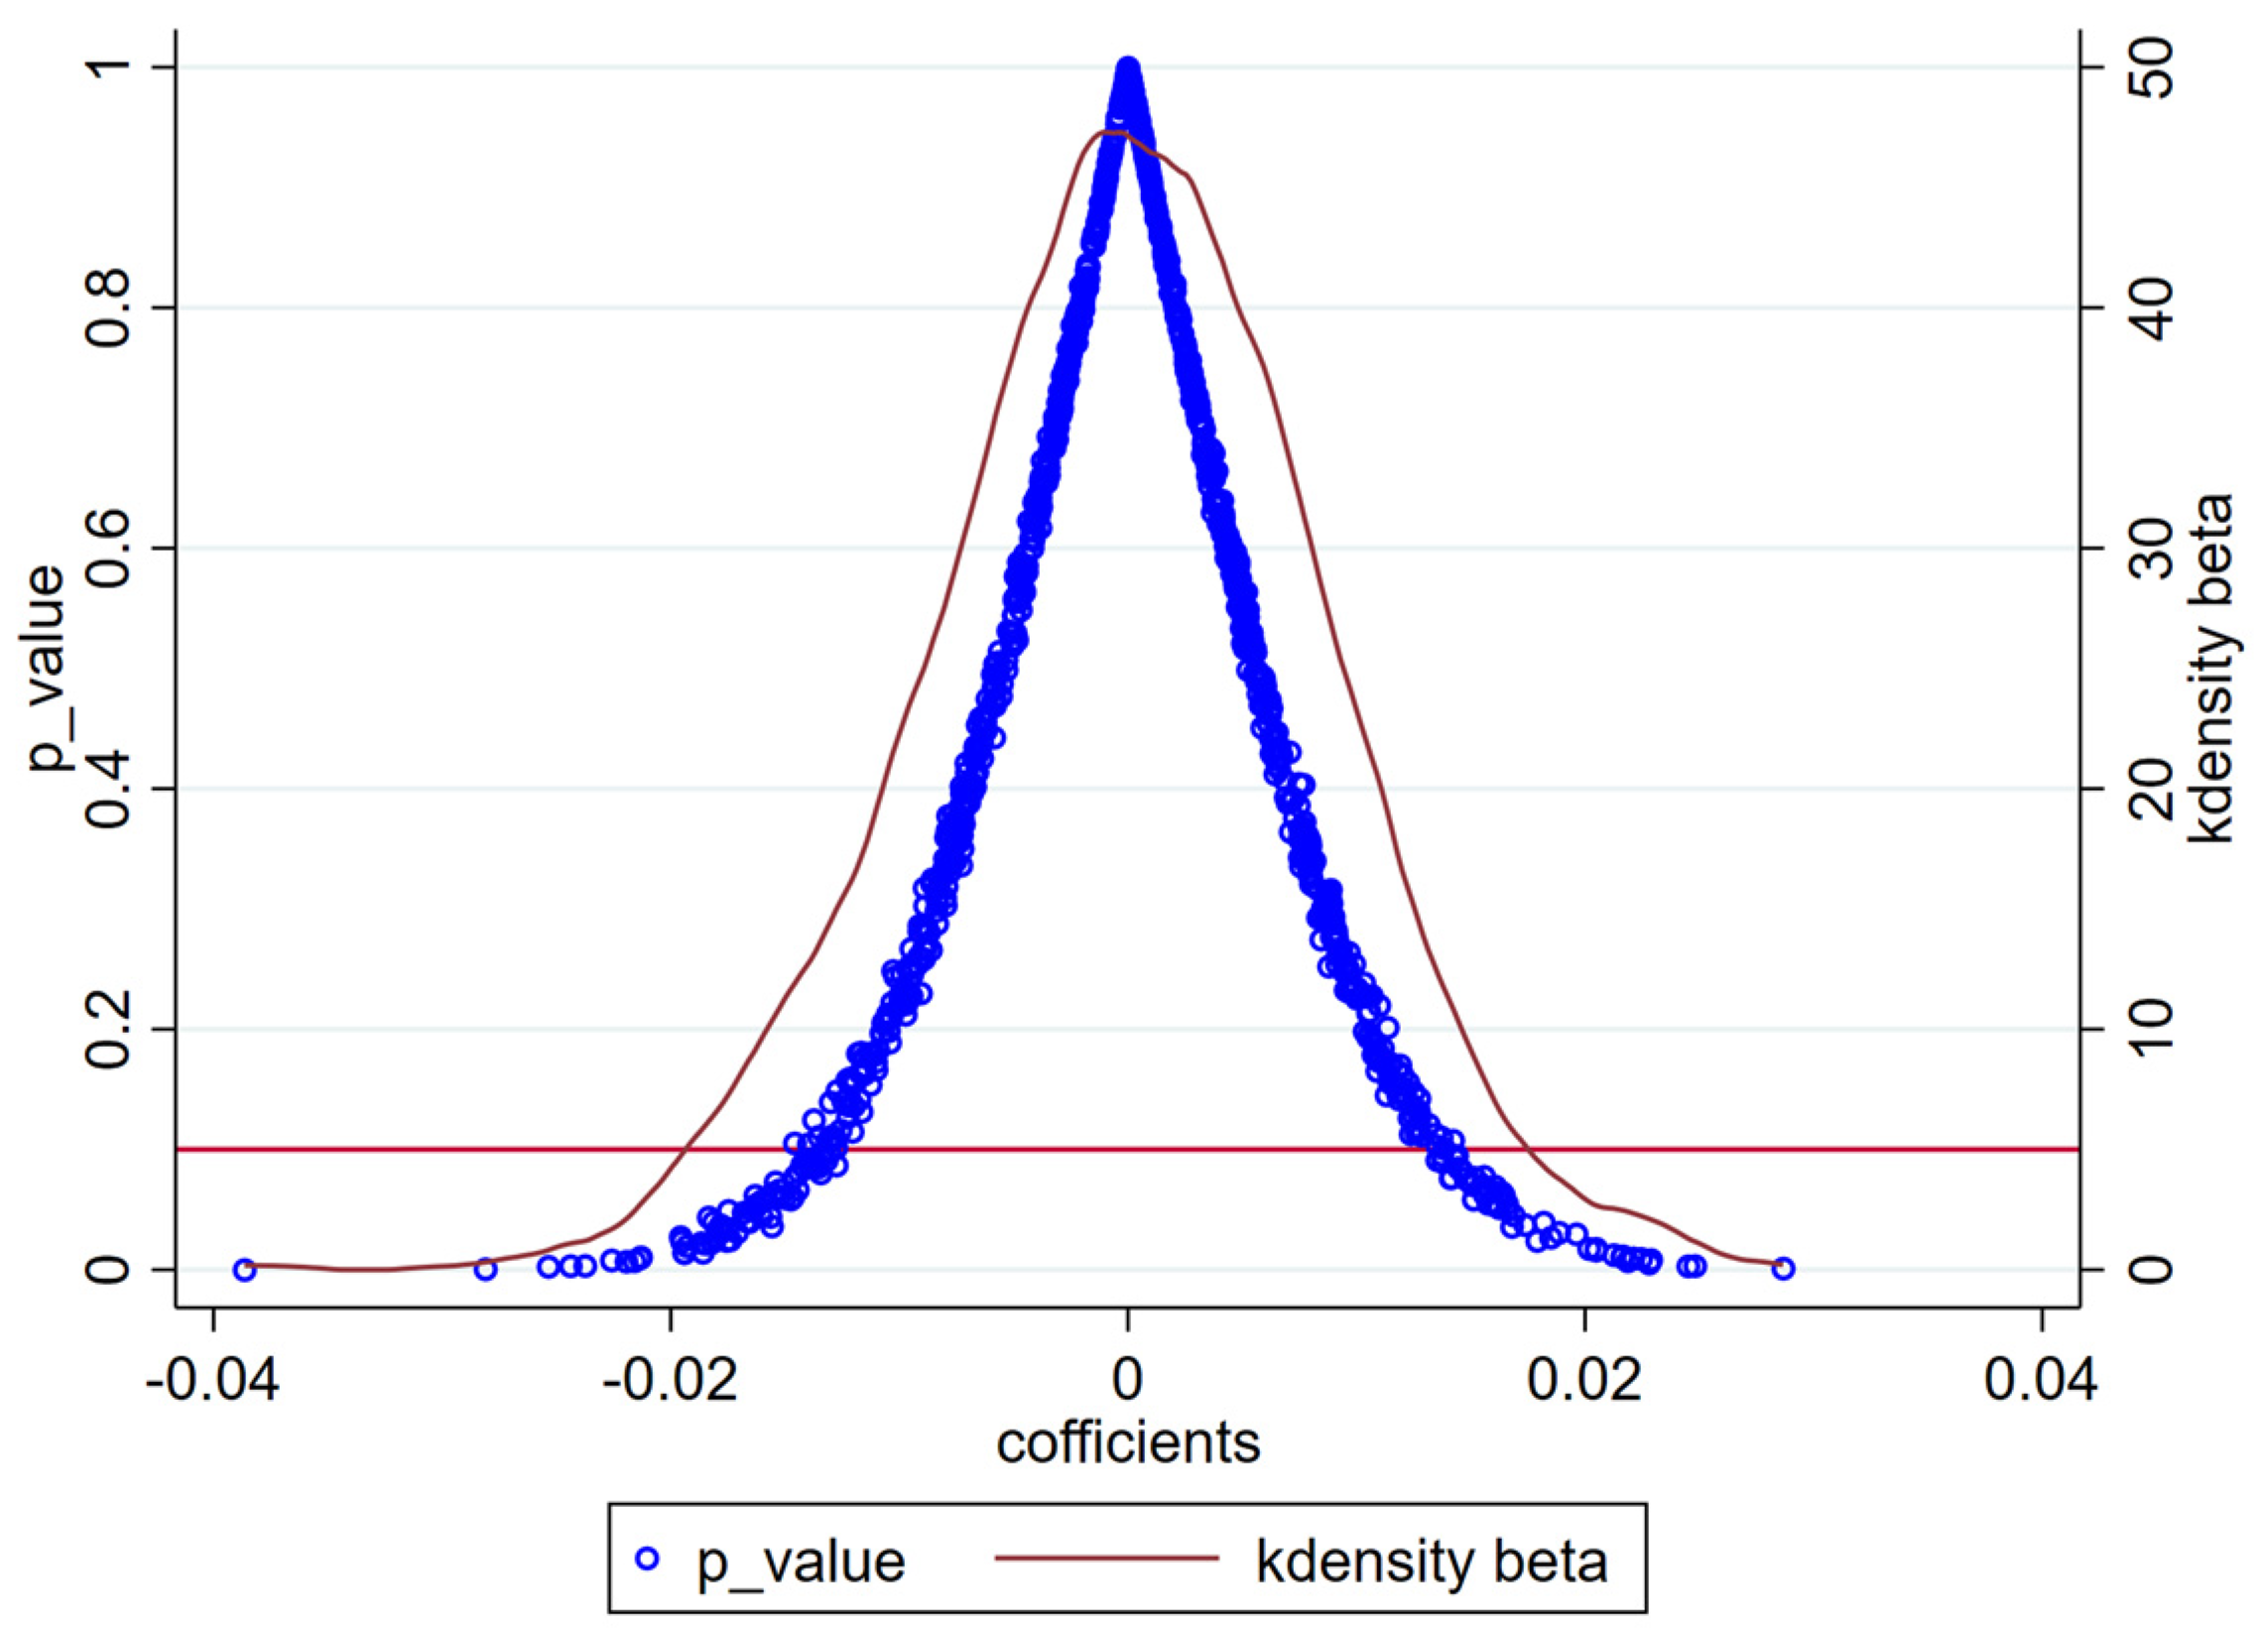
Disclaimer/Publisher’s Note: The statements, opinions and data contained in all publications are solely those of the individual author(s) and contributor(s) and not of MDPI and/or the editor(s). MDPI and/or the editor(s) disclaim responsibility for any injury to people or property resulting from any ideas, methods, instructions or products referred to in the content. |
© 2024 by the authors. Licensee MDPI, Basel, Switzerland. This article is an open access article distributed under the terms and conditions of the Creative Commons Attribution (CC BY) license (https://creativecommons.org/licenses/by/4.0/).