
Building the Bridge: How System Dynamics Models Operationalise Energy Transitions and Contribute towards Creating an Energy Policy Toolbox

 ,
,  and
and
Abstract
1. Introduction
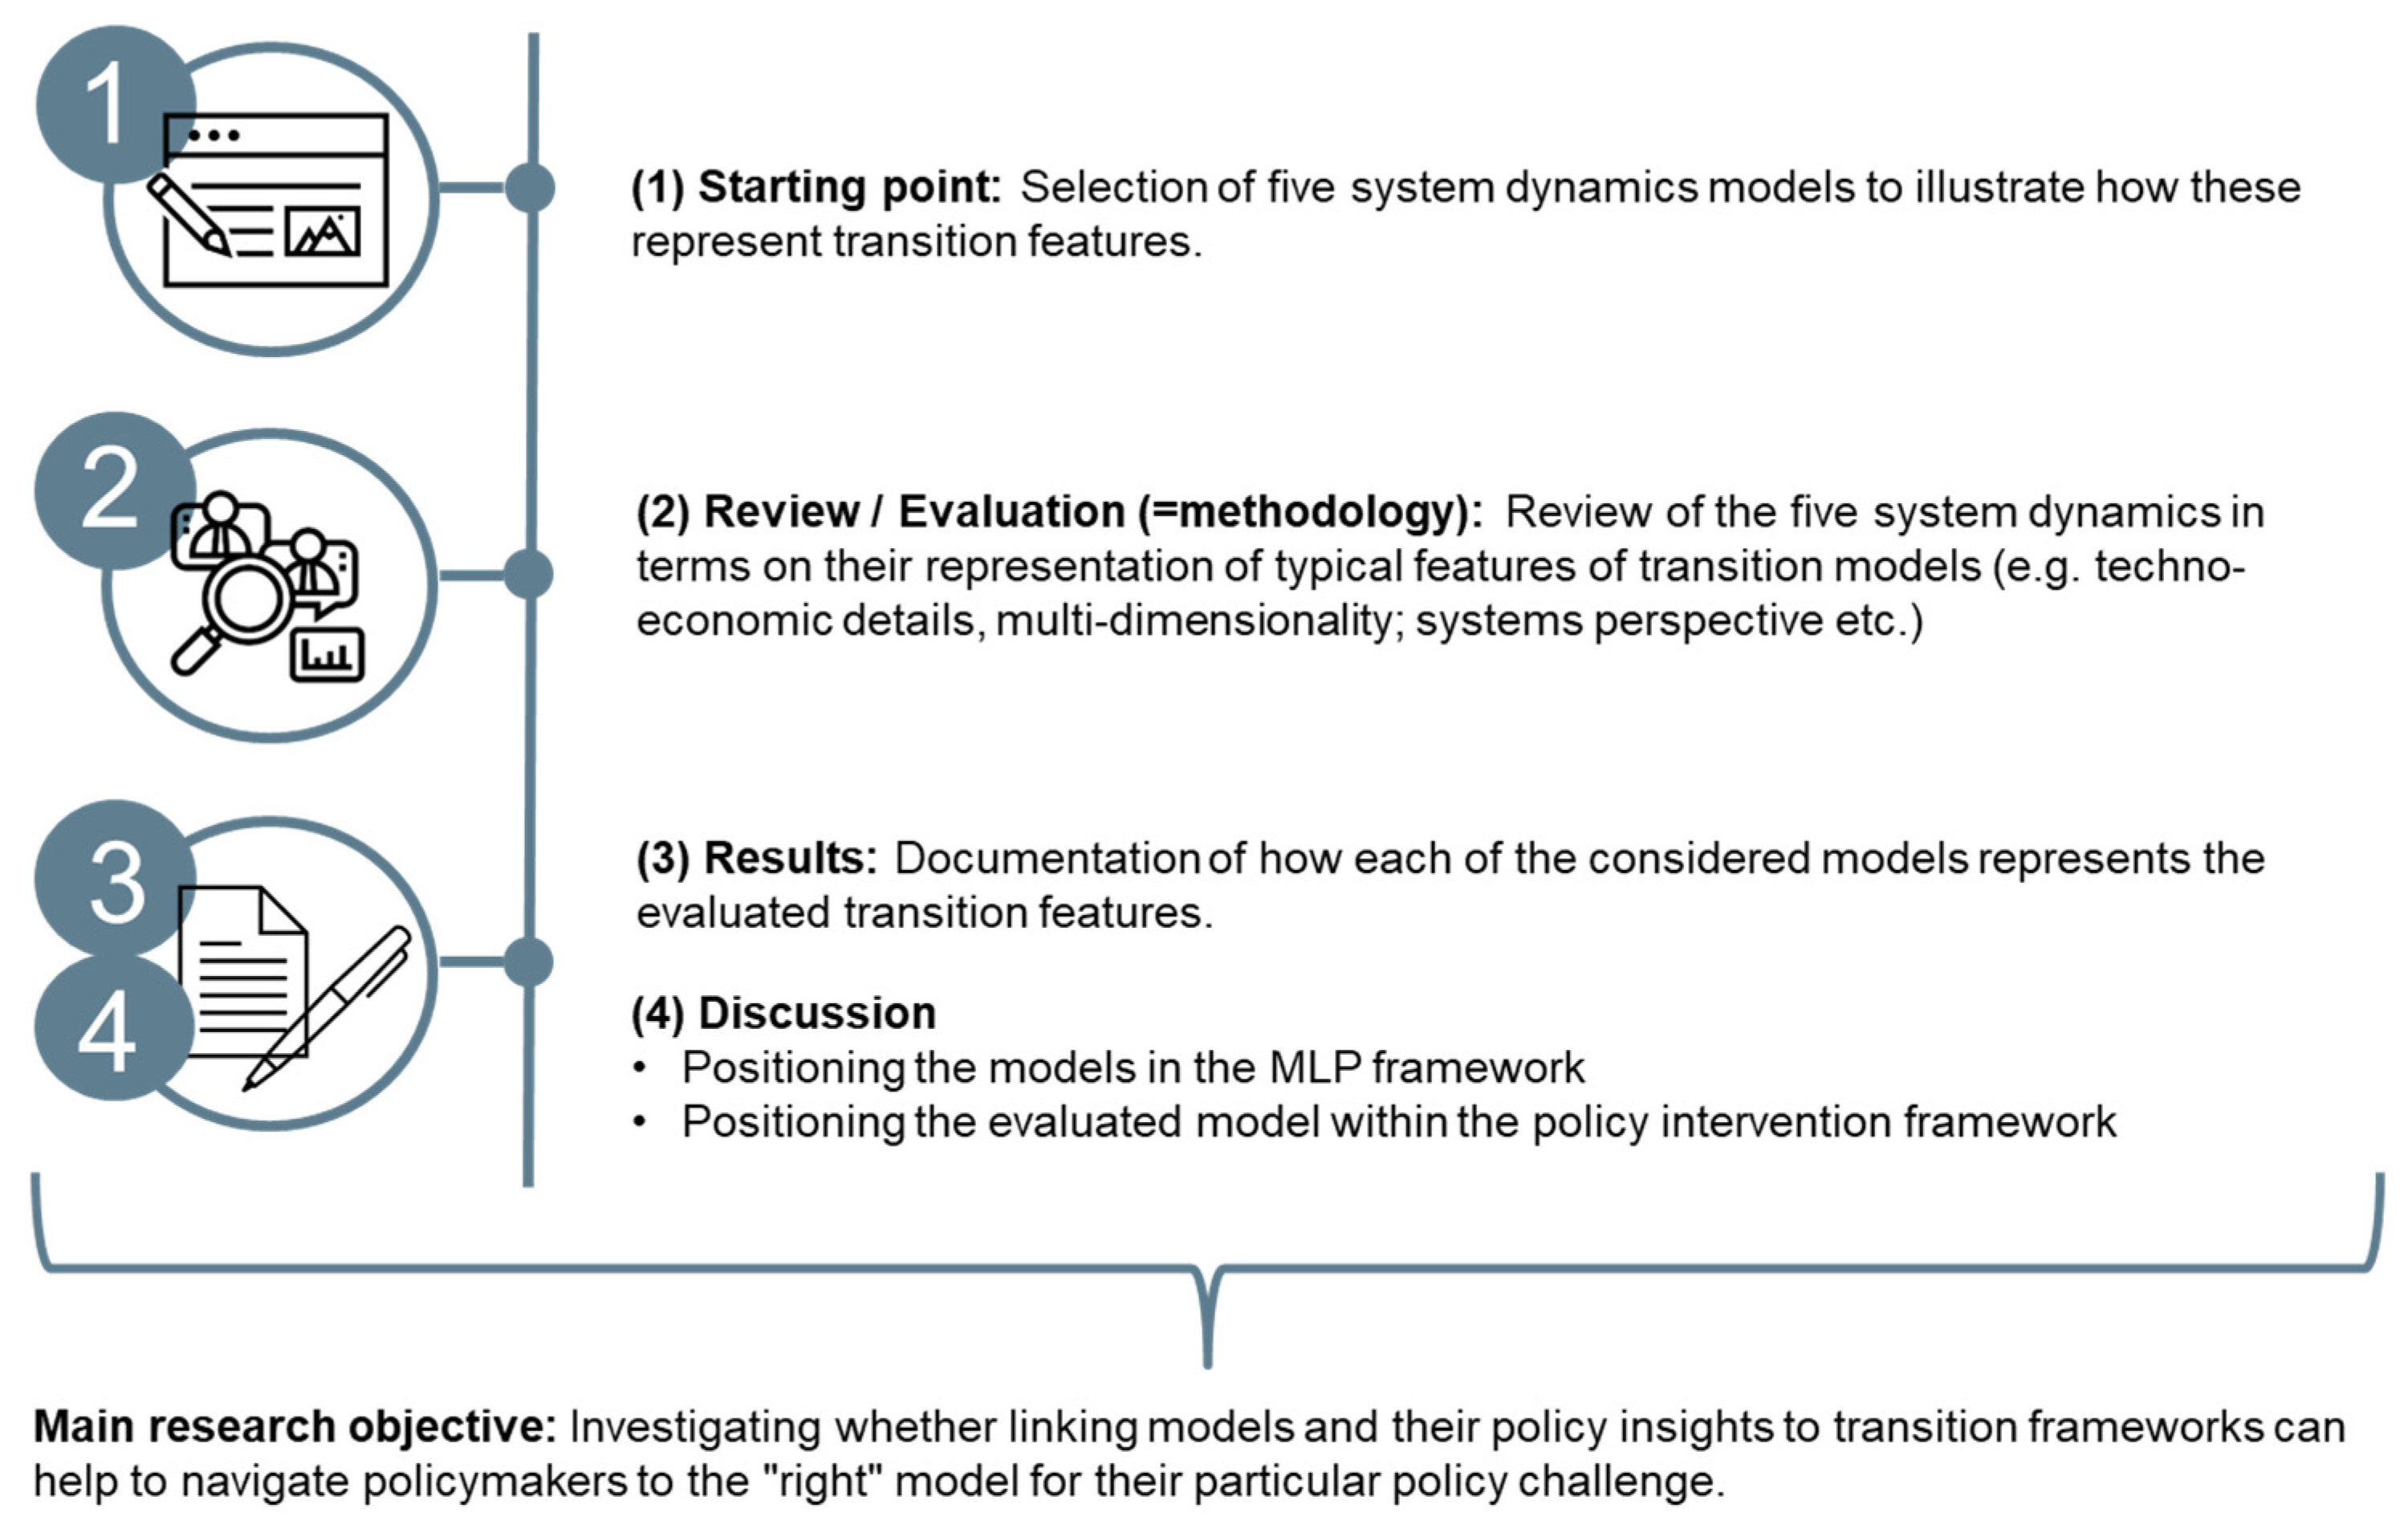
- Which typical transition characteristics (e.g., path dependency) are captured by the five evaluated SD energy transition models? Which characteristics are excluded?
- Can theoretical frameworks from the sustainability transition research strand serve as an overarching framework to organise and position existing SD models with their gained policy insights to support modellers and non-modellers (e.g., policy makers) in navigating to the “right” model for a specific purposes?
2. Background
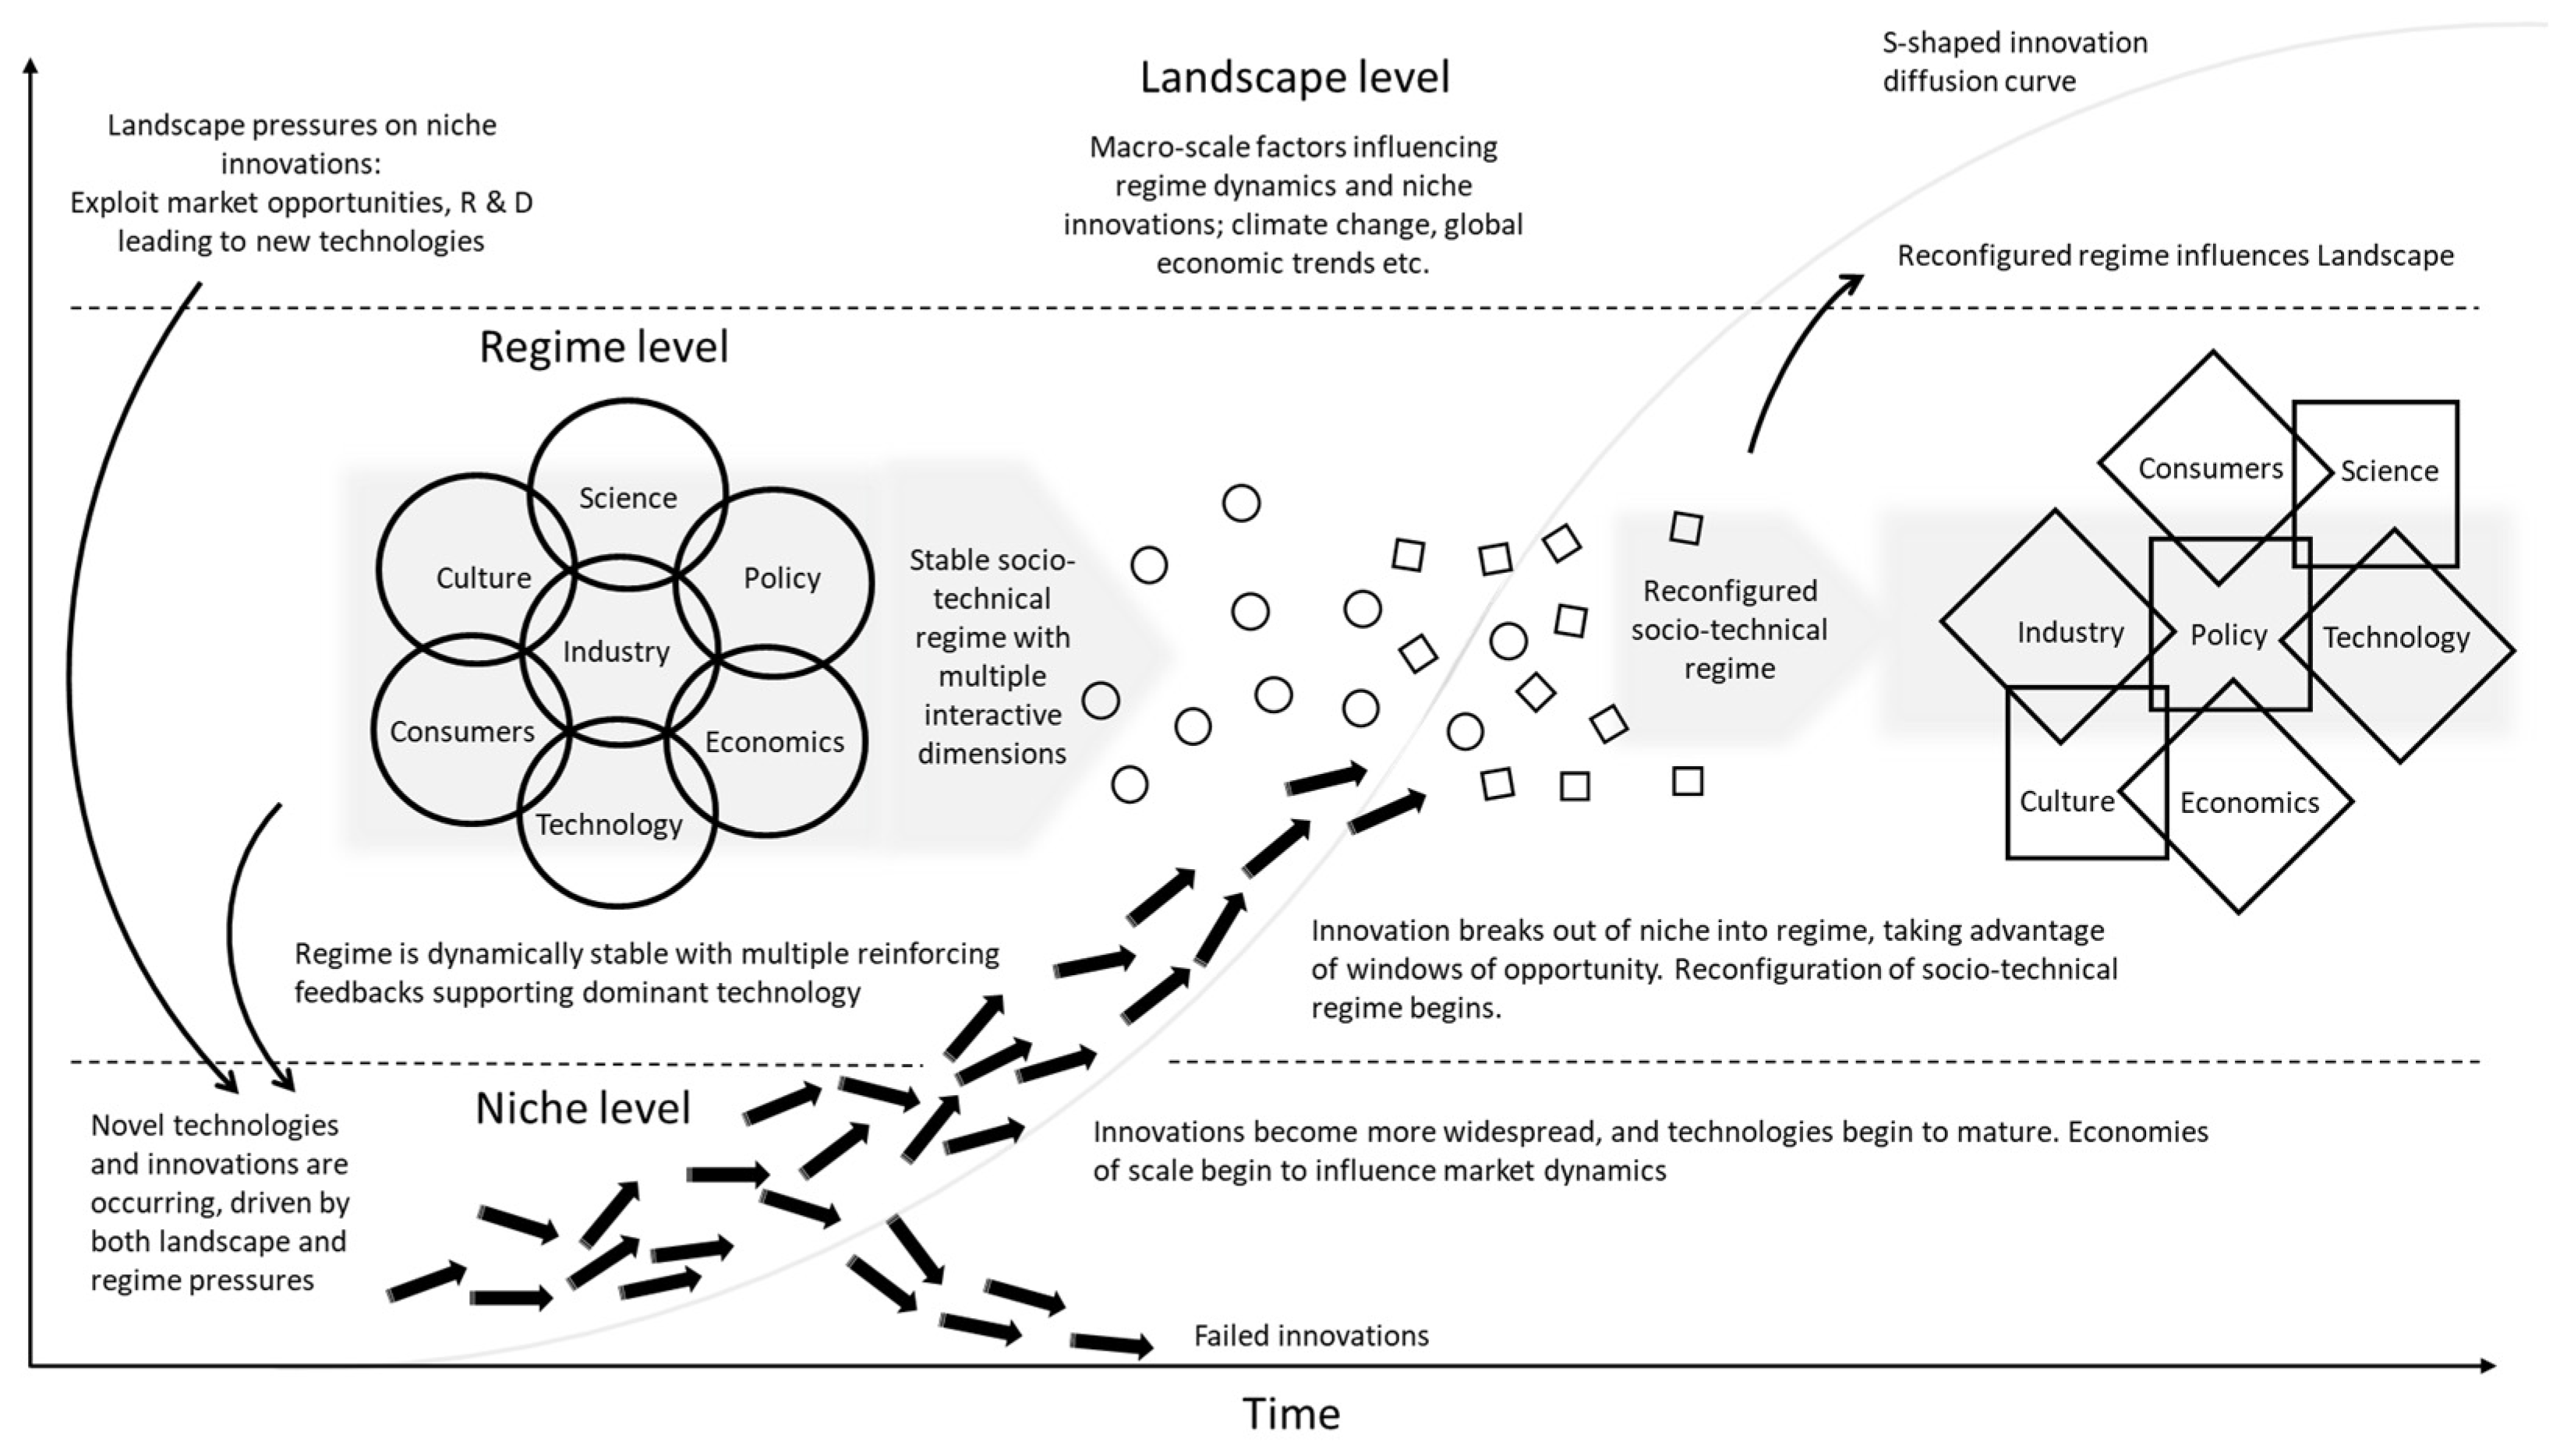
2.1. The Multi-Level Perspective
2.2. Features of Socio-Technical Sustainability Transition Models
2.3. A Policy Intervention Framework for Transformative Change
2.4. System Dynamics Modelling
3. Methods
3.1. Research Approach
3.2. Model Sample
4. Results and Discussion
4.1. Model Reivew
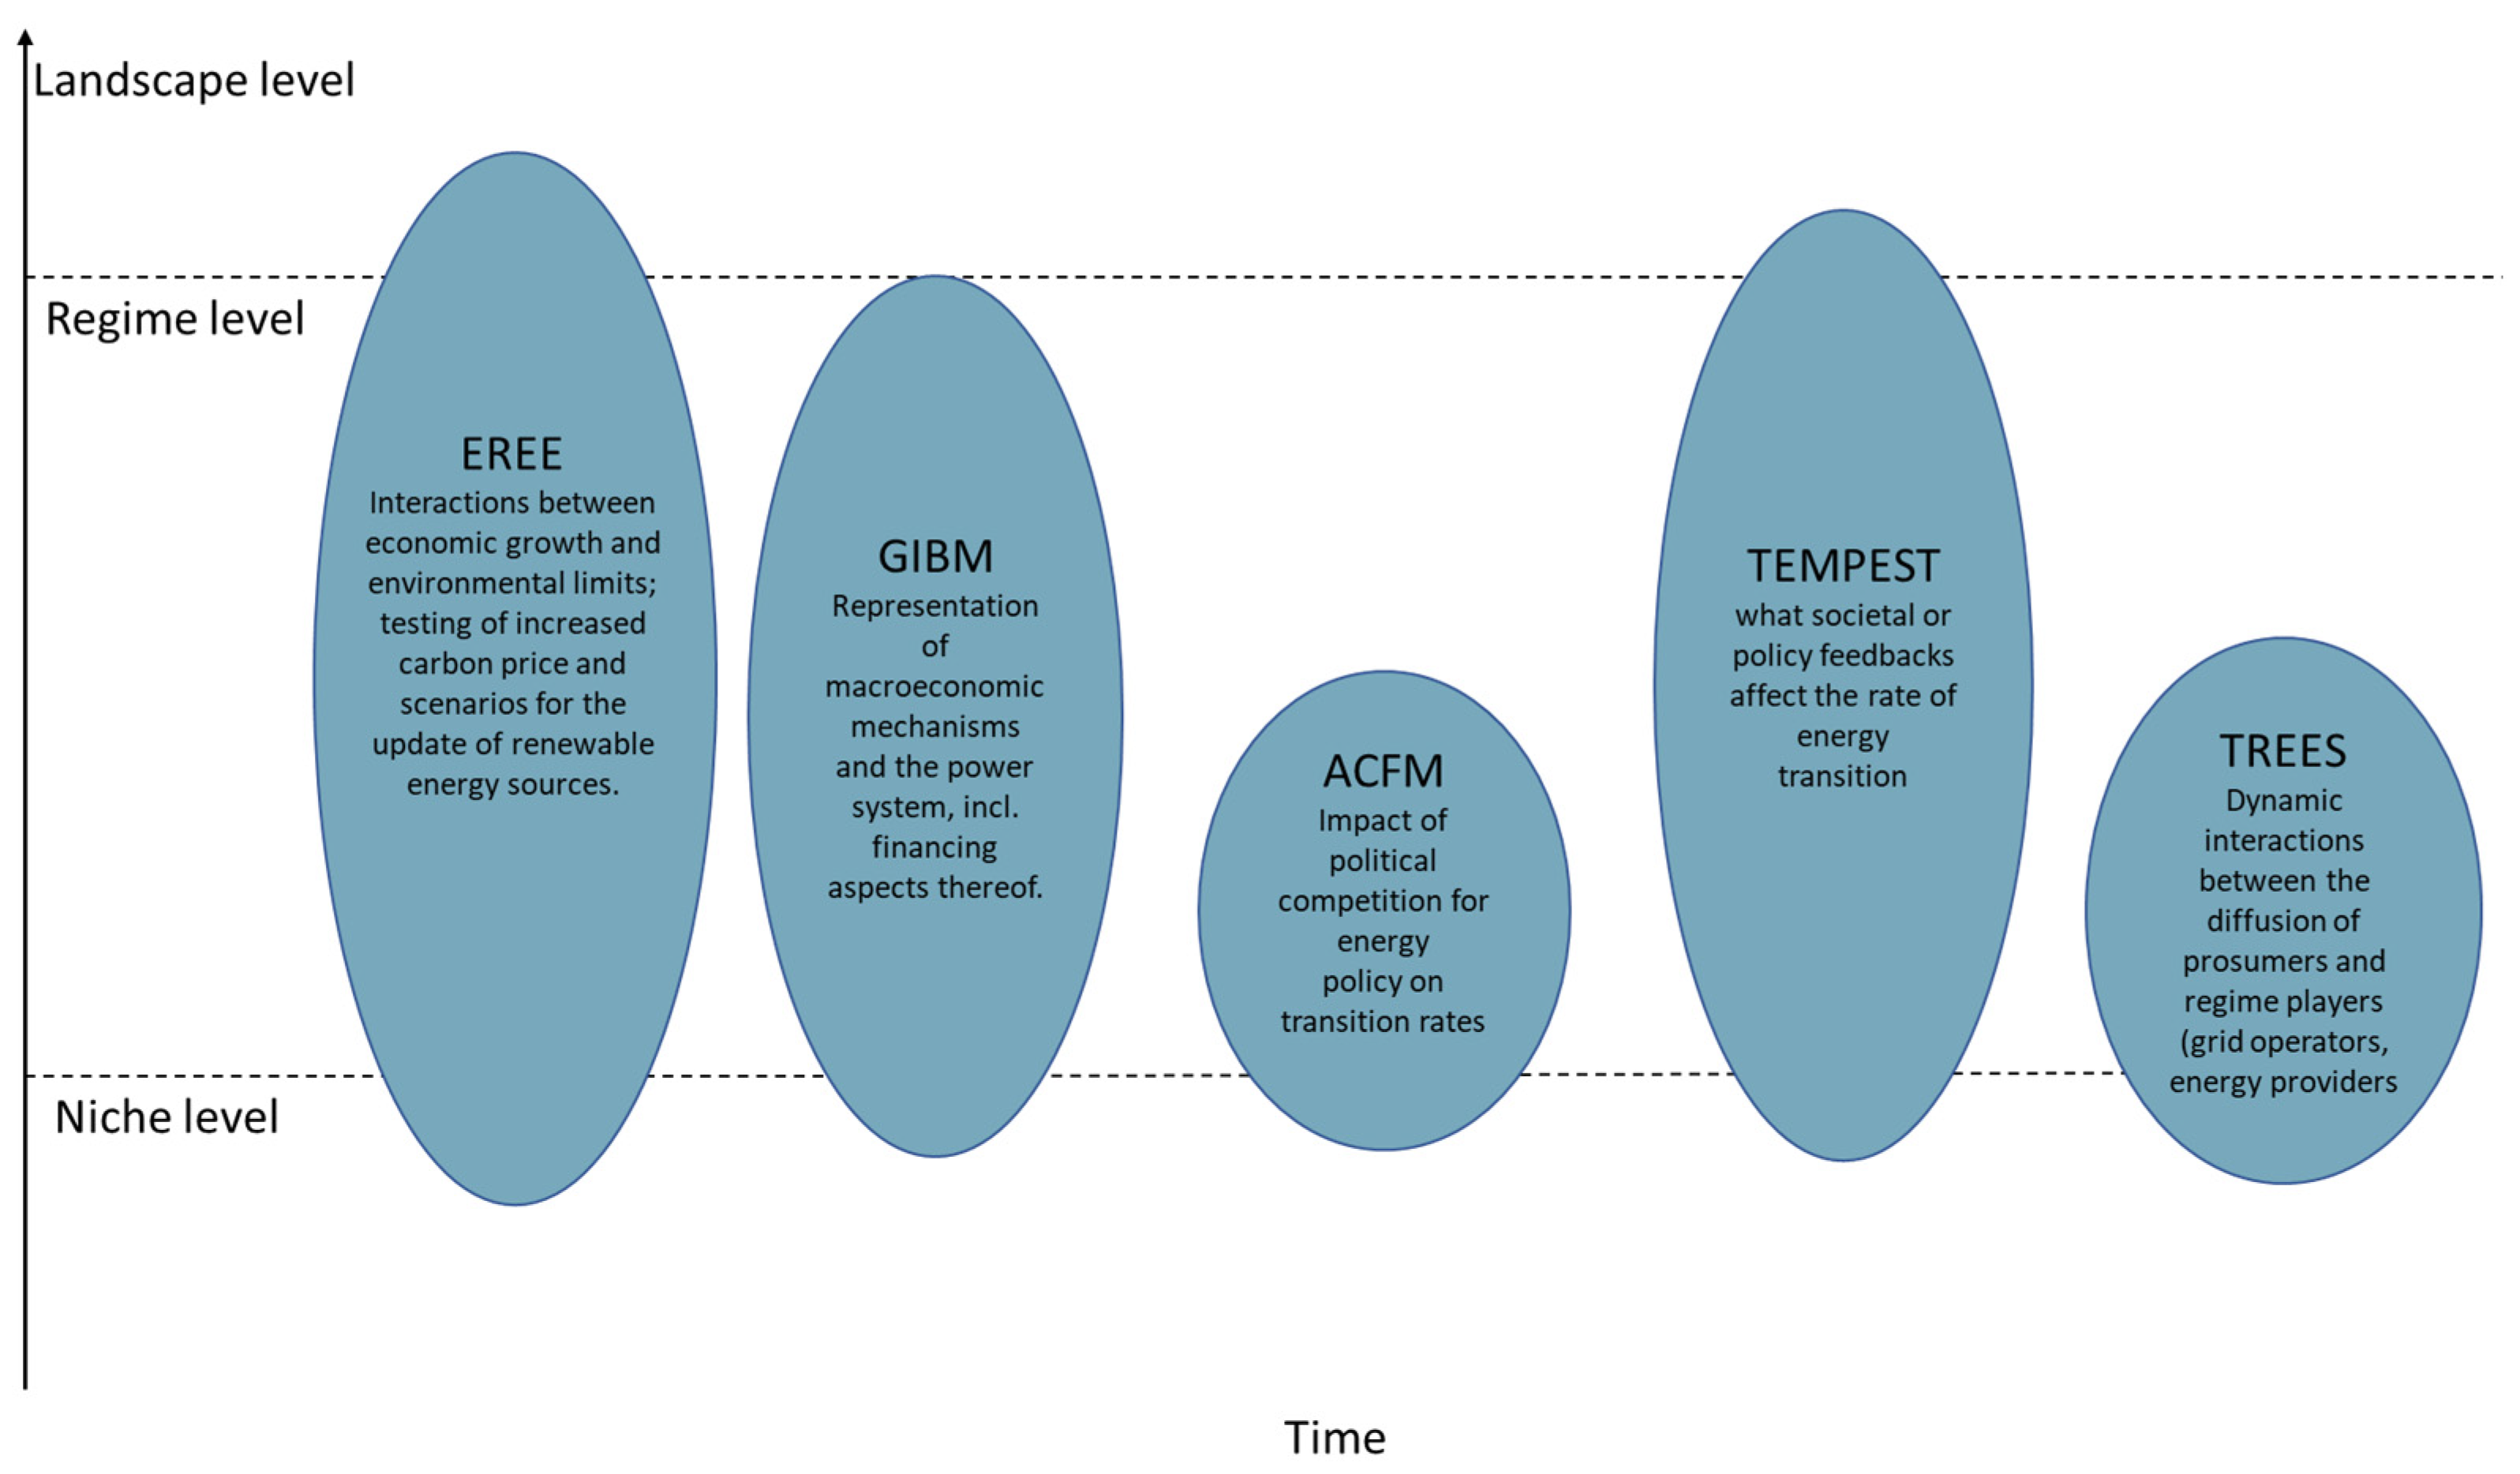
4.2. Linking the Model to the Multi-Level Perspective Framework
4.3. Linking the Policy Insights of the Reviewed Models to the Policy Intervention Points Framework
5. Conclusions
Future Research
- Relating policy interventions to results and insights: The introduced toolbox (MLP framework, policy intervention framework by [17] links policy targets to policy interventions and models. However, policy makers are not only interested in policy interventions and models, but also in understanding the related policy implications and effectiveness. Therefore, we suggest that future research expand the current toolbox with additional dimensions, containing for example information on simulation results and policy effectiveness. Another possibility would be to apply the developed toolbox alongside a modelling platform that shows the results of various models, given specific parameter values and policies. The developed toolbox would allow for the comparison of policy targets across the included models. We highlight that this expansion should occur in conjunction with the increased effort to ensure model comparability, including transparency on the policy impact of models’ assumptions and analytical frameworks [57,58].
- Policy recommendations and tools for specific actors: The transition of current high-carbon energy systems towards net zero emissions systems are governed by many different actors, including but not limited to governments and authorities at different levels, businesses, influencers or non-profit organisations. The development of actor-specific policy toolboxes would help to equip all relevant actors with tools to successfully achieve their actor-specific targets. In addition, we recommend a general overview that informs what energy governance aspects are covered or targeted by which actors, thus identifying exploitable synergies across actors.
- Generalisation of the suitability of policy interventions and model results: Energy models often differ with respect to aggregation level, regional scope, time scale and audience. For this reason, it is relevant to investigate under which conditions transferring the policy recommendations derived from one model can be transferred to other policy questions, possibly situated in a different context and time horizon.
Author Contributions
Funding
Institutional Review Board Statement
Informed Consent Statement
Data Availability Statement
Acknowledgments
Conflicts of Interest
Appendix A
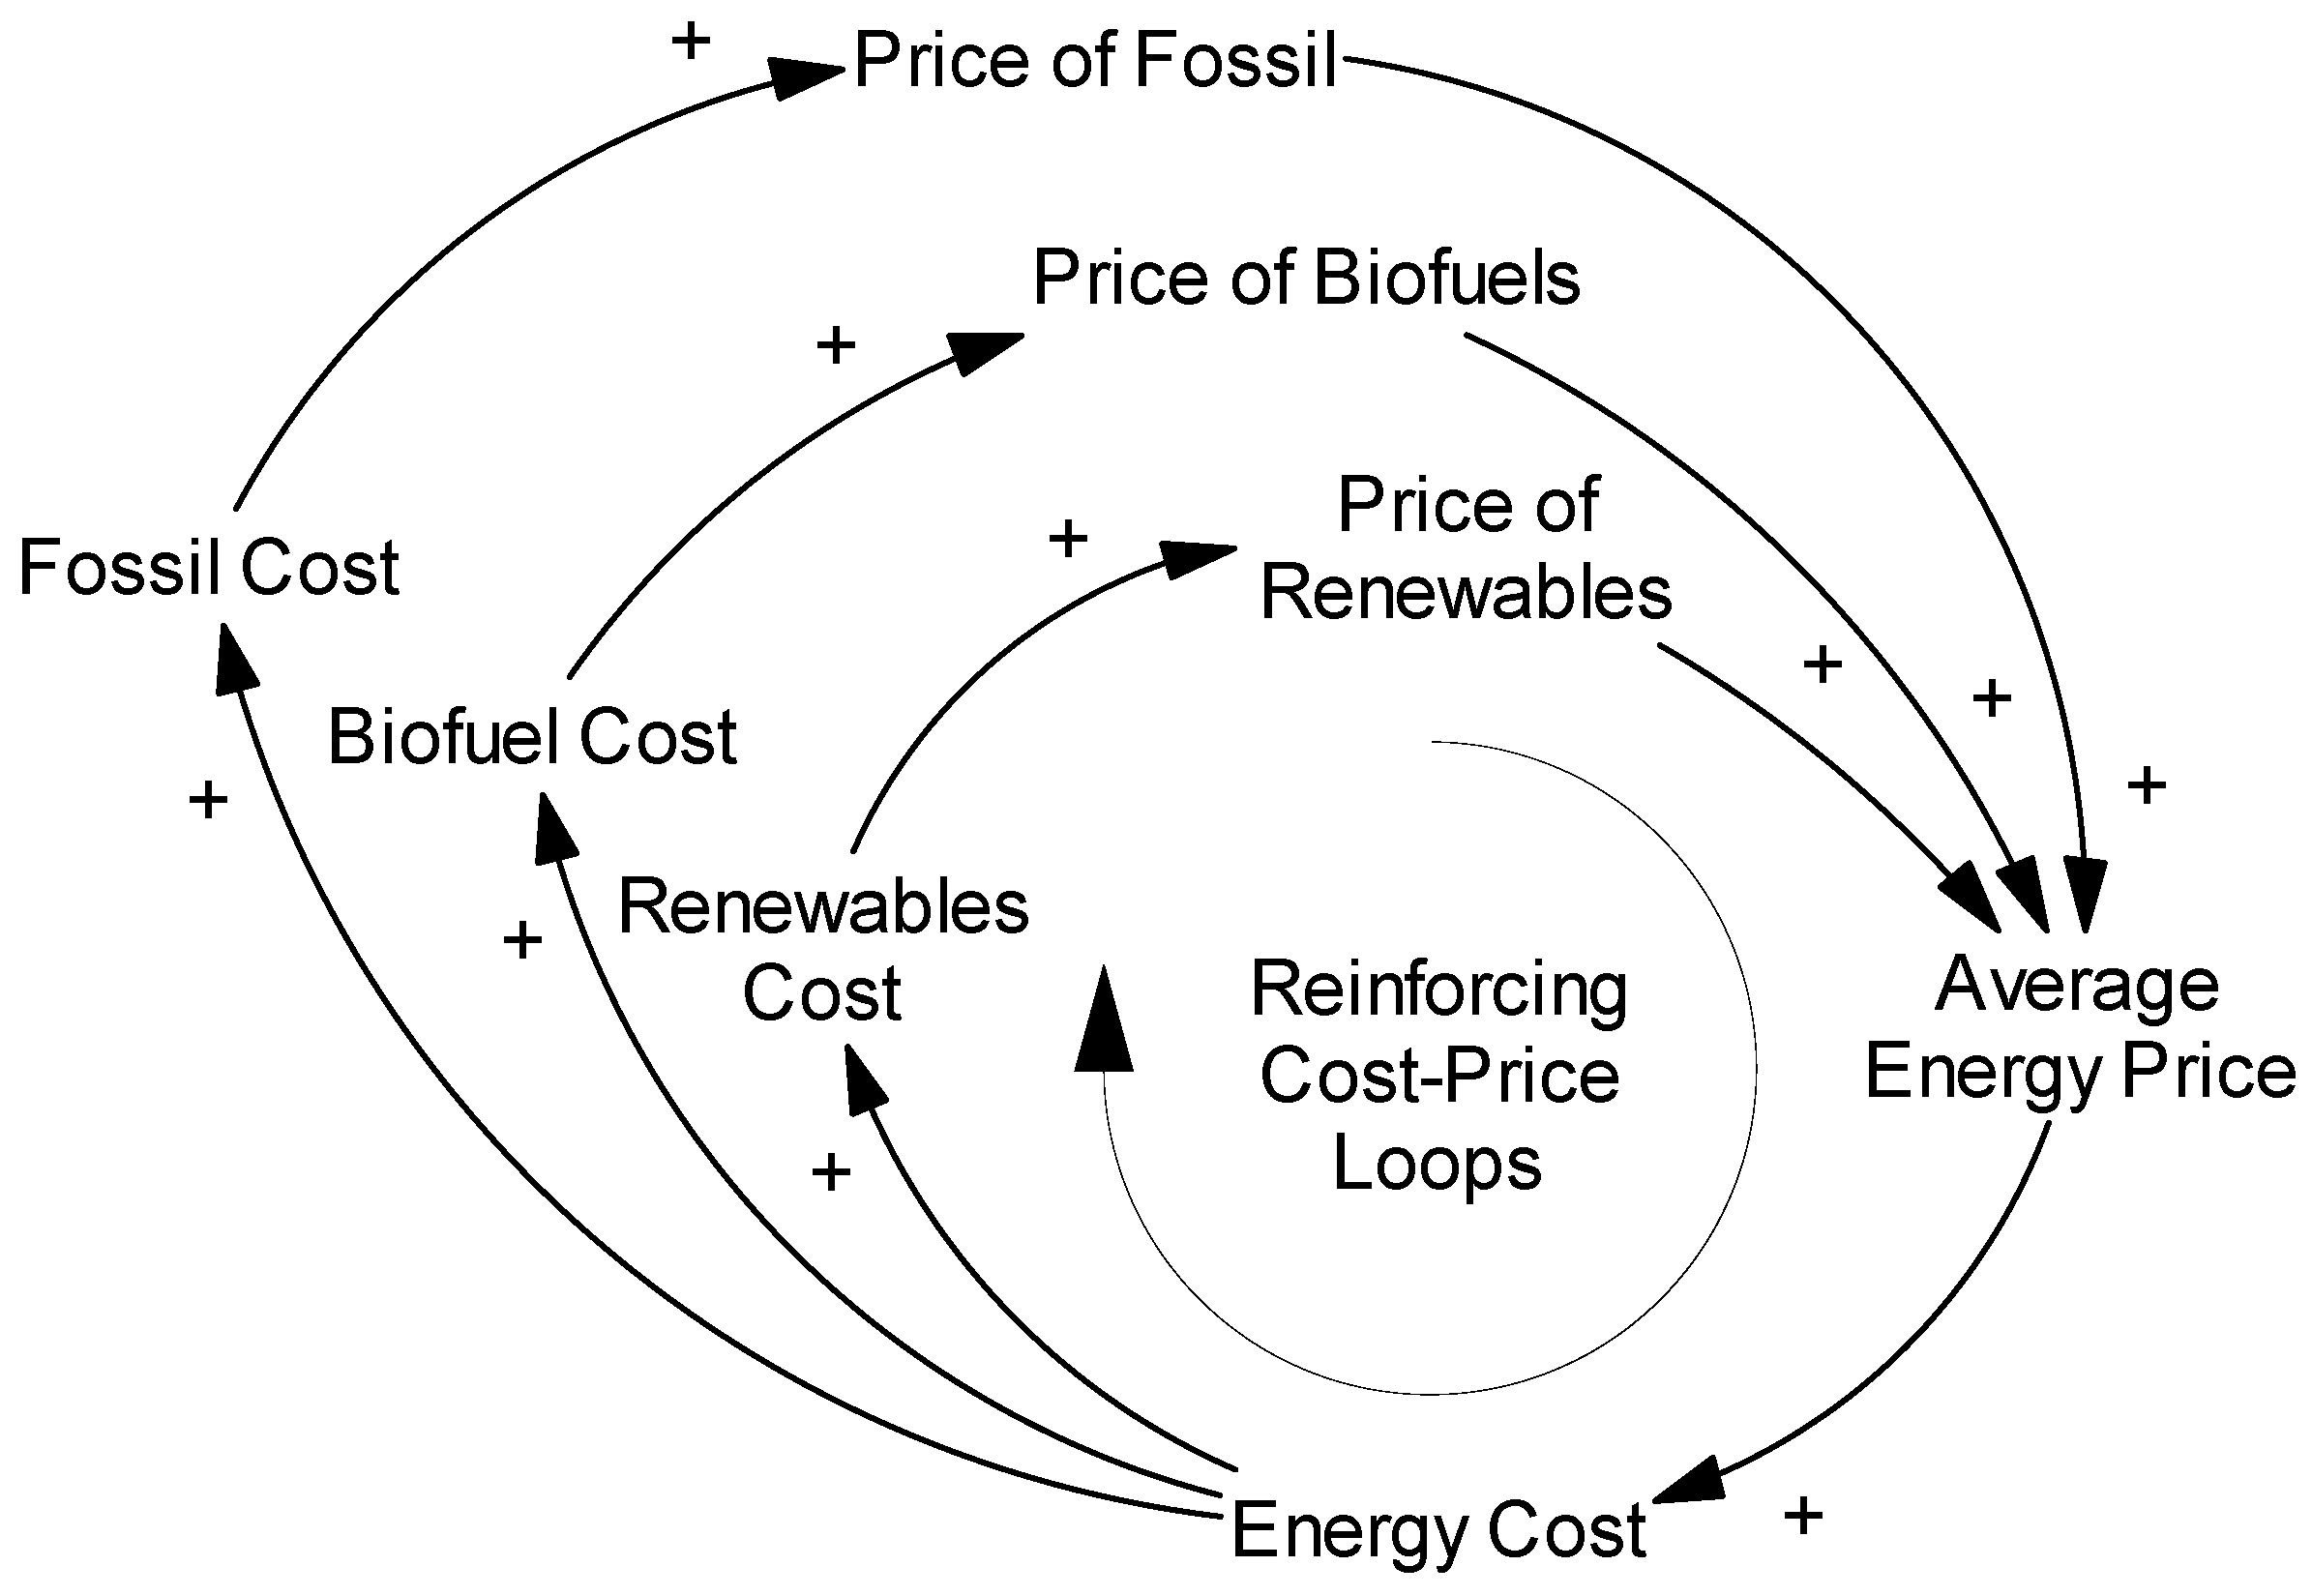
Appendix A.1. Model Sample ERRE (Economic Risk, Resources and Environment Model)


Appendix A.2. GIBM (Green Investment Barrier Model)
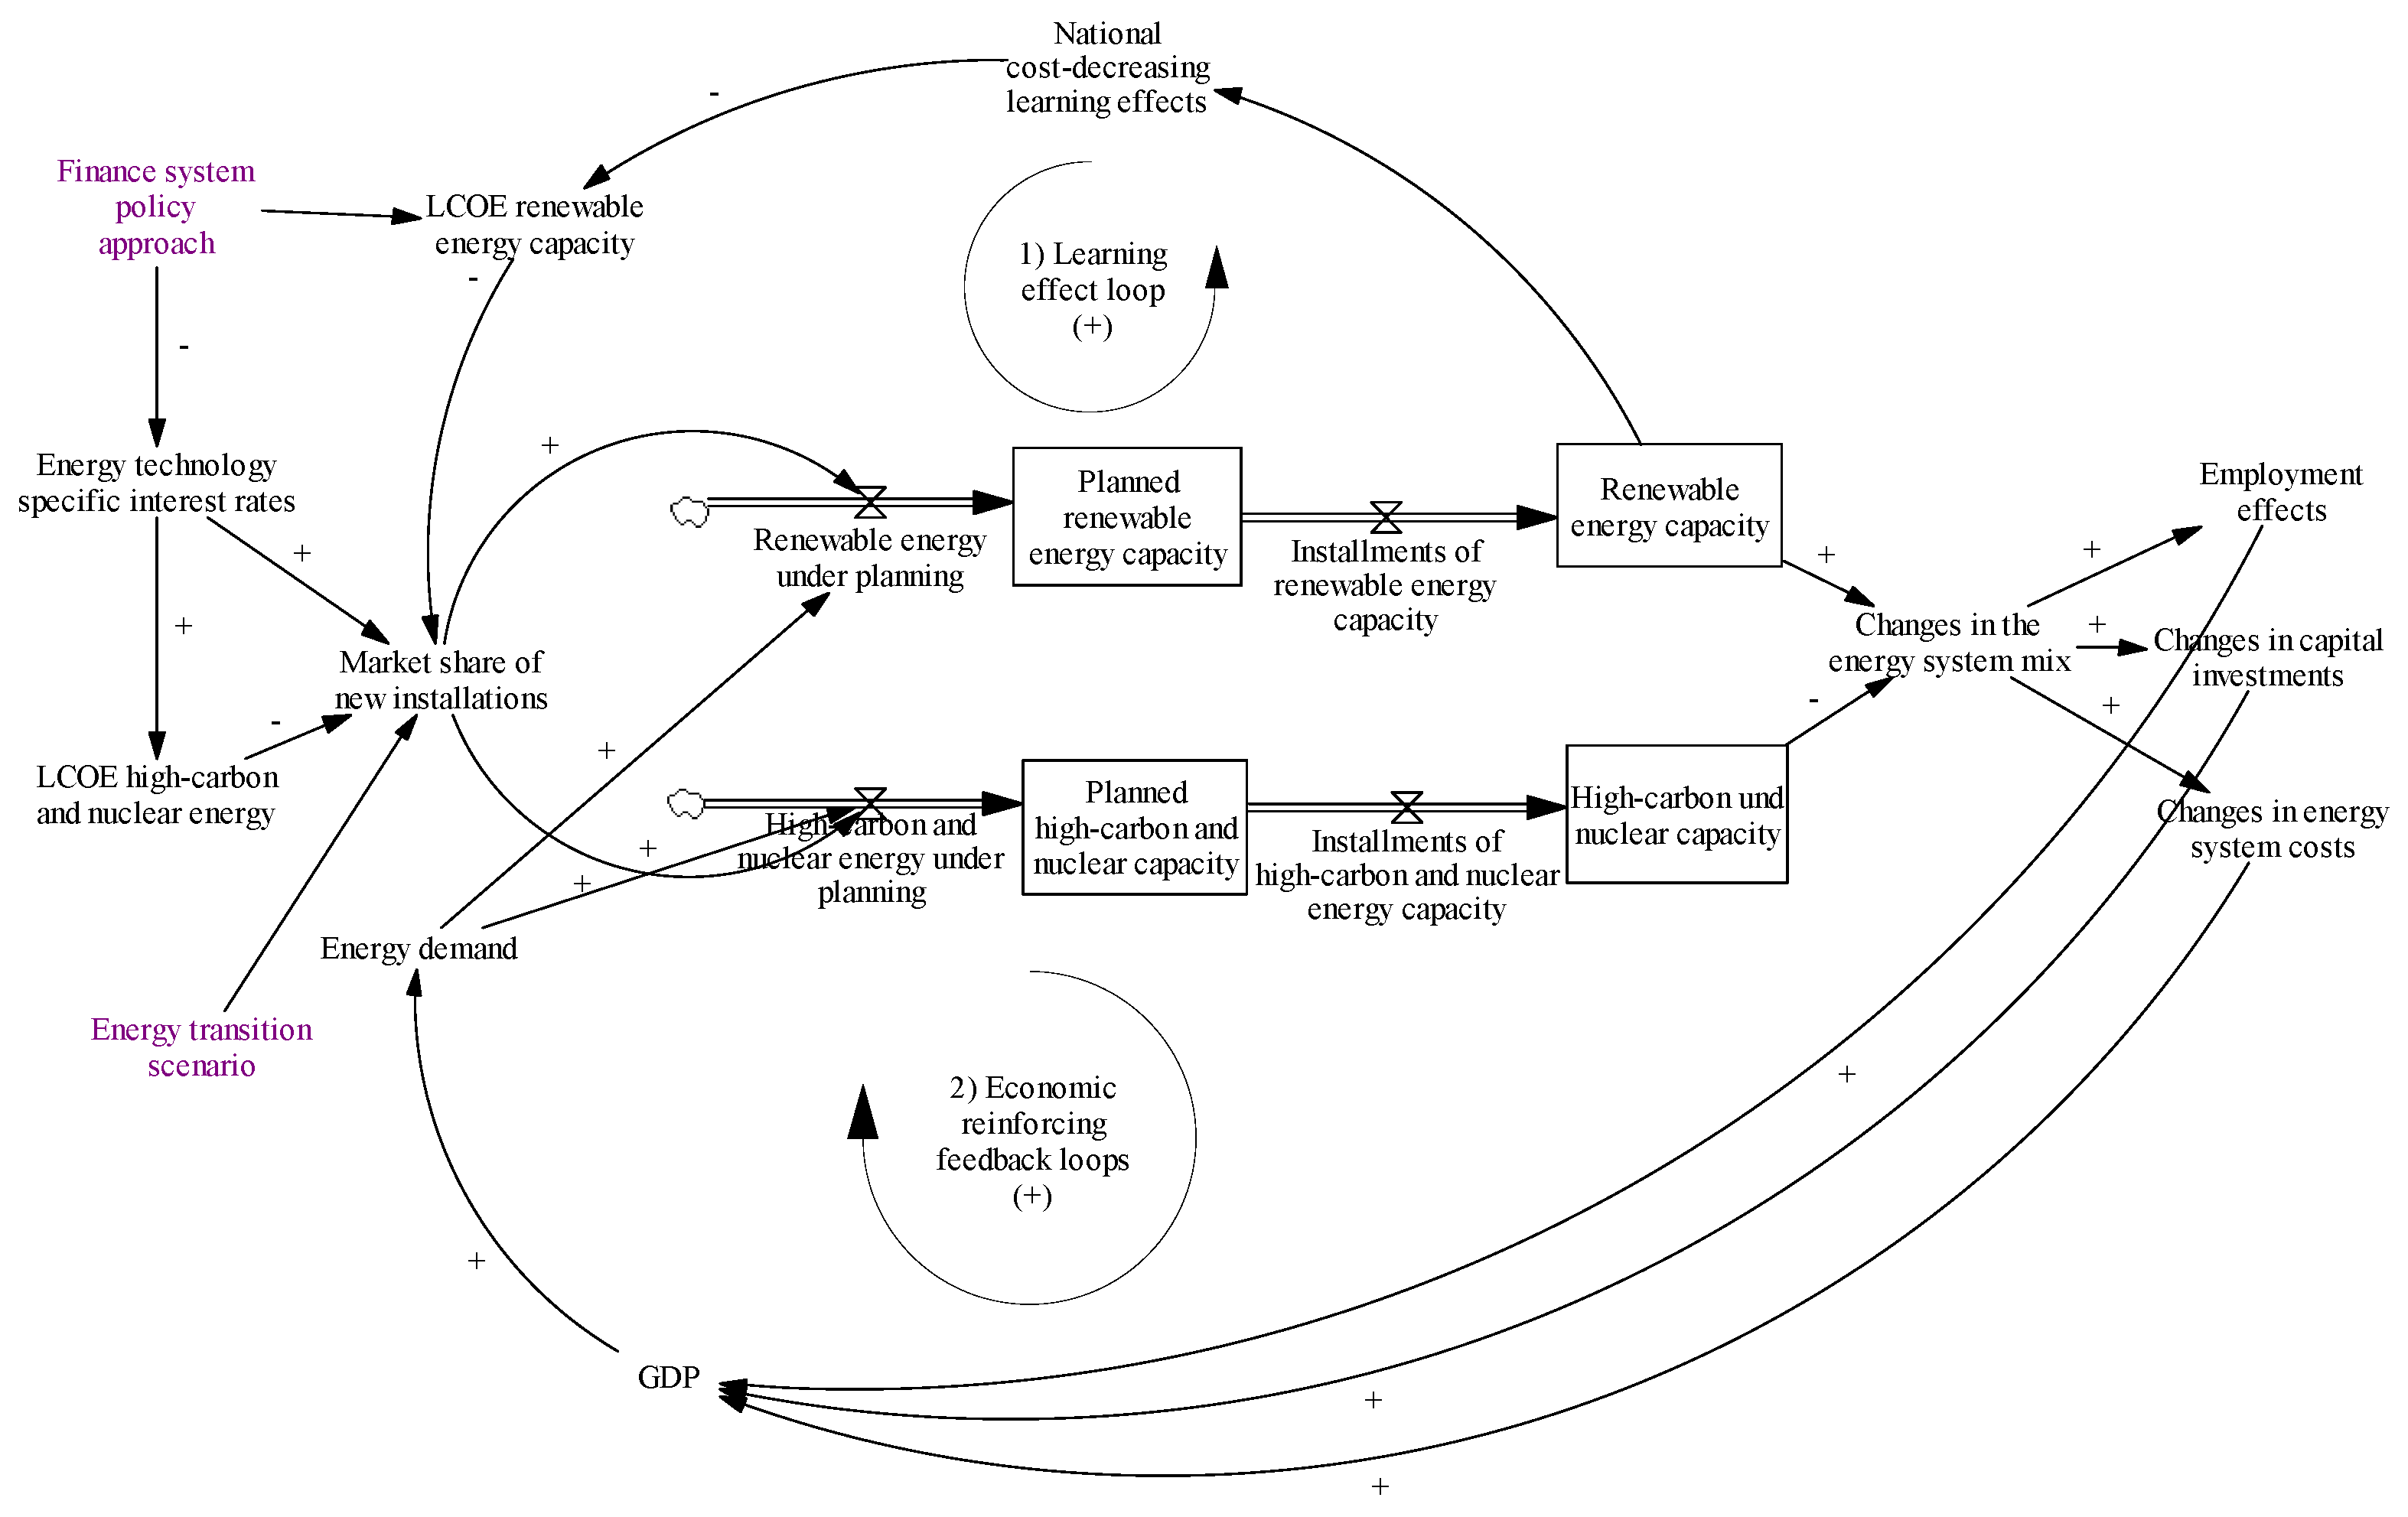
- Learning effect loops in the power sector (+): This loop describes the link between the increasing capacity of renewable energy infrastructure and the decreasing costs in constructing related infrastructure (on national level). That is, the more renewable energy production capacity is constructed, the more learning experience within the UK is available, and therefore the less it costs. Importantly, the GIBM includes both national learning effects (modelled endogenously) and international learning effects (represented exogenously) on the capital costs of renewable energy.
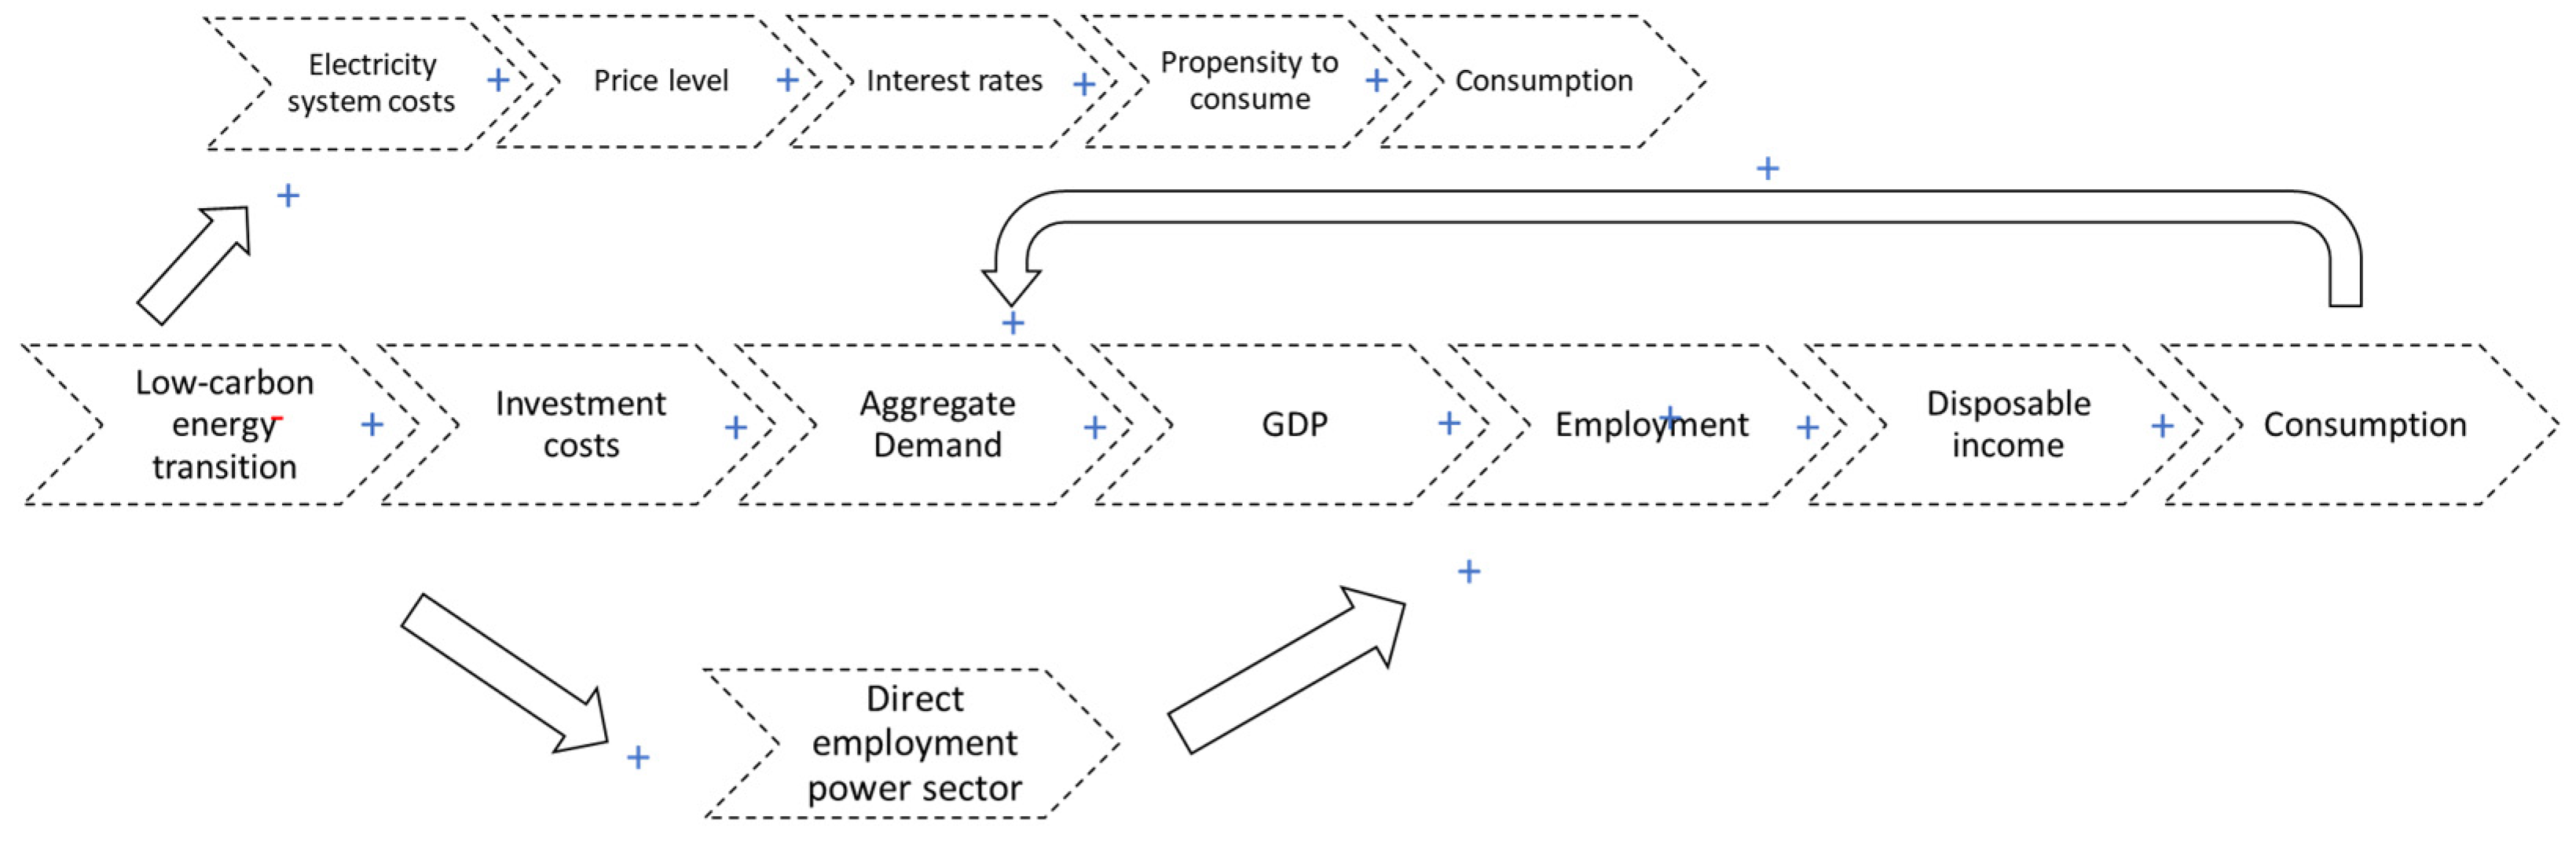
- Economic (mostly) reinforcing feedback loops (+): Changes in the composition of energy production capacity in the electricity system have impacts on the economy via the following three channels: (1) a change in direct employment in the power system that subsequently leads to changes in overall employment in the economy. In the economy, for example, higher employment means increases in wage income, higher consumption, and therefore an increase in GDP. An increase in GDP leads to a further increase in employment; (2) changes in capital investments in energy capacity. For example, an increase in investments in energy capacity leads to an increase in aggregate demand, which means an increase in GDP. An increase in GDP leads in turn to higher investments due to the higher production requirements and finally (3) changes in the power system costs. An increase in the power system costs leads to an increase in the power prices (for consumer), which subsequently translates to higher average prices (CPI). This in turn leads to an increase in the wage level, as such that it has no or only a small impact on the expenditure of the rest of the economy. However, more importantly for changes in the economy, an increase in the average price level also leads to an increase in the interest rates, leading subsequently to an increased propensity for consumption and therefore to an increase in GDP, leading again to additional increases in consumption. The dynamics of the economics are also visualised in Figure A6.
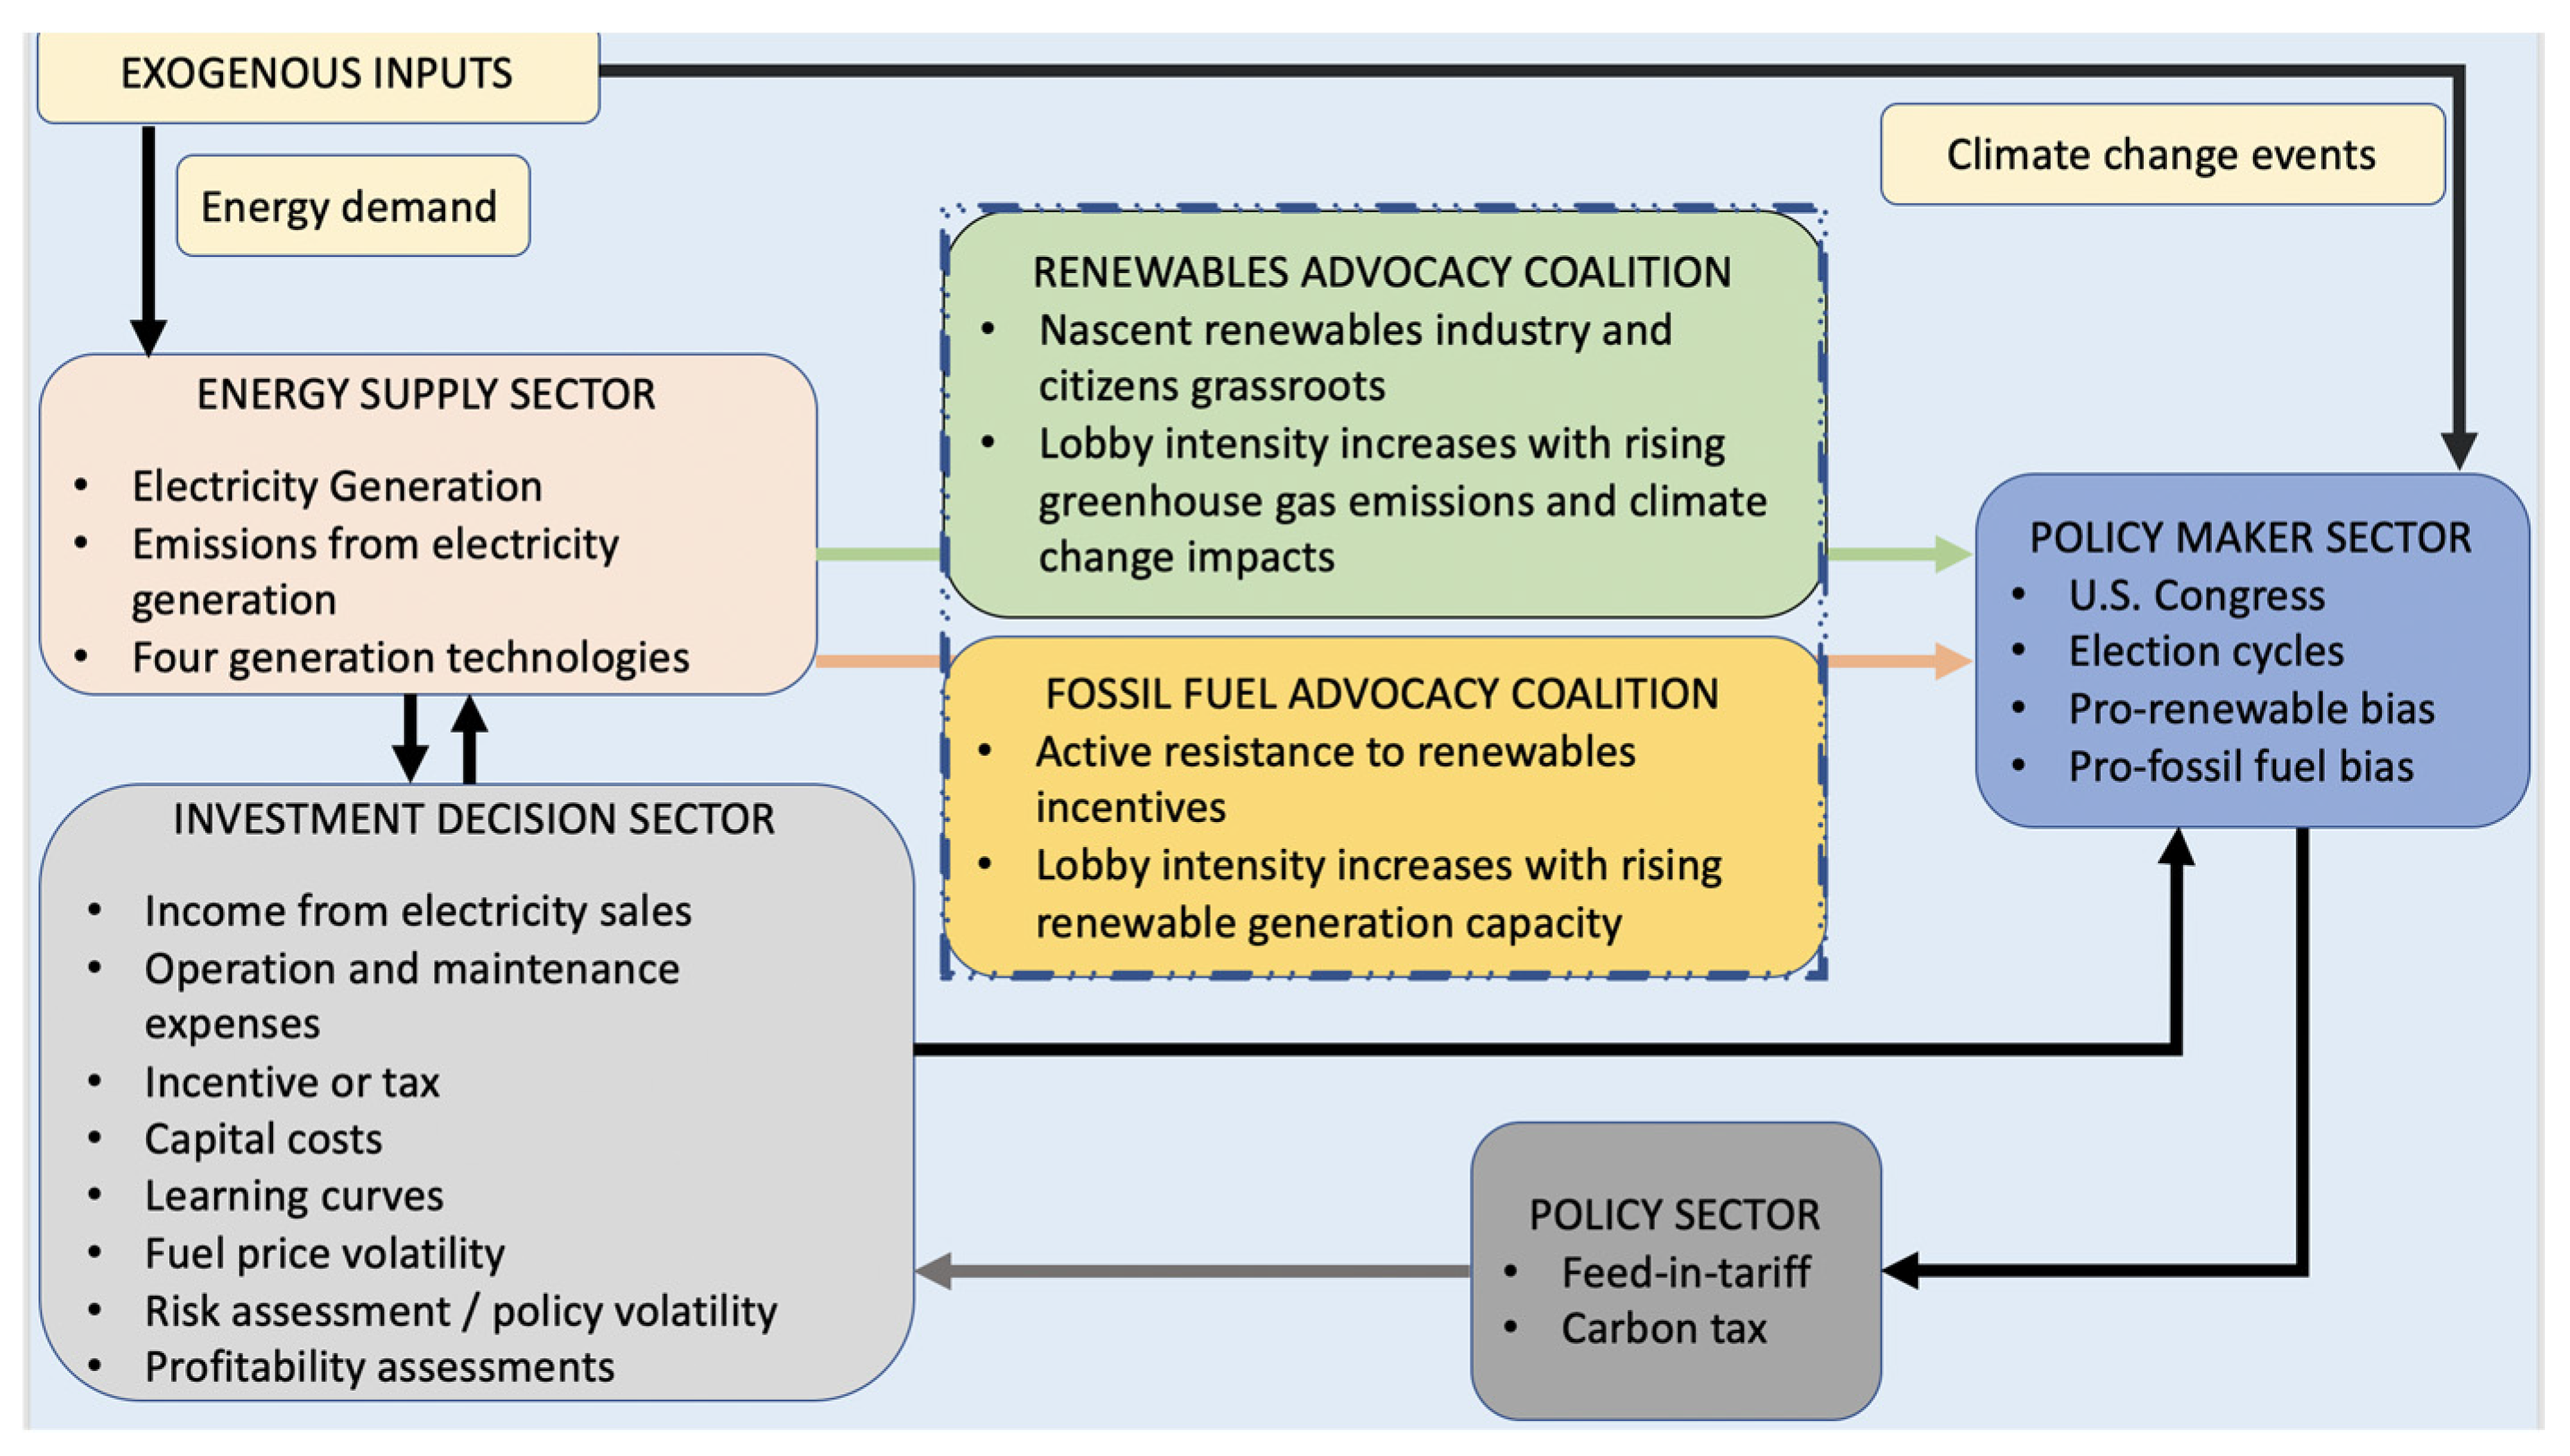
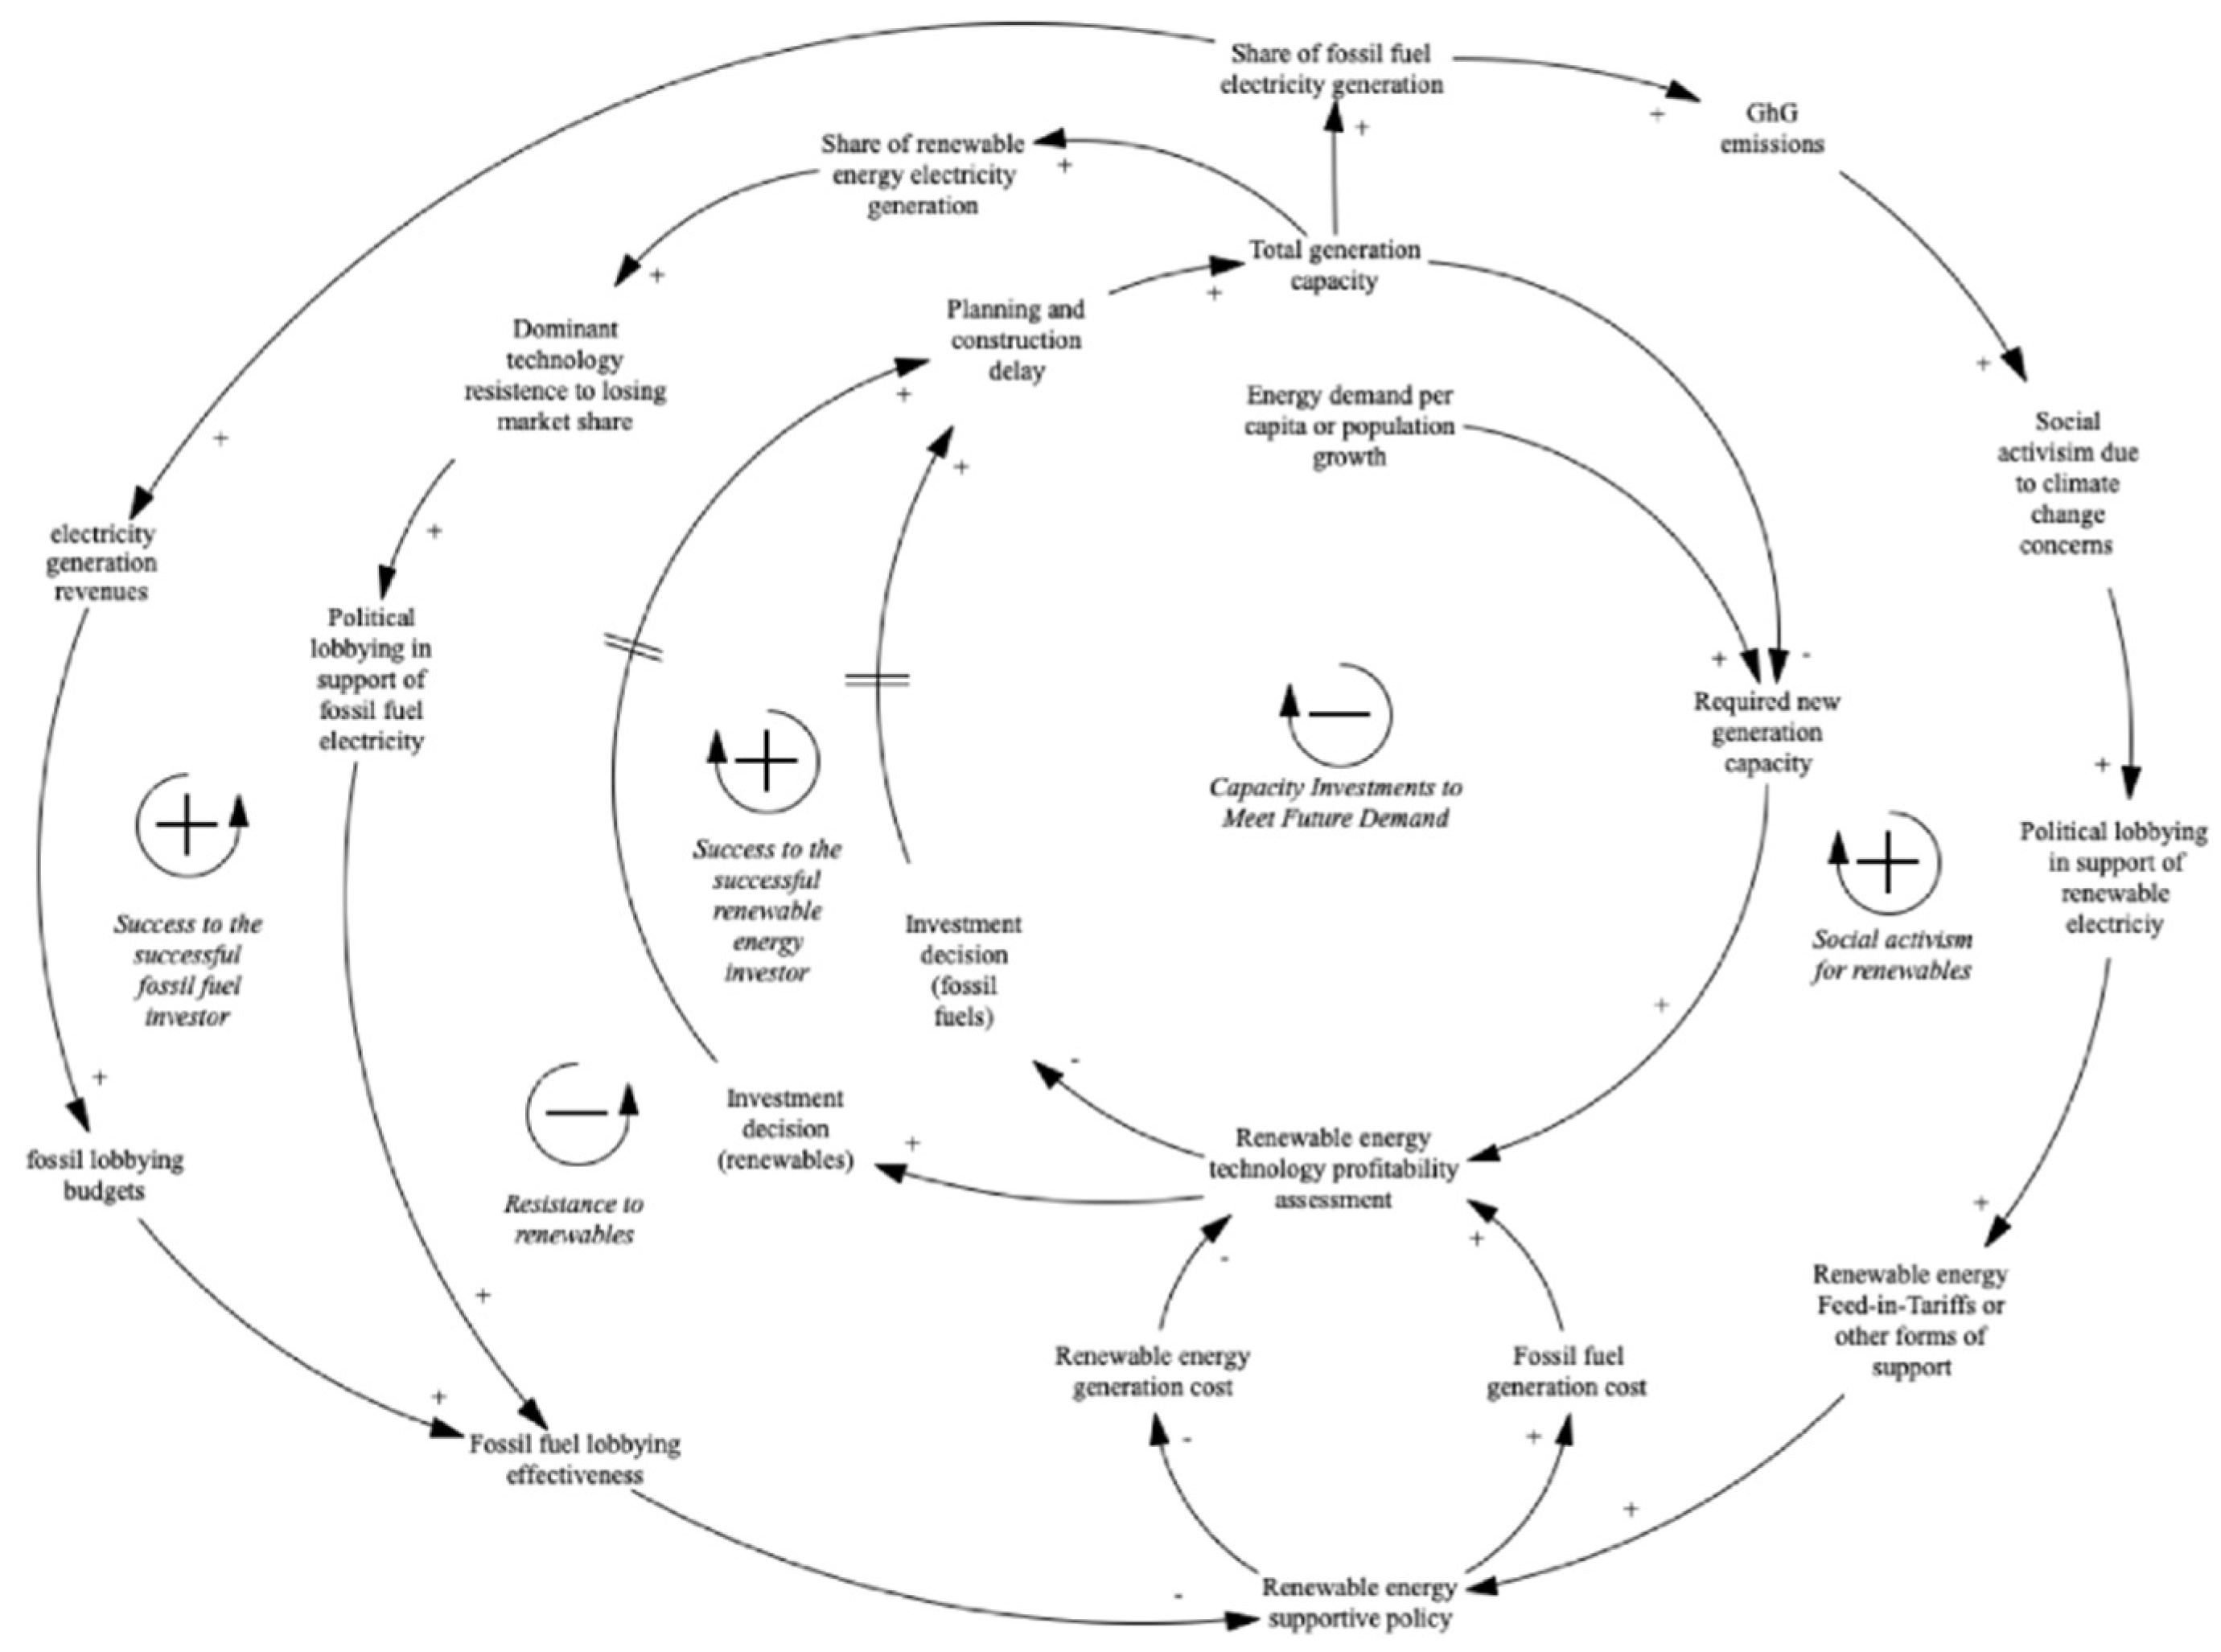
Appendix A.3. ACFM (Advocacy Coalition Framework Model)
- (1)
- Capacity investments to meet future demand (−): This loop describes the basic investment decisions regarding the new electricity generation capacity required to address growing populations or increasing energy demand per capita. The profitability assessment of renewable energy technologies compared to incumbent technologies determines which technology is selected. There is then a planning and construction phase and new capacity is added to the existing stock, which reduces the need for future capacity. Reduced demand then drives down profitability assessments.
- (2)
- Success for the successful fossil fuel investor (+): This reinforcing loop results in economic barriers to entry for renewables. In the absence of renewable incentives, the higher capital costs of renewables lessen their profitability assessment, leading to greater investments in fossil fuel technologies. Greater rates of fossil-fuelled electricity lead to greater revenues, which can be used to end lobbying efforts to inhibit renewable incentives from being enacted. This locks in fossil fuels and makes renewable incentives critical to diffusion.
- (3)
- Social activism for renewables (+): This reinforcing loop begins with greater shares of fossil-fuelled electricity, resulting in greater GhG emissions. Higher emissions and the subsequent climate change events increase the intensity of green energy coalitions, empowering political lobbying for renewable incentives such as a Feed-in-Tariff. Once enacted, an incentive increases the profitability assessment of renewables, resulting in greater diffusion rates.
- (4)
- Success for the successful renewable energy investor (+): This reinforcing loop represents the impact of supportive policies on economies of scale. As policies are enacted, they lower the price of renewables, increasing investments and added capacities. As more capacity comes online, learning curves or experience-by-doing further drop the price, driving more investments.
- (5)
- Resistance to renewables (−): This balancing loop represents fossil fuel industry’s resistance to higher capacities of renewable electricity generation. As greater shares of renewables come online, fossil fuel industry political lobbying intensifies, becoming more effective at rolling back renewable incentives. This changes the profitability assessment and results in higher rates of fossil fuel investment decisions.
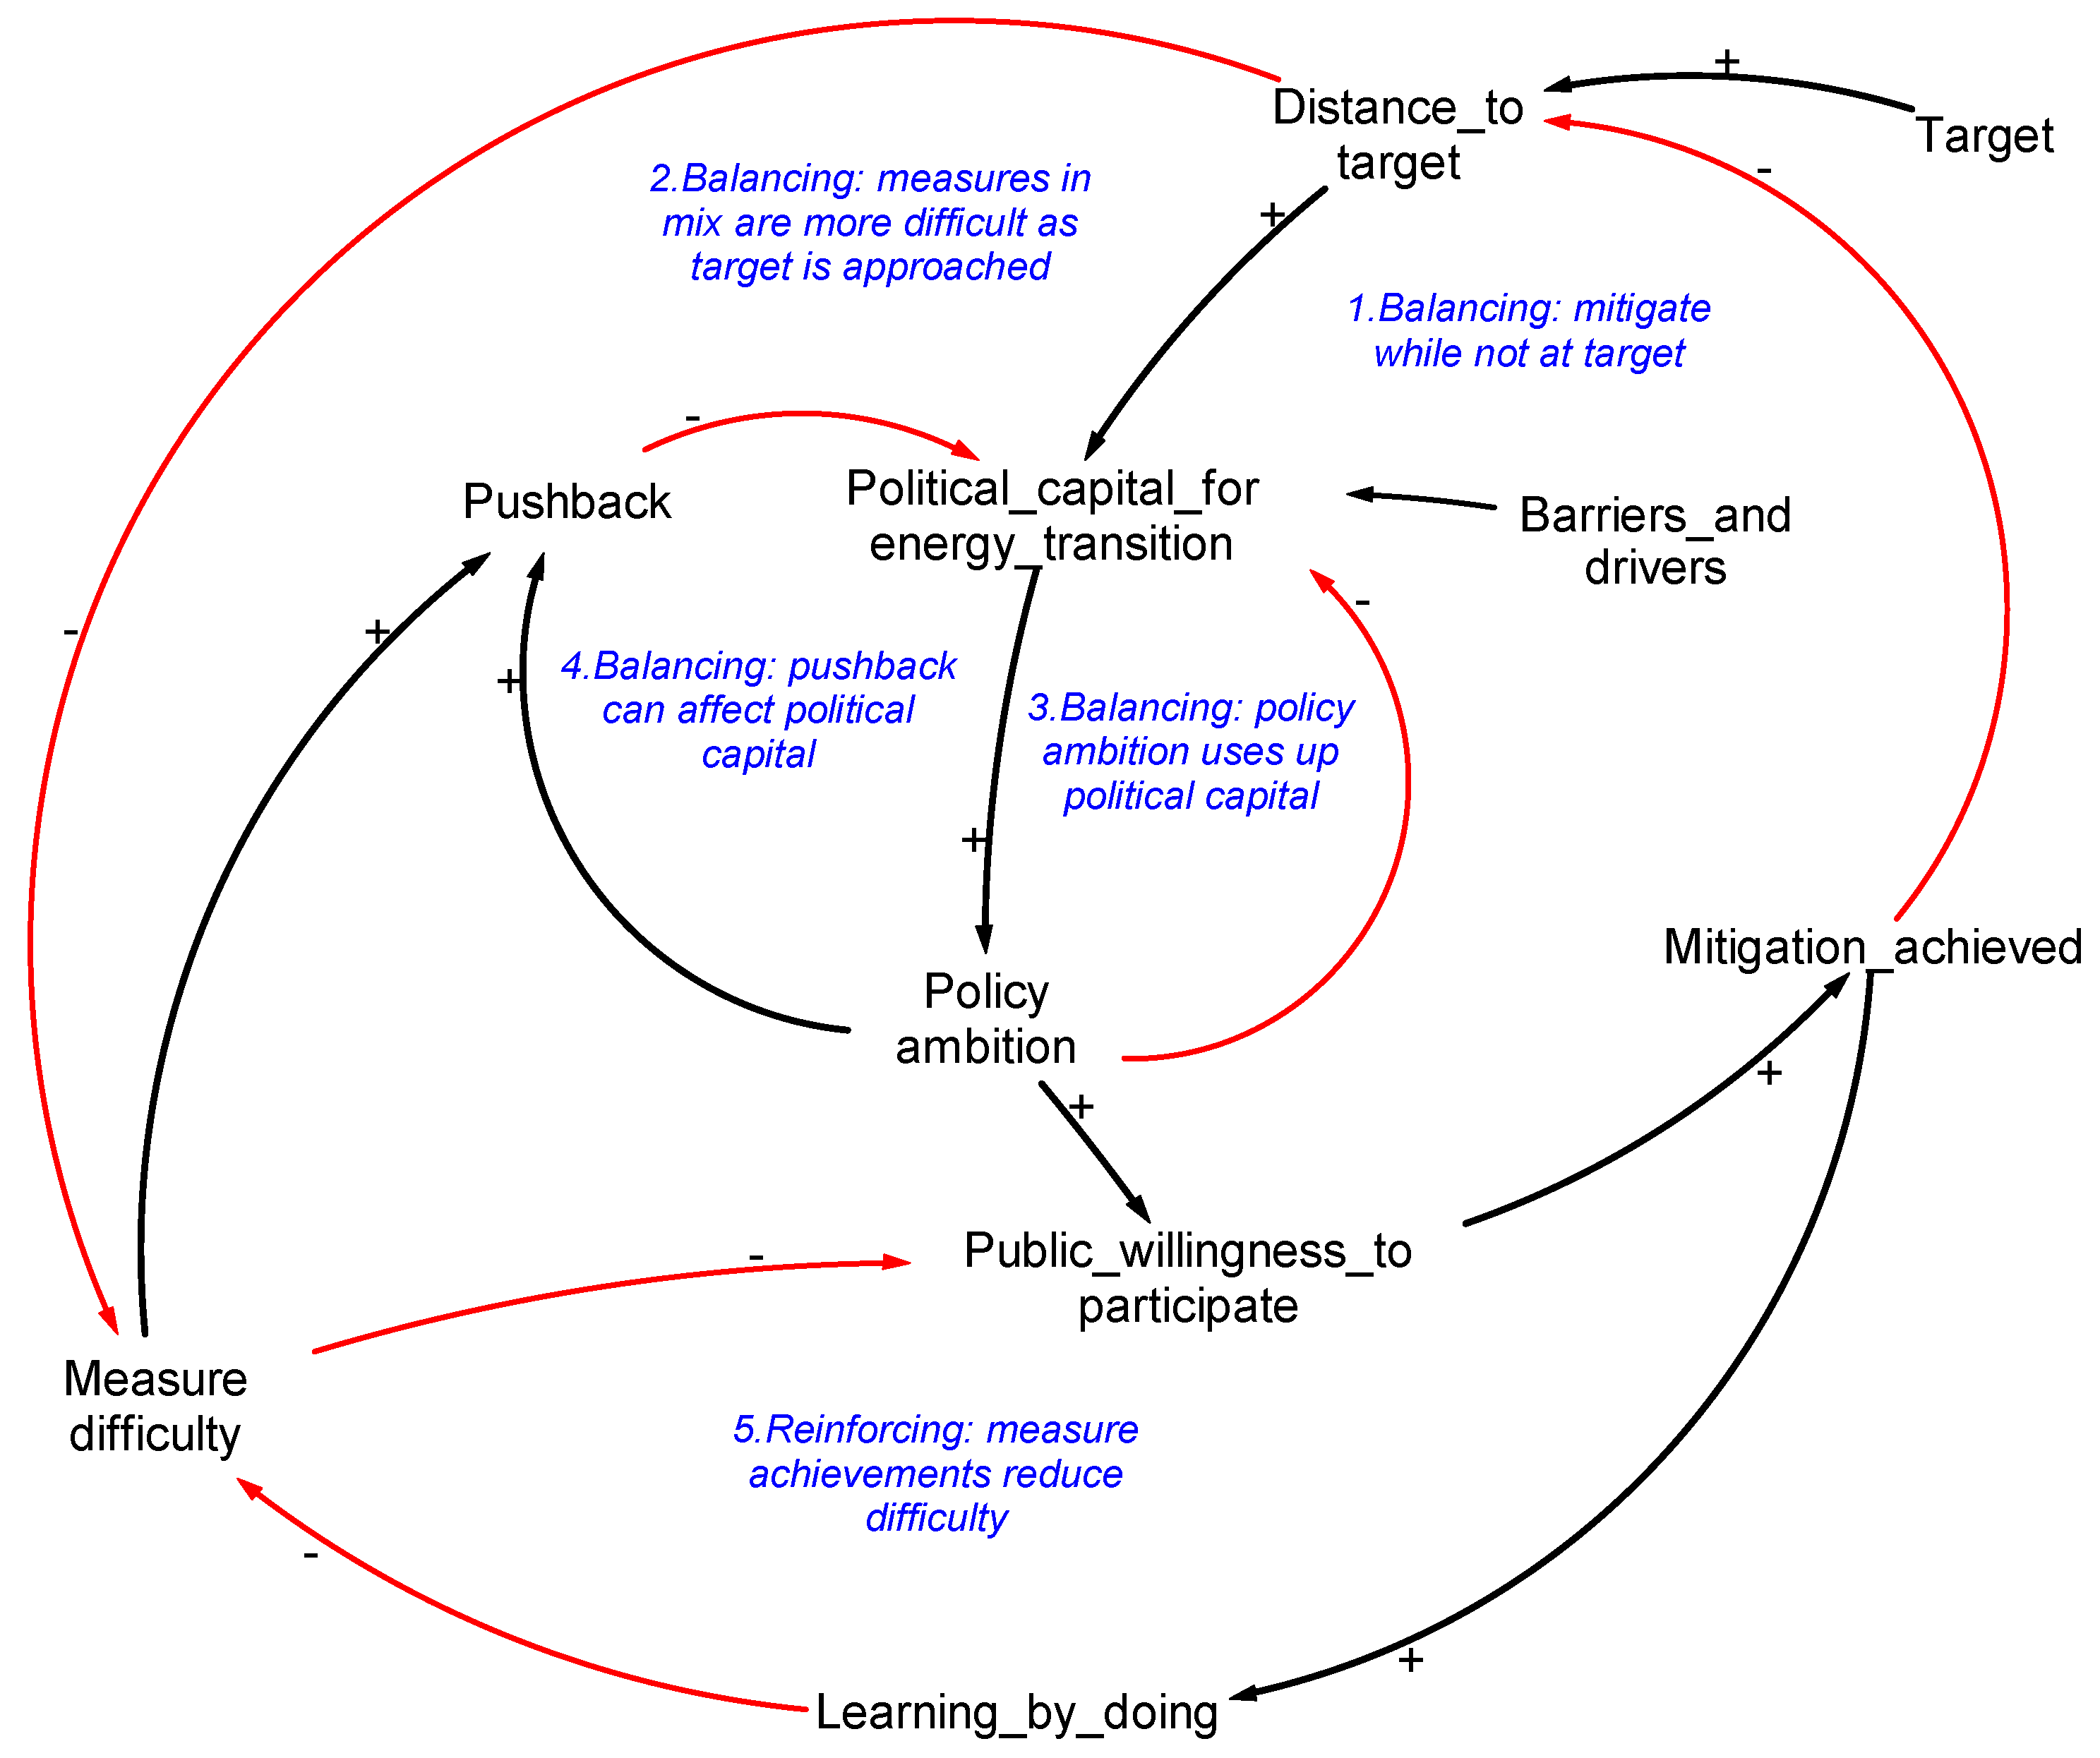
Appendix A.4. TEMPEST (Technological Economic Political Energy Systems Transition)
Appendix A.5. TREES (Transition of Regional Energy Systems) Simulation Platform

Appendix B. Detailed Model View

| ERRE | Captures the macroeconomic implications of low-carbon energy transitions. Endogenously represents the market dynamics of fossil fuels, green energy and biofuels and its relative impact on food stability. Addresses the dynamics of a centralised power transition. |
| GIBM | Represents the costs and carbon intensity of a portfolio of eleven electricity production technologies. Captures the technical and financial constraints of renewable power diffusion Addresses the dynamics of a centralised power transition. |
| ACFM | Represents the costs of a portfolio of electricity technologies—natural gas, PV, coal and oil. Addresses the dynamics of a centralised power transition. |
| TEMPEST | Represents energy consumption (electricity and non-electric fuels), carbon intensity of energy and emissions from energy use (MtCO2) across the whole national economy (5 sectors), and the implementation of 39 mitigation measures that save energy or reduce the carbon intensity of fuels. Considers centralised energy transitions. |
| TREES | Represents the costs of a portfolio of decentralised electricity prosumers and production technologies. Addresses the dynamics of a decentralised power transin. |
| ERRE | Covers a closed-system economy, modelling households, government, the financial sector and firms, and their interactions with global resource limits and greenhouse gas emissions. |
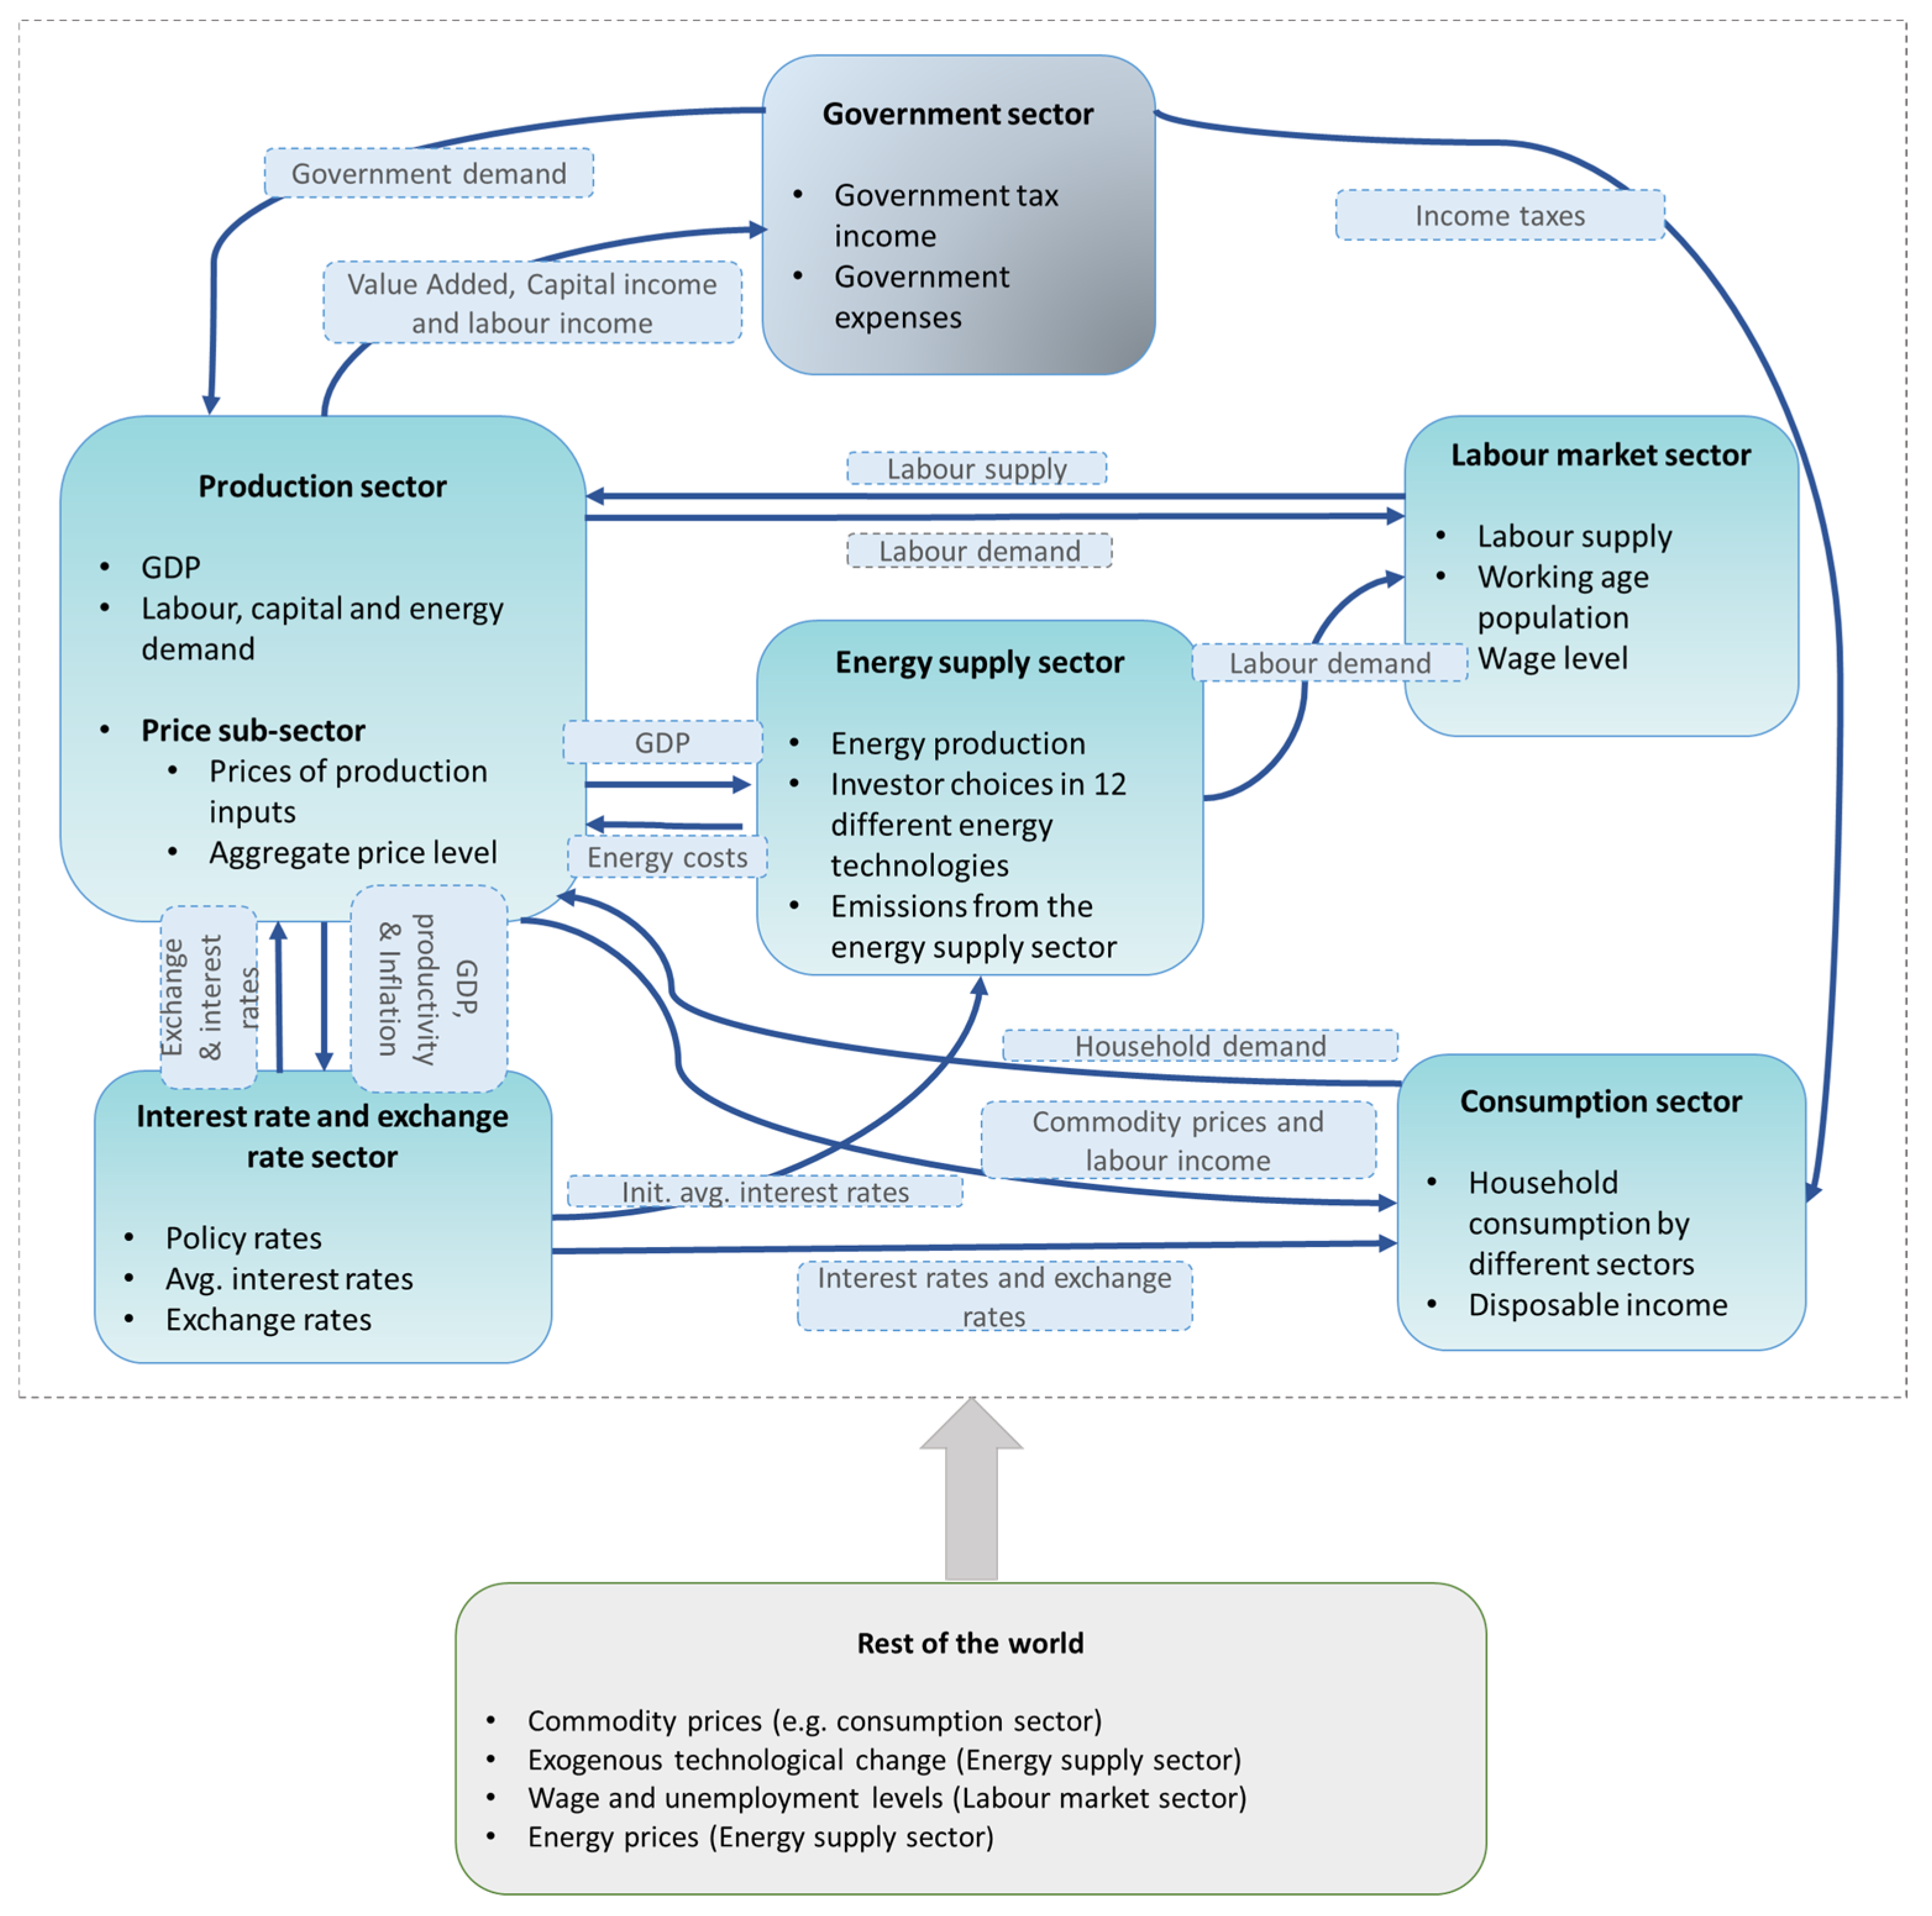
| GIBM | Covers key macroeconomy sectors (e.g., production, consumption, labour market, interest rates, etc.) and a power supply sector with investment decisions of energy firms. It addresses a green finance gap, including key investment barriers deterring it from closing. The interdisciplinary perspective is enriched by expert knowledge and empirical data from interviews. |
| ACFM | Examines political competition dynamics linked with economics and a technology change perspective by modelling pro-renewable and pro-fossil coalition attempts to influence policy making. The model includes endogenous behaviour changes of both coalition groups linked with capacity dynamics of renewable electricity technologies. |
| TEMPEST | Includes feedback between three layers in the model—the national level (political), the governance of mitigation (policy) and the implementation of mitigation measures (market?). Uses concepts from social sciences, including political capital, social capital and public acceptance. Design partly based on the meta-theoretical framework from Cherp et al. (2018) [6]. |
| TREES | The model integrates empirical insights from research on technical aspects (costs, sizing and technology learning curves), decision making, consumer preferences, finance and the business model literature. Knowledge has also been included from practitioners in participatory modelling workshops. |
| All models | Model building is based on the relevant literature from different fields, including, but not limited to, behavioural economics, energy economics studies and political science. All models include various sectors and their interrelated feedback loops from a systems perspective. |
| ERRE | The core structure of ERRE is defined as a three-layer network with the relationships between the macro-actors “households”, “banks”, “government” and “firms”. |
| GIBM | Represents macro-actors such as firms, consumers, workers, energy firms (investing in grid and energy production infrastructure) and financial investors. |
| ACFM | Includes both pro-fossil and pro-renewable coalitions, each seeking to influence the decisions of policy makers. These interest groups hold opposing views, have conflicting political agendas and seek to enact policies that favour their agendas, thus influencing the speed of the transition. |
| TEMPEST | Represents the political domain through the concept of “political capital”, which is the “fuel” needed for policy making that drives the energy transition, and represents policy making with a policy choice engine that assigns policy ambition to measures. TEMPEST represents societal responses to policies with the concept of “public willingness to participate” (PWP), which indicates the likelihood that expected policy outcomes will be achieved through actions from the energy sector and the rest of society. |
| TREES | Represents three consumer groups—single family houses, multi-family houses and commercial consumers, the grid operator, and providers of flexibility business models. Consumer decisions are modelled based on empirical data, in particular using results from a conjoint analysis, allowing for the simulation of a realistic adoption of decentralised technologies (Kubli (2020) [33] describes how conjoint data can be integrated effectively into an SD model reducing the uncertainty in the simulation). |
| All models | Importantly, actors in all models are governed by behavioural aspects (e.g., preferences, perceived rather than actual values) and apply heuristics (as opposed to cost optimisation). |
| ERRE | Includes various feedback loops within the economy (e.g., Keynesian multipliers). It also includes important feedback loops between the economy and the natural resource limits (e.g., climate change impacts and economy). |
| GIBM | Includes various feedback loops within the economy (e.g., Keynesian multipliers). It also represents path dependency in the power supply sector as the energy firms’ decisions are dependent on individual preferences or because installed energy infrastructure leads to learning effects of this particular technology, and therefore contributes to lowering the costs of this technology. |
| ACFM | Examines path-dependent and lock-in dynamics through fossil fuel coalition resistance to renewables moving out of the niche, intensifying lobbying efforts as the market share of renewables increases. Self-reinforcement is included by intensifying green advocacy coalition efforts to manipulate policy making as climate change impacts rise. |
| TEMPEST | Includes a combination of reinforcing loops that drive mitigation progress such as learning by doing, and balancing loops that limit progress, such as the possibility of societal pushback against strong policy pushes. The combination of all feedback loops determines the rate of mitigation. |
| TREES | Models consumer decisions respecting their individual decision context. By doing so, the individual path dependency is explicitly represented in the model. The self-reinforcing feedback loop of the grid cost-recovery effect on prosumer diffusion is a central part of the model. Further feedback loops are included for the simulation of flexibility business models. |
| All models | The representation of feedback loops is a key feature of system dynamics and thus also of the evaluated models. Depending on the type of feedback loops their interlinkages, feedback loops explain path dependency, lock-in and self-reinforcement of change. |
| ERRE | 100-year modelling horizon; evaluates transition using different sustainability indicators, such as emissions, GDP, unemployment, changes in prices or impacts on land use. |
| GIBM | 50-year modelling horizon; evaluates transition using different sustainability indicators, such as emissions, GDP, unemployment, generated direct employment, changes in electricity prices or power system costs. |
| ACFM | 30-year modelling horizon; evaluates transition rate based on installed capacity of renewable energy source electricity generation. |
| TEMPEST | 40-year historical period (1980 to 2019), and 60-year modelling horizon (2020 to 2080 or the year of achieving net zero emissions); evaluates the success of energy transition on the basis of cumulative emissions staying within a carbon budget, and the year of reaching net zero being close to the target of 2050. |
| TREES | 15/35-year modelling horizon, with historical period of 5–10 years (from 2010 to 2015/2020); evaluates transition using different sustainability indicators, such as share of solar power, share of self-consumed energy and grid costs, as well as distributional effects (see [31]). |
| ERRE | Compares various scenarios for sensitivity analysis (see [2,56] for guidelines on model validation and sensitivity testing for system dynamics models). |
| GIBM | Compares various scenarios for sensitivity analysis. |
| ACFM | Compares various scenarios for sensitivity analysis and employs Vensim’s Monte Carlo sensitivity analysis. |
| TEMPEST | Employs Vensim’s Monte Carlo sensitivity testing for uncertainty analysis based on varying exogenous conditions. |
| TREES | Compares various scenarios for strategy analysis and employs Vensim’s Monte Carlo sensitivity analysis. |
| All models | Model agents only have access to current information (no forward-looking agents) and model outcomes are tested by changing the exogenous assumptions via scenario analysis. |
References
- Andersen, D.F.; Vennix, J.A.; Richardson, G.P.; Rouwette, E.A. Group model building: Problem structuring, policy simulation and decision support. J. Oper. Res. Soc. 2007, 58, 691–694. [Google Scholar] [CrossRef]
- Barlas, Y. Formal aspects of model validity and validation in system dynamics. Syst. Dyn. Rev. J. Syst. Dyn. Soc. 1996, 12, 183–210. [Google Scholar] [CrossRef]
- Bergek, A.; Hekkert, M.; Jacobsson, S.; Markard, J.; Sandén, B.; Truffer, B. Technological innovation systems in contexts: Conceptualizing contextual structures and interaction dynamics. Environ. Innov. Soc. Transit. 2015, 16, 51–64. [Google Scholar] [CrossRef]
- Bolwig, S.; Bazbauers, G.; Klitkou, A.; Lund, P.D.; Blumberga, A.; Gravelsins, A.; Blumberga, D. Review of modelling energy transitions pathways with application to energy system flexibility. Renew. Sustain. Energy Rev. 2019, 101, 440–452. [Google Scholar] [CrossRef]
- Chappin, E.J.; Ligtvoet, A. Transition and transformation: A bibliometric analysis of two scientific networks researching socio-technical change. Renew. Sustain. Energy Rev. 2014, 30, 715–723. [Google Scholar] [CrossRef]
- Cherp, A.; Vinichenko, V.; Jewell, J.; Brutschin, E.; Sovacool, B. Integrating techno-economic, socio-technical and political perspectives on national energy transitions: A meta-theoretical framework. Energy Res. Soc. Sci. 2018, 37, 175–190. [Google Scholar] [CrossRef]
- Eker, S.; Zimmermann, N.; Carnohan, S.; Davies, M. Participatory system dynamics modelling for housing, energy and wellbeing interactions. Build. Res. Inf. 2018, 46, 738–754. [Google Scholar] [CrossRef]
- Forrester, J.W. Industrial Dynamics; The MIT Press, Massachussets Institute of Technology: Cambridge, MA, USA; John Wiley and Sons: New York, NY, USA, 1961. [Google Scholar]
- Forrester, J.W. Industrial Dynamics. A major breakthrough for decision makers. Harv. Bus. Rev. 1958, 36, 37–66. [Google Scholar]
- Freeman, R. Modelling the socio-political feasibility of energy transition with system dynamics. Environ. Innov. Soc. Transit. 2021, 40, 486–500. [Google Scholar] [CrossRef]
- Geels, F.W. Technological transitions as evolutionary reconfiguration processes: A multi-level perspective and a case-study. Res. Policy 2002, 31, 1257–1274. [Google Scholar] [CrossRef]
- Geels, F.W. Technological Transitions and System Innovations: A Co-Evolutionary and Socio-Technical Analysis; Edward Elgar Publishing: Cheltenham, UK, 2005. [Google Scholar]
- Geels, F.W. Analysing the breakthrough of rock ‘n’roll (1930–1970) Multi-regime interaction and reconfiguration in the multi-level perspective. Technol. Forecast. Soc. Chang. 2007, 74, 1411–1431. [Google Scholar] [CrossRef]
- Geels, F.W.; Schot, J. Typology of sociotechnical transition pathways. Res. Policy 2007, 36, 399–417. [Google Scholar] [CrossRef]
- Geels, F.W.; Sovacool, B.K.; Schwanen, T.; Sorrell, S. Sociotechnical transitions for deep decarbonization. Science 2017, 357, 1242–1244. [Google Scholar] [CrossRef] [PubMed]
- Giarola, S.; Mittal, S.; Vielle, M.; Perdana, S.; Campagnolo, L.; Delpiazzo, E.; Bui, H.; Kraavi, A.A.; Kolpakov, A.; Sognnaes, I.; et al. Challenges in the harmonisation of global integrated assessment models: A comprehensive methodology to reduce model response heterogeneity. Sci. Total Environ. 2021, 783, 146861. [Google Scholar] [CrossRef] [PubMed]
- Gottschamer, L.; Zhang, Q. The dynamics of political power: The socio-technical transition of California electricity system to renewable energy. Energy Res. Soc. Sci. 2020, 70, 101618. [Google Scholar] [CrossRef]
- Hafner, S.; Anger-Kraavi, A.; Monasterolo, I.; Jones, A. Emergence of new economics energy transition models: A review. Ecol. Econ. 2020, 177, 106779. [Google Scholar] [CrossRef]
- Hafner, S.; Jones, A.; Anger-Kraavi, A. Economic impacts of achieving a net-zero emissions target in the energy sector. J. Clean. Prod. 2021, 312, 127610. [Google Scholar] [CrossRef]
- Hafner, S.; Jones, A.; Anger-Kraavi, A.; Monasterolo, I. Modelling the macroeconomics of a ‘closing the green finance gap’ scenario for an energy transition. Environ. Innov. Soc. Transit. 2021, 40, 536–568. [Google Scholar] [CrossRef]
- Halbe, J.; Reusser, D.E.; Holtz, G.; Haasnoot, M.; Stosius, A.; Avenhaus, W.; Kwakkel, J.H. Lessons for model use in transition research: A survey and comparison with other research areas. Environ. Innov. Soc. Transit. 2015, 15, 194–210. [Google Scholar] [CrossRef]
- Hirt, L.F.; Schell, G.; Sahakian, M.; Trutnevyte, E. A review of linking models and socio-technical transitions theories for energy and climate solutions. Environ. Innov. Soc. Transit. 2020, 35, 162–179. [Google Scholar] [CrossRef]
- Holtz, G. Modelling transitions: An appraisal of experiences and suggestions for research. Environ. Innov. Soc. Transit. 2011, 1, 167–186. [Google Scholar] [CrossRef]
- Holtz, G.; Alkemade, F.; De Haan, F.; Köhler, J.; Trutnevyte, E.; Luthe, T.; Halbe, J.; Papachristos, G.; Chappin, E.; Kwakkel, J.; et al. Prospects of modelling societal transitions: Position paper of an emerging community. Environ. Innov. Soc. Transit. 2015, 17, 41–58. [Google Scholar] [CrossRef]
- IPCC. Climate change 2014: Mitigation of climate change. In Contribution of Working Group III to the Fifth Assessment Report of the Intergovernmental Panel on Climate Change; Field, C.B., Ed.; Cambridge University Press: Cambridge, UK, 2014; pp. 1–32. [Google Scholar]
- Kanger, L.; Schot, J. Deep transitions: Theorizing the long-term patterns of socio-technical change. Environ. Innov. Soc. Transit. 2019, 32, 7–21. [Google Scholar] [CrossRef]
- Kanger, L.; Sovacool, B.K.; Noorkõiv, M. Six policy intervention points for sustainability transitions: A conceptual framework and a systematic literature review. Res. Policy 2020, 49, 104072. [Google Scholar] [CrossRef]
- Kemp, R.; Schot, J.; Hoogma, R. Regime shifts to sustainability through processes of niche formation: The approach of strategic niche management. Technol. Anal. Strateg. Manag. 1998, 10, 175–198. [Google Scholar] [CrossRef]
- Kivimaa, P.; Kern, F. Creative destruction or mere niche support? Innovation policy mixes for sustainability transitions. Res. Policy 2016, 45, 205–217. [Google Scholar] [CrossRef]
- Köhler, J.; Geels, F.W.; Kern, F.; Markard, J.; Onsongo, E.; Wieczorek, A.; Alkemade, F.; Avelino, F.; Bergek, A.; Boons, F.; et al. An agenda for sustainability transitions research: State of the art and future directions. Environ. Innov. Soc. Transit. 2019, 31, 1–32. [Google Scholar] [CrossRef]
- Kubli, M. Squaring the sunny circle? On balancing distributive justice of power grid costs and incentives for solar prosumers. Energy Policy 2018, 114, 173–188. [Google Scholar] [CrossRef]
- Kubli, M. Decentralization Dynamics of Energy Systems: From Prosumer Preferences to System-Level Perspectives. Doctoral Dissertation, University of St. Gallen, St. Gallen, Switzerland, 2019. [Google Scholar]
- Kubli, M.D. Navigating through the unknown: How conjoint analysis reduces uncertainty in energy consumer modelling. Syst. Res. Behav. Sci. 2020, 37, 880–885. [Google Scholar] [CrossRef]
- Kubli, M.; Canzi, P. Business strategies for flexibility aggregators to steer clear of being “too small to bid”. Renew. Sustain. Energy Rev. 2021, 143, 110908. [Google Scholar] [CrossRef]
- Kubli, M.; Ulli-Beer, S. Decentralisation dynamics in energy systems: A generic simulation of network effects. Energy Res. Soc. Sci. 2016, 13, 71–83. [Google Scholar] [CrossRef]
- Kwakkel, J.H.; Pruyt, E. Exploratory Modeling and Analysis, an approach for model-based foresight under deep uncertainty. Technol. Forecast. Soc. Chang. 2013, 80, 419–431. [Google Scholar] [CrossRef]
- Li, F.G.; Strachan, N. Modelling energy transitions for climate targets under landscape and actor inertia. Environ. Innov. Soc. Transit. 2017, 24, 106–129. [Google Scholar] [CrossRef]
- Li, F.G.; Trutnevyte, E.; Strachan, N. A review of socio-technical energy transition (STET) models. Technol. Forecast. Soc. Chang. 2015, 100, 290–305. [Google Scholar] [CrossRef]
- Markard, J.; Raven, R.; Truffer, B. Sustainability transitions: An emerging field of research and its prospects. Res. Policy 2012, 41, 955–967. [Google Scholar] [CrossRef]
- Moallemi, E.A.; Aye, L.; de Haan, F.J.; Webb, J.M. A dual narrative-modelling approach for evaluating socio-technical transitions in electricity sectors. J. Clean. Prod. 2017, 162, 1210–1224. [Google Scholar] [CrossRef]
- Nikas, A.; Elia, A.; Boitier, B.; Koasidis, K.; Doukas, H.; Cassetti, G.; Anger-Kraavi, A.; Bui, H.; Campagnolo, L.; De Miglio, R.; et al. Where is the EU headed given its current climate policy? A stakeholder-driven model inter-comparison. Sci. Total Environ. 2021, 793, 148549. [Google Scholar] [CrossRef]
- Papachristos, G. A system dynamics model of socio-technical regime transitions. Environ. Innov. Soc. Transit. 2011, 1, 202–233. [Google Scholar] [CrossRef]
- Papachristos, G. Transition inertia due to competition in supply chains with remanufacturing and recycling: A systems dynamics model. Environ. Innov. Soc. Transit. 2014, 12, 47–65. [Google Scholar] [CrossRef]
- Papachristos, G. System dynamics modelling and simulation for sociotechnical transitions research. Environ. Innov. Soc. Transit. 2019, 31, 248–261. [Google Scholar] [CrossRef]
- Papachristos, G.; Struben, J. System dynamics methodology and research: Opportunities for transitions research. In Modelling Transitions; Routledge: New York, NY, USA, 2019; pp. 119–138. [Google Scholar]
- Pasqualino, R.; Jones, A.W. Appendixes of: Resources, Financial Risk and the Dynamics of Growth—Systems and Global Society. 2020. Available online: https://aru.figshare.com/articles/software/Economic_Risk_Resources_and_Environment_ERRE_model/10110710/1 (accessed on 2 February 2020).
- Pfenninger, S.; Hawkes, A.; Keirstead, J. Energy systems modeling for twenty-first century energy challenges. Renew. Sustain. Energy Rev. 2014, 33, 74–86. [Google Scholar] [CrossRef]
- Rosenbloom, D. Pathways: An emerging concept for the theory and governance of low-carbon transitions. Glob. Environ. Chang. 2017, 43, 37–50. [Google Scholar] [CrossRef]
- Safarzyńska, K.; Frenken, K.; Van Den Bergh, J.C. Evolutionary theorizing and modeling of sustainability transitions. Res. Policy 2012, 41, 1011–1024. [Google Scholar] [CrossRef]
- Schot, J.; Geels, F.W. Strategic niche management and sustainable innovation journeys: Theory, findings, research agenda, and policy. Technol. Anal. Strateg. Manag. 2008, 20, 537–554. [Google Scholar] [CrossRef]
- Schot, J.; Kanger, L. Deep transitions: Emergence, acceleration, stabilization and directionality. Res. Policy 2018, 47, 1045–1059. [Google Scholar] [CrossRef]
- Shum, K.L. Renewable energy deployment policy: A transition management perspective. Renew. Sustain. Energy Rev. 2017, 73, 1380–1388. [Google Scholar] [CrossRef]
- Spencer, T.; Colombier, M.; Sartor, O.; Garg, A.; Tiwari, V.; Burton, J.; Caetano, T.; Green, F.; Teng, F.; Wiseman, J. The 1.5 C target and coal sector transition: At the limits of societal feasibility. Clim. Policy 2018, 18, 335–351. [Google Scholar] [CrossRef]
- Sterman, J.D. All models are wrong: Reflections on becoming a systems scientist. Syst. Dyn. Rev. J. Syst. Dyn. Soc. 2002, 18, 501–531. [Google Scholar] [CrossRef]
- Sterman, J. System Dynamics: Systems Thinking and Modeling for a Complex World; Massachusetts Institute of Technology, Engineering Systems Division: Cambridge, MA, USA, 2002. [Google Scholar]
- Ulli-Beer, S. Dynamic Governance of Energy Technology Change; Springer: Berlin/Heidelberg, Germany, 2016. [Google Scholar]
- Ulli-Beer, S.; Kubli, M.; Zapata, J.; Wurzinger, M.; Musiolik, J.; Furrer, B. Participative Modelling of Socio-Technical Transitions: Why and How Should We Look Beyond the Case-Specific Energy Transition Challenge? Syst. Res. Behav. Sci. 2017, 34, 469–488. [Google Scholar] [CrossRef]
- Verhoog, R.; van Baal, P.; Finger, M. System dynamics simulation to explore the impact of low European electricity prices on Swiss generation capacity investments. In Energy Economy, Finance and Geostrategy; Springer: Cham, Switzerland, 2018; pp. 31–61. [Google Scholar]
- Walrave, B.; Raven, R. Modelling the dynamics of technological innovation systems. Res. Policy 2016, 45, 1833–1844. [Google Scholar] [CrossRef]
- Zapata, J.; Kubli, M.; Ulli-Beer, S. Prosumer communities as strategic allies for electric utilities: Exploring future decentralization trends in Switzerland. Energy Res. Soc. Sci. 2019, 57, 101219. [Google Scholar] [CrossRef]


| Socio-Technical Transitions (STT) Features | System Dynamic Modelling (SDM) Features |
|---|---|
| (1) Techno-economic details | SDM is suitable for including all of the techno-economic details relevant for modelling energy transition, such as marginal abatement costs of mitigation measures, energy consumption, emissions and energy demand. This is conducted through stocks, flows, variables, constants, equations and data inputs and outputs. |
| (2) Multi-dimensionality, systems perspective and interdisciplinarity | SDM is based on systems thinking and can address problems from a long-term, holistic systems perspective (SD characteristics 2, 6 and 7). |
| (3) Multiple actors and heterogeneous behaviours | SDM can represent actor behaviours and decision making (e.g., personal preferences or values, or perceptions of risks) and heterogeneity in agent populations (e.g., low vs. high-income earners) (SD characteristic 5). |
| (4) Path dependency, lock-in, inertia and self-reinforcement of change | SD models can represent the dynamics of path dependency and self-reinforcement of changes, through combinations of balancing and reinforcing loops, combined with stocks and flows. (SD characteristics 1, 3 and 4). |
| (5) Sustainability transition pathway dynamics | SD models can capture dynamics such as multiple equilibria and disequilibrium and can model system changes over long time periods. (SD characteristics 2, 3, and 7). |
| (6) Open-endedness and uncertainty | Uncertainty testing through Monte Carlo Analysis and other analytical tools can reveal the range and causes of uncertainty in model outputs. (SD characteristic 2). |
| ERRE | GIBM | ACFM | TEMPEST | TREES | |
|---|---|---|---|---|---|
| Landcape pressures | - Accounts for limits of fossil fuel reserves, land availability, and carbon emissions - Endogenous representation of climate change impacts - Exogenous changes in carbon taxes | - Exogenous changes in carbon taxes - Technical potential of renewable energy sources in the UK | - Climate change impacts are represented endogenously | - The landscape is climate science and international climate agreements that create mitigation targets. | - Considers different subsidy systems for solar PV and batteries and their impacts - Technology learning curves (exogenous) |
| Regime | - Price dynamics shift the demand from a source to another based on continuous pressures either from green tech growth or fossil fuel depletion. - Depletion of fossil fuels rises fossil prices - Green technology development (productivity) decreases cost of green tech - Biofuels work as intermediate product if green tech is slow | - Key Feedback loops in the economy - (Path-dependancy) of Decision mechanisms in the finance sector | - Fossil fuel industry resistance to renewable energy technologies - Special interest political lobbying competition for energy incentives – impacting price dynamics and capacity investments - Green energy advocates increase political lobbying efforts as climate change impacts increase | - Policy making (government), demand-side equipment regimes, and power sector technology and fuel regimes. | - Grid cost recovery - Solar potential scarcity effect - Various business dynamics of distributed flexibility solutions |
| Niches | - Decrasing LCOE of renewable energy technologies in the power sector due to (global and national) learning effects - Lock-in due to a lack of green finance and path-dependancy in energy-capacity investments | - Cost reduction effects on low-carbon technologies due to learning | - Niche innovations are new technologies, new behaviours, and new policies or societal responses. | - Peer effects - Incentives of grid cost recovery - Impacts of flexibility offers - Impacts of subsidy systems and technology learning curves |
Disclaimer/Publisher’s Note: The statements, opinions and data contained in all publications are solely those of the individual author(s) and contributor(s) and not of MDPI and/or the editor(s). MDPI and/or the editor(s) disclaim responsibility for any injury to people or property resulting from any ideas, methods, instructions or products referred to in the content. |
© 2024 by the authors. Licensee MDPI, Basel, Switzerland. This article is an open access article distributed under the terms and conditions of the Creative Commons Attribution (CC BY) license (https://creativecommons.org/licenses/by/4.0/).
Share and Cite
Hafner, S.; Gottschamer, L.; Kubli, M.; Pasqualino, R.; Ulli-Beer, S. Building the Bridge: How System Dynamics Models Operationalise Energy Transitions and Contribute towards Creating an Energy Policy Toolbox. Sustainability 2024, 16, 8326. https://doi.org/10.3390/su16198326
Hafner S, Gottschamer L, Kubli M, Pasqualino R, Ulli-Beer S. Building the Bridge: How System Dynamics Models Operationalise Energy Transitions and Contribute towards Creating an Energy Policy Toolbox. Sustainability. 2024; 16(19):8326. https://doi.org/10.3390/su16198326
Chicago/Turabian StyleHafner, Sarah, Lawrence Gottschamer, Merla Kubli, Roberto Pasqualino, and Silvia Ulli-Beer. 2024. "Building the Bridge: How System Dynamics Models Operationalise Energy Transitions and Contribute towards Creating an Energy Policy Toolbox" Sustainability 16, no. 19: 8326. https://doi.org/10.3390/su16198326
APA StyleHafner, S., Gottschamer, L., Kubli, M., Pasqualino, R., & Ulli-Beer, S. (2024). Building the Bridge: How System Dynamics Models Operationalise Energy Transitions and Contribute towards Creating an Energy Policy Toolbox. Sustainability, 16(19), 8326. https://doi.org/10.3390/su16198326