Abstract
Streambank erosion in agricultural landscapes contributes high amounts of sediment and total-P to surface water, resulting in the degradation of stream habitats and reduction in ecological services. Moreover, the implication of future climate change on bank erosion is also a growing concern. Streambank erosion rates from riparian forest buffers (RFo), grass filters (GFi), row-crops (RCr) and pastures, including fenced pastures (FPa), rotationally grazed pastures (RPa), intensive rotationally grazed pastures (IPa), and continuously grazed pastures (CPa), in three landform regions of Iowa, were measured over seven years. Bank erosion pins were measured seasonally (spring, summer and fall) in the first five years (2002–2006) and yearly for two more years (2007–2008). It was found that summer and spring seasons are the important ones since the relationships between erosion and precipitation were significantly “strong” in almost all the riparian practices, and precipitation was found to be the main factor driving streambank erosion. Streambank mean soil losses and soil total-P losses from RFo (23.3 tons km−1 yr−1 and 9.8 kg km−1 yr−1, respectively), GFi (31.1 and 9.9) and FPa (44.0 and 23.7) practices were all significantly lower than the grazing pasture practices, including RPa (142.3 and 58), CPa (255 and 105.1), IPa (234.6 and 122.7) and RCr fields (352.9 and 118.9). Also, RPa had significantly lower total-P loss than CPa, IPa and RCr practices (RFo, GFi, FPa < RPa < CPa, IPa, RCr). RCr practices had the highest streambank soil losses among all other riparian practices (RFo, GFi, FPa < RPa < IPa, CPa < RCr). The study showed that riparian conservation practices (RFo, GFi and FPa) showcased significant benefits in mitigating streambank soil loss and associated soil total-P load to streams. However, their effectiveness is highly sensitive to changing climatic conditions and the extent of spatiotemporal variations.
1. Introduction
Soil is one of the most valuable and critical natural resources that support numerous ecological services and impact human well-being. Degradation of soil by erosion is a major concern worldwide, and indeed, recent studies estimate an increase in streambank erosion and suspended sediment loads to streams under future climate change [1,2]. Thus, management should focus on its conservation to achieve production sustainability. In contrast, mismanagement can lead to soil becoming a serious problem through the process of erosion. Overall, water erosion has been found to cause more soil loss than wind erosion [3]. This is particularly true as a source of stream sediment load. The origin of stream water sediment and phosphorus load includes streambank erosion, streambed re-suspension, gully erosion and surface runoff [4,5,6,7].
Streambank erosion is a natural and important function of streams that provides diverse riparian habitats [8] and cannot and should not be eliminated entirely [9]. For sustainable management in agricultural watersheds, the key is to mitigate excessive erosion rates. In the last century, the rate of streambank erosion and its contribution to sediment and phosphorus loading has substantially increased [10,11]. The main reasons for the increase in streambank erosion rates and soil losses are the human-induced actions that have altered the natural fluvial geomorphologic settings of stream corridors [12]. Such actions include land use conversion primarily to agriculture in the riparian areas but also at the watershed scale, infrastructure construction along the streambank or in the channel, construction of reservoirs, mining (e.g., sand), etc. [13,14,15,16,17,18]. These human-induced actions can have significantly greater impacts than natural actions such as floods and droughts. Huma-induced actions in many cases increase the intensities of these natural actions.
In many agricultural watersheds, streambank erosion has been reported as the main stream sediment source, its contribution reaching up to 80–90% [10,19,20,21]. In the Midwestern United States, a wide range of 23–79% of the sediment load has been attributed to streambank erosion [22,23,24,25,26,27,28,29,30]. This eroded sediment and the attached phosphorus are major nonpoint source pollutants (NPSPs) of water bodies.
Excessive NPSP concentrations in the stream water are a major problem worldwide because they can degrade surface water bodies. Excessive sedimentation and high nutrient loads in stream waters (a) diminish water quality, thus increasing drinking water treatment costs and in some cases can even kill animals and potentially become a serious health risk to humans; (b) negatively impact freshwater environments, with the appearance of eutrophication that can kill species living in these environments; (c) substantial sediment deposited in downstream channels decrease recreational and river shipping actions and lessen reservoir storage areas, thus leading to flooding during heavy rain events [11,31,32,33,34,35,36,37]. In the United States, high sedimentation rates and nutrient loadings combined account for 20% of the freshwater bodies listed on the 303 (d) impaired list [38]. In these freshwater bodies, total maximum daily loads need to be established because of the Clean Water Act [12]. To effectively and accurately achieve this, a good understanding of the different sources and rates of NPSPs, along with the relationships between important factors (e.g., riparian practices, precipitation) that drive them, is necessary [10,39,40].
The many different interacting factors that influence and impact streambank erosion are a key reason for the large variation in the percentages of NPSP contributions reported in the previous paragraphs. These include vegetative cover and land management at both the watershed and riparian (reach) scales, riparian vegetation type and root density, bank material makeup and strength, antecedent soil moisture, topography, geology, fluvial geomorphology, channel parameters (e.g., planform curvature, width to depth ratio), stream order, channel confinement, climate with extreme events, weather cycles (especially precipitation patterns), hydrologic conditions, recurrence and degree of peak discharges, disturbance history and geomorphological events that alter hydrologic and related sediment regimes [4,5,41,42,43,44,45,46,47,48,49,50,51,52,53,54,55].
This study investigated the relationship between precipitation and streambank erosion and the effects of different riparian management practices on soil and soil total-P (total-phosphorus) losses via streambank erosion in agricultural watersheds. Thirty stream sub-reaches in three regions of Iowa were monitored for seven years. The riparian practices studied were: (a) re-established riparian forest (RFo), (b) grass filters (GFi), grazed fenced pastures with the cattle fenced out of the stream (FPa), intensive rotationally grazed pastures (IPa), rotationally grazed pastures (RPa), continuously grazed pastures (CPa) and row-crop fields (RCr). Soil and soil total-P losses by streambank erosion are expected to rise in the following order/trend: RFo < GFi < FPa < IPa < RPa < CPa < RCr. Overall, this study’s results will provide land and water managers with information for selecting the best riparian practices to mitigate streambank erosion and the associated stream water pollution. Such information should sustainably mitigate this environmental problem. Another significant feature of this study is the large dataset that was produced and utilized since very few studies have been able to collect and analyze datasets covering so many years (seven) located on so many different stream sub-reaches (30) along so many different riparian practices (seven) in three different geographical regions. To the best of our knowledge, such extensive spatial and temporal datasets based on field measurements do not exist worldwide.
The Study Scope
Thirty sub-reaches were monitored for streambank erosion in three different regions of Iowa, USA (Figure 1). Specifically, 10 sub-reaches were monitored in each of the following regions: central (CR), northeast (NER), and southeast (SER). Previous studies [49,56] have quantified and compared streambank erosion rates, severely eroded streambank lengths and areas, streambank total-P concentrations and bank soil bulk densities and soil and total-P erosion losses in these 30 sub-reaches, but for substantially shorter time periods (2002 to 2004) prior to this study. Since the short three-year study period did not fully reflect the impact of climatic factors on erosion, the duration of this study was extended to seven years in total. This provided us with a comprehensive dataset that improved our understanding of how the streambank erosion changed during dry and wet periods over the years. Streambank erosion by nature is episodic [56,57]. Thus, the monitoring continued in the fourth, fifth, sixth and seventh years for all 30 sub-reaches (from 2005 to 2008). Analyses of these datasets (erosion rate and activity, net erosion or deposition) were previously published by Zaimes et al. [58]. This study is complimentary since it focuses on understanding the relationship between erosion and precipitation and provides longer-term (seven-year) estimates of soil and total-P losses from the streambanks. This current study utilizes a seven-year-long dataset (2002–2008) from a large number of sub-reaches across three Iowa regions with numerous pinpoint measurements at each bank erosion site (approximately 25,500 pin measurements). This provides a long-term and detailed spatial and temporal dataset compared to most datasets with field measurements utilized in other studies. This allowed for a rigorous assessment of streambank erosion and precipitation, soil and soil total-P losses under different spatial (three regions) and temporal (seven years) conditions adjacent to agricultural and conservation riparian land uses in Iowa. Such detailed analysis of streambank erosion for the feasible and efficient management of freshwater is lacking not just in Iowa but also worldwide and the dataset from this study will help develop effective sustainable management plans for agricultural watersheds.
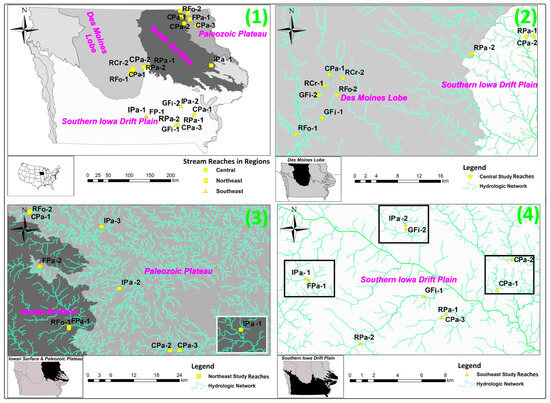
Figure 1.
Positions of the riparian practice sub-reaches in the state of Iowa, USA (1) and in each region (Central: (2), Northeast: (3) and Southeast: (4)). The stream networks and the landforms in Iowa are also illustrated. The sub-reaches in the Central Region (CR) are indicated with a circle, in the Northeast Region (NER) with a square, and in the Southeast Region (SER) with a triangle. The riparian land practices were row-crop fields (RCr), continuously grazed pastures (CPa), rotationally grazed pastures (RPa), intensive rotationally grazed pastures (IPa), riparian forest buffers (RFo), grass filters (GFi), and grazed fenced pastures with the cattle fenced out of the stream (FPa). The number after the riparian practice acronym indicates the number of replicates of a given practice in that specific region.
2. Materials and Methods
2.1. Characteristics of the Studied Regions and Sub-Reaches of the Streams
Each region in this study is located in a different landform that results in different watershed and stream characteristics (e.g., bank soil texture, bank with/depth and height) that can impact erosion processes differently (Figure 1, [49]). The 10 sub-reaches in the SER run through the Southern Iowa Drift Plain. This land formation has numerous rills, gullies, creeks and rivers as a result of weathering processes [59]. The Des Moines Lobe underlies the 10 sub-reaches in the CR, which is the youngest landscape in Iowa that was glaciated about ten thousand years ago. As a result, the region’s natural drainage system is not well developed. In addition, the terrain is relatively uniform, with uneven low hills and some ridges and wetlands (typically prairie potholes). Both the Iowan Surface and the Paleozoic Plateau are the main land formations for the remaining 10 sub-reaches selected in the NER. The Iowan Surface has many sloped areas that are gentle and lengthy [59]. Extensive freeze–thaw that loosened the soil material, which was later moved by many intense weathering activities, developed these slopes. The other landform, the Paleozoic Plateau, has similar characteristics to the Iowan Surface. Its glacial deposits are limited and the shallow limestone led to the formation of narrow valleys of numerous springs, caves and sinkholes [59]. The SER and NER are mainly occupied by various livestock grazing practices, especially in the riparian areas, while RCr is the main practice in the CR, even in riparian areas.
The selected stream sub-reaches were adjacent to riparian practices that were RFo, GFi, FPa, IPa, RPa, CPa and RCr. Not all practices were found in all three regions. The sub-reaches were selected if they met all of the following criteria: (1) belonged to private farmers, (2) had at least 300 m long stream lengths with the same practice on both riparian areas of the sub-reach, (3) their channel was in the widening stage, according to the channel evolution model [60], and (4) were located along first to third order streams [61]. The riparian grazing pasture practices were categorized by their stocking densities (animal units per month (AUM; [49])). The CR had stocking densities that ranged from 15 to 33.9 AUM, the NER from 9.6 to 22.5 AUM, and the SER from 7.6 to 29.3 AUM. For further details on the riparian practices in this study, please refer to the previous studies by Zaimes et al. [49,56,58].
2.2. Streambank Erosion Pins
Erosion pins have been used successfully to measure the bank erosion rates and associated soil losses [62,63]. It is preferred because it is practical and can monitor even the smallest changes in erosion with high accuracy [63]. The pin plot positions of erosion were randomly picked from all the existing severely and very severely eroded bank areas that were recorded initially along every riparian practice sub-reach [49]. Each riparian practice sub-reach had 50 pins on five (5) plots (10 pins in each plot). To capture spatial variability, each plot had two (2) rows with five (5) pins 1 m apart. The pins were inserted at one-third and two-thirds of the streambank height starting from the channel bed. The length and diameter of erosion pins were 762 mm and 6.4 mm, respectively, since erosion rates of up to 500 mm were observed in past erosion events [49]. Eroded pin lengths (outside the bank) were recorded almost every season (winter/spring, summer and fall) for the first five years, specifically from the fall of 2001 until the summer of 2006. Pins were not measured during the winter seasons because of snow accumulation on the soil bank surface, which made it hard to find the pins. In addition, streambanks are typically relatively inactive in Iowa during this period. To extend the temporal scale of the dataset, two additional yearly measurements were taken, specifically in the summers of 2007 and 2008. To estimate streambank changes, the last measurement of a pin was subtracted from the previous measurement. According to the subtraction results, a negative value indicated deposition around the pin whereas a positive value indicated erosion around the pin. In some intense rainfall events, pins were lost. Under this circumstance, we assumed an erosion rate of 600 mm for each erosion pin [49].
2.3. Severely and Very Severely Eroded Streambank Areas and Soil Bulk Densities of Stream Banks
The severely eroded lengths and areas of each riparian practice sub-reach were based on the assessment made by Zaimes [49]. Initially, all the severely eroding streambanks in each riparian practice sub-reach were identified, recorded and measured using a typical height pole and a tape measure. The total length of the severely eroded streambank length of a sub-reach was divided by the total sub-reach length to calculate the percentage of the severely eroded length of the sub-reach. This was done for each of the 30 sub-reaches. In addition, for every severely eroded streambank, its average eroding height and total length were measured in the field to calculate its specific area. All the severely eroded streambank areas were summed to estimate the total eroded bank area for each sub-reach. The streambank soil bulk density was also estimated, in a previous study, by analyzing soil field samples from the streambank face from three (3) out of the five (5) pin plots of each riparian practice sub-reach [49].
2.4. Soil and Soil Total-P Losses from Streambanks
The total streambank soil loss for each riparian practice sub-reach was estimated by multiplying the total streambank eroded area of the sub-reach by its mean streambank erosion rate and its mean soil bulk density [49]. To estimate bank soil total-P losses from each sub-reach, the total bank soil loss was multiplied by its mean streambank phosphorus concentration measured in a previous study. Mean concentrations of total phosphorus for each stream reach were measured by analyzing field soil samples from the streambank face from three (3) out of the five (5) pin plots in each sub-reaches [56]. Streambank soil or total-P loss was converted to a per kilometer length of streambank by dividing the total streambank soil or total-P loss for each riparian practice by its total streambank length (m) and multiplying by 1000 (m). This was necessary to examine differences between riparian practices since the study sub-reaches had unequal total streambank lengths.
2.5. Precipitation Data
Monthly data were gathered from the closest weather stations for all 30 sub-reaches [64]. Yearly and seasonal rainfall data were correlated to the streambank erosion rates. Rainfall data were also used as a covariate to evaluate bank erosion rates among the riparian practices.
2.6. Data Analysis
Overall, five-year seasonal and seven-year yearly datasets were analyzed to compare streambank erosion rates and soil and soil total-P losses among the riparian practices using the SPSS 19 statistical package [65]. For all the below-mentioned statistical analyses, differences and relationships between the variables were regarded as “significant” at the α = 0.05 level.
Pearson correlation analysis was conducted to determine the relationship between the streambank erosion rates and precipitation amounts using yearly and seasonal datasets: by the “seasons” and “riparian practices”, and by the “riparian practices for each season”. For this purpose, riparian practices (RFo, GFi, FPa, IPa, RPa, CPa and RCr), regions (CR, NER and SER), years (from 2002 to 2008), and season of the year (spring, summer and fall) for only the first five years) were selected as the main factors. By using both the seasonal (from 2002 to 2006) and yearly (from 2002 to 2008; see Section 3.1: illustrated by the Venn Diagram) datasets, streambank erosion rate differences between the riparian practices were evaluated using analysis of covariance (ANCOVA), with riparian practices as the main factor and precipitation as a covariate to help explain the results [66]. A one-way ANOVA, together with the Duncan multiple range test, was utilized to evaluate whether there were statistically significant differences in streambank soil and soil total-P losses based on riparian practice. A two-way analysis of variance (ANOVA) was performed to examine whether soil and soil total-P losses differed according to riparian practice, region and year parameters. Duncan’s multiple range test was used to compare mean values based on the ANOVA results to find significant differences. If the normality assumption for ANOVA was not met, the data were transformed [67] prior to analysis.
3. Results and Discussion
3.1. Precipitation and Streambank Erosion Relationships and Erosion Rate Differences between Riparian Practices
Streambank erosion was a major source of sediment and nutrients to the stream loads, leading to their impairment [56,68]. In most cases, the precipitation amounts and/or related high discharge events are the main erosive factors affecting streambank erosion [5,28,69]. The correlation analysis of the seasonal dataset, with measurements during the fall, spring and summer from the first five years of this study (2002–2006), showed that the relationship between streambank erosion rates and total precipitation amounts (r = 0.36) across all three regions of Iowa was significant. The relationship between the erosion rates and precipitation was also significant for each season of the year (fall, r = 0.21; spring, r = 0.34; and summer, r = 0.46). Note that when the “r” value falls into the range of 0.30 to 0.50, then it is regarded as a “moderate” relationship, if it is greater than 0.50, then it is regarded as a “strong” relationship. If the “r” value is smaller than 0.30, then it is regarded as a “weak” relationship. Results revealed that erosion in the fall seasons was least responsive to precipitation and its associated discharge (r = 0.21) because of the lower precipitation amount received during the fall (fall: 20.6 cm, spring: 24.4 cm, summer: 41.2 cm on average) and the streambank soil moisture and temperature (below freezing) conditions that increased the soil’s resistance to loosening and detachment. These conditions create a tendency to slow down erosional processes for the given regional climatic period in Iowa [6,39,70,71,72].
In regard to the riparian practices, there were significant relationships between seasonal precipitations and seasonal streambank erosion rates from RFo (r = 0.47), GFi (r = 0.36), FPa (r = 0.53), CPa (r = 0.39), RPa (r = 0.39) and IPa (r = 0.44) practices. Similarly, significant relationships between erosion rates and precipitation were found for the yearly dataset (2002–2008) for each practice; specifically, RFo (r = 0.49), GFi (r = 0.41), FPa (r = 0.64), CPa (r = 0.36), RPa (r = 0.56) and IPa (r = 0.53). When investigating the correlation between erosion rates and precipitation from each practice and for each season, it was found that in most cases, summer and spring seasons were the most significant. This is because of the strong relationship between erosion and precipitation since precipitation during the spring and summer seasons directly contributes to high discharges that can lead to streambank erosion. Significantly “strong” relationships were also found for many of the riparian practices in relation to seasons, particularly summer and spring (RFo summer season, r = 0.65; GFi summer, r = 0.46; FPa spring and summer, r = 0.69 and 0.76; CPa spring and summer, r = 0.41 and 0.42; RPa spring, r = 0.53; IPa fall and summer, r = 0.48 and 0.84).
In this study, it was found that the relationship between streambank erosion and the amounts of precipitation was in many cases either “moderately” or “strongly” significant for given riparian practices. This relationship got even stronger when the practice was specified within a season, particularly spring and summer. These results indicate that precipitation is the main driving factor affecting streambank erosion. The precipitation recorded at the weather stations closest to the riparian practice sub-reaches can be used to account for a significant portion of the streambank failure that takes place under different frequencies, intensities and timings of rainfall that were not directly studied in this work, as well as the single extreme rainfall event and bank soil–water conditions (moisture and temperature) prior to the erosion event. Another study [52] also found that approximately three-fourths of the streambank erosion variability could be explained by the peak stream discharge events of stream reaches adjacent to grazed pastures. This study also indicated that the remaining one-fourth of the variability in erosion could be linked to the duration of the high discharge flows [73] and streambank soil temperature and moisture content prior to major rainfall events [70]. Significant positive relationships between streambank erosion and stream power with greater flow rates [28,69,73] or discharges from larger catchment sizes [53,74] were also found in other studies.
Significant differences were found in yearly (from 2002 to 2008) streambank erosion rates between riparian practices (Figure 2). Specifically, RFo (5.7 cm) and others [RCr (23.4 cm), IPa (17.1cm) and CPa (15.3 cm)], GFi (6.2 cm) and others [RCr (23.4 cm), IPa (17.1 cm), CPa (15.3 cm)], and RCr (23.4 cm) and both RPa (13.3 cm) and FPa (9.3 cm) practices were significantly different for the seven years of study (Figure 2). Similar to the yearly dataset, the seasonal dataset for the erosion rates from 2002 to 2006 had the same significant differences between the same riparian grazing practices. Additionally, differences between FPa (1.96 cm) and IPa (4.99 cm) were found to be significant with the seasonal dataset. The seasonal (from 2002 to 2006) mean erosion rates for each riparian land use were as follows: RFo (0.76 cm), GFi (0.97 cm), FPa (1.96 cm), RPa (2.65 cm), CPa (3.95 cm), IPa (4.99 cm) and RCr (6.99 cm). Overall, the results revealed that the conservation practices RFo, GFi and FPa were highly effective in reducing streambank erosion. When applying precipitation as a covariate in the data analysis using the entire dataset from all the regions, the results of streambank erosion rates mainly agreed with the results of a past study [58]. Based on analysis of the regional dataset, the findings of that study showed significant differences in yearly erosion rates between conservation (RFo and GFi) and agricultural practices (CPa and RCr). In terms of grazing practices, in this study, FPa and RPa showed some indications of reducing streambank erosion compared to CPa and IPa practices (Figure 2).
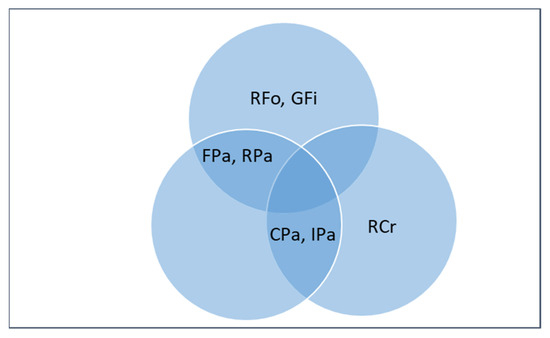
Figure 2.
Significant differences in mean yearly erosion rates from 2002 to 2008 between the riparian practices, including RFo, GFi, FPa, RPa, IPa, CPa and RCr illustrated using the “Venn Diagram”. Note that riparian practices within the round cluster and those not shared with other clusters indicate “significant differences” from each other. Shared riparian practices between the clusters indicate “no significant differences” between them.
The variability in streambank erosion is affected by many interacting factors, including watershed geology, hydrology, topography, climate and land use at both the watershed and site scales, bank soil composition, bank vegetation cover, stream morphologic characteristics such as stream stages in channel evolution, channel widening and degradation, bed slope and sinuosity, stream order and discharge and catchment size [27,39,47,49,53,74,75,76,77,78]. Despite the challenging issues imposed by the natural diversity in stream processes, there is a clear indication from the results of this study that implementing conservation practices like RFo, GFi, FPa and RPa reduces streambank erosion rates and the associated soil and P losses as presented in the following sections.
There is also an indication that reduced stocking rates on grazed pastures can reduce eroded streambank areas and bank soil and P losses via runoff and compaction since it reduces trampling effects and stabilizes the banks with higher vegetative cover [6,7,79,80,81,82]. Streambank soil bulk density or compaction and eroded streambank areas or bank lengths are important indicators when accounting for streambank soil and total-P losses from the specific land use impacts, especially for grazed pastures [6,49].
3.2. Riparian Practices Streambank Soil and Soil Total-P Losses
Streambank soil losses were also significantly lower for all conservation practices (RFo, GFi and FPa) compared with grazing practices (RPa, IPa, CPa) and RCr (Figure 3). The analysis also revealed that RCr practices had significantly higher soil losses than all other practices (RFo, GFi, FPa < RPa < IPa, CPa < RCr; Figure 3). Similarly, all the conservation practices (RFo, GFi and FPa) had significantly lower soil total-P losses in comparison to all the other riparian practices in the study (Figure 3). Also, RPa had significantly lower total-P losses than CPa, IPa and RCr practices (RFo, GFi, FPa < RPa < CPa, RCr, IPa; Figure 3). Similarly, a review of streambank soil losses in Iowa [72] also recorded low rates of soil and total-P losses from RFo, GFi and FPa, indicating that these practices should be adopted for the sustainable management of riparian corridors to improve stream water quality, biotic integrity, and ecological services [81,83,84,85].
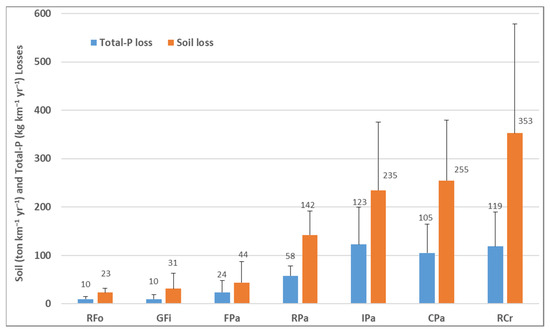
Figure 3.
Differences in average streambank soil and total-P losses between the practices, including RFo, GFi, FPa, RPa, IPa, CPa and RCr. The standard error is displayed using lines in each bar.
Low streambank soil losses from the conservation practices were not only the result of low streambank erosion rates (see Figure 2), but also due to the low lengths and areas of severely eroded streambanks compared to grazed pastures (CPa, RPa and IPa) and RCr. Grazed pastures and RCr always had greater than 25% of their total lengths severely eroded [49]. Other Iowa studies related to grazing and row-crop management have also recorded very high percentages of eroded streambank lengths, some even as high as 54% of the total length [72].
In this seven-year study, the streambank soil and total-P losses from the riparian practices ranged, respectively, as follows: RFo (9.1–31.6 ton/km/yr, 3.7–16.9 kg/km/yr), GFi (9.2–86.9 ton/km/yr, 3.2–25.4 kg/km/yr), FPa (8.7–104.5 ton/km/yr, 3.9–57.8 kg/km/yr), RPa (81.9–212.8 ton/km/yr, 32.9–86.1 kg/km/yr), IPa (106.0–497.0 ton/km/yr, 40.8–249.2 kg/km/yr), CPa (91.8–455.9 ton/km/yr, 49.1–223.2 kg/km/yr) and RCr (127.3–578.4 ton/km/yr, 48.5–189.3 kg/km/yr).
3.3. Regional Streambank Soil and Soil Total-P Losses from Riparian Practices
Riparian land use practices in NER had the lowest streambank soil losses (111.6 ton/km/yr) compared to CR (182.9 ton/km/yr) and SER (162.1 ton/km/yr) practices, which were significantly different. As expected, RPa in the CR had significantly lower soil losses than CPa and RCr and significantly higher soil losses than RFo and GFi (Figure 4). In the CR, no significant differences in soil losses were found between RCr and CPa practices (Figure 4), in contrast to the general trend/order of all seven practices in all three regions illustrated in Figure 3 (RFo, GFi, FPa < RPa < IPa, CPa < RCr). This is because both practices had the highest eroded bank lengths (RCr: 44% and CPa: 39%, [49]). In the recently glaciated landform of “Des Moines Lobe” [62], sub-reaches have highly incised channels with tall vertical banks. In these incised channels, soil losses via streambank erosion are primarily driven by the stream morphologic and hydrologic features. In contrast, grazing impacts dominated mostly in grazing practices in the older landforms of the NER and SER that had gently inclined streambanks. Similarly, another study in southern Iowa [6] estimated that the percentage of eroded bank lengths was significantly correlated with livestock density in grazing pastures where the stream banks gently allow easy access to the stream. The highest soil losses were expected in the relatively recently glaciated CR since many of the channels of the sub-reaches were incised (Channel Evolution Model; Bank stages II and III) and straightened. In such banks, gravitational pressure in the bank column was an important factor since it can collapse banks by increasing soil bulk unit weight and associated pore water pressure when saturated at high flow [62,71,86,87].
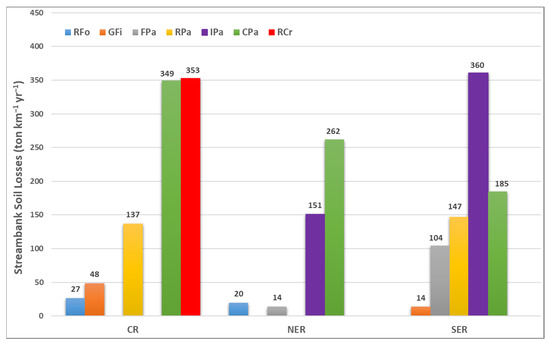
Figure 4.
Differences in average streambank soil losses from riparian practices in three study regions: Central (CR), Northeast (NER) and Southeast (SER). Note that the bars in the CR and NER are not clustered together like those in the SER because not all practices are present in those regions.
As expected, both RFo and FPa had significantly low soil losses compared to CPa and IPa in the NER (Figure 4). Also, CPa had significantly higher soil loss than IPa in the NER. In the SER, there were no significant differences between FPa and both RPa and CPa. IPa in the SER had significantly higher soil losses than all other grazing practices (Figure 4), something that was not expected. Unlike other regions, the data from the SER showed no benefit in adopting IPa as a best management grazing practice to reduce streambank soil loss. This could have been related to improper implementation of these practices (personal observations), since the eroded bank lengths occupied up to 32% of the total bank length, and bank heights as high as 2.1 m were recorded [49]. These particular sub-reaches are highly responsive to stream stage changes due to the longer and taller eroded bank lengths, as well as other stream morphologic (e.g., slope, sinuosity) features that were not studied in this case but have been recognized by other researchers [53,84]. Additionally, along with grazing impacts, the stronger relationship between erosion rate and precipitation from these practices (FPa spring and summer: r = 0.69 and 0.76; IPa fall and summer: r = 0.48 and 0.84) implies that streambank erosion in those stream reaches was primarily affected by the climatic factors, particularly precipitation, and responding hydro-morphologic features of streams. Specifically, higher precipitation and erosion rates from FPa in summer seasons (42 cm, 2.6 cm, respectively; r = 0.76) and from IPa in summer seasons (36 cm, 3.5 cm, respectively; r = 0.84) contributed to high soil losses from these practices in the SER (Figure 5).
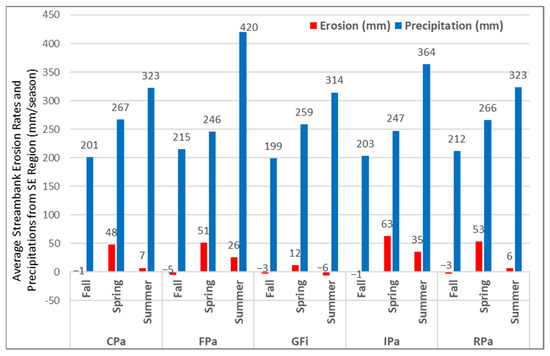
Figure 5.
Differences in streambank erosion rates and precipitation in the SER.
Riparian land use practices in the NER (55.5 kg/km/yr) had significantly lower soil total-P losses than practices in the SER (77.1 kg/km/yr). The CR (64.9 kg/km/yr) did not have any significant differences from other regions. In the SER, total-P losses did not differ significantly between CPa and both FPa and RPa and between FPa and RPa (Figure 6), contrary to the general trend illustrated in Figure 3 (RFo, GFi, FPa < RPa < CPa, RCr, IPa). There were significant differences between CPa and IPa practices in the NER and between GFi and FPa in the SER (Figure 6). Only in the CR was the general trend (RFo, GFi, FPa < RPa < CPa, RCr, IPa) followed across the riparian practices.
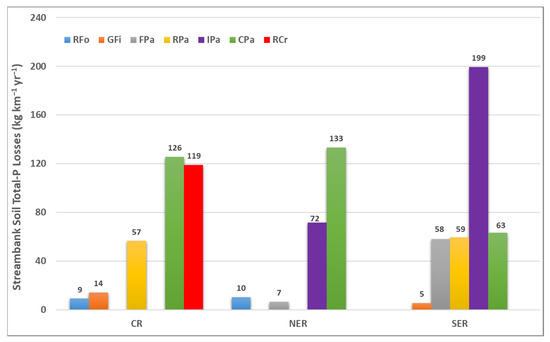
Figure 6.
Differences in average streambank soil total-P losses from the riparian practices in the three study regions: Central (CR), Northeast (NER) and Southeast (SER).
Data analysis for the total-P losses within the region with all 30 sub-reaches across three Iowa regions showed that riparian practices in the NER and CR (Figure 6) mostly followed the general trend presented in Figure 3. In some cases, findings from the NER further supported the expected outcomes (RFo, GFi, FPa < IPa < CPa), apart from the general trend (RFo, GFi, FPa < RPa < IPa, CPa); in other words, IPa had significantly lower P losses than CPa in the NER, which was something expected to find, while, on the other hand, the practices in the SER usually masked the expected outcomes, specifically FPa and IPa, with the higher soil and P loss values (Figure 6) and probably impacted the results of the general trend presented with all 30 practices in Figure 3.
Trees improve the mechanical reinforcement of the bank soil but overall, the combination of grass, shrubs and trees in riparian buffers should provide even higher effectiveness for both surface and bank erosion protection [88,89]. Vegetated river bends have been reported to have substantially less erosion than non-vegetated bends [90,91]. Non-vegetated banks have non-existent or very reduced vegetation cover and substantially less or non-existent root mass thus, decreased potential for erosion protection [92]. This is why streambanks along row-crop fields with less vegetative cover have a very high susceptibility to water erosion [93,94].
Belsky et al. [95] reviewed numerous studies and concluded that livestock grazing in most cases destabilized streambanks. Livestock grazing in riparian areas significantly increased streambank erosion by three to six times compared to ungrazed areas or native forests [79,96]. The increased streambank instability has to do with livestock activities and trampling on ramps that result in the mechanical breakdown of bank soil, thus increasing erosion susceptibility. Indirectly, grazing destabilizes streambanks since the cattle eliminate the vegetation that protects the streambank, thus increasing the potential for sediment production [7,97,98,99,100]. Overall, the removal of trees has been found to significantly increase streambank erosion [101].
3.4. Streambank Soil and Soil Total-P Losses from Riparian Practices across the Study Regions
Since not all riparian practices were found in all three study regions, all the datasets across the regions were pooled and analyzed to consider the impacts of the spatial scale on the variation in streambank soil and total-P losses. Generally, there were distinctive patterns of soil and total-P losses, with the same types of riparian land uses across the three study regions showing similar effects, regardless of the region they were situated in. Table 1 showed that, regardless of the regions, the effects of the given riparian practices on the streambank soil and total-P losses mostly followed the general trend illustrated in Figure 3. The riparian conservation practices across the regions in “group 1” (SER_GFi, NER_FPa, NER_RFo, CR_RFo and CR_GFi) had significantly lower soil and soil total-P losses than the practices in the other “groups” of land uses (Table 1). There was only one exception: the FPa practice (“group 2”) in the SER had higher losses of soil (104.3 ton/km/yr) and total-P (57.8 kg/km/yr) than its counterpart in the NER (Table 1). In terms of grazing practices, RPa (CR-RPa and SER-RPa) had significantly lower soil and total-P losses (“group 4” and “group 2”, respectively) than the CPa (NER-CPa and CR-CPa; “group 5 & 6” and “group 3”, respectively; Table 1). Unexpectedly, IPa from the SER (SER_IPa) had significant differences in most cases and the highest soil and total-P losses compared to other grazing practices and as well as with all the conservation practices across all the regions (Table 1).

Table 1.
Means and groups for the soil (ton/km/yr) and soil total-P (kg/km/yr) losses between the land use practices based on the study regions.
As stated in several past studies, conservation practices typically resulted in significantly reduced streambank soil and P losses by stabilizing them compared to reaches with agricultural practices or limited or no woody vegetative protection [6,90]. In contrast, studies that showed no significant reduction in erosion and soil loss with conservation practices were probably due to stream channelization, a legacy of historic land use, upstream factors and changes in the stream’s hydro-morphologic characteristics [68,69,75]. In this seven-year-long comprehensive study, it was clearly demonstrated that the utilization of conservation practices such as RFo, GFi and FPa had major positive impacts on streambank soil and total-P loss reduction.
As for grazing management, in most cases, the proper utilization of RPa and IPa practices showed significant reductions in streambank soil and P losses compared to CPa practices. These robust findings over such an extended duration of study are the first in the literature because of the extensive spatiotemporal aspect (over seven years and seven riparian practices across three regions) and the comprehensively measured features of streambank erosion rate, severely eroded lengths and areas, soil bulk density and total soil losses [49]. This reduced the effects of the diversity of the controlling factors of streambank erosion and singled out riparian practice impacts compared to short-term and small-scale studies where the effects of best-grazed management on bank erosion were predominantly masked by the up-stream varying land uses and imposed hydrologic and morphologic alterations in stream channels throughout the longitudinal setting [53,72]. Moreover, the effectiveness of the improved grazing management was primarily evident in other bank features such as eroded length, compaction, vegetative cover, manure cover, suspended sediment and P losses to streams [6,82,102].
3.5. Yearly Streambank Soil and Soil Total-P Losses from the Riparian Practices
Streambank soil losses (ton/km/yr) for the study years 2002 to 2008 were in the following order from smallest to largest: 37.3 (2006) < 100.6 (2003), 127.1 (2005), 127.5 (2002) < 199.9 (2004), 221.8 (2007) < 314.4 (2008). Note that the “<” indicates significant differences between the years. The year 2006 had the lowest soil losses while the year 2008 had the highest soil losses. Both years (2006 and 2008) were significantly different from all other years. The years 2004 and 2007 had significantly higher soil losses than the years 2003, 2005 and 2002.
When we assessed the streambank soil loss differences between the riparian practices for each individual study year, the general trend was as expected (Figure 3). For instance, in 2002, 2004 and 2005, soil losses differed significantly between conservation (RFo, GFi and FPa) and agricultural practices (RCr, CPa and IPa). An exception was observed in 2005, with IPa not being significantly different from GFi and FPa (Figure 7). There were also significant differences between RCr and both CPa and RPa in 2002, RCr and RPa, and CPa and IPa in 2004, RPa and CPa, and RCr and both RPa and IPa in 2005 (Figure 7). In 2003, there were significant differences between the conservation practices (RFo, GFi, and FPa) and two agricultural practices (RCr and CPa). In that year, RCr also differed significantly from RPa and IPa. In 2006, soil losses did not differ significantly between the studied practices. In the last two years of study, 2007 and 2008, there were significant differences between the conservation practices (RFo, GFi and FPa) and all other agricultural practices, including RCr, CPa, IPa and RPa practices, following the general trend illustrated in Figure 3. In these two years, significant differences were also found between RPa and CPa practices. The soil loss differences between RPa and RCr practices were also significant in the year 2007 (Figure 7).
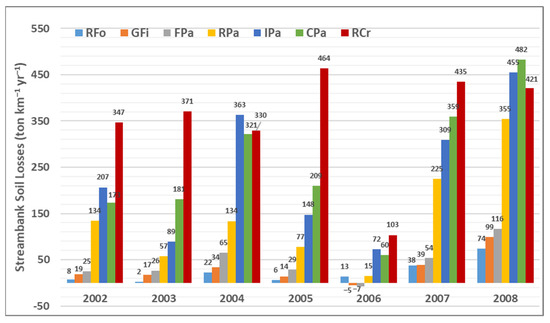
Figure 7.
Average streambank soil losses from the riparian land use practices based on the study years from 2002 to 2008.
The imposed spatiotemporal effects on bank erosion were important criteria for the assessment of bank erosion and associated soil and P losses [53,72,74]. In this study, the lowest and highest soil loss variability in bank erosion among the riparian practices were captured in the years 2006 and 2008, respectively, likely due to controlling factors such as changing climatic conditions, primarily precipitation, across the state, and responding stream hydro-morphologic regulations by stream flow, gradient and sinuosity. The effectiveness of the different riparian practices to reduce streambank erosion was more evident in 2007 and 2008 where the differences in streambank erosion were highest between the conservation (RFo, GFi and FPa) and the traditional riparian practices of CPa and RCr. This indicates the importance of understanding the effects of various riparian practices on bank erosion with an extended spatial (three regions and 30 sub-reaches) and temporal (many practices with many seasons over a seven-year period) dataset, as in this study. Researchers have stated that long-term monitoring datasets for streambank and riverbank studies and the associated sediment load in response to different precipitation events improve understanding of riparian practices’ effects on bank erosion and channel alterations [6,28,42,78].
Similar to the soil loss trends, the soil total-P losses (kg/km/yr) across the riparian practices were in the following order: 16.3 (2006) < 43.6 (2003), 52.5 (2002), 53.8 (2005) < 88.6 (2004), 92.3 (2007) < 136.6 (2008). The year 2006 had the lowest soil total-P loss while the year 2008 had the highest total-P loss. As with soil losses, both years (2006 and 2008) were significantly different from all other years. The years 2004 and 2007 differed significantly based on total-P loss compared to the years 2002, 2003 and 2005. The significant differences in yearly total-P losses are somewhat similar to the yearly soil losses among the riparian practices. In 2002, 2004 and 2005, there were significant differences in total-P loss between conservation practices (RFo and GFi) and the other agricultural practices, including RCr, CPa and IPa (Figure 8). There were significant differences between FPa and both RCr and IPa in 2002, between FPa and both CPa and IPa, and RPa and both IPa and CPa in 2004, and between FPa and both RCr and CPa, and RCr and RPa in 2005 (Figure 8). In 2003, there were significant differences in total-P loss between the conservation practices (RFo, GFi, and FPa) and the agricultural practices RCr and CPa. During this year, RPa was also significantly different from CPa and RCr. In 2006, total-P loss between the studied practices did not differ significantly (Figure 8). The years 2007 and 2008 had similar total-P loss findings. There were significant differences between the conservation practices (RFo, GFi and FPa) and all the other practices, including RCr, CPa, IPa and RPa, following the general trend illustrated in Figure 3. An exception was that there was no significant difference between FPa and RPa in 2007 and between FPa and RCr in 2008. Significant differences were also found between RPa and IPa in 2007, and IPa and both RPa and RCr in 2008 (Figure 8).
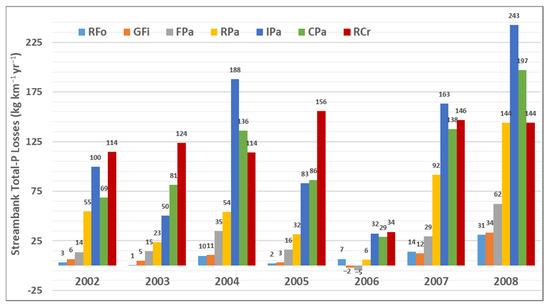
Figure 8.
Average streambank soil total-P losses from the riparian land use practices based on the study years from 2002 to 2008.
The data analysis based on the study years showed that the year 2006 had significantly lower soil and soil total-P losses, while the year 2008 had the highest losses of soil and total-P, which were significantly different from all other study years. As discussed in the above paragraphs, except for the year 2006, results from all other study years mostly showed a trend similar to the general trend for the soil (RFo, GFi, FPa < RPa < IPa, CPa < RCr) and total-P losses among the land use practices presented in Figure 3 (RFo, GFi, FPa < RPa < CPa, RCr, IPa). The significant differences in soil and soil total-P loss trends between the conservation and agricultural practices became more evident in the study years of 2007 and 2008, while in the other study years, especially for the year 2006, the differences were not significant (Figure 7 and Figure 8). The complex nature of streambank erosion with a high yearly and seasonal variation has also been stated in several other studies [6,10,29,58] as well as in the previous (precipitation and erosion relationship) Section 3.1.
4. Conclusions
This and the previous Iowa studies conducted by the authors concluded that precipitation and related discharge were found to be the main driving force of streambank erosion, coupled with other causative and localized effects (the interaction of the streambank erosion factors; eroded streambank length, bank soil content and moisture, bank soil bulk density and vegetation cover, stream morphologic features; meandering and slope etc.) on stream hydro-geomorphologic alterations. A “strong” relationship between bank erosion and precipitation in this study was found for many riparian practices in certain seasons, specifically spring and summer, and higher erosion rates from these seasons indicated the effects of temporal scale on bank erosion. This also indicates the predominance of both gravitational and hydraulic processes on streambank erosion in response to the amount of precipitation.
In terms of riparian land uses, streambanks along the conservation practices showed significant evidence that they can reduce bank soil and total-P losses compared to other agricultural practices. The proper implementation of the best grazing practices (RPa and IPa), also, in most cases, indicated a strong potential for reducing soil and total-P losses compared to CPa. Overall, all best management practices (particularly RFo, GFi, FPa, and to a lesser degree, RPa and IPa) in this study showcased substantial improvements in reducing streambank soil and soil-P losses by stabilizing the streambanks. This stabilization resulted in reduced bank erosion rates, eroded bank areas and stream lengths, which, in turn, reduced the bank soil and soil total-P losses.
When developing sustainable watershed management to mitigate erosion and NPSPs to streams, understanding the effects of spatiotemporal variations and stream hydraulic connectivity on streambank erosion is critical for accurate assessment and establishment of riparian conservation practices. To maximize the benefit of conservation practices, policymakers and land managers should consider their establishment based on the watershed scale and the longitudinal view along the stream corridor rather than on a specific reach or site-scale focus. This would help reduce the effects of precipitation and responding hydro-geomorphologic alteration on streambank erosion along the stream corridors. Finally, the implication of this study could be applicable to other regions of countries that have similar climatic conditions, stream morphologic characteristics and extensive riparian land uses.
Author Contributions
Conceptualization, methodology, writing—original draft preparation, writing—review and editing, formal analysis, M.T., G.N.Z., A.K. and R.C.S. All authors have read and agreed to the published version of the manuscript.
Funding
This research was funded by the Iowa Department of Natural Resources and the Leopold Center for Sustainable Agriculture, a State of Iowa Institution located at Iowa State University and through the University of Missouri Center for Agroforestry under cooperative agreements AG-02100251 with the USDA-ARS Dale Bumpers Small Farms Research Center, Booneville, Arkansas, and C R 826704-01-0 with EPA.
Data Availability Statement
The data presented in this study are available on request from the corresponding author.
Acknowledgments
For their generous help in the field and laboratory, we would like to thank the following students: J. Herring, L.A. Long, P. Woolery, J. Lancial, S. Molitor, Z. DeYoung, A. Wendt, K. Kult, L. Barney, J. Palmer, G. Johnsen and C. Yıldırım. Finally, we would also like to thank the landowners for allowing us to use their farms as research sites.
Conflicts of Interest
The authors declare no conflicts of interest.
References
- Stryker, J.; Wemple, B.; Bomblies, A. Modeling the impact of changing climatic extremes on streamflow and sediment yield in a northeastern US watershed. J. Hydrol. Reg. Stud. 2018, 17, 83–94. [Google Scholar] [CrossRef]
- Neverman, A.J.; Donovan, M.; Smith, H.G.; Ausseil, A.; Zammit, C. Climate change impacts on erosion and suspended sediment loads in New Zealand. Geomorphlogy 2023, 427, 108607. [Google Scholar] [CrossRef]
- Zhang, Y.-G.; Nearing, M.A.; Liu, B.Y.; Van Pelt, R.S.; Stone, J.J.; Wei, H.; Scott, R.L. Comparative rates of wind versus water erosion from a small semiarid watershed in southern Arizona, USA. Aeolian Res. 2011, 3, 197–204. [Google Scholar] [CrossRef]
- Lammers, R.W.; Bledsoe, B.P. Quantifying pollutant loading from channel sources: Watershed-scale application of the River Erosion Model. J. Environ. Manag. 2019, 234, 104–114. [Google Scholar] [CrossRef] [PubMed]
- Ross, D.S.; Wemple, B.C.; Willson, L.J.; Balling, C.M.; Underwood, K.L.; Hamshaw, S.D. Impact of an extreme storm event on river corridor bank erosion and phosphorus mobilization in a mountainous watershed in the northeastern United States. JGR Biogeosci. 2019, 124, 18–32. [Google Scholar] [CrossRef]
- Tufekcioglu, M.; Isenhart, T.M.; Schultz, R.C.; Bear, D.A.; Kovar, J.L.; Russell, J.R. Stream bank erosion as a source of sediment and phosphorus in grazed pastures of the Rathbun Lake Watershed in Southern Iowa, United States. J. Soil Water Conserv. 2012, 67, 545–555. [Google Scholar] [CrossRef]
- Packett, R. Riparian erosion from cattle traffic may contribute up to 50% of the modelled streambank sediment supply in a large Great Barrier Reef river basin. Mar. Pollut. Bull. 2020, 158, 111388. [Google Scholar] [CrossRef]
- Florsheim, J.L.; Mount, J.F.; Chin, A. Bank erosion as a desirable attribute of rivers. BioScience 2008, 58, 519–529. [Google Scholar] [CrossRef]
- Henderson, J.E. Environmental designs for streambank protection projects. Water Resour. Bull. 1986, 22, 549–558. [Google Scholar] [CrossRef]
- Fox, G.A.; Purvis, R.A.; Penn, C.J. Streambanks: A net source of sediment and phosphorus to streams and rivers. J. Environ. Manag. 2016, 181, 602–614. [Google Scholar] [CrossRef]
- Midgley, T.L.; Fox, G.A.; Heeren, D.M. Evaluation of the bank stability and toe erosion model (BSTEM) for predicting lateral retreat on composite streambanks. Geomorphology 2012, 145–146, 107–114. [Google Scholar] [CrossRef]
- Kessler, A.C.; Gupta, S.C.; Brown, M.K. Assessment of river bank erosion in Southern Minnesota rivers post European settlement. Geomorphology 2013, 201, 312–322. [Google Scholar] [CrossRef]
- Iakovoglou, V.; Zaimes, G.N.; Gounaridis, D. Riparian areas in urban settings: Two case studies from Greece. Int. J. Innov. Sustain. Dev. 2013, 7, 271–288. [Google Scholar] [CrossRef]
- Kesel, R.H. Human modifications to the sediment regime of the Lower Mississippi River flood plain. Geomorphology 2003, 56, 325–334. [Google Scholar] [CrossRef]
- Surian, N.; Rinaldi, M. Morphological response to river engineering and management in alluvial channels in Italy. Geomorphology 2003, 50, 307–326. [Google Scholar] [CrossRef]
- Batalla, R.J.; Gomez, C.M.; Kondolf, G.M. Reservoir-induced hydrological changes in the Ebro River basin (NE Spain). J. Hydrol. 2004, 290, 117–136. [Google Scholar] [CrossRef]
- Vanacker, V.; Molina, A.; Govers, G.; Poesen, J.; Dercon, G.; Deckers, S. River channel response to short-term human-induced change in landscape connectivity in Andean ecosystems. Geomorphology 2005, 72, 340–353. [Google Scholar] [CrossRef]
- Zaimes, G.N.; Gounarids, D.; Iakovoglou, V.; Emmanouloudis, D. Riparian area studies in Greece: A Literature review. Fresenius Environ. Bull. 2011, 20, 1470–1477. [Google Scholar]
- Caitcheon, G.G.; Olley, J.M.; Pantus, F.; Hancock, G.; Leslie, C. The dominant erosion processes supplying fine sediment to three major rivers in tropical Australia, the Daly (NT), Mitchell (Qld) and Flinders (Qld) Rivers. Geomorphology 2012, 151–152, 188–195. [Google Scholar] [CrossRef]
- Kronvang, B.; Andersen, H.E.; Larsen, S.E.; Audet, J. Importance of bank erosion for sediment input, storage and export at the catchment scale. J. Soils Sediments 2013, 13, 230–241. [Google Scholar] [CrossRef]
- Olley, J.; Brooks, A.; Spencer, J.; Pietsch, T.; Borombovits, D. Subsoil erosion dominates the supply of fine sediment to rivers draining into Princess Charlotte Bay, Australia. J. Environ. Radioact. 2013, 124, 121–129. [Google Scholar] [CrossRef]
- Kelley, D.W.; Nater, E.A. Historical sediment flux from three watersheds into Lake Pepin, Minnesota, USA. J. Environ. Qual. 2000, 29, 561–568. [Google Scholar] [CrossRef]
- Sekely, A.C.; Mulla, D.J.; Bauer, D.W. Streambank slumping and its contribution to the phosphorus and suspended sediment loads of the Blue Earth River, Minnesota. J. Soil Water Conserv. 2002, 57, 243–250. [Google Scholar]
- Thoma, D.P.; Gupta, S.C.; Bauer, M.E.; Kirchoff, C.E. Airborne laser scanning for riverbank erosion assessment. Remote Sens. Environ. 2005, 95, 493–501. [Google Scholar] [CrossRef]
- Kessler, A.C.; Gupta, S.C.; Dolliver, H.A.S.; Thoma, D.P. Lidar quantification of bank erosion in Blue Earth County, Minnesota. J. Environ. Qual. 2012, 41, 197–207. [Google Scholar] [CrossRef]
- Hamlett, J.M.; Baker, J.L.; Johnson, H.P. Channel morphology changes and sediment yield for a small agricultural watershed in Iowa. Tran. ASAE 1983, 26, 1390–1396. [Google Scholar] [CrossRef]
- Odgaard, A.J. Streambank erosion along two rivers in Iowa. Water Resour. Res. 1987, 23, 1225–1236. [Google Scholar] [CrossRef]
- Palmer, J.A.; Schilling, K.E.; Isenhart, T.M.; Schultz, R.C.; Tomer, M.D. Streambank erosion rates and loads within a single watershed: Bridging the gap between temporal and spatial scales. Geomorphology 2014, 209, 66–78. [Google Scholar] [CrossRef]
- Schilling, K.E.; Isenhart, T.M.; Palmer, J.A.; Wolter, C.F.; Spooner, J. Impacts of landcover change on suspended sediment transport in two agricultural watersheds. J. Am. Water Resour. Assoc. 2011, 47, 672–686. [Google Scholar] [CrossRef]
- Schilling, K.E.; Wolter, C.F. Applications of GPS and GIS to map channel features in Walnut Creek, Iowa. J. Am. Water Resour. Assoc. 2000, 36, 1423–1434. [Google Scholar] [CrossRef]
- Kotak, B.G.; Prepas, E.E.; Hrudey, S.E. Blue green algal toxins in drinking water supplies: Research in Alberta. Lake Line 1994, 14, 37–40. [Google Scholar]
- Martin, A.; Cooke, G.D. Health risks in eutrophic water supplies. Lake Line 1994, 14, 24–26. [Google Scholar]
- Newcombe, C.P.; Jensen, J.O.T. Channel suspended sediment and fisheries: A synthesis for quantitative assessment of risk and impact. N. Am. J. Fish. Manag. 1996, 16, 693–727. [Google Scholar] [CrossRef]
- Pierzynski, G.M.; Sims, J.T.; Vance, G.F. Soil phosphorus and environmental quality. In Soils and Environmental Quality; CRC Press: Boca Raton, FL, USA, 2000; pp. 155–207. [Google Scholar]
- Bashagaluke, J.B.; Logah, V.; Opoku, A.; Sarkodie-Addo, J.; Quansah, C. Soil nutrient loss through erosion: Impact of different cropping systems and soil amendments in Ghana. PLoS ONE 2018, 13, e0208250. [Google Scholar] [CrossRef]
- Grenon, G.; Singh, B.; Sena, A.D.; Madramootoo, C.A.; Sperber, C.; Goyal, M.K.; Zhang, T. Phosphorus fate, transport and management on subsurface drained agricultural organic soils: A review. Environ. Res. Lett. 2021, 16, 013004. [Google Scholar] [CrossRef]
- Lin, S.S.; Shen, S.L.; Zhou, A.; Lyu, H.M. Assessment and management of lake eutrophication: A case study in Lake Erhai, China. Sci. Total Environ. 2020, 751, 2021. [Google Scholar] [CrossRef]
- USEPA. Clean Water Act Section 303(d): Impaired Waters and Total Maximum Daily Loads (TMDLs). 2020. Available online: https://www.epa.gov/tmdl/impaired-waters-and-tmdls-region-7 (accessed on 3 May 2024).
- Henshaw, A.J.; Thorne, C.R.; Clifford, N.J. Identifying causes and controls of river bank erosion in a British upland catchment. Catena 2012, 100, 107–119. [Google Scholar] [CrossRef]
- Lamba, J.; Karthikeyan, K.G.; Thompson, A.M. Apportionment of suspended sediment sources in an agricultural watershed using sediment fingerprinting. Geoderma 2015, 239–240, 25–33. [Google Scholar] [CrossRef]
- Hooke, J. River meander behavior and instability: A framework for analysis. Trans. Inst. Br. Geogr. NS 2003, 28, 238–253. [Google Scholar] [CrossRef]
- Hughes, A.O. Riparian management and stream bank erosion in New Zealand. N. Z. J. Mar. Freshw. Res. 2016, 50, 277–290. [Google Scholar] [CrossRef]
- Thorne, C.R. Processes and mechanisms of river bank erosion. In Gravel-Bed Rivers; Hey, R.D., Bathurst, J.C., Thorne, C.R., Eds.; Wiley: Chichester, UK, 1982; pp. 227–259. [Google Scholar]
- Schumm, S.A. Causes and controls of channel incision. In Incised Rivers; Darby, S.E., Simon, A., Eds.; John Wiley and Sons: Chichester, UK, 1999; pp. 19–33. [Google Scholar]
- Davis, R.J.; Gregory, K.J. A new distinct method of river bank erosion in a forested catchment. J. Hydrol. 1994, 157, 1–11. [Google Scholar] [CrossRef]
- Lawler, D.M.; Grove, J.R.; Couperwaite, J.S.; Leeks, G.J.L. Downstream change in river bank erosion rates in the Swale-Ouse system, northern England. Hydrol. Process. 1999, 13, 977–992. [Google Scholar] [CrossRef]
- Geyer, W.A.; Neppl, T.; Brooks, K.; Carlisle, J. Woody vegetation protects streambank stability during the 1993 flood in Central Kansas. J. Soil Water Conserv. 2002, 55, 483–486. [Google Scholar]
- Starkel, L. Change in the frequency of extreme events as the indicator of climatic change in the Holocene (in fluvial systems). Quat. Int. 2002, 91, 25–32. [Google Scholar] [CrossRef]
- Zaimes, G.N.; Schultz, R.C.; Isenhart, T.M. Streambank soil and phosphorus losses under different riparian land-uses in Iowa. J. Am. Water Resour. Assoc. 2008, 44, 935–947. [Google Scholar] [CrossRef]
- Güneralp, I.; Rhoads, B.L. Empirical analysis of the planform curvature-migration relation of meandering rivers. Water Resour. Res. 2009, 45, W09424. [Google Scholar] [CrossRef]
- Krishna Prasad, S.; Indulekha, K.P.; Balan, K. Analysis of groyne placement on minimizing river bank erosion. Proc. Technol. 2016, 24, 47–53. [Google Scholar] [CrossRef]
- Tufekcioglu, M.; Isenhart, T.M.; Schultz, R.C. High stage events and stream bank erosion on small grazed pasture stream reaches in the Rathbun Lake Watershed, Southern Iowa, USA. Int. J. Ecosyst. Ecol. Sci. 2019, 9, 775–786. [Google Scholar] [CrossRef]
- Tufekcioglu, M.; Schultz, R.C.; Isenhart, T.M.; Kovar, J.L.; Russell, J.R. Riparian land-use, stream morphology and streambank erosion within grazed pastures in Southern Iowa, USA: A Catchment-wide perspective. Sustainability 2020, 12, 6461. [Google Scholar] [CrossRef]
- Konsoer, K.M.; Rhoads, B.L.; Langendoen, E.J.; Best, J.L.; Ursic, M.E.; Abad, J.D.; Garcia, M.H. Spatial variability in bank resistance to erosion on a large meandering, mixed bedrock-alluvial river. Geomorphology 2016, 252, 80–97. [Google Scholar] [CrossRef]
- Janes, V.J.J.; Nicholas, A.P.; Collins, A.L.; Quine, T.A. Analysis of fundamental physical factors influencing channel bank erosion: Results for contrasting catchments in England and Wales. Environ. Earth Sci. 2017, 76, 307. [Google Scholar] [CrossRef]
- Zaimes, G.N.; Schultz, R.C.; Isenhart, T.M. Total phosphorus concentrations and compaction in riparian areas under different riparian land-uses of Iowa. Agric. Ecosyst. Environ. 2008, 127, 22–30. [Google Scholar] [CrossRef]
- Parker, C.; Simon, A.; Thorne, C.R. The effects of variability in bank material properties on riverbank stability: Goodwin Creek, Mississippi. Geomorphology 2008, 101, 533–543. [Google Scholar] [CrossRef]
- Zaimes, G.Ν.; Tamparopoulos, A.E.; Tufekcioglu, M.; Schultz, R.C. Understanding stream bank erosion and deposition in Iowa, USA: A seven year study along streams in different regions with different riparian land-uses. J. Environ. Manag. 2021, 287, 112352. [Google Scholar] [CrossRef]
- Prior, J.C. Landforms of Iowa; Iowa Department of Natural Resources University of Iowa Press: Iowa City, IA, USA, 1991. [Google Scholar]
- Schumm, S.A.; Harvey, M.D.; Watson, C.C. Incised Channels: Morphology, Dynamics and Control; Water Resource Publication: Littleton, CO, USA, 1984; p. 100. [Google Scholar]
- Strahler, A.N. Quantitative analysis of watershed geomorphology. Trans. Am. Geophys. Union 1957, 38, 913–920. [Google Scholar]
- Wolman, M.G. Factors influencing erosion of a cohesive river bank. Am. J. Sci. 1959, 257, 204–216. [Google Scholar] [CrossRef]
- Lawler, D.M. The measurement of river bank erosion and lateral channel change: A review. Earth Surf. Process. Landf. 1993, 18, 777–821. [Google Scholar] [CrossRef]
- Iowa Environmental Mesonet (IEM). Available online: https://mesonet.agron.iastate.edu/ (accessed on 10 December 2009).
- SPSS Institute Inc. IBM SPSS statistics 19 core system user’s guide, SPSS Programming and Data Management 2010; p. 426. Available online: http://bayes.acs.unt.edu:8083/BayesContent/class/Jon/SPSS_SC/Manuals/v19/IBM%20SPSS%20Statistics%2019%20Core%20System%20User%27s%20Guide.pdf (accessed on 3 November 2014).
- Sokal, R.R.; Rohlf, F.J. Biometry: The Principles and Practice of Statistics in Biological Research, 3rd ed.; W.H. Freeman and Company: New York, NY, USA, 1995. [Google Scholar]
- Box, G.E.P.; Cox, D.R. An analysis of transformations. J. R. Stat. Soc. Ser. 1964, 26, 211–243. [Google Scholar] [CrossRef]
- Willett, C.D.; Lerch, R.N.; Schultz, R.C.; Berges, S.A.; Peacher, R.D.; Isenhart, T.M. Streambank erosion in two watersheds of the Central Claypan Region of Missouri, United States. J. Soil Water Conserv. 2012, 67, 249–263. [Google Scholar] [CrossRef]
- Michalik, A.; Tekielak, T. The relationship between bank erosion, local aggradation and sediment transport in a small Carpathian stream. Geomorphology 2013, 191, 51–63. [Google Scholar]
- Casagli, N.; Rinaldi, M.; Gargini, A.; Currini, A. Pore water pressure and stream bank stability: Results from a monitoring site on the Sieve River, Italy. Earth Surf. Process. Landf. 1999, 24, 1095–1114. [Google Scholar] [CrossRef]
- Simon, A.; Curini, A.; Darby, S.E.; Langendoen, E.J. Bank and near-bank processes in an incised channel. Geomorphology 2000, 35, 193–217. [Google Scholar] [CrossRef]
- Zaimes, G.N.; Tufekcioglu, M.; Schultz, R.C. Riparian land-use impacts on bank and gully erosion in agricultural watersheds: What we have learned. Water 2019, 11, 1343. [Google Scholar] [CrossRef]
- Larsen, E.W.; Fremier, A.K.; Greco, S.E. Cumulative effective stream power and bank erosion on the Sacramento River, California, USA. J. Am. Water Resour. Assoc. 2006, 42, 1077–1097. [Google Scholar] [CrossRef]
- Schilling, K.E.; Wolter, C.F.; Palmer, J.A.; Beck, W.J.; Williams, F.F.; Moore, P.L.; Isenhart, T.M. An assessment of streambank erosion rates in Iowa. Environments 2023, 10, 84. [Google Scholar] [CrossRef]
- Laubel, A.; Kronvang, B.; Hald, A.B.; Jensen, C. Hydro-morphological and biological factors influencing sediment and phosphorus loss via bank erosion in small lowland rural streams in Denmark. Hydrol. Process. 2003, 17, 3443–3463. [Google Scholar] [CrossRef]
- Beck, W.J.; Moore, P.L.; Schilling, K.E.; Wolter, C.F.; Isenhart, T.M.; Cole, K.J.; Tomer, M.D. Changes in lateral floodplain connectivity accompanying stream channel evolution: Implications for sediment and nutrient budgets. Sci. Total Environ. 2019, 660, 1015–1028. [Google Scholar] [CrossRef]
- Zeiger, S.J.; Hubbart, J.A. Characterizing land use impacts on channel geomorphology and streambed sedimentological characteristics. Water 2019, 11, 1088. [Google Scholar] [CrossRef]
- Abbas, G.; Jomaa, S.; Bronstert, A.; Rode, M. Downstream changes in riverbank sediment sources and the effect of catchment size. J. Hydrol. Reg. Stud. 2023, 46, 101340. [Google Scholar] [CrossRef]
- Trimble, S.W. Erosional effects of cattle on streambanks in Tennessee, U.S.A. Earth Surf. Process. Landf. 1994, 19, 451–464. [Google Scholar] [CrossRef]
- Lyons, J.; Weasel, B.M.; Paine, L.K.; Undersander, D.J. Influence of intensive rotational grazing on bank erosion, fish habitat quality, and fish communities in Southwestern Wisconsin trout streams. J. Soil Water Conserv. 2000, 55, 271–276. [Google Scholar]
- Magner, J.M.; Vondracek, B.; Brooks, K.N. Grazed riparian management and stream channel response in Southeastern Minnesota (USA) streams. Environ. Manag. 2008, 42, 377–390. [Google Scholar] [CrossRef] [PubMed]
- Bear, D.A.; Russell, J.R.; Tufekcioglu, M.; Isenhart, T.M.; Morrical, D.G.; Kovar, J.L. Stocking rate and riparian vegetation effects on physical characteristics of riparian zones of Midwestern pastures. J. Rangel. Ecol. Manag. 2012, 65, 119–128. [Google Scholar] [CrossRef][Green Version]
- Wohl, N.E.; Carline, R.F. Relations among riparian grazing, sediment loads, macroinvertebrates, and fishes in three central Pennsylvania streams. Can. J. Fish. Aquat. Sci. 1996, 53, 260–266. [Google Scholar] [CrossRef]
- Agouridis, C.T.; Edwards, D.R.; Workman, S.R.; Bicudo, J.R.; Koostra, B.K.; Vanzant, E.S.; Taraba, J.L. Stream bank erosion associated with grazing practices in the humid region. Trans. Am. Soc. Agric. Eng. 2005, 48, 181–190. [Google Scholar] [CrossRef]
- Nakhle, P.; Ribolzi, O.; Boithias, L.; Rattanavong, S.; Auda, Y.; Sayavong, S.; Zimmermann, R.; Soulileuth, B.; Pando, A.; Thammahacksa, C.; et al. Effects of hydrological regime and land use on in-stream Escherichia coli concentration in the Mekong basin, Lao PDR. Sci. Rep. 2021, 11, 3460. [Google Scholar] [CrossRef]
- Simon, A.; Klimetz, L. Relative magnitudes and sources of sediment in benchmark watersheds of the Conservation Effects Assessment Project. J. Soil Water Conserv. 2008, 63, 504–522. [Google Scholar] [CrossRef]
- Yan, B.; Tomer, M.D.; James, D.E. Historical channel movement and sediment accretion along the South Fork of the Iowa River. J. Soil Water Conserv. 2010, 65, 1. [Google Scholar] [CrossRef]
- Capobianco, V.; Robinson, K.; Kalsnes, B.; Ekeheien, C.; Høydal, Ø. Hydro-mechanical effects of several riparian vegetation combinations on the streambank stability—A benchmark case in southeastern Norway. Sustainability 2021, 13, 4046. [Google Scholar] [CrossRef]
- Okeke, C.A.; Uno, J.; Academe, S.; Emenike, P.C.; Abam, T.K.; Omole, D.O. An integrated assessment of land use impact, riparian vegetation and lithologic variation on streambank stability in a peri-urban watershed (Nigeria). Sci. Rep. 2022, 12, 10989. [Google Scholar] [CrossRef]
- Beeson, C.E.; Doyle, P.F. Comparison of bank erosion at vegetated and non-vegetated channel bends. Water Resour. Bull. 1995, 31, 983–990. [Google Scholar] [CrossRef]
- Miller, R.B.; Fox, G.A.; Penn, C.; Wilson, S.; Parnell, A.; Purvis, R.A.; Criswell, K. Estimating sediment and phosphorus loads from streambanks with and without riparian protection. Agric. Ecosyst. Environ. 2014, 189, 70–81. [Google Scholar] [CrossRef]
- Dunaway, D.; Swanson, S.R.; Wendel, J.; Clary, W. The effect of herbaceous plant communities and soil textures on particle erosion of alluvial streambanks. Geomorphology 1994, 9, 47–56. [Google Scholar] [CrossRef]
- Pollen-Bankhead, N.; Simon, A. Hydrologic and hydraulic effects of riparian root networks on streambank stability: Is mechanical root-reinforcement the whole story? Geomorphology 2010, 116, 353–362. [Google Scholar] [CrossRef]
- Wynn, T.M.; Mostaghimi, S. The effects of vegetation and soil type on streambank erosion, Southwestern Virginia, USA. J. Am. Water Resour. Assoc. 2006, 42, 69–82. [Google Scholar] [CrossRef]
- Belsky, A.J.; Matzke, A.; Uselman, S. Survey of livestock influences on stream and riparian ecosystems in the Western United States. J. Soil Water Conserv. 1999, 54, 419–431. [Google Scholar]
- Collier, K.J.; Quinn, J.M. Land-use influences macroinvertebrate community response following a pulse disturbance. Freshw. Biol. 2003, 48, 1462–1481. [Google Scholar] [CrossRef]
- Trimble, S.W.; Mendel, A.C. The cow as a geomorphic agent—A critical review. Geomorphology 1995, 13, 233–253. [Google Scholar] [CrossRef]
- Hadrich, J.C.; Van Winkle, A. Awareness and pro-active adoption of surface water BMPs. J. Environ. Manag. 2013, 127, 221–227. [Google Scholar] [CrossRef]
- Zheng, M.; Song, J.; Ru, J.; Zhou, Z.; Zhong, M.; Jiang, L.; Hui, D.; Wan, S. Effects of grazing, wind erosion, and dust deposition on plant community composition and structure in a temperate steppe. Ecosystems 2021, 24, 403–420. [Google Scholar] [CrossRef]
- Eldridge, D.J.; Ding, J.; Travers, S.K. A global synthesis of the effects of livestock activity on hydrological processes. Ecosystems 2022, 25, 1780–1791. [Google Scholar] [CrossRef]
- Scott, A.; Cassidy, R.; Arnscheidt, J.; Rogers, D.; Jordan, P. Quantifying nutrient and sediment erosion at riverbank cattle access points using fine-scale geo-spatial data. Ecol. Indic. 2023, 155, 111067. [Google Scholar] [CrossRef]
- Stott, T.A. Stream bank and forest ditch erosion: Responses to timber harvesting in mid-Wales. In Fluvial Processes and Environmental Change; Brown, A.G., Quine, T.A., Eds.; John Wiley & Sons Ltd.: Chichester, UK, 1999; pp. 47–70. [Google Scholar]


Disclaimer/Publisher’s Note: The statements, opinions and data contained in all publications are solely those of the individual author(s) and contributor(s) and not of MDPI and/or the editor(s). MDPI and/or the editor(s) disclaim responsibility for any injury to people or property resulting from any ideas, methods, instructions or products referred to in the content. |
© 2024 by the authors. Licensee MDPI, Basel, Switzerland. This article is an open access article distributed under the terms and conditions of the Creative Commons Attribution (CC BY) license (https://creativecommons.org/licenses/by/4.0/).