Abstract
This study investigates the impact of green trade exports (GTE) on green total factor productivity (GTFP) and environmental sustainability in OECD countries using panel data from 2003 to 2016. We employ linear regression models, polynomial models, and threshold regression techniques to analyze this relationship. Our findings reveal an inverted N-shaped curve between GTE and GTFP, with two turning points. The threshold regression results indicate that when clean energy is below 8.660%, a 1 unit increase in GTE decreases GTFP by 1.518 units. However, when clean energy exceeds this threshold, a 1 unit increase in GTE increases GTFP by 1.056 units. For R&D, the effect of GTE on GTFP changes from −3.165 to 1.193 as R&D exceeds the threshold of 0.664%. Additionally, we find that GTE has a lagged effect on increasing CO2 emissions, with coefficients of 0.0234 and 0.0278 for 1-year and 2-year lags, respectively. The interaction between clean energy and GTE reduces CO2 emissions by 0.00234 units and PM2.5 by 0.0145 units. These results provide important insights for policymakers in developing countries seeking to participate effectively in the global industrial chain while promoting sustainable development.
1. Introduction
Human activities have exacerbated global warming through greenhouse gas emissions, traditional energy consumption, land use practices, lifestyles, and consumption trends, impacting regions and nations worldwide. These activities significantly contribute to rising global greenhouse gas levels [1].
According to the OECD [2], environmental goods and services exports from OECD countries reached USD 1.2 trillion in 2020, representing a 4% annual growth rate over the past decade. However, global greenhouse gas emissions continue to rise, with the International Energy Agency [3] reporting a 2% increase in global energy-related CO2 emissions in 2021, reaching 33 billion tones. These trends underscore the need for a deeper understanding of how green trade relates to environmental outcomes and economic productivity.
In recent years, many OECD countries have implemented ambitious green development strategies. For instance, the European Union’s European Green Deal [4] aims to make Europe climate-neutral by 2050. Meanwhile, the United States has set a target to achieve a 50–52% reduction in economy-wide net greenhouse gas pollution from 2005 levels by 2030 [5]. Despite these efforts, the IPCC [1] has noted that global surface temperature continues to rise.
While the reduction in trade barriers has improved global commerce, spurring economic activity [6] and influencing CO2 emissions [7], trade expansion can escalate environmental pressures [8]. This, in turn, can negatively impact social wellbeing due to increased CO2 emissions. Notably, as environmental regulations become more lenient, it is becoming increasingly common for economically disadvantaged nations to serve as global manufacturing hubs [9], resulting in an environmental and economic development disparity between developed and developing countries.
Consequently, the World Trade Organization announced tariff-free treatment for environmental goods to create more equitable opportunities for developing countries. International trade not only alleviates regional resource constraints but also stimulates economic growth and enhances social welfare [10,11].
While some researchers argue that green trade exports (GT exports) can more efficiently reduce greenhouse gas emissions [12,13,14], others hold opposing views [15,16].
This underscores the need for a global perspective when assessing the true environmental impact of green trade initiatives. Similar to traditional international trade, green trade also has indirect environmental impacts, primarily through its influence on income. While green trade can reduce carbon dioxide (CO2) emissions, it can simultaneously lead to an increase in water pollution due to this indirect effect [17].
Green trade policies are instrumental in reducing the consumption of natural resources, as confirmed by the results of Granger causality tests showing that natural resources contribute to green trade [18]. Hu et al. [14] proposed that green trade could reduce economic reliance on natural oil, foster the conservation of natural resources, and promote sustainable development.
In 2021, Liu et al. [19] introduced the concept of the green openness index, which pertains to the export of environmentally friendly goods within a given region. The green openness index plays a pivotal role in environmental protection, especially in OECD countries, where it has been observed that greater green openness significantly affects environmental protection [20]. Increasing the number of environmentally friendly patents has been shown to reduce CO2 emissions [21]. However, Liu et al. [12] arrived at contrasting findings, suggesting that green trade can substantially reduce pollution emissions based on a panel dataset of China spanning from 2007 to 2016.
The relationship between green trade and green total factor productivity (GTFP) remains understudied, particularly in the context of industrialized nations [22].
This research gap is significant, as understanding this relationship is crucial for developing effective policies that balance economic growth with environmental sustainability. To address this gap, our study investigates the impact of green trade exports (GTE) on GTFP using data from 37 OECD countries spanning from 2003 to 2016. We employ a two-pronged methodological approach. First, we investigate the linear relationship between GTE and GTFP as a baseline model. This linear analysis provides a foundation for understanding the direct effects of green trade on productivity. However, recognizing that economic and environmental relationships are often complex and nonlinear, we extend our analysis further. As a second objective, we introduce clean energy and research and development (R&D) as threshold variables to examine the potential nonlinear relationship between GTE and GTFP. This approach allows us to capture more nuanced interactions and potential turning points in the relationship between green trade and productivity. By combining both linear and nonlinear analyses, we aim to provide a comprehensive understanding of how green trade influences GTFP in developed economies, offering insights that can inform policy decisions in both OECD and developing countries.
2. Literature Review
2.1. International Trade and Environment
The relationship between international trade and environmental pollution has come to the forefront with the globalization of trade [23]. However, the findings regarding this relationship are not consistently clear. As global trade expands, it can directly impact the environment, resulting in increased pollution and the depletion of natural resources. This phenomenon has given rise to the “pollution-haven hypothesis”, suggesting that developing countries with diverse and stringent environmental policies may experience a rise in pollution due to trade globalization.
Conversely, the advancement of international trade and investment has the potential to enhance environmental quality by fostering economic growth and social welfare, which are integral aspects of effective environmental management (OECD). Furthermore, participation in trade globalization can influence a country’s pollution emissions per capita or per unit of gross domestic product (GDP), promoting cleaner production processes and the adoption of environmentally friendly technologies to reduce pollution [24].
Divergent viewpoints argue that carbon dioxide and sulfur dioxide emissions are the primary contributors to climate change and air pollution, with international trade primarily contributing to the reduction in carbon dioxide emissions [25]. However, Lin [26] observed that trade openness might increase concentrations of sulfur dioxide (SO2), nitrogen dioxide (NO2), and aerosols. Studies by Choi et al. [27] and Tamazian and Rao [28] also suggest that international trade can lead to increased CO2 emissions [27,29,30].
Sustainable development demands a holistic approach, balancing economic growth with social equity and environmental wellbeing. Hui and Choi [31] explore limitations of carbon trading schemes, while Yin et al. [28] highlight the potential of digitalization to narrow the gender gap in the labor market, emphasizing the need for supportive policies. Choi et al. [27] stress the importance of human capital development in BRICS countries for sustainable trade practices. Yin and Choi [28] analyze economic and noneconomic factors influencing environmental sustainability in G20 economies. These studies showcase the interconnectedness of sustainable development’s elements. While Hui and Choi [31] caution against simplistic solutions, May et al. [32] identify opportunities for digital technologies to address gender inequality. Similarly, Choi et al. [27] emphasize human capital’s role in sustainable trade, and Yin and Choi [33] unveil the complex interplay of factors shaping environmental outcomes [23,32,33,34,35,36,37].
Additionally, international trade can have indirect effects on the environment by enhancing labor productivity, competitiveness, and resource efficiency, thereby reducing pollution emissions in OECD countries [38,39].
2.2. Green Trade and Environment
In recent years, the concept of “green trade” has garnered significant attention. Green trade represents a nation’s commitment to environmental protection and sustainable development through the production and export of environmentally friendly goods [40,41]. Moreover, the liberalization of green trade offers a promising pathway to achieve a triple win—benefiting trade, the environment, and sustainable growth in countries like China [42]. Liu et al. [12] noted that green trade can effectively mitigate environmental pollution, regardless of whether it involves import or export activities, thereby contributing to the preservation of China’s environment [42,43].
Green trade policies are instrumental in reducing the consumption of natural resources, as confirmed by the results of Granger causality tests showing that natural resources contribute to green trade [44]. Huang et al. [13] proposed that green trade could reduce economic reliance on natural oil, foster the conservation of natural resources, and promote sustainable development. However, it is crucial to consider the potential unintended consequences of such policies on third countries. May highlights that sustainable regulations in agricultural markets can have complex effects across international supply chains, potentially shifting environmental burdens to countries with less stringent policies. This underscores the need for a global perspective when assessing the true environmental impact of green trade initiatives [45].
Similar to traditional international trade, green trade also has indirect environmental impacts, primarily through its influence on income. While green trade can reduce carbon dioxide (CO2) emissions, it can simultaneously lead to an increase in water pollution due to this indirect effect [17]. Green trade policies are instrumental in reducing the consumption of natural resources, as confirmed by the results of Granger causality tests showing that natural resources contribute to green trade [44].
In 2021, Can et al. [22] introduced the concept of the green openness index, which pertains to the export of environmentally friendly goods within a given region. The green openness index plays a pivotal role in environmental protection, especially in OECD countries, where it has been observed that greater green openness significantly affects environmental protection [19]. Increasing the number of environmentally friendly patents has been shown to reduce CO2 emissions [21]. However, Li et al. [11] arrived at conrasting findings, suggesting that green trade can substantially reduce pollution emissions based on a panel dataset of China spanning from 2007 to 2016, employing the SYS-GMM model [20,46].
2.3. Green Trade and Green Total Factor Productivity
Environmentally friendly goods can be categorized into two main groups: traditional and environmentally preferable products [12]. Traditional environmental goods often consist of innovative and intricate products, as noted by Hamwey [47]. According to the United Nations Environment Programme [48], traditional environmental goods encompass five subgroups: air pollution, wastewater management, solid and hazardous waste management, and clean technologies and resources. These products are designed to be used for environmental protection, but they can still induce pollution, as seen in the production of items like wind turbines [45,49]. In contrast, environmentally preferable products include natural dyes, natural rubber, jute, and sisal fibers, which, due to their superior environmental qualities compared to available alternatives, are more attractive options for developing countries [50,51].
Recent studies have yielded noteworthy findings in this realm. Hao et al. [39] concluded that the impact of green productivity growth on CO2 emissions is decreasing, underscoring the contribution of green growth to environmental improvements in G7 countries. Cheng and Kong [2], employing panel data from 30 regions spanning from 2000 to 2019, asserted that the Chinese government must shift away from traditional extensive industry structures, promote green industries, and enhance production efficiency to ensure sustainable development in China. In a study by Liu et al. [21] that examined the impact of green trade on green total factor productivity (GTFP) using panel data from China for the period 2003 to 2015, it was found that green trade does not exert a strong influence on sustainable and green growth in China and does not significantly reduce pollution, such as CO2 and PM2.5. Interestingly, when green trade exceeds the second threshold, its effect on GTFP becomes positive.
Drawing from the existing literature, it is evident that the discourse in this field has been growing, offering valuable insights. Primary research areas include investigating whether green trade can enhance environmental quality by reducing emissions of CO2, SO2, and PM2.5 [7,42,46,49,52]. The question of whether trade can lead to pollution havens in developing countries has also been explored [53,54]. However, the study of the relationship between green trade and green total factor productivity remains limited. Consequently, to address this gap in the current literature, we measure the GTFP index in OECD countries and construct models to analyze the impact of green trade on both the environment and GTFP.
3. Empirical Research
3.1. Measurement of Green Total Factor Productivity
Traditional methods of measuring total factor productivity typically exclude undesirable outputs like CO2, SO2, and industrial dust. However, green total factor productivity (GTFP) offers a more comprehensive approach to assess the efficiency of economic growth, taking into account waste and pollution outputs. Therefore, GTFP provides a more accurate reflection of the genuine quality of economic growth [55,56].
The primary method for calculating GTFP involves the use of data envelopment analysis (DEA), a nonparametric approach used to compare the efficiency of decision-making units (DMUs) [57]. Tone [58] introduced a nonoriented SBM (slacks-based measure) model to address slack variable issues and enhance accuracy. In 2007, Cooper et al. [45] proposed an innovative SBM that incorporates unexpected output variables, offering an indicator of sustainable environmental and economic growth. However, this GTFP calculation method is not suitable for dynamic research. To facilitate dynamic analysis, Chung et al. [47] introduced the Malmquist–Luenberger index, but this method is challenged by variations in production technologies. To address this heterogeneity, Oh and Lee [59] established the Malmquist meta-frontier index, though it still grapples with infeasibility issues. To mitigate these infeasibility challenges, Oh [60] devised the global Malmquist-Luenberger productivity index (GML), a more efficient measure of GTFP.
Consequently, we opted to employ the SBM-GML index method, with an input orientation, to calculate the GTFP index. Table 1 presents the input, expected output, and unexpected output variables used in this calculation.

Table 1.
Input and output variables for measuring GTFP.
Our methodological approach is grounded in the theory of environmental economics and sustainable development [52,61]. This framework posits that economic activities, including trade, have complex interactions with environmental outcomes and productivity. It suggests that these relationships may be nonlinear and subject to threshold effects, which informs our choice of both linear and nonlinear models.
We employ the SBM-GML (slacks-based measure-global Malmquist–Luenberger) index method to calculate GTFP, following Oh [60]. This method was selected because it addresses several limitations of previous approaches. Unlike traditional DEA methods, it incorporates undesirable outputs like pollution, providing a more comprehensive measure of productivity. Moreover, the global nature of this index allows for consistent comparisons across time and countries, addressing the infeasibility issues present in some other dynamic DEA models [59,62].
Our selection of explanatory variables is based on previous studies in environmental economics and trade literature. Green trade, our core variable, is measured using the OECD’s Combined List of Environmental Goods (CLEG), following Can et al. [22]. We include clean energy use as it has been shown to significantly influence environmental outcomes [63]. Economic growth (GDP) is included as it is a key factor in the environmental Kuznets curve hypothesis [64]. Other variables such as unemployment, industrial structure, FDI, and population density have been identified as important determinants of environmental performance in previous studies [65,66].
We employ both linear and nonlinear models to capture the potentially complex relationship between green trade and GTFP. The linear model serves as a baseline, following standard practice in econometric analysis [67]. However, recognizing that environmental and economic relationships often exhibit nonlinearities [52], we also employ a nonlinear threshold model. This approach allows us to identify potential turning points in the relationship between green trade and GTFP, as suggested by the environmental Kuznets curve literature [64].
3.2. Explanatory Variable
The explanatory variables include green trade, clean energy, gross domestic product (GDP), unemployment rate, industrial structure, foreign direct investment, and population. Specifically, the core explanatory variable is green trade, and all variables are defined in the following sections.
These variables were selected based on their potential to influence either green trade, green total factor productivity, or both. They represent a mix of economic, environmental, and demographic factors that can help provide a comprehensive understanding of the complex relationships being studied. The selection is also informed by the previous literature in the field of environmental economics and trade studies. Data for all these variables were collected from reliable sources such as the OECD statistics and the World Bank, ensuring consistency and comparability across the OECD countries in the study.
The SBM-GML index method combines the slacks-based measure (SBM) model with the global Malmquist–Luenberger (GML) index. In Equations (1) and (9), μi represents the individual fixed effects, capturing time-invariant characteristics specific to each country i, ƞt represents the time fixed effects, accounting for time-specific factors that affect all countries equally, and ϵit is the error term, representing unobserved factors that vary across both countries and time. These components are crucial in panel data models as they help control for unobserved heterogeneity and time-specific shocks, improving the reliability of our estimates.
3.2.1. Core Explanatory Variable
To date, no consistent definition is available in the existing literature of which products are in the basket of green trade [19]. Diverse ranges of green trade products are revealed, according to several international organizations. For example, the Asia-Pacific Economic Cooperation [20] produced 54 green products on the “APEC List of Environmental Goods”, whereas the OECD’s “Combined List of Environmental Goods” (CLEG) covers 40 goods, consisting of 255 products, which is the largest green product basket [19].
According to the OECD’s CLEG list, there are 11 primary categories for environmental goods: (1) air pollution control; (2) cleaner or more resource-efficient technologies and products; (3) environmentally preferable products based on end-use or disposal characteristics; (4) heat and energy management; (5) environmental monitoring, analysis, and assessment equipment; (6) natural resource protection; (7) noise and vibration abatement; (8) renewable energy plants; (9) management of solid and hazardous waste and recycling systems; (10) clean-up or remediation of soil and water; and (11) wastewater management and potable water treatment.
Here, we adopt all the above values for exporting environmental goods to total exports to calculate the value of green trade. Data related to green trade were collected from OECD statistics.
3.2.2. Other Variables
Our model had six control variables: (1) clean energy (CE), percent of renewable energy consumption of total final energy consumption; (2) economic growth level (GDP), proxied by the rate of national GDP growth; (3) unemployment rate (UN), percent of the total labor force; (4) industrial structure (IS), percent of GDP; (5) foreign direct investment (FDI), net flow of percent GDP; and (6) population density (pop), people per square km of land area. Data were collected from the World Bank.
3.3. Model Specification
3.3.1. GT and GTFP
In the existing literature, most studies focus on the relationship between green trade, GTFP, and the environment. A fixed model and system-generalized method of moments (GMM) were adopted. This study aims to evaluate whether green trade can promote an increase in GTFP. Can environmental pollutant emissions decrease? For this purpose, the following models were established:
To avoid endogeneity, we reduce the bias by omitting time and individual effects. We adopted a fixed model to establish Model 1 as follows:
To solve the problem of reverse causality between GT and GTFP, for Model 2, we also lagged GTit by one and two years. This model is shown in Models 2 and 3.
The effects of green trade on green total factor productivity (GTFP) may not be immediate. It can take time for the benefits of environmentally friendly exports to manifest in improved productivity and environmental outcomes. Green trade often involves the transfer of advanced environmental technologies. The adoption and integration of these technologies into domestic production processes can take several years. Changes in trade patterns may lead to policy adjustments, which can take time to implement and show effects on GTFP.
Furthermore, to further study the relationship between GT and GTFP, in Model 4, we construct a linear parametric fixed effect model with the quadratic cubic polynomial of GT based on Model 1 to ensure the status of the OECD country. This model can be expressed as follows:
Based on the linear regression model, to elucidate the relationship between the GT and GTFP, we established a threshold model to explore the nonlinear relationship between GT exports and GTFP, which can be expressed as Models 5 and 6.
Here, i and t indicate the country and year, CEit, R&Dit is the threshold variables, and represents the calculated threshold value. is the indication coefficient and is the coefficient of GTit, when the threshold value is different in each stage.
3.3.2. GT and CO2
To explore whether GT can directly decrease CO2 emissions and contribute to sustainable development, we took the emission of CO2 as the explained variable, as in Model 5. In addition, we lagged GTit by one and two years to test the reverse causality between CO2 and GT, as in Models 7, 8, and 9.
The effects of green trade on CO2 emissions may not be immediate. It can take time for changes in trade patterns to translate into measurable changes in emissions. Industries may need time to adjust their production processes in response to changes in green trade, which could delay the impact on emissions. Green trade policies may lead to new environmental regulations or incentives, which can take time to implement and show effects on emissions.
4. Results and Discussion
4.1. Linear Results and Quadratic and Cubic Polynomials of GT
Table 2 lists the basic results of Models 1, 2, 3, and 4. Column (1) shows the results of the fixed effect model. Columns (2) and (3) show the results of lagged GT for one and two years, respectively. These results reveal that the export of GT cannot promote the development of GTFP and even has an evident negative effect on green growth [49]. Among the control variables, clean energy, unemployment, and FDI have positive effects on GTFP. Otherwise, the level of economic growth has a negative influence on GTFP. First, clean energy can promote green growth because it can reduce the use of gas, coal, and fuel, and reduce pollution emissions to achieve environmental sustainability [9]. Second, FDI has a positive economic significance on GTFP, which can be explained by the fact that FDI exerts a positive spill-over effect of FDI on GTFP. The economic level can decrease GTFP because the economy may be characterized by “high pollution, high consumption, high emission” in the early stage.
Table 2.
Results of baseline models and polynomial models.
The output of the GT’s quadratic cubic polynomial is shown in Column (6). It reveals that significant GT and GT2 coefficients at the 1% and 2% levels and their positive and negative signs, respectively, point to a “U-shaped” link between GT and GTFP. Model 4 has two turning points, and the coefficients of GT, GT2, and GT3 are statistically significant. The signs of the coefficients are negative, positive, and negative, indicating an inverse “N-shaped” relationship between GT and GTFP. Basic Models 1 and 4 exhibited the same GT symptoms. GT and GTFP were in stage 3, and a negative association was observed between GT and GTFP. GT exports stimulate GTFP growth in the initial stage because of insufficient absorption capacity. Because of technological breakthroughs, GT exports exceed the first turning point, and encourage the development of GTFP. With the progressive expansion of trade in the third stage, trade development reached a bottleneck.
4.2. Threshold Effect of Green Trade on GTFP
4.2.1. Threshold Effect Test and Threshold Value Estimation
In Models 5 and 6, we investigate whether cleaner energy and R&D have a threshold effect on GT exports and GTFP. Hence, we tested single-, double-, and triple-threshold values and used 500 bootstrapping iterations because of the small sample size. Table 3 presents the F-statistics and significance level of the p-value, which reveal that clean energy R&D is significant for a single threshold. The single threshold value for clean energy is 8.660. The single threshold value for R&D level was 0.664. Furthermore, we tested the confidence intervals of the threshold variables, as shown in Figure 1.
Table 3.
Single threshold of green trade.
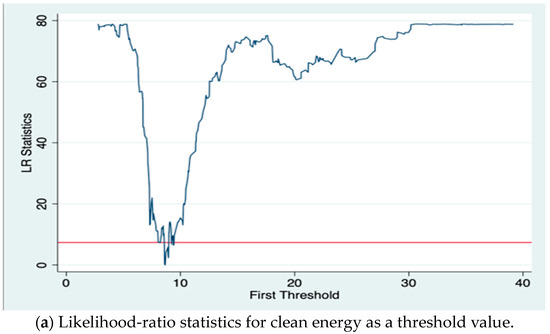
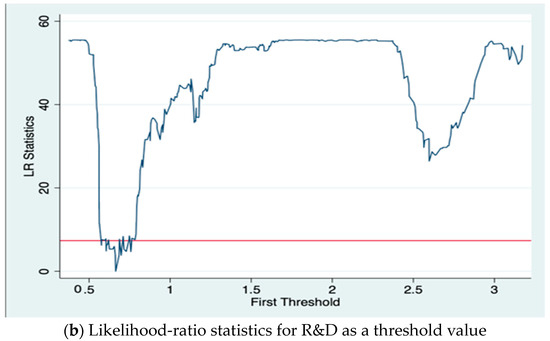
Figure 1.
Single threshold estimate value and confidence interval.
4.2.2. Results of Threshold Regression
Table 4 presents the nonlinear relationship between green trade and GTFP in OECD countries using different threshold variables. Column (1) shows that for clean energy, the effect of GT exports on GTFP changes from negative to positive. When clean energy is below the first threshold value of 8.660, the effect of GT exports on GTFP is significant at a 5% level, and the coefficient is −1.518. This indicates that as clean energy is at the first threshold stage, an increase of one unit in GT exports will decrease the GTFP by 1.518 units. However, when clean energy exceeds the first threshold value, the effect of GT exports is positive (1.056) at the 10% level. Column (2) reveals that as the level of R&D changes, the coefficient of GT exports on GTFP will change from −3.165 to 1.193. It appears that the effect of GT exports on GTFP is stronger and more positive with the effect of R&D level. In conclusion, it appears that clean energy and R&D promote the growth of GTFP when it exceeds the first threshold.
Table 4.
Results of threshold regression.
4.3. Results of Green Trade and TFP, Pollutant Emissions
As shown in Table 5, GT exports do not have an obvious effect on TFP, which is measured using the same method as GTFP and does not include unexpected variables. Therefore, it can be explained that the inefficiency of GTFP is likely due to the poor environmental performance of GT exports [12]. Furthermore, we investigated the effects of GT exports on environmental indicators. Columns (4) and (5) show that, although GT exports do not have a significant effect on increasing CO2 emissions in the current period, they have an evident influence on increasing CO2 emissions through the time-lagged effect. Compared to the coefficient of GT exports, the effect of GT exports with a time lag is more influential than that in the current period. Compared with Columns (7) and (8), the coefficient of GT exports is not statistically significant, but still has an economic impact on increasing PM2.5.
Table 5.
Results of traditional TFP and environmental factors.
Clean energy is an important issue that can contribute to environmental protection and improve green economic growth [2]. Hence, we adopted clean energy as an interaction term to test the interaction effects of clean energy on TFP, CO2 emissions, and PM2.5. Column (3) shows that the interaction between clean energy and GT exports did not have a significant effect on TFP improvement. By comparing Columns (6) and (9), we can see that the interaction effect of clean energy and green trade can decrease the emissions of greenhouse gases and PM2.5, thus achieving sustainable growth.
4.4. Robustness Test
To further enhance the credibility of the empirical results, we test the robustness based on baseline models by dropping the 2008 dataset due to the financial crisis because international trade is the main path to the contagion economic crisis. As shown in Table 6, GT exports still have a negative effect on GTFP when the 2008 dataset is dropped. As for the control variables, clean energy, unemployment, and FDI can also enhance the development of GTFP, and the economic-level variable will decrease GTFP, exactly as in the baseline models; therefore, these models were robust.
Table 6.
Results of robust test of green trade on GTFP.
5. Conclusions and Implications
Sustainable development is a common goal amid the increasing conflict between environmental challenges and economic development. As an indicator of green productivity, GTFP incorporates natural resources and environmental issues into a total factor productivity analytical framework to balance the quantity and quality of economic growth. The GT refers to the production and exportation of environmentally friendly goods to reduce pollution and achieve sustainable development. However, GT exports may cause environmental pollution during the production processes [47]. Consequently, this study examines the effect of GT exports on GTFP and environmental issues using a panel dataset from 2003 to 2016 in OECD nations using linear and nonlinear models.
First, we explored the influence of GT exports on GTFP using a fixed effects model. The empirical results show that GT exports have an evident negative effect on GTFP—and Liu et al. [19] approached the same results. This can be explained by the fact that environmental products are produced in the process owing to the industrial capabilities [16,49]. For the control variables, clean energy, unemployment, FDI, and population can promote the growth of GTFP; otherwise, the level of economic growth will decrease the growth of GTFP due to “high pollution, high consumption, and high emission”. Second, we investigated the relationship between GT exports and GTFP by using the polynomial of GT exports and observed an inverse “N-shaped” relationship between GT exports and GTFP in OECD countries. When GT exports do not exceed the first turning point, they will decrease the growth of GTFP, and when GT exports are between the first and second turning points, the effect of GT exports on GTFP is positive. When GT exports exceed the second turning point, their effect on GTFP is, again, negative. Third, this study explored the nonlinear relationship between GT exports and GTFP using clean energy and the level of R&D as threshold variables. The results showed that both clean energy and R&D have a single threshold value for GTFP. When the threshold variable is in the first stage, GT exports have a negative effect on GTFP; however, when the threshold value is in the second stage, GT exports can promote growth in GTFP. Hence, according to our results, this study argues that with the development of clean energy and R&D levels, the marginal effect of GT exports on GTFP will be stronger and improve the growth of GTFP.
The findings of this study reveal significant insights into the relationships between green trade exports (GTE), green total factor productivity (GTFP), and greenhouse gas emissions in OECD countries. While the results indicate a complex interplay between these variables, the implications for policymakers and managers require further elaboration to ensure actionable insights are derived from the research.
The study finds that the impact of GTE on GTFP follows an inverted N-shaped curve. This suggests that the benefits of green trade are not uniform and depend on the level of green trade activity. Policymakers should tailor their strategies according to different stages of green trade development. In the initial stages, support may be necessary to mitigate potential negative impacts, while at higher levels, efforts should focus on maximizing positive effects.
This analysis indicates that GTE promotes GTFP growth when clean energy use and research and development (R&D) investment exceed certain thresholds. This finding underscores the importance of complementary factors in enhancing the effectiveness of green trade. Policymakers should prioritize investments in clean energy infrastructure and R&D to support green trade initiatives. This may involve targeted subsidies, tax incentives, or public–private partnerships aimed at boosting these sectors.
The results show that GTE impedes traditional TFP development and does not significantly reduce CO2 and PM2.5 emissions in the linear model. This suggests that the transition to green trade may incur short-term economic costs, and environmental benefits may not be immediate. Policymakers must engage in long-term planning and be prepared to address short-term challenges through targeted support for affected industries and workers.
While this study focuses on OECD countries, the findings are relevant for developing nations as well. Policymakers in these countries should carefully consider the sequencing of their policies. Investments in clean energy and R&D capabilities may need to precede or accompany green trade promotion to maximize benefits and ensure sustainable development.
Managers should anticipate the nonlinear effects of green trade on productivity and plan accordingly. This may involve adopting phased approaches to green technology adoption and export strategies to align with the findings of this study. Firms should consider investing in clean energy and R&D capabilities alongside the development of green products to maximize the benefits derived from green trade. Given the complexity of the relationship between GTE and GTFP, managers should prioritize the development of a workforce equipped with diverse skills in both traditional and green technologies to enhance productivity. The initial negative impacts on traditional TFP indicate that managers should adopt a long-term view when transitioning to green trade, preparing for potential short-term challenges while focusing on sustainable growth.
Policymakers should adopt an integrated approach that combines green trade promotion with investments in clean energy and R&D to ensure comprehensive support for sustainable development. Given the nonlinear relationships observed, policies should be flexible and adaptable to various stages of green trade development, allowing for adjustments based on real-time data and outcomes. Programs should be implemented to support industries and workers during the transition to green trade, particularly in sectors that may initially experience negative impacts, ensuring a smooth transition to sustainable practices. Knowledge sharing and technology transfer between OECD and developing countries should be encouraged to assist the latter in navigating the challenges associated with green trade adoption. Robust systems should be established to monitor the impacts of green trade on both economic and environmental outcomes, enabling timely policy adjustments as necessary to achieve desired sustainability goals.
Author Contributions
Conceptualization, C.H.C. and N.R.P.; methodology, C.H.C.; software, N.R.P.; validation, N.R.P., H.S.Y. and C.H.C.; formal analysis, C.H.C.; investigation, N.R.P.; resources, H.S.Y.; data curation, N.R.P.; writing—original draft preparation, C.H.C.; writing—review and editing, H.S.Y.; visualization, C.H.C.; supervision, C.H.C.; project administration, N.R.P.; funding acquisition, H.S.Y. and C.H.C. All authors have read and agreed to the published version of the manuscript.
Funding
This research received no external funding.
Institutional Review Board Statement
Not applicable.
Informed Consent Statement
Informed consent was obtained from all subjects involved in the study.
Data Availability Statement
All data supporting reported results can be found in World Bank, UN database.
Conflicts of Interest
The authors declare no conflicts of interest.
References
- IPCC. AR6 Synthesis Report: Climate Change 2023; IPCC: Geneva, Switzerland, 2023. [Google Scholar]
- Ahmed, Z.; Le, H.P. Linking Information Communication Technology, Trade Globalization Index, and CO2 Emissions: Evidence from Advanced Panel Techniques. Environ. Sci. Pollut. Res. 2020, 28, 8770–8781. [Google Scholar] [CrossRef] [PubMed]
- United Nations. Transforming Our World: The 2030 Agenda for Sustainable Development; United Nations: New York, NY, USA, 2015. [Google Scholar]
- Xu, Z.C.; Li, Y.J.; Chau, N.S.; Dietz, T.; Li, C.B.; Wan, L.W.; Zhang, J.D.; Zhang, L.W.; Li, Y.K.; Chung, M.G.; et al. Impacts of International Trade on Global Sustainable Development. Nat. Sustain. 2020, 3, 964–971. [Google Scholar] [CrossRef]
- Steen-Olsen, K.; Weinzettel, J.; Cranston, G.; Ercin, A.E.; Hertwich, E.G. Carbon, Land, and Water Footprint Accounts for the European Union: Consumption, Production, and Displacements through International Trade. Environ. Sci. Technol. 2012, 46, 10883–10891. [Google Scholar] [CrossRef] [PubMed]
- Blanco, E.; Razzaque, J. Ecosystem Services and Human Well-Being in a Globalized World: Assessing the Role of Law. Hum. Rights Q. 2009, 31, 692–720. [Google Scholar] [CrossRef]
- Buysse, J.; Can, M.; Gozgor, G. Globalization Outcomes and the Real Output in the Sub-Saharan Africa LICs: A Cointegration Analysis. Econ. Res. 2018, 31, 338–351. [Google Scholar]
- Xie, Q.C.; Wu, H. How Does Trade Development Affect Environmental Performance? New Assessment from Partially Linear Additive Panel Analysis. Environ. Impact Assess. Rev. 2021, 89, 106590. [Google Scholar] [CrossRef]
- Mrabet, Z.; Alsamara, M.; Mimouni, K.; Mnasri, A. Can Human Development and Political Stability Improve Environmental Quality? New Evidence from the MENA Region. Econ. Model. 2021, 94, 28–44. [Google Scholar] [CrossRef]
- Ahmad, M.; Jabeen, G.; Wu, Y. Heterogeneity of Pollution Haven/Halo Hypothesis and Environmental Kuznets Curve Hypothesis across Development Levels of Chinese Provinces. J. Clean. Prod. 2021, 285, 124898. [Google Scholar] [CrossRef]
- Li, J.M.; Dong, K.Y.; Dong, X.C.; Shahbaz, M. How Green Trade Influences Pollution Emissions in China: A Provincial Perspective. Energy Econ. 2022, 115, 106014. [Google Scholar] [CrossRef]
- Liu, H.L.; Zhang, J.H.; Lei, H. Do Imported Environmental Goods Reduce Pollution Intensity? The End Use Matters. Energy Econ. 2022, 112, 106148. [Google Scholar] [CrossRef]
- Huang, J.B.; Yang, Q.O.; Feng, C. Green Trade Assessment for Sustainable Development of Chinese Ferrous Metal Industry. J. Clean. Prod. 2020, 249, 119135. [Google Scholar] [CrossRef]
- Hu, X.; Pollitt, H.; Pirie, J.; Mercure, J.; Liu, J.; Meng, J.; Tao, S. The Impacts of the Trade Liberalization of Environmental Goods on Power System and CO2 Emissions. Energy Policy 2020, 140, 111359. [Google Scholar] [CrossRef]
- Wan, R.; Nakada, M.; Takarada, Y. Trade Liberalization in Environmental Goods. Resour. Energy Econ. 2018, 51, 44–66. [Google Scholar] [CrossRef]
- Paramati, S.R.; Mo, D.; Huang, R. The Role of Financial Deepening and Green Technology on Carbon Emissions: Evidence from Major OECD Economies. Finance Res. Lett. 2020, 41, 101794. [Google Scholar] [CrossRef]
- World Bank. International Trade and Climate Change, Economic, Legal, and Institutional Perspectives; World Bank: Washington, DC, USA, 2008. [Google Scholar]
- Zugravu-Soilita, N. The Impact of Trade in Environmental Goods on Pollution: What Are We Learning from the Transition Economies’ Experience? Environ. Econ. Policy Stud. 2018, 20, 785–827. [Google Scholar] [CrossRef]
- Liu, H.L.; Zhang, J.H.; Huang, H.Y.; Wu, H.T.; Hao, Y. Environmental Good Exports and Green Total Factor Productivity: Lessons from China. Sustain. Dev. 2022, 31, 1681–1703. [Google Scholar] [CrossRef]
- Wan, R.; Wen, J.F. The Environmental Conundrum of Rare Earth Elements. Environ. Resour. Econ. 2017, 67, 157–180. [Google Scholar] [CrossRef]
- Liu, Z.; Zhang, M.L.; Liu, Q.M.; Zhao, X. The Impact of Green Trade Barriers on Agricultural Green Total Factor Productivity: Evidence from China and OECD Countries. Econ. Anal. Policy 2023, 78, 319–331. [Google Scholar] [CrossRef]
- Can, M.; Ben Jebli, M.; Bursselaers, J. Exploring the Impact of Trading Green Products on the Environment: Introducing the Green Openness Index. SSRN Electron. J. 2021. Available online: https://mpra.ub.uni-muenchen.de/106730/ (accessed on 21 August 2024).
- Can, M.; Ahmed, Z.; Mercan, M.; Kalugina, O.A. The Role of Trading Environment-Friendly Goods in Environmental Sustainability: Does Green Openness Matter for OECD Countries? J. Environ. Manag. 2021, 295, 113131. [Google Scholar] [CrossRef]
- Hashmi, R.; Alam, K. Dynamic Relationship among Environmental Regulation, Innovation, CO2 Emissions, Population, and Economic Growth in OECD Countries: A Panel Investigation. J. Clean. Prod. 2019, 231, 1100–1109. [Google Scholar] [CrossRef]
- Hui, Z.; Choi, C.H. Is Carbon Emission Trading Policy a Panacea? The Implications of Promoting Green Total Factor Productivity. Asia Pac. Econ. Lit. 2024. [Google Scholar] [CrossRef]
- Yin, Z.H.; Zhang, T.H.; Choi, C.H. Toward Sustainable Development: Does Digitalization Narrow the Gender Gap in the Labor Market? Sustain. Dev. 2023, 31, 3528–3539. [Google Scholar] [CrossRef]
- Choi, C.-H.; Zhou, X.; Ko, J.-O. Can Human Capital Drive Sustainable International Trade? Evidence from BRICS Countries. Sustainability 2024, 16, 135. [Google Scholar] [CrossRef]
- Yin, Z.H.; Choi, C.H. Economic and Non-Economic Determinants of Environmental Sustainability in the Long Run Evidence from G20 Economies. J. Korea Trade 2022, 26, 1–19. [Google Scholar] [CrossRef]
- Erdogan, A.M. Bilateral Trade and the Environment: A General Equilibrium Model Based on New Trade Theory. Int. Rev. Econ. Financ. 2014, 34, 52–71. [Google Scholar] [CrossRef]
- Cole, M.A. Trade, the Pollution Heaven Hypothesis and the Environmental Kuznets Curve: Examining the Linkages. Ecol. Econ. 2004, 48, 71–81. [Google Scholar] [CrossRef]
- Partnership for Action on Green Economy (PAGE). The Green Economy Progress Measurement Framework; PAGE: Geneva, Switzerland, 2017. [Google Scholar]
- May, R.; Jackson, C.R.; Middel, H.; Stokke, B.G.; Verones, F. Life-Cycle Impacts of Wind Energy Development on Bird Diversity in Norway. Environ. Impact Assess. Rev. 2021, 90, 106635. [Google Scholar] [CrossRef]
- European Parliament. Plurilateral Environmental Goods Agreement (EGA); European Parliament: Brussels, Belgium, 2019. [Google Scholar]
- Yu, V.P. WTO Negotiating Strategy on Environmental Goods and Services for Asian Developing Countries; ICTSD Programme on Trade and Environment: Geneva, Switzerland, 2007. [Google Scholar]
- Huang, L.H.; Zhao, W. The Impact of Green Trade and Green Growth on Natural Resources. Resour. Policy 2022, 77, 102636. [Google Scholar] [CrossRef]
- Hamwey, R. Environmental Goods: Where Do the Dynamic Trade Opportunities for Developing Countries Lie? International Centre for Trade and Sustainable Development: Geneva, Switzerland, 2005. [Google Scholar]
- UNEP. Trade in Environmentally Sound Technologies: Implications for Developing Countries; UNEP: Nairobi, Kenya, 2018. [Google Scholar]
- Melo, J.D.; Vijil, M. Barriers to Trade in Environmental Goods and Environmental Services: How Important Are They? How Much Progress at Reducing Them? CEPR Discussion Papers: London, UK, 2014. [Google Scholar]
- Hao, L.-N.; Umar, M.; Khan, Z.; Ali, W. Green Growth and Low Carbon Emission in G7 Countries: How Critical the Network of Environmental Taxes, Renewable Energy and Human Capital Is? Sci. Total Environ. 2021, 752, 141853. [Google Scholar] [CrossRef]
- Cheng, Z.; Kong, S. The Effect of Environmental Regulation on Green Total-Factor Productivity in China’s Industry. Environ. Impact Assess. Rev. 2022, 94, 106754. [Google Scholar] [CrossRef]
- de Alwis, J.M.D.D.J. Environmental Consequence of Trade Openness for Environmental Goods. Sri Lankan J. Agric. Econ. 2014, 16, 79–98. [Google Scholar] [CrossRef]
- Abid, M.; Sekrafi, H. Pollution Haven or Halo Effect? A Comparative Analysis of Developing and Developed Countries. Energy Rep. 2021, 7, 4862–4871. [Google Scholar]
- Zhu, J. Data Envelopment Analysis vs. Principal Component Analysis: An Illustrative Study of Economic Performance of Chinese Cities. Eur. J. Oper. Res. 1998, 111, 50–61. [Google Scholar]
- Tone, K. A Slacks-Based Measure of Efficiency in Data Envelopment Analysis. Eur. J. Oper. Res. 2001, 130, 498–509. [Google Scholar] [CrossRef]
- Cooper, W.W.; Seiford, L.M.; Tone, K.; Zhu, J. Some Models and Measures for Evaluating Performances with DEA: Past Accomplishments and Future Prospects. J. Prod. Anal. 2007, 28, 151–163. [Google Scholar] [CrossRef]
- Brunnermeier, S.B.; Levinson, A. Examining the Evidence on Environmental Regulations and Industry Location. J. Environ. Dev. 2016, 13, 6–41. [Google Scholar] [CrossRef]
- Chung, Y.H.; Färe, R.; Grosskopf, S. Productivity and Undesirable Outputs: A Directional Distance Function Approach. J. Environ. Manage. 1997, 51, 229–240. [Google Scholar] [CrossRef]
- Oh, D.; Lee, J. A Metafrontier Approach for Measuring Malmquist Productivity Index. Empir. Econ. 2010, 38, 47–64. [Google Scholar] [CrossRef]
- Oh, D. A Global Malmquist–Luenberger Productivity Index. J. Prod. Anal. 2010, 34, 183–197. [Google Scholar] [CrossRef]
- APEC. Annex C—APEC List of Environmental Goods; APEC: Singapore, 2012. [Google Scholar]
- Ahmed, F.; Kousar, S.; Pervaiz, A.; Trinidad-Segovia, J.E.; Casado-Belmonte, M.d.P. Role of Green Innovation, Trade and Energy to Promote Green Economic Growth: A Case of South Asian Nations. Environ. Sci. Pollut. Res. 2022, 29, 6871–6885. [Google Scholar] [CrossRef]
- Alper, A.; Oguz, O. The Role of Renewable Energy Consumption in Economic Growth: Evidence from Asymmetric Causality. Renew. Sust. Energ. Rev. 2016, 60, 953–959. [Google Scholar] [CrossRef]
- Antweiler, W.; Copeland, B.R.; Taylor, M.S. Is Free Trade Good for the Environment? Am. Econ. Rev. 2001, 91, 877–908. [Google Scholar] [CrossRef]
- Apergis, N.; Payne, J.E. Renewable Energy Consumption and Economic Growth: Evidence from a Panel of OECD Countries. Energy Policy 2010, 38, 656–660. [Google Scholar] [CrossRef]
- Grossman, G.M.; Krueger, A.B. Economic Growth and the Environment. Q. J. Econ. 1995, 110, 353–377. [Google Scholar] [CrossRef]
- Segerson, K.; Pearce, D.W.; Turner, R.K. Economics of Natural Resources and the Environment. Land. Econ. 1991, 67, 272. [Google Scholar] [CrossRef]
- Cole, M.A.; Elliott, R.J.R. Determining the Trade–Environment Composition Effect: The Role of Capital, Labor and Environmental Regulations. J. Environ. Econ. Manage. 2003, 46, 363–383. [Google Scholar] [CrossRef]
- Färe, R.; Grosskopf, S.; Whittaker, G. Network DEA. In Modeling Data Irregularities and Structural Complexities in Data Envelopment Analysis; Springer Science & Business Media: New York, NY, USA, 2007; pp. 209–240. [Google Scholar]
- Shahbaz, M.; Loganathan, N.; Zeshan, M.; Zaman, K. Does Renewable Energy Consumption Add in Economic Growth? An Application of Auto-Regressive Distributed Lag Model in Pakistan. Renew. Sust. Energ. Rev. 2015, 44, 576–585. [Google Scholar] [CrossRef]
- Stern, D.I. The Rise and Fall of the Environmental Kuznets Curve. World Dev. 2004, 32, 1419–1439. [Google Scholar] [CrossRef]
- Wooldridge, J.M. Econometric Analysis of Cross Section and Panel Data, 2nd ed.; MIT Press: Cambridge, MA, USA, 2010. [Google Scholar]
- Zhou, Y.; Xu, Y.; Liu, C.; Fang, Z.; Fu, X.; He, M. The threshold effect of China’s financial development on green total factor productivity. Sustainability 2019, 11, 3776. [Google Scholar] [CrossRef]
- Wang, X.; Luo, Y. Has technological innovation capability addressed environmental pollution from the dual perspective of FDI quantity and quality? Evidence from China. J. Clean. Prod. 2020, 258, 120941. [Google Scholar] [CrossRef]
- Chote, R.; Daniel, D. Asia’s ripple effect: In the second of two articles on the anniversary of the financial crisis, Robert Chote and Daniel Dombey look at how its influence has spread to other emerging markets. Financial Times, 25 June 1998; p. 25. [Google Scholar]
- Wang, K.L.; Pang, S.Q.; Ding, L.L.; Miao, Z. Combining the biennial Malmquist–Luenberger index and panel quantile regression to analyze the green total factor productivity of the industrial sector in China. Sci. Total Environ. 2020, 739, 140280. [Google Scholar] [CrossRef]
- Wang, M.L.; Pang, S.L.; Hmani, I.; Li, C.F.; He, Z.X. Towards sustainable development: How does technological innovation drive the increase in green total factor productivity? Sustain. Dev. 2020, 29, 217–227. [Google Scholar] [CrossRef]
- Chen, L.; Zhang, X.; He, F.; Yuan, R. Regional green development level and its spatial relationship under the constraints of haze in China. J. Clean. Prod. 2019, 210, 376–387. [Google Scholar] [CrossRef]
Disclaimer/Publisher’s Note: The statements, opinions and data contained in all publications are solely those of the individual author(s) and contributor(s) and not of MDPI and/or the editor(s). MDPI and/or the editor(s) disclaim responsibility for any injury to people or property resulting from any ideas, methods, instructions or products referred to in the content. |
© 2024 by the authors. Licensee MDPI, Basel, Switzerland. This article is an open access article distributed under the terms and conditions of the Creative Commons Attribution (CC BY) license (https://creativecommons.org/licenses/by/4.0/).