Article

Assessment of the Spatio-Temporal Dynamics in Urban Green Space via Intensity Analysis and Landscape Pattern Indices: A Case Study of Taiyuan, China

by
Yang Liu
1,2,*,
Mohd Johari Mohd Yusof
1,*,
Balqis Mohamed Rehan
3 and
Junainah Abu Kasim
4
1
Faculty of Design and Architecture, Department of Landscape Architecture, Universiti Putra Malaysia, Serdang 43400, Malaysia
2
Department of Design and Art, Taiyuan Institute of Technology, Taiyuan 030008, China
3
Faculty of Engineering, Department of Civil Engineering, Universiti Putra Malaysia, Serdang 43400, Malaysia
4
Kuala Lumpur City Hall, Kuala Lumpur 50350, Malaysia
*
Authors to whom correspondence should be addressed.
Sustainability 2024, 16(19), 8363; https://doi.org/10.3390/su16198363
Submission received: 21 August 2024 / Revised: 19 September 2024 / Accepted: 24 September 2024 / Published: 26 September 2024
(This article belongs to the Special Issue Urban Green Areas: Benefits, Design and Management Strategies)

Abstract

:
Urban green space (UGS) is a crucial physical area that supports the functioning of urban ecosystems, and its changes affect urban ecological balance. In order to accurately analyze the dynamic processes and transfer targets of UGS during urbanization, this study proposes a new method of UGS assessment based on multi-temporal Landsat remote sensing data. This method is integrated with intensity analysis and landscape pattern indices so as to explore the spatio-temporal dynamics of the evolution process, landscape pattern, and driving forces of UGS from 2000 to 2022 in the resource-based city of Taiyuan in central China. The results of the case study show that rapid urbanization brought about a continuous reduction in UGS in the study area, but the trend of decreasing gradually slowed down; UGS patches have become more dispersed and isolated, bare land has been targeted for both gains and losses of UGS, and ecological restoration of bare land mitigated the rapid reduction of UGS. The results of this study not only confirm the applicability of this methodology for monitoring and assessing the evolution of UGS, but also reveal the identification of the targeting or avoidance of other categories during the conversion of UGS. Thus, the potential factors influencing changes in UGS can be analyzed to guide and safeguard sustainable development.

1. Introduction

The term urban green space (UGS) refers to all types of green spaces found in urban areas [1,2,3] and is the principal form of green infrastructure (GI) [4]. UGS is a permeable space covered with vegetation [5] that provides social, health, environmental, and economic benefits to people and communities [6,7]. In addition to being a crucial physical area that supports the functioning of urban ecosystems, UGS preserves the ecological equilibrium of cities and improves human well-being [8] both directly and indirectly [9]. At the same time, UGS is a significant element of cities [10] and is greatly impacted by urban development throughout its evolution and development process [8,11].
With the acceleration of urbanization, urban areas are expanding, and according to the UN Habitat (2020) report, between 2000 and 2015, urban areas expanded by 1.5% per year [12]. This fundamentally changes the pattern of land use, allowing UGS to rapidly evolve and be replaced by other types of land use [13], leading to significant reductions in UGS and severe fragmentation [14], and provoking the emergence of inter-related ecological issues in cities, such as the urban heat island effect [15], deteriorating air quality [16], urban flash floods [17], and loss of biodiversity [18]. Furthermore, optimal mitigation measures for extreme hazards will also be affected [19]. This trend is particularly evident in developing countries [20,21], especially in China, which has experienced an unprecedented scale and rate of urban expansion since 2000 [22]. The widespread extinction of UGS is a result of the predatory exploitation of the natural world combined with rapid urbanization.
Due to the serious issues related to the urban ecological environment, Chinese local governments have progressively implemented a number of policies to enhance and restore UGS. It is dedicated to harmonizing the interaction between humans and nature [23] and putting forth scientific urban planning principles. Therefore, a timely and accurate understanding of the types of changes that have occurred in UGS in the process of rapid urban development and ecological urban construction, and an assessment of the evolution process of UGS, can provide scientific support and a basis for the government and urban planners, and promote the balance between urban development and the ecological environment.
Thus far, it is relatively common and intuitive to use multi-temporal remote sensing data to monitor UGS changes, thus analyzing the number and direction of transformations between UGS and different land categories [22,23,24]. However, the research process directly utilizes the changes in the area of each land category in a conversion matrix, which can easily make the researcher focus on spurious or transient conversion processes, causing some limitations to the analysis of results [4,22,24,25,26]. However, intensity analysis can overcome these limitations and provide more systematic and comprehensive information for quantitatively measuring land use/cover changes [25,26,27]. Specifically, intensity analysis quantitatively analyzes the changes in the spatio-temporal dynamics of the conversion of land at three levels—the time interval level, category level, and transition level—and proposes targeting or avoidance in the process of changing land categories [26]. Therefore, taking advantage of intensity analysis will help to gain insight into the stage characteristics of UGS changes.
Landscape patterns refer to the characteristics of the spatial structure of the landscape, and landscape pattern indices are widely used to quantify changes in complex landscape patterns to numerically compare and evaluate ecological processes that potentially change in different regions or in the same region at different times [22,23,28,29]. Therefore, the detection of changes in landscape pattern indices can provide a detailed analysis of the spatial change patterns of UGS. As a result, combining intensity analysis with landscape pattern indices can be used as a new method to assess the spatial and temporal changes in UGS to more comprehensively analyze and identify the potential impacts of urbanization on its evolutionary process.
In summary, in the case of the urban areas of Taiyuan, a resource-based city in central China, this study presents a detailed method to quantitatively monitor the evolutionary process of the spatio-temporal dynamics of UGS using GIS and remote sensing data, combined with intensity analysis and landscape pattern analysis. Firstly, the spatio-temporal dynamics of UGS are analyzed using GIS with land use/cover change data from 2000 to 2022. Secondly, based on intensity analysis, a three-level organizational framework is applied to UGS to explain the stage characteristics of the UGS conversion process. Then, the ecosystem characteristics of UGS changes are analyzed and assessed through landscape pattern indices [29]. Finally, the driving forces affecting UGS changes are explored from a comprehensive perspective.
Many cities like Taiyuan in China, as well as in other developing countries, are experiencing serious environmental problems, struggling to achieve sustainable development, and seeking effective governance methods. However, most related studies have focused on central cities (Beijing, Shanghai, Guangzhou, etc.), and few studies have been conducted on resource-based cities [3,23]. Therefore, this study of Taiyuan’s UGS can be used as a reference when making decisions about the construction of an ecological environment in these cities.

2. Materials and Methods

2.1. Case Study

Taiyuan (111°30′–113°09′ E, 37°27′~38°25′ N) is the capital of Shanxi Province and is an important industrial city in central China for coal energy and heavy industry; coal production once accounted for 2.5% of China’s coal output [30]. In this study, the urban areas of Taiyuan were chosen as the study area, consisting of the Jiancaoping, Xinghualing, Yingze, Xiaodian, Wanbailin, and Jinyuan zones, with an area of about 1460 km2 (Figure 1). The study area is located in the Fen River Impact Plain at an altitude of 760 m and is surrounded by mountains to the east, west, and north. The Fen River passes through the city from north to south, with high terrain in the north and low terrain in the south [31].
After China joined the WTO (World Trade Organization) in 2001, the increased demand for energy and raw resources led to the rapid economic development of Taiyuan and an accelerated process of urbanization and industrialization, which resulted in a fundamental change in urban land use/cover, increasing environmental pollution, drying up of the river, and a rapid occupation of UGS [32]. Taiyuan was once listed among the top ten most polluted cities in the world and the most seriously air-polluted city in China [33,34]. Serious environmental problems have gradually been recognized by governments at the municipal, provincial, and national levels, and long-term ecological restoration and governance of UGS have been carried out. In February 2018, Taiyuan became the first national innovation demonstration zone for the sustainable development agenda in China with the theme of transforming and upgrading resource-based cities; it is known as the China Urban Sustainable Development Laboratory [33]. Therefore, the selection of this study area to explore UGS changes could provide practical knowledge for UGS construction in other resource-based cities.

2.2. Data and Classification

In this study, Landsat remote sensing image data from 2000, 2011, and 2022 were selected; they had an overall cloud cover of less than 1%, and data for months with dense vegetation were selected, as shown in Table 1. Data preprocessing included radiometric calibration, atmospheric correction, geometric correction, and image clipping, which were carried out using the ENVI software (version 5.3). Subsequently, visual interpretation was used to perform maximum likelihood supervised classification of remote sensing images from various periods to categorize urban areas into non-green space and green space [34]. Non-green space was further divided into built-up areas, water bodies, and bare land. Considering the complexity of the actual geography of urban areas in Taiyuan, where a variety of vegetation is interspersed and difficult to differentiate [32], in order to accurately quantify the area of green space, vegetation such as woodland, grassland, cropland, and wetland are classified as green space, called UGS [6,7,35]. Therefore, the land use/cover types in this study were divided into four categories: built-up areas, UGS, water bodies, and bare land. The advantage of this classification is that it can easily distinguish between built-up areas and green spaces in urban areas, thus improving the accuracy and consistency of UGS identification, which allows direct observation of changes in the distribution and extent of UGS [7,35]. The other data used in this study included DEM elevation data sourced from the China Geospatial Data Cloud and socio-economic data sourced from the Taiyuan Statistical Yearbook, including regional GDP, population, and urbanization rate.

2.3. Spatio-Temporal Data Overlay Analysis

This study used ArcGIS spatial overlay analysis to perform spatial calculations on classified land use/cover data from different years in the study area, creating a land use conversion matrix for different time periods to analyze the structural characteristics of land use changes and the number and direction of conversions between different land use types. Therefore, in this study, the map from 2000 was overlaid with the map from 2011 in order to generate a conversion matrix, as shown in Table 2; following which the map from 2011 was overlaid with the map from 2022 to generate a conversion matrix, as shown in Table 3. Each matrix (Table 2 and Table 3) provides a specific transition flow for each land category at a given time interval. The rows show the categories for the initial year of the time interval, and the total stock and gross loss columns for each land category in the initial year of the time interval are shown on the right. The columns show the categories for the final year of the time interval with the total stock and gross gain rows for each land category in the final year of the time interval at the bottom. Entries on the diagonal in the matrix represent the portion of each land category that was not changed, and entries off the diagonal represent the portion of land that was changed [23,26,28,36].

2.4. Change Intensity Analysis

This study was based on the creation of a land use conversion matrix for each time interval (Table 2 and Table 3). The three-level framework of intensity analysis was used to analyze changes in terms of the size and intensity of UGS. Each of the three levels was used to explore the progression in an increasingly detailed way [26].
The first level was the time interval level, which examined the size and annual rate of change in UGS at each time interval to determine the time intervals in which the overall annual rate of UGS changes was relatively rapid or slow.
Equation (1) defines the annual change intensity percentage for UGS, G C I T i , for any time interval T i , and Equation (2) defines the annual uniform intensity percentage for UGS, U I , for the entire time period, T n [37]. G C T i is the change area of UGS for T i , and LA is the area of the entire study region. If GCI < UI for any given T i , then the change intensity of UGS for T i is relatively slow, while the opposite means that the change in T i is relatively rapid [26].
G C I T i = G C T i L A × 1 T i × 100 %
U I = i n G C T i L A × 1 T n × 100 %
Three time points (i.e., the years 2000, 2011, and 2022) were transformed into two subsequent time intervals (i.e., T 1 = 2000–2011, T 2 = 2011–2022). This means that G C T 1 is the change area of UGS for T 1 , and G C T 2 is the change area of UGS for T 2 .
The second level is the metric level, which examines changes in the size and intensity of the gross loss or gross gain of UGS for each time interval. Equation (3) defines the annual intensity of the gross gain of UGS, G T i , for T i . Equation (4) defines the annual intensity of the gross loss of UGS, L T i , for T i .
G T i = G R T i G K b × 1 T i × 100 %
where G R T i is the area of the gross gain of UGS during T i , and G K b is the area of UGS at the end of T i .
L T i = G D T i G K a × 1 T i × 100 %
where G D T i is the area of the gross loss of UGS during the time interval T i , and G K a is the area of UGS at the beginning of T i .
The third level is the transition level, which examines how the size and intensity of transitions in each land category change when UGS is gained or lost in each time interval in order to identify which transitions are targeted or avoided.
Equation (5) defines the annual intensity of the transition, R T i N , from the land category N to UGS during T i . Equation (6) gives the annual uniform intensity of transition, W T i , from all non-UGS categories to UGS during T i . W T i in Equation (6) is the average of the annual intensity of the transition R T i N produced by Equation (5). If R T i N < W T i , then the gain of UGS avoids the category N , meaning that the gain of UGS during T i avoids the takeover of category N . If R T i N > W T i , then the gain of UGS targets category N , meaning that the gain of UGS during T i targets the takeover of category N .
R T i N = N G N K a × 1 T i × 100 %
where NG is the area of transition from the land category N to UGS, and N K a is the area of the land category N at the beginning of T i .
W T i = G R T i L A G K a × 1 T i × 100 %
where all the notations are the same as those described in the previous equations. L A G K a represents the sum of the areas of all the non-UGS categories at the beginning of T i .
Equation (7) defines the annual intensity of the transition, Q T i N , from UGS to the land category N during T i . Meanwhile, Equation (8) expresses the annual uniform intensity of the transition from UGS to all non-UGS categories, V T i , during T i . V T i in Equation (8) is the average of the annual intensity of the transition Q T i N produced by Equation (7). If Q T i N < V T i , then the loss of UGS avoids category N , meaning that the loss of UGS during T i avoids the transition to category N . If Q T i N > V T i , then the loss of UGS targets category N , meaning that the loss of UGS during T i targets the transition to category N .
Q T i N = G N N K b × 1 T i × 100 %
where GN is the area of transition from UGS to land category N , and N K b is the area of land category N , at the end of T i .
V T i = G D T i L A G K b × 1 T i × 100 %
where all the notations are the same as those described in the previous equations. L A G K b represents the sum of the areas of all the non-UGS categories at the end of T i .

2.5. Landscape Pattern Analysis

In this study, landscape pattern indices were used to identify changes in the landscape patterns of UGS in the same region at different time intervals and to analyze the changes in the distribution and combinations of UGS. FRAGSTATS version 4.2 was used to calculate the spatial indices for UGS, and nine indices were selected [22,23], as shown in Table 4. The nine indices were categorized into five types representing the size, proportion, number, shape, and spatial combination of landscape patches. Among them, PLAND was the index of the patch size of UGS; if PLAND decreased, it indicated that the area of the study area occupied by UGS decreased. LPI and MPS were the indices for the proportion of patches of UGS; if LPI and MPS decreased, this indicated that many small patches of UGS were produced, and the degree of fragmentation increased. NP and PD were the indices for the number of patches of UGS; if NP and PD increased, this indicated that there was an increased number of patches of UGS and a higher degree of UGS fragmentation. ED and LSI were the measures of the shape of UGS patches; if ED and LSI increased, it meant that more complex patches of UGS were produced. AI and SPLIT were the measures of the spatial combination of UGS patches; if AI decreased, it meant that the degree of aggregation of UGS patches decreased and the degree of fragmentation increased; if SPLIT increased, it meant that the degree of aggregation of UGS patches decreased and the degree of fragmentation increased.

3. Results

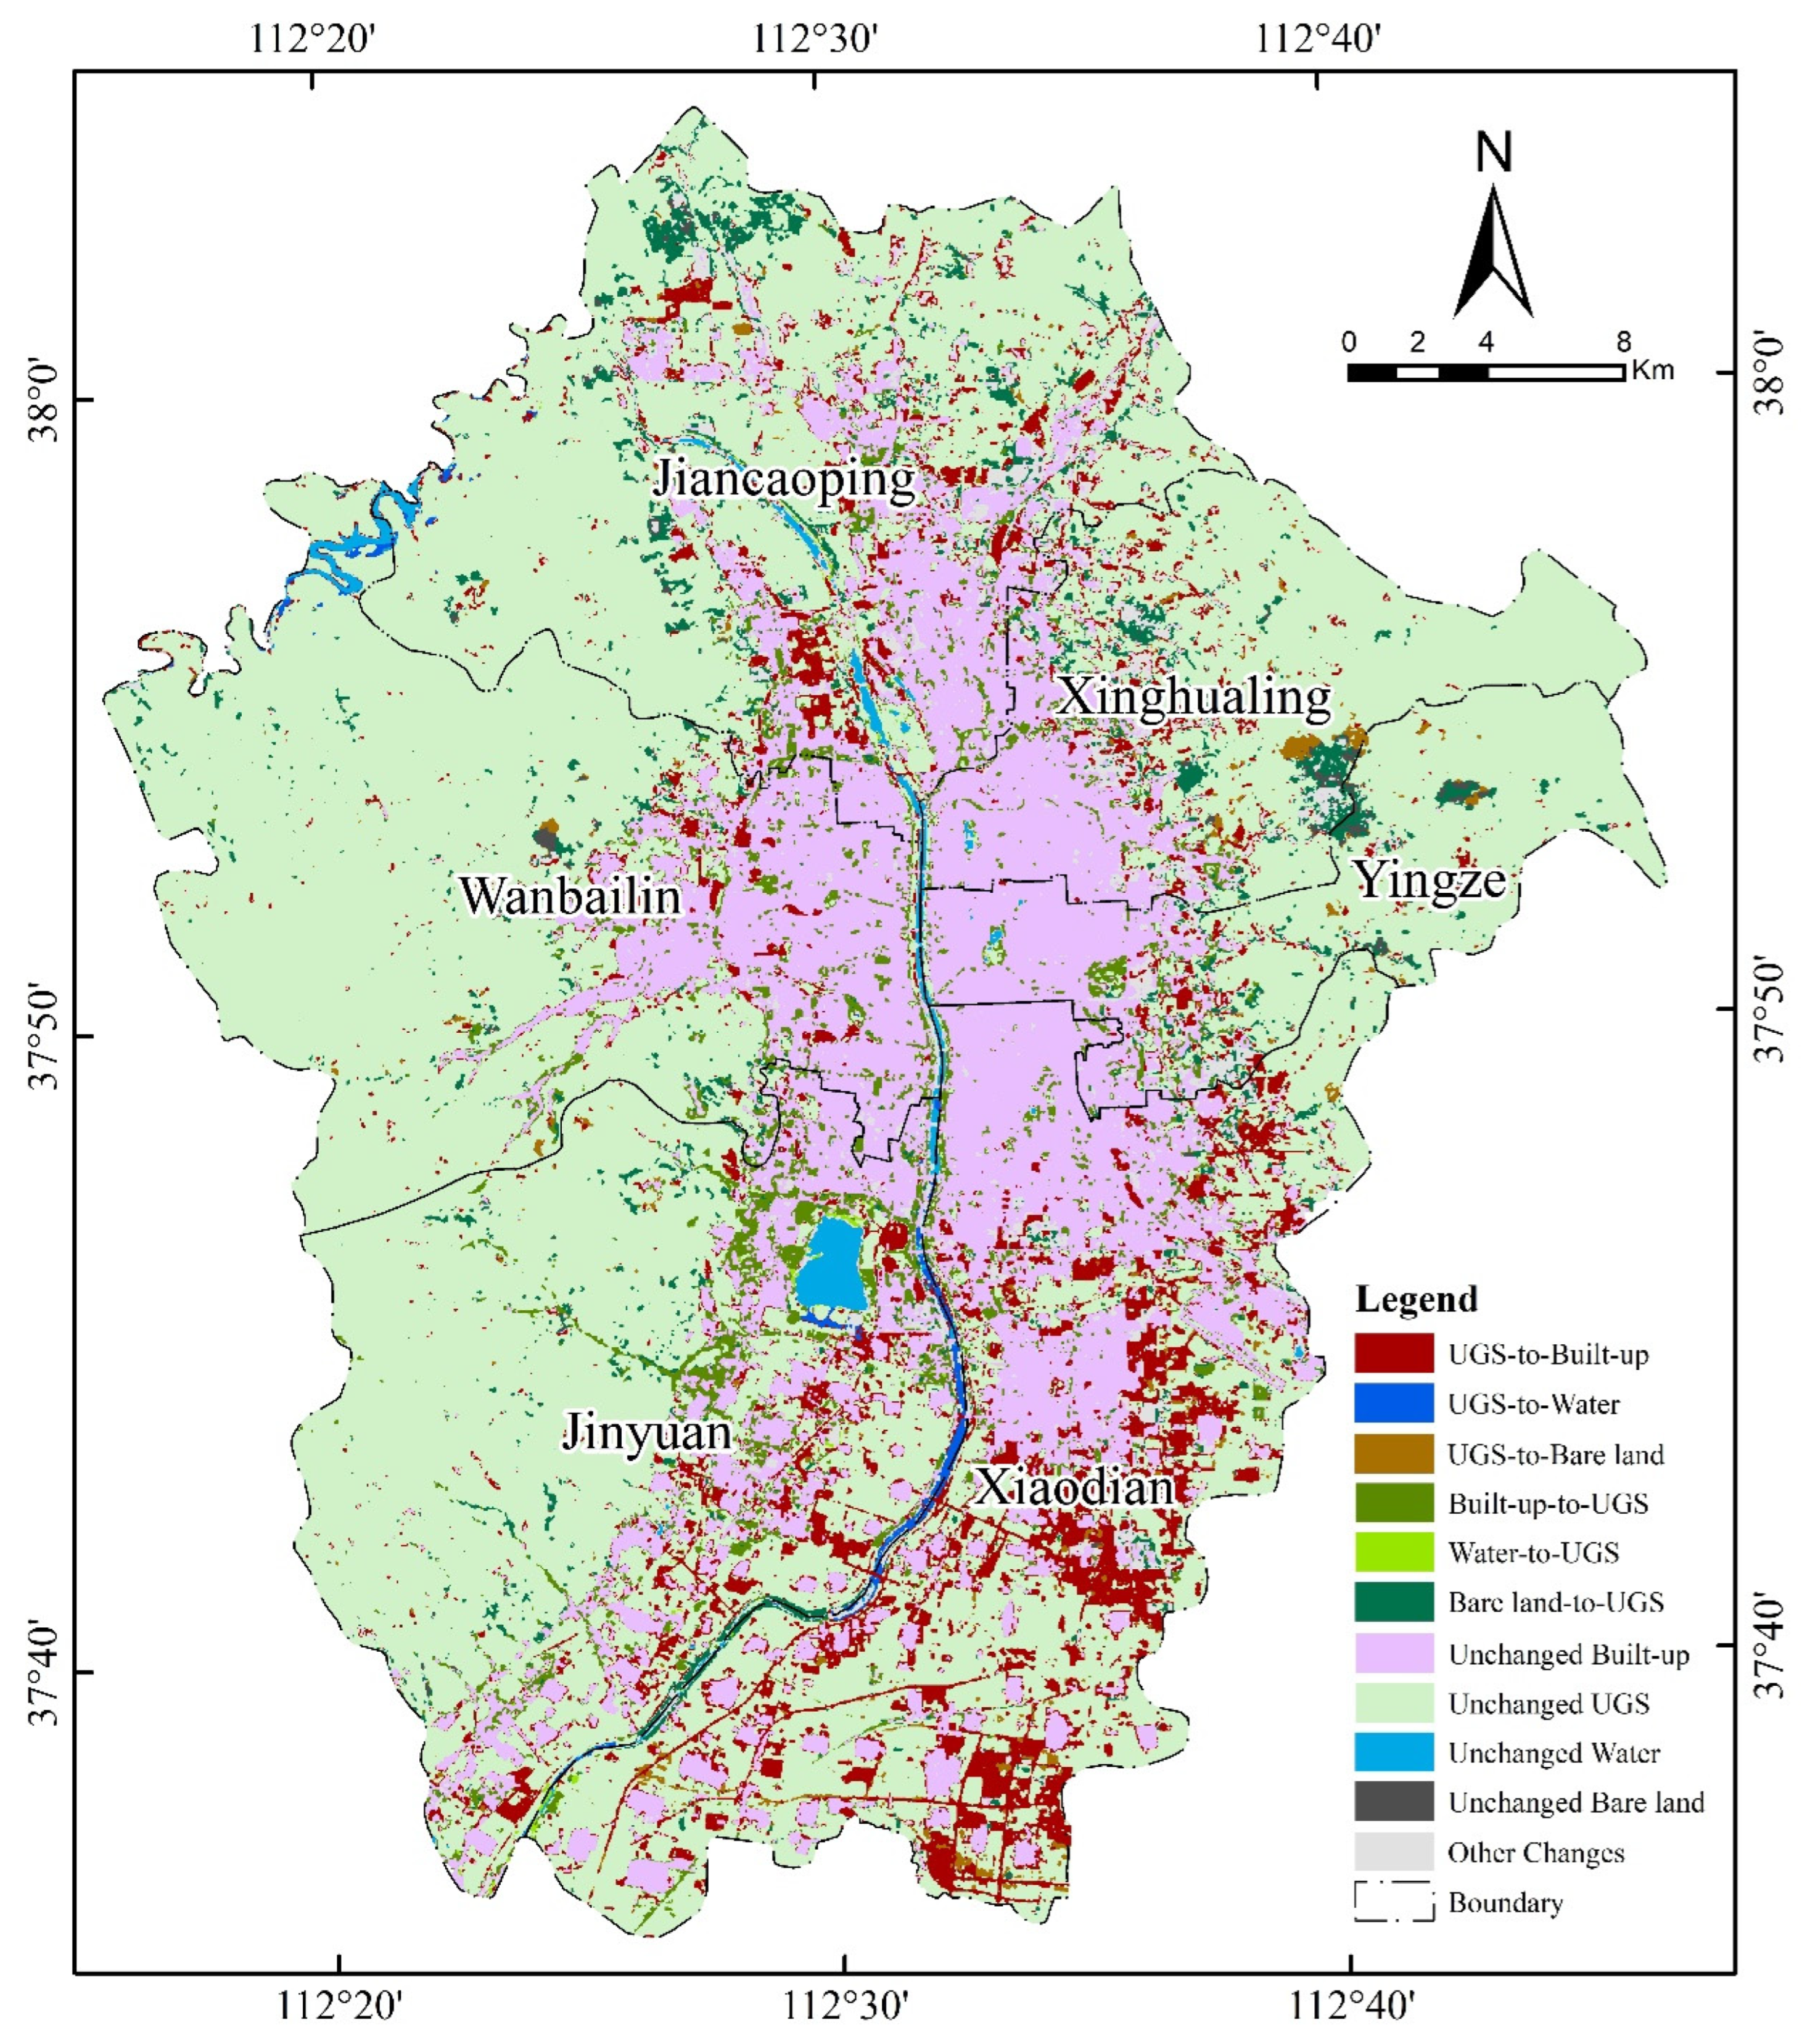
3.1. Analysis of Spatio-Temporal Changes in UGS

From 2000 to 2022, Taiyuan experienced rapid urbanization, with significant changes in the spatial pattern and quantity of land use types in the urban areas, as shown in Figure 2; the quantitative characteristics are shown in Table 5. Throughout the study period, the area of UGS showed a continuous decreasing trend, from 108,151 ha in 2000 to 98,255 ha in 2011, and further decreasing to 95,108 ha in 2022. The UGS decreased by a total of 13,043 ha, or 12.1% in area. The proportion decreased from 76.44% in 2000 to 67.22% in 2022.
In contrast, the built-up area continued to grow throughout the study period, increasing from 24,687 ha in 2000 to 32,908 ha in 2011 and continued to expand to 43,072 ha in 2022. The proportion increased from 17.45% in 2000 to 30.44% in 2022. The area of water bodies continued to increase, and bare land showed an increase, followed by a rapid decrease.
Based on the DEM elevation map of Taiyuan (Figure 1), it was found that the landform of Taiyuan, which is surrounded by mountains on three sides, determined land use, with an obvious vertical distribution. In mountainous areas above an elevation of 1300 m, the land use structure was simple and dominated by UGS. Low mountains and plains below an elevation of 1300 m had numerous land use types and complex structures, and were areas of concentrated built-up development and continuous expansion, thus leading to a serious loss of UGS in the region. In addition, differences in the changes in UGS among the different zones within the urban areas of Taiyuan were identified. Table 6 shows that the most significant decrease in UGS throughout the study period was in Xiaodian, located in the southeast, with a total decrease of 9441 ha, accounting for 72.4% of the total decrease in UGS in the study area. It is worth noting that the area of UGS in Wanbailin continued to increase throughout the study period, with a total increase of 1080 ha. In addition, the UGS of the other zones showed a significant decrease from 2000 to 2011, and a slight increase from 2011 to 2022.

3.2. Analysis of the Intensity of Changes in UGS

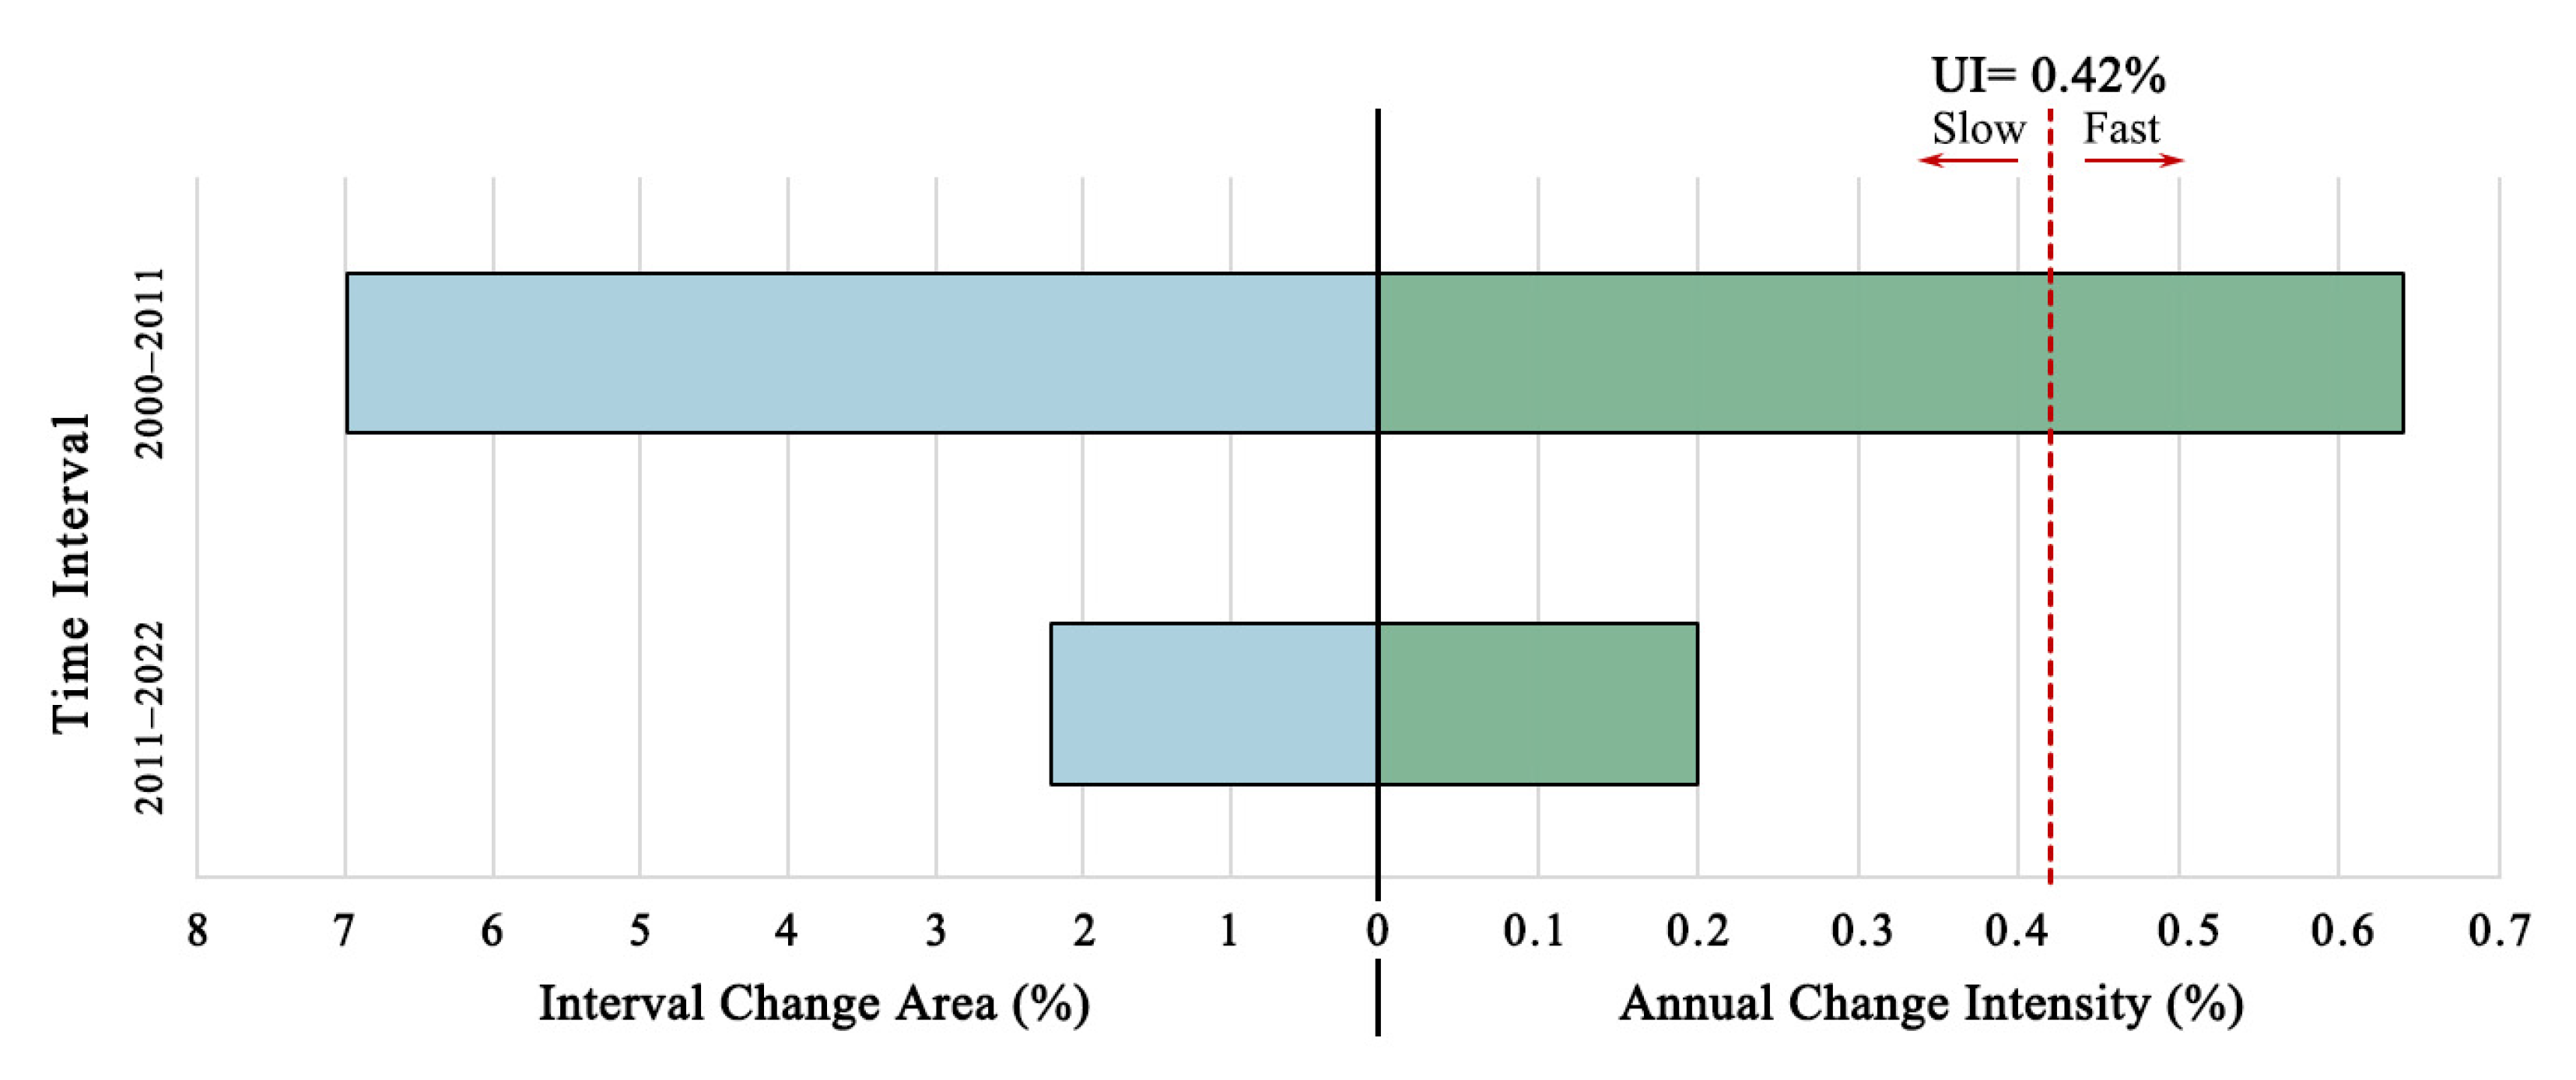
3.2.1. Intensity of UGS Changes at the Time Interval Level

Figure 3 shows the results of the intensity analysis of UGS in the study area for each time interval. The bars on the left show that the percentage of UGS change in 2000–2011 (6.99%) was larger than the percentage of UGS change in 2011–2022 (2.22%). The bars on the right side indicate that G C I T 1 was 0.64% in 2000–2011, and G C I T 2 was 0.2% in 2011–2022. Relative to the uniform temporal intensity, UI, the value of G C I T 1 was greater, while that of G C I T 2 was smaller. Therefore, the UGS in the study area showed a relatively rapid annual rate of change from 2000 to 2011.

3.2.2. Intensity of UGS at the Metric Level

Figure 4 shows the results of changes in the size and intensity of the total loss and gain of UGS for each time interval. The bars on the left show that from 2000 to 2011, the annual loss area of UGS was the highest during the entire study period, while the annual gain of UGS area was the lowest throughout the study period, and the difference between the values, i.e., the net annual change in the area of UGS, was 900 ha. From 2011 to 2022, the annual loss of the area of UGS decreased, while the annual gain of the area of UGS increased, and the net annual change in the area decreased to 286 ha. The bars on the right show that from 2000 to 2011, the annual intensity of UGS loss, L T 1 , was greater than the annual gain intensity, G T 1 . From 2011 to 2022, L T 2 was still greater than G T 2 . However, the annual loss intensity from L T 1 to L T 2 slowed down, while the annual gain intensity from G T 1 to G T 2 increased. From this point of view, the rate of change in UGS from a drastic decrease to a gentle decrease in the study area indicates that the development of UGS underwent a gradual transition from blind encroachment to rational planning.

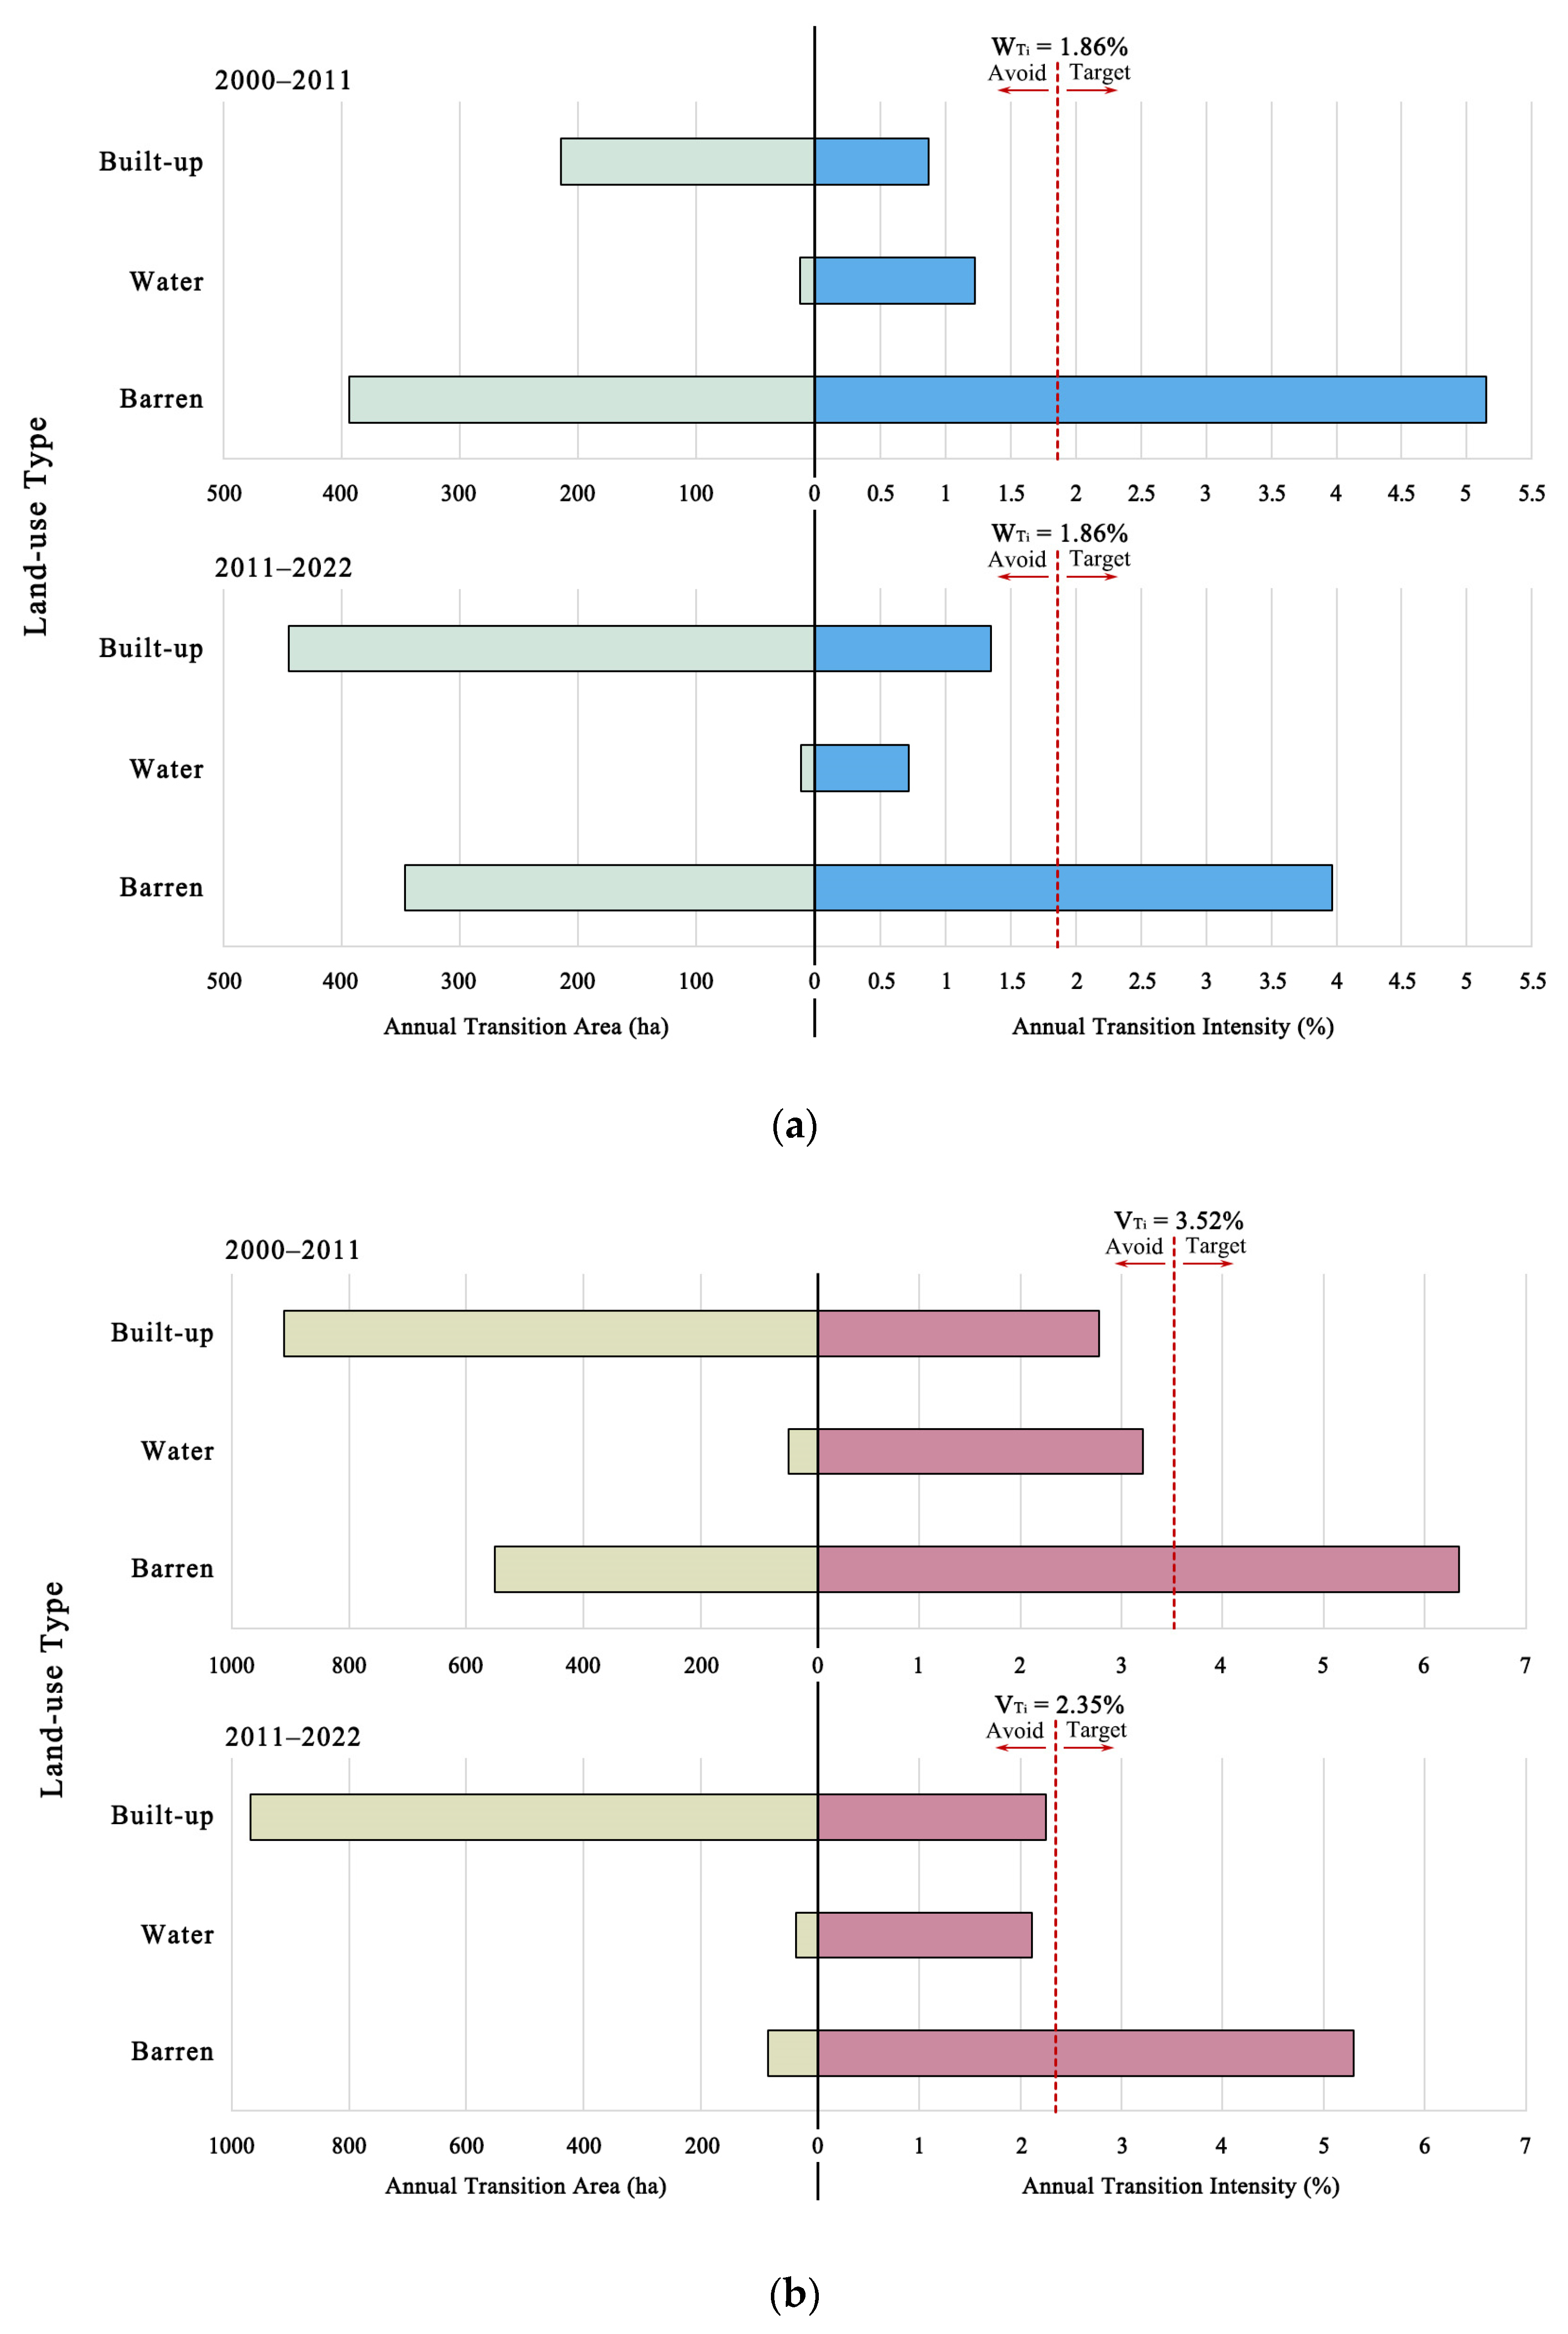
3.2.3. Intensity of UGS Changes at the Transition Level

Figure 5a shows the size of UGS gains and the intensity of the transitions. The bars on the left side show that the first UGS gains were from bare land, then from built-up areas, and finally from water bodies during 2000–2011. However, observing the bars on the right side, the intensity of UGS gains from bare land is much larger than that of the UGS gains from built-up areas and water bodies. The bar for bare land extends to the right of the uniform line, and the other categories extend to the left of the uniform line. This indicates that the gains in UGS targeted the takeover of the bare land.
The change in the area of UGS gains from 2011 to 2022 (Figure 6) shows that the areas of transition from bare land to UGS were situated in the shallow mountainous area to the west of Wanbailin, Jiancaoping, and Jinyuan. Apart from that, the areas of transition from built-up areas to UGS were situated in an area characterized by the convergence of built-up areas and UGS in Wanbailin and Jinyuan, as well as in the northern part of the two sides of the Fen River. From 2000 to 2011, severe pollution required extensive ecological management in the western mountains of Taiyuan, focusing on the management of areas characterized by subsidence through coal mining, a damaged surface of the mountain, and bare land formed by mineral waste and large-scale garbage dumping to generate UGS. In addition, the completion of the Fen River ecological corridor involved the conversion of built-up areas along the river banks into UGS.
The bars on the left of Figure 5a show that, from 2011 to 2022, more UGS was gained from built-up areas than from bare land and water bodies. However, the bars on the right in Figure 5a show that only the bar for bare land extends to the right of the uniform line. This indicates that the gains in UGS still targeted the takeover of bare land.
The change in the area of UGS gains from 2011 to 2022 (Figure 7) shows that the areas of transition from built-up areas to UGS were situated in the internal areas of the city and the areas around Jinyang Lake in Jinyuan. The areas in which bare land was converted into UGS were mainly situated in the eastern mountainous areas of Xinghualing, Yingze, and Wanbailin, part of the western mountainous areas of Jiancaoping, and the northern areas of Jiancaoping. From 2011 to 2022, the transition to UGS from built-up areas was influenced by the plan of Taiyuan to create a national ecological garden city and comprehensively improve the level of urban gardening and greening [38], thus adding many new urban parks and green spaces within the city and increasing the areas of UGS [39]. Bare land that was converted into UGS was mostly situated in the surplus space after the completion of construction for urbanization, as well as on destroyed mountain surfaces and mining areas.
Figure 5b shows the size of the UGS losses and intensity of the transition. The bars on the left side show that when UGS was lost from 2000 to 2011, the largest transition was to built-up areas, followed by a transition to bare land, and lastly, to water bodies. Examination of the right side of Figure 5b reveals that the greatest intensity of loss of UGS was when it was converted into bare land; only the bar for bare land extends to the right of the uniform line, while the other categories extend to the left of the uniform line. This indicates that the losses of UGS targeted the transition to bare land. Although the area of UGS that was converted into built-up areas was the largest, the intensity of the transition was relatively low due to the large distribution of built-up areas.
Figure 6 shows that from 2000 to 2011, the UGS converted into bare land was situated in the eastern mountainous areas of Xinghualing and Yingze and the northern part of Jiancaoping. The UGS converted into water bodies was situated around the Fen River in the center of the urban areas. The UGS converted into built-up areas was situated in the southern part of Xiaodian and Jinyuan, the inner part of Wanbailin, the northern part of Jiancaoping, and the urban fringes of other zones. The built-up areas had an overlapping pattern of internal infilling and external expansion. From 2000 to 2011, the expansion of the urban center to the south took up the small UGS in the plain areas of the urban areas, which were mainly cropland. However, with the promulgation of regulations for the protection of basic cropland in China and opinions on strengthening the balance of cropland occupation and compensation [40,41], the cost of occupying cropland for built-up areas gradually increased [42]. Thus, urban development had to be partially shifted to the gently hilly mountains to the east. As a result, during the process of urban development, a large amount of UGS in the eastern hilly mountainous areas was expropriated and developed. Nevertheless, the development of hilly areas is difficult, and the process of land leveling is extremely prone to concentration and the long-term presence of large areas of bare land, thus alleviating the occupation of cropland on plains, causing great damage to the natural landform of the mountains, and increasing the risk of geological and flooding hazards [17].
The bars on the left side of Figure 5b show that from 2011 to 2022, when UGS was lost, the largest amount was converted into built-up areas, which made up significantly greater proportions than those of bare land and water bodies. However, an examination of the right side of Figure 5b reveals that the intensity of the loss of UGS when it was converted into bare land was the most intensive, with only the bar for bare land extending to the right of the uniform line. This indicates that the UGS losses still targeted the transition to bare land. It is worth noting that the area converted from UGS into built-up areas increased compared with that from 2000 to 2011, while the loss intensity of the transition decreased due to the fact that built-up areas increased as a percentage of the overall study area.
Figure 7 shows that the area of UGS converted into bare land was drastically reduced and only sporadically appeared in the eastern mountainous area, western mountainous area, and southern part of the urban areas. The scope of UGS converted into built-up areas was situated in most parts of Xiaodian, the inner parts of Jinyuan and Wanbailin, and the periphery of Jiancaoping. From 2011 to 2022, as the shallow mountainous areas in the east were exhausted by development, urban expansion had to take place on the plains in the southeast. Constrained by policies and regulations [43], urban development has shown a tendency to expand in a decentralized manner.

3.3. Analysis of the Landscape Patterns of UGS

Table 7 shows the results of the analysis of the landscape indices of UGS, which allowed us to understand the structural characteristics of its spatio-temporal evolution. The percentage of UGS in the landscape (PLAND) indicates a continuous decrease in the area of UGS from 2000 to 2022. However, the trend in UGS reduction decreased after 2011. The number of patches (NP) and the patch density (PD) showed a trend of decreasing and then significantly increasing, while the edge density (ED) and landscape shape indicator (LSI) showed a similar trend, which can be explained by the patches first showing a compact and regular development pattern and then a severely fragmented development pattern. The percentage of the largest patch index (LPI) and mean patch size (MPS) in the landscape area continued to decline and showed a sharp downward trend after 2011, indicating that many small, fragmented patches of UGS were produced. The continuous decrease in the aggregation index (AI) and the sharp increase in the splitting index (SPLIT) indicated that the fragmentation of UGS increased, the distribution range gradually decreased, and the UGS was divided into smaller patches.

4. Discussion

UGS maintains the overall balance of urban ecosystems and is also influenced by the drivers of urban spatio-temporal dynamics [23]. Therefore, this section identifies the factors influencing the evolution of the spatio-temporal dynamics of UGS in terms of urban expansion, policies, economy, and population.

4.1. Impact of Urban Expansion on UGS

The evolution of UGS is intimately associated with the pattern of urban spatial expansion and phases of change [42]. Due to severe topographical constraints, the urban development of Taiyuan City has shown a trend of belt-shaped development over the last two decades, and its expansion has shown a pattern of southward development. Throughout the study period, the area of UGS showed a trend of continuous decrease as well as serious fragmentation. Xiaodian, located in the southeastern part of the study area, experienced the most serious loss of UGS. In Wanbailin, the area of UGS continued to increase throughout the study period, which was mainly attributed to the ecological management of the western mountainous areas by the municipal government of Taiyuan. In addition, the UGS in other zones showed a significant decrease from 2000 to 2011 and a slight increase from 2011 to 2022, which proves that Taiyuan has achieved some milestones in the process of optimizing the development of UGS.
The stages of change in UGS were analyzed using three levels of intensity. At the time interval level, the area of UGS in the study area continued to decrease throughout the study period, and the annual rate of change in UGS was higher from 2000 to 2011 than from 2011 to 2022. Analyzing the metric level, UGS gain and loss coexisted in the study area throughout the time period, and the intensity of the annual gain gradually increased while the intensity of the annual loss gradually decreased. This indicates that in the process of urban development and management, the rate of UGS reduction decreased and the intensity of change gradually slowed down. This trend of UGS change has been found in different large cities in China, such as Shanghai, Jinan, Changchun, and Guangzhou [3,13,23,34]. Analyzing the transition level throughout the study period, the UGS that was lost was mainly converted into built-up areas (20,718 ha), and the greatest gains in UGS came from bare land (8142 ha).
Specifically, when UGS was lost, the largest transition was to built-up areas during the entire study period, which was consistent with the findings of Luo [44] and Hou [45] on UGS in Taiyuan. They proposed methods for optimizing the layout of roads and controlling the expansion of built-up areas so as to protect UGS based on the observation that the largest transition was from UGS to built-up areas. However, by analyzing the transition intensity in greater depth phases, we found that the loss of UGS targeted the transition to bare land in two time intervals. This indicates that when UGS was lost, it tended to be intensively lost to the transition to bare land, more so than built-up areas, which was related to Taiyuan’s rapid urbanization and the development pattern of its industrial structure. The excessive development of construction, industry, urban infrastructure, mining of coal resources, and hilly areas due to land shortages directly led to the loss of vegetation cover, forming long-term unused bare land surfaces in the study area. This phenomenon is also present in the world’s cities with rapid urbanization [46,47] and in areas where mineral resources are exploited [48,49]. Therefore, we propose the hypothesis that detecting and controlling the rate of expansion of bare land and ecologically restoring it can promote the optimal development of UGS in this type of city. This is consistent with the conclusions presented by Wang [3] regarding the ecological restoration of bare land as the key to solving the contradiction between the development and protection of UGS.
However, when observing the gain in UGS in the study area, it was found that the largest transition thereof was from bare land during the entire study period. By analyzing the transition intensity, we found that UGS transitioned much more intensively from bare land than from other categories. This indicated that the UGS gains targeted the takeover of bare land. This reflects the fact that the Taiyuan government has continuously promoted the implementation of urban ecological restoration and greening policies for bare land, effectively curbing the rapid decrease in UGS. This result is consistent with our previous hypothesis. As a result, the intensity analysis not only studied the applicability and effectiveness of UGS in the urban areas of Taiyuan, but also has a certain guiding significance for the optimization and development of UGS.

4.2. Impact of Policies on UGS

The implementation of government policies is the main driver of changes in UGS [50]. In the case of Taiyuan urban areas, the area of UGS continued to decrease throughout the study period, but this decreasing trend gradually slowed down, as evidenced by the indicator percentage of landscape in UGS (PLAND). This result proved that some achievements were made in the process of optimization and development, while the policies formulated by the Taiyuan government played a significant role in the evolution of UGS.
Before 2000, Taiyuan lacked regulated and specific policies for UGS development, as it only focused on basic urban greening, such as road greening and urban parks [23]. Meanwhile, its urban economic development relied on coal mining and heavy industry, while crude production methods and disorderly urban expansion caused UGS to be sacrificed for urban economic development [20]. Driven by economic interests, a large number of small-scale industrial and mining enterprises (reaching 2000 at one point), such as coal mines, quarries, cement factories, and factories for building materials, concentrated in the western mountainous areas of urban areas in Taiyuan, formed a coal mining area of about 112 square kilometers and a destroyed mountain surface of about 10 square kilometers [51]. Long-term production by industrial and mining enterprises generates a large amount of industrial, mining, and bare land, resulting in the destruction of large areas of UGS [52]. Urban ecosystems are overwhelmed, causing serious problems in air and water environments, and air quality is among the worst in China [33,53].
From 2000 to 2011, rapid economic development promoted the rapid expansion of urban construction and rapid deterioration of UGS, which was centrally encroached upon and divided to form compact and regular patches. To cope with the aggravation of the urban ecological environment, Taiyuan proposed a sustainable development strategy and introduced urban planning and policies to transform traditional industries, optimize industrial structure, govern and improve the urban environment, and control the development of polluting enterprises [54]. Urban ecological construction has gradually been incorporated into the realm of urban infrastructure, and the pollution problem in the western mountainous area of Taiyuan has been included in the provincial key renovation project [55].
In 2011, the greening coverage rate in the western mountainous areas increased from less than 20% to 80%, and large areas of bare land were ecologically restored to form UGS, which led to originally fragmented UGS patches gathering and connecting to form large patches, driving the continuous growth of UGS in Wanbailin. In the same year, Taiyuan issued the “Implementing Opinions on Promoting the Construction of Western Mountainous Suburban Forest Park” to further improve the ecological management and restoration of the western mountains. As a result, the Western Mountain model of ecological restoration of UGS in urban areas of Taiyuan was gradually formed, and the “Western Mountains Model” became a typical case in the “Report on China’s Implementation of the 2030 Agenda for Sustainable Development (2021)”, which was included in the policy declaration document for the 50th anniversary of China’s resumption of its legal seat in the United Nations [51].
Between 2011 and 2022, the approach to urban construction and management in Taiyuan improved and the UGS rate of change drastically decreased. The “low-carbon city concept”, “the construction of national sustainable innovation development demonstration zones”, “sponge city construction management regulations”, “the implementation plan for creating a national ecological garden city”, and “the implementation plan for implementing the new development concept to comprehensively improve the level of urban landscaping” were successively proposed for the urban areas. These policies and strategies have promoted the development of UGS in Taiyuan, with a significant increase in the number of patches (NP) and density of patches (PD) in UGS, and UGS has been explicitly incorporated into planning policies for urban land use and development. Government administrators have progressively realized the importance of the urban ecological environment. Urban development does not simply occupy UGS but strives to compensate for the losses caused by occupying it. Administrators are exploring opportunities to expand UGS within a city, which also allows urban residents to experience its benefits.
In 2022, Taiyuan ranked fourth among Chinese cities, with 439 urban parks [39]. The UGS within the city was increased to a certain extent to meet the development of urbanization and residents’ demand for green space, and to improve the quality of the urban habitat [34]. In the game of urbanization expansion and protection of the ecological environment, the overall growth of UGS cannot be achieved as a whole, but the rapid loss of UGS has slowed. During 2011–2022, all zones, except Xiaodian, had already achieved the growth of UGS. This shows that policy formulation is crucial for the development of UGS. However, the increasing fragmentation and decreasing distribution range of UGS are still a cause for concern.

4.3. Impact of the Economy and Population on UGS

Economic development is an important driver of urban land use/cover change [22]. In 2001, China’s accession to the WTO stimulated energy demand. The economy of Taiyuan is driven by both coal resources and the fact that it is the capital of Shanxi Province, and its increased economic development led to a dramatic expansion of the city [33], with the GDP growing from 37.92 billion yuan (CNY) in 2000 to 557.12 billion yuan (CNY) in 2022 [54,56]. UGS is continuously eroded by urban development, thus providing a huge economic benefit that far exceeds the economic benefit of UGS [8]. The construction of government-led economic development zones, industrial parks, and real estate development constitute the driving force for the rapid and concentrated erosion of UGS. From 2000 to 2022, the average output value of cropland in the study area increased from 28,200 yuan/ha (CNY) to 210,700 yuan/ha (CNY), while the average output value of industrial land increased from 1,870,500 yuan/ha (CNY) to 14,596,400 yuan/ha (CNY). The average sales price of commercial housing increased from 2000 yuan/m2 (CNY) to 11,000 yuan/m2 (CNY) (data sourced from the Taiyuan Statistical Yearbook), and the huge gap in economic returns brought about a continuous reduction in UGS.
The continuous growth of the urban population constitutes a direct driving force for the expansion of urban space in Taiyuan [57]. The population of the urban areas of Taiyuan has increased from 2,267,000 in 2000 to 4,743,000 in 2022 (data sourced from the Taiyuan Statistical Yearbook). This rapid increase in the urban population has led to an increase in the demand for housing, infrastructure, and road transportation. The dramatic increase in demand for land resources has led to the continued expansion of urban areas, resulting in a rapid loss of UGS outside built-up areas. Analyzing the urban–rural structure of the population, the population of the study area shows a trend of concentration from rural to urban, and the urbanization rate continued to increase from 79.20% in 2000 to 89.34% in 2022. The increase in urban residents increases the demand for urban green infrastructure [8,34], forming a driving force for the growth of green space within built-up areas, which results in the generation of many small and fragmented UGS patches. The superposition of these bidirectional dynamics weakens the trend of overall UGS degradation.

4.4. Limitations

Land use/cover change monitoring using multi-temporal remote sensing data is the basis of this study. The main limitations of the study were the following: firstly, the study was limited to the utilization of available data; the data for the three time points were obtained from different Landsat images, and the months of data acquisition were July, August, and October. Secondly, the data used in the study were all collected at a resolution of 30 m, which is of low quality. All of these factors may impact the accuracy of the results of the land use/cover data simulation [3,4,22,45]. Future studies should consider the use of high-precision remote sensing satellite data and shorter time intervals for testing to further analyze and clarify the processes of UGS dynamics.

5. Conclusions

Taiyuan is engaged in a long-term struggle for sustainable development [33] and a series of response policies have been formulated to promote the development of UGS. By integrating intensity analysis and landscape pattern indices, this study analyzed the process of UGS changes and transitions in the urban areas of Taiyuan from 2000 to 2022. The results showed that, during the study period, although rapid urbanization led to a continuous decrease in UGS, the trend of this decrease gradually slowed. Moreover, both the gains and losses of UGS targeted bare land, and the ecological restoration of bare land mitigated the rapid loss of UGS and promoted the optimal development of UGS in Taiyuan. However, the overall reduction in the area of UGS, the serious fragmentation, and the uneven distribution are still urgent problems for the current government to intervene in and solve. This study also emphasizes the impacts of urban expansion, policies, the economy, and population on UGS, with policies playing a decisive role in the development of UGS.
This study provides a new method for monitoring the evolution of UGS, which can contribute to the assessment and analysis of the potential factors in its conversion process in order to help the government and urban planners formulate urban development plans. This research on Taiyuan’s UGS will provide perspectives on the optimal development of UGS for resource-based cities in China and other developing countries around the world, which should focus on the ecological restoration of bare land, protection of large existing patches of UGS, promotion of interconnections between patches, control of urban boundary expansion, and optimization of the layout of built-up areas in future development plans.

Author Contributions

Conceptualization: Y.L., M.J.M.Y. and B.M.R.; formal analysis: J.A.K.; writing—original draft preparation: Y.L.; writing—review and editing: M.J.M.Y. and B.M.R. All authors have read and agreed to the published version of the manuscript.

Funding

This research received no external funding.

Data Availability Statement

The original contributions presented in the study are included in the article, further inquiries can be directed to the corresponding authors.

Acknowledgments

The data from USGS website, China Geospatial Data Cloud, and Taiyuan Municipal Government. The authors would like to thank the anonymous reviewers for their valuable comments and suggestions on this manuscript.

Conflicts of Interest

The authors declare no conflicts of interest.

References

  1. Xue, K.; Yu, K.; Zhang, H. Accessibility analysis and optimization strategy of urban green space in Qingdao City Center, China. Ecol. Indic. 2023, 156, 111087. [Google Scholar] [CrossRef]
  2. Chang, Q.; Liu, X.; Wu, J.; He, P. MSPA-Based Urban Green Infrastructure Planning and Management Approach for Urban Sustainability: Case Study of Longgang in China. J. Urban Plan. Dev. 2014, 141, A5014006. [Google Scholar] [CrossRef]
  3. Wang, J.; Wang, W.; Zhang, S.; Wang, Y.; Sun, Z.; Wu, B. Spatial and temporal changes and development predictions of urban green spaces in Jinan City, Shandong, China. Ecol. Indic. 2023, 152, 110373. [Google Scholar] [CrossRef]
  4. Le, T.; Kyle, G.; Tran, T. Using public participation gis to understand texas coastal communities’ perceptions and preferences for urban green space development in connection to their perceptions of flood risk. Urban For. Urban Green. 2024, 95, 128330. [Google Scholar] [CrossRef]
  5. Zepp, H.; Groß, L.; Inostroza, L. And the winner is? Comparing urban green space provision and accessibility in eight European metropolitan areas using a spatially explicit approach. Urban For. Urban Green. 2020, 49, 126603. [Google Scholar] [CrossRef]
  6. Wendel, H.E.W.; Zarger, R.Z.; Mihelcic, J.R. Accessibility and usability: Green space preferences, perceptions, and barriers in a rapidly urbanizing city in Latin America. Landsc. Urban Plan. 2012, 107, 272–282. [Google Scholar] [CrossRef]
  7. Davies, R.G.; Barbosa, O.; Fuller, R.A.; Tratalos, J.; Burke, N.; Lewis, D.; Warren, P.H.; Gaston, K.J. City-wide relationships between green spaces, urban land use and topography. Urban Ecosyst. 2008, 11, 269–287. [Google Scholar] [CrossRef]
  8. Xu, Y.; Peng, Z. Study on Spatial Evolution and Dynamic Mechanism of Shanghai Urban Ecospace in 1980–2010. Urban Stud. 2016, 23, 1–10. (In Chinese) [Google Scholar]
  9. Kajosaari, A.; Hasanzadeh, K.; Fagerholm, N.; Nummi, P.; Kuusisto-Hjort, P.; Kyttä, M. Predicting context-sensitive urban green space quality to support urban green infrastructure planning. Landsc. Urban Plan. 2024, 242, 104952. [Google Scholar] [CrossRef]
  10. Chen, J.; Kinoshita, T.; Li, H.; Luo, S.; Su, D. Which green is more equitable? A study of urban green space equity based on morphological spatial patterns. Urban For. Urban Green. 2024, 91, 128178. [Google Scholar] [CrossRef]
  11. Pauleit, S.; Duhme, F. Assessing the environmental performance of land cover types for urban planning. Landsc. Urban Plan. 2000, 52, 1–20. [Google Scholar] [CrossRef]
  12. Yeo, O.T.S.; Yusof, M.J.M.; Maruthaveeran, S.; Shafri, H.Z.M.; Saito, K.; Yeo, L.B. ABC of green infrastructure analysis and planning: The basic ideas and methodological guidance based on landscape ecological principle. Urban For. Urban Green. 2022, 73, 127600. [Google Scholar] [CrossRef]
  13. Lu, W.; Jiang, W.; Qiao, D.; Liu, Q.; Chen, G.; Huang, Q.; Xu, C. Embracing green spaces: Exploring spatiotemporal changes in urban green space accessibility and its equity in Guangzhou, China for sustainable urban greening. Environ. Sustain. Indic. 2023, 19, 100290. [Google Scholar] [CrossRef]
  14. Haaland, C.; van Den Bosch, C.K. Challenges and strategies for urban green-space planning in cities undergoing densification: A review. Urban For. Urban Green. 2015, 14, 760–771. [Google Scholar] [CrossRef]
  15. Mohajerani, A.; Bakaric, J.; Jeffrey-Bailey, T. The urban heat island effect, its causes, and mitigation, with reference to the thermal properties of asphalt concrete. J. Environ. Manag. 2017, 197, 522–538. [Google Scholar] [CrossRef]
  16. Bille, R.A.; Jensen, K.E.; Buitenwerf, R. Global patterns in urban green space are strongly linked to human development and population density. Urban For. Urban Green. 2023, 86, 127980. [Google Scholar] [CrossRef]
  17. Yao, L.; Chen, L.; Wei, W.; Sun, R. Potential reduction in urban runoff by green spaces in Beijing: A scenario analysis. Urban For. Urban Green. 2015, 14, 300–308. [Google Scholar] [CrossRef]
  18. Beninde, J.; Veith, M.; Hochkirch, A. Biodiversity in cities needs space: A meta-analysis of factors determining intra-urban biodiversity variation. Ecol. Lett. 2015, 15, 581–592. [Google Scholar] [CrossRef]
  19. Rehan, B.M.; Hall, J.W.; Penning-Rowsell, E.C.; Tan, V.Z.H. A comparison of property-level adaptation and community-scale flood defences in reducing flood risk. J. Flood Risk Manag. 2023, 17, e12956. [Google Scholar] [CrossRef]
  20. Byomkesh, T.; Nakagoshi, N.; Dewan, A.M. Urbanization and green space dynamics in Greater Dhaka, Bangladesh. Landsc. Ecol. Eng. 2012, 8, 45–58. [Google Scholar] [CrossRef]
  21. Sui, D.Z.; Zeng, H. Modeling the dynamics of landscape structure in Asia’s emerging desakota regions: A case study in Shenzhen. Landsc. Urban Plan. 2001, 53, 37–52. [Google Scholar] [CrossRef]
  22. Deng, J.S.; Wang, K.; Hong, Y.; Qi, J.G. Spatio-temporal dynamics and evolution of land use change and landscape pattern in response to rapid urbanization. Landsc. Urban Plan. 2009, 92, 187–198. [Google Scholar] [CrossRef]
  23. Wu, S.Z.; Wang, D.Y.; Yan, Z.R.; Wang, X.J.; Han, J.Q. Spatiotemporal dynamics of urban green space in Changchun: Changes, transformations, landscape patterns, and drivers. Ecol. Indic. 2023, 147, 109958. [Google Scholar] [CrossRef]
  24. Ezimand, K.; Aghighi, H.; Ashourloo, D.; Shakiba, A. The analysis of the spatio-temporal changes and prediction of built-up lands and urban heat islands using multi-temporal satellite imagery. Sustain. Cities Soc. 2024, 103, 105231. [Google Scholar] [CrossRef]
  25. Huang, B.Q.; Huang, J.L.; Pontius, R.G.; Tu, Z.S. Comparison of Intensity Analysis and the land use dynamic degrees to measure land changes outside versus inside the coastal zone of Longhai, China. Ecol. Indic. 2018, 89, 336–347. [Google Scholar] [CrossRef]
  26. Aldwaik, S.Z.; Pontius, R.G. Intensity analysis to unify measurements of size and stationarity of land changes by interval, category, and transition. Landsc. Urban Plan. 2012, 106, 103–114. [Google Scholar] [CrossRef]
  27. Pontius, R.G., Jr.; Gao, Y.; Giner, N.M.; Kohyama, T.; Osaki, M.; Hirose, K. Design and interpretation of intensity analysis illustrated by land change in central Kalimantan, Indonesia. Land 2013, 2, 351–369. [Google Scholar] [CrossRef]
  28. Chu, M.; Lu, J.; Sun, D. Influence of urban agglomeration expansion on fragmentation of green space: A case study of Beijing-Tianjin-Hebei urban agglomeration. Land 2022, 11, 275. [Google Scholar] [CrossRef]
  29. Antrop, M.; Van Eetvelde, V. Holistic aspects of suburban landscapes: Visual image interpretation and landscape metrics. Landsc. Urban Plan. 2000, 50, 43–58. [Google Scholar] [CrossRef]
  30. Tang, D.; Wang, C.; Nie, J.; Chen, R.; Niu, Q.; Kan, H.; Chen, B.; Perera, F. Health benefits of improving air quality in Taiyuan, China. Environ. Int. 2014, 73, 235–242. [Google Scholar] [CrossRef]
  31. Ma, X.; Su, Y.; Lin, F.; Dai, C. Land use/cover change and its driving factors in Taiyuan city. Ecol. Sci. 2021, 40, 201–210. (In Chinese) [Google Scholar]
  32. Zhao, H. Analysis of the Spatiotemporal Evolution Characteristics of the Built Up Area of Taiyuan City in the past 50 Years Based on Landsat Image. Master’s Thesis, Taiyuan University of Technology, Taiyuan, China, 2021. (In Chinese). [Google Scholar]
  33. Gaubatz, P.; Hanink, D. Learning from Taiyuan: Chinese cities as urban sustainability laboratories. Geogr. Sustain. 2020, 1, 118–126. [Google Scholar] [CrossRef]
  34. Wu, Z.; Chen, R.; Meadows, M.E.; Sengupta, D.; Xu, D. Changing urban green spaces in Shanghai: Trends, drivers and policy implications. Land Use Policy 2019, 87, 104080. [Google Scholar] [CrossRef]
  35. Han, S.S.; Kwan, M.; Miao, C.H.; Sun, B.D. Exploring the effects of urban spatial structure on green space in Chinese cities proper. Urban For. Urban Green. 2023, 87, 128059. [Google Scholar] [CrossRef]
  36. Zhang, J.M.; Zang, C.F. Spatial and temporal variability characteristics and driving mechanisms of land use in the Southeastern River Basin from 1990 to 2015. Acta Ecol. Sin. 2019, 39, 9339–9350. (In Chinese) [Google Scholar]
  37. Estoque, R.C.; Murayama, Y. Intensity and spatial pattern of urban land changes in the megacities of Southeast Asia. Land Use Policy 2015, 48, 213–222. [Google Scholar] [CrossRef]
  38. Taiyuan Municipal Government (TMG). Implementation Opinions of Taiyuan Municipal People’s Government on Creating a National Ecological Garden City. 2016. Available online: https://www.taiyuan.gov.cn/fgfxwj/20160803/1056257.html (accessed on 5 October 2023).
  39. Taiyuan Ecological Environment Bureau. Taiyuan Ranks Fourth in the Number of Major Parks in Chinese Cities, with 439 Theme Parks. 2022. Available online: https://www.taiyuan.gov.cn/zwyw/20240729/30147972.html (accessed on 5 October 2023).
  40. Taiyuan Municipal Government (TMG). Notice on the Approval Procedure for Land Development and Consolidation Projects in Taiyuan City to Supplement Farmland for “Occupation and Compensation Balance”. 2009. Available online: https://www.taiyuan.gov.cn/fgfxwj/20090928/1054988.html (accessed on 5 October 2023).
  41. Taiyuan Municipal Government (TMG). Opinions of the Government of Taiyuan City on Strengthening the Balance of Farmland Occupation and Compensation. 2010. Available online: https://www.taiyuan.gov.cn/gfxwj/20101122/1057350.html (accessed on 5 October 2023).
  42. Chen, S.H.; Liu, Y.X.; Peng, L.H. Dynamics of urban ecological space evolution and policy responses: A case study of Nanjing City. Acta Ecol. Sin. 2008, 28, 2270–2278. (In Chinese) [Google Scholar]
  43. Taiyuan Municipal Government (TMG). Notice of Taiyuan Municipal Government on Strengthening and Improving the Balance of Farmland Occupation and Compensation. 2017. Available online: https://www.taiyuan.gov.cn/gfxwj/20171128/1057783.html (accessed on 5 October 2023).
  44. Luo, F.; Feng, L.; Ren, P.C.; Yang, X.Y.; Wu, X.G. Study on dynamic changes of urban green space landscape pattern in Taiyuan, China. J. Shanxi Agric. Sci. 2017, 45, 805–808. [Google Scholar]
  45. Hou, W.; Zhou, W.; Li, J.; Li, C. Simulation of the potential impact of urban expansion on regional ecological corridors: A case study of Taiyuan, China. Sustain. Cities Soc. 2022, 83, 103933. [Google Scholar] [CrossRef]
  46. Ying, Q.; Hansen, M.C.; Potapov, P.V.; Tyukavina, A.; Wang, L.; Stehman, S.V.; Moore, R.; Hancher, M. Global bare ground gain from 2000 to 2012 using Landsat imagery. Remote Sens. Environ. 2017, 194, 161–176. [Google Scholar] [CrossRef]
  47. Hansen, M.C.; Egorov, A.; Potapov, P.V.; Stehman, S.V.; Tyukavina, A.; Turubanova, S.A.; Roy, D.P.; Goetz, S.J.; Loveland, T.R.; Ju, J.; et al. Monitoring conterminous United States (CONUS) land cover change with Web-Enabled Landsat Data (WELD). Remote Sens. Environ. 2014, 140, 466–484. [Google Scholar] [CrossRef]
  48. Xu, H.; Song, Y.; Tian, Y. Simulation of land-use pattern evolution in hilly mountainous areas of North China: A case study in Jincheng. Land Use Policy 2022, 112, 105826. [Google Scholar] [CrossRef]
  49. Garai, D.; Narayana, A.C. Land use/land cover changes in the mining area of Godavari coal fields of southern India. Egypt. J. Remote Sens. Space Sci. 2018, 21, 375–381. [Google Scholar] [CrossRef]
  50. Liu, Y.; Huang, X.; Yang, H.; Zhong, T. Environmental effects of land-use/cover change caused by urbanization and policies in Southwest China Karst area—A case study of Guiyang. Habitat Int. 2014, 44, 339–348. [Google Scholar] [CrossRef]
  51. Taiyuan Municipal Government (TMG). Ecological Restoration of Westen Mountain Interprets Beautiful Evolution in Taiyuan, Shanxi Province. 2023. Available online: https://hbj.taiyuan.gov.cn/tyhb/20230619/30049258.html (accessed on 5 October 2023).
  52. Zhang, X.; Song, W.; Lang, Y.; Feng, X.; Yuan, Q.; Wang, J. Land use changes in the coastal zone of China’s Hebei Province and the corresponding impacts on habitat quality. Land Use Policy 2020, 99, 104957. [Google Scholar] [CrossRef]
  53. Wang, S.; Su, H.; Chen, C.; Tao, W.; Streets, D.G.; Lu, Z.; Zheng, B.; Carmichael, G.R.; Lelieveld, J.; Pöschl, U.; et al. Natural gas shortages during the “coal-to-gas” transition in China have caused a large redistribution of air pollution in winter 2017. Proc. Natl. Acad. Sci. USA 2020, 117, 31018–31025. [Google Scholar] [CrossRef]
  54. Taiyuan Municipal Government (TMG). Report on the Work of the Government in 2000. 2000. Available online: https://www.taiyuan.gov.cn/zfgzbg/20000324/1058042.html (accessed on 5 October 2023).
  55. Taiyuan Municipal Government (TMG). Report on the Comprehensive Improvement of Ecological Construction Projects in the Xi Mountain Region Launched in 2008. 2008. Available online: https://www.taiyuan.gov.cn/fgfxwj/20081209/1054517.html (accessed on 5 October 2023).
  56. Taiyuan Municipal Government (TMG). Report on the Work of the Government in 2022. 2022. Available online: https://www.taiyuan.gov.cn/p1/zfgzbg/20220223/1192317.html (accessed on 5 October 2023).
  57. Cao, X.; Lei, M.; Hou, Z.; Zhao, Z.; Su, T. Study on the urban expansion characteristics and driving factors in Tai Yuan City based on RS and GIS. J. Northwest Univ. 2018, 48, 7. (In Chinese) [Google Scholar] [CrossRef]
Figure 1. Location of the study area.
Sustainability 16 08363 g001
Figure 2. Land use/cover changes in the study area in 2000, 2011, and 2022.
Sustainability 16 08363 g002
Figure 3. Time intensity analysis of UGS for two time intervals: 2000–2011 and 2011–2022. The bars on the left indicate the area of UGS that changed as a percentage of the study area at each time interval. The bars on the right indicate the annual change intensity, G C I T i , of UGS in each time interval. The vertical dashed line on the right indicates the uniform temporal intensity (UI).
Sustainability 16 08363 g003
Figure 4. Metric intensity analysis of UGS for two time intervals: 2000–2011 and 2011–2022. Each time interval has a pair of bars, where the purple bars indicate losses and the yellow bars show the gains. The bars on the left represent the area of annual gains and losses of UGS during each time interval, and the bars on the right represent the annual gain intensity, G T i , and annual loss intensity, L T i , during each time interval.
Sustainability 16 08363 g004
Figure 5. (a). Analysis of the intensity of transitions to UGS for two time intervals: 2000–2011 and 2011–2022. The bars on the left indicate the annual size of areas that transitioned to each non-UGS category to UGS in each time interval, while the bars on the right indicate the intensity of the transition of each non-UGS category to UGS in each time interval, R T i N . Each dashed line is the annual uniform intensity of the transition, W T i , from all non-UGS categories to UGS during each time interval. (b). Analysis of the transition from UGS for two time intervals: 2000–2011 and 2011–2022. The bars on the left indicate the size of the annual transition from UGS to non-UGS categories at each time interval, and the bars on the right indicate the intensity of the transfer from UGS to non-UGS categories at each time interval, Q T i N . Each dashed line represents the annual uniform intensity of the transition, V T i , from UGS to all non-UGS categories during each time interval.
Sustainability 16 08363 g005
Figure 6. Spatial evolution of land use/cover change from 2000 to 2011.
Sustainability 16 08363 g006
Figure 7. Spatial evolution of land use/cover changes from 2011 to 2022.
Sustainability 16 08363 g007
Table 1. Data sources and description of remote sensing data.
PathRowCloud Cover (%)Spatial Resolution (m)Date AcquiredSatelliteSensor Identifier
1250340301 July 2000Landsat 7ETM
1250340309 August 2011Landsat 5TM
12503413010 October 2022Landsat 8OLI
Table 2. Land use conversion matrix from 2000 to 2011 (in hectares).
2011
Final Year of Time Interval
Initial TotalGross Loss
Built-UpUGSWaterBare Land
2000
Initial year of time interval
Built-up21,239235613096224,6873448
UGS10,06591,4345596093108,15116,717
Water18113564635997351
Bare land14234330250164176446003
Final total 32,90898,25515858731141,47926,519
Gross gain 11,6696821939709026,519
Table 3. Land use conversion matrix from 2011 to 2022 (in hectares).
2022
Final Year of Time Interval
Initial TotalGross Loss
Built-UpUGSWaterBare Land
2011
Initial year of time interval
Built-up27,68748989223132,9085221
UGS10,65386,27339693398,25511,982
Water356125110041585485
Bare land4376381210743687318295
Final total 43,07295,10816951604141,47925,983
Gross gain 15,3858835595116825,983
Table 4. Landscape pattern indices selected in this study.
TypesIndicesAbbreviationDescriptionUnit
SizePercentage of landscapePLANDThe proportion of UGS area to the study’s total areaPercent
ProportionLargest patch indexLPIThe proportion of the largest patch of UGS in the entire landscapePercent
Mean patch sizeMPSThe ratio of the area of UGS patches to the number of patches hectare
NumberNumber of patchesNPThe total number of UGS patches in the landscapeNone
Patch densityPDThe ratio of the number of UGS patches to the total areaNumber per 100 ha
ShapeLandscape shape indexLSIThe ratio of the total length of edges of UGS patches to the possible minimum total length of edgesNone
Edge densityEDThe sum of the lengths of all edge segments of UGS patches divided by the UGS area and multiplied by 1000Meter per hectare
Spatial combinationAggregation indexAIMeasure of the connectivity of UGS patches representing the degree of aggregation among certain patchesPercent
Splitting indexSPLITThe sum of the square of the UGS area divided by the square of the patch area indicates the degree of clustering of the landscapeNone
Table 5. Land use changes from 2000 to 2022.
Land Use/Cover Types2000 2011 2022
Area (ha)Percent (%)Area (ha)Percent (%)Area (ha)Percent (%)
Built-up24,68717.4532,90823.2643,07230.44
UGS108,15176.4498,25569.4595,10867.22
Water9970.7015851.1216951.20
Bare land76445.4087316.1716041.13
Table 6. Measuring UGS changes in different zones.
PeriodsIndexesZones
JCPJYWBLXDXHLYZ
2000–2011Area (ha)−1614−1348468−4949−1537−912
Rate (%)−7.14−5.922.24−21.35−13.90−12.70
2011–2022Area (ha)2315612−4492135275
Rate (%)0.011.472.86−24.651.424.13
2000–2022Area (ha)−1612−10321080−9441−1401−637
Rate (%)−7.13−4.545.16−40.74−12.68−8.44
JCP: Jiancaoping; JY: Jinyuan; WBL: Wanbailin; XD: Xiaodian; XHL: Xinghualing; YZ: Yingze.
Table 7. Analysis of the landscape indices of UGS from 2000 to 2022.
YearPLAND NPPD LPIMPSLSIEDAISPILT
200076.4411330.8074.1395.4631.4829.2897.221.82
201169.4510540.7466.8493.2330.9527.4297.132.24
202267.2219571.3846.5148.6040.3635.2096.174.28
Disclaimer/Publisher’s Note: The statements, opinions and data contained in all publications are solely those of the individual author(s) and contributor(s) and not of MDPI and/or the editor(s). MDPI and/or the editor(s) disclaim responsibility for any injury to people or property resulting from any ideas, methods, instructions or products referred to in the content.

