Article

Relationships between Tree Species Diversity and Aboveground Biomass Are Mediated by Site-Dependent Factors in Northeastern China Natural Reserves on a Small Spatial Scale

1
CAS Key Laboratory of Forest Ecology and Management, Institute of Applied Ecology, Chinese Academy of Sciences, Shenyang 110016, China
2
University of Chinese Academy of Sciences, Beijing 100049, China
3
School of Life Sciences, Qufu Normal University, Jining 273100, China
4
College of Forestry, Beihua University, Jilin 132013, China
*
Authors to whom correspondence should be addressed.
Sustainability 2024, 16(19), 8378; https://doi.org/10.3390/su16198378
Submission received: 16 July 2024 / Revised: 29 August 2024 / Accepted: 10 September 2024 / Published: 26 September 2024

Abstract

:
Biodiversity loss has accelerated over decades and probably exerted adverse impacts on ecosystems. As a key forest ecosystem function, tree productivity and its relationship with the change in species diversity are a hotspot in ecology research. However, the changing patterns of the relationships between these two variables across ecosystems with different environmental conditions and the underlying mechanisms are not well understood but key to make environmental context-specific strategies for forest ecosystem conservation and management. Here, we examined changes in relationship (RDI-AGB) between the tree species diversity index (DI) and aboveground biomass (AGB) across temperate forest ecosystems with different environmental contexts on a small spatial (plot) scale as well as clarified the driving mechanisms using ground-based data from 3 natural reserves in northeastern China, surveying 22,139 trees across 77 species and 185 plots. We found substantial changes in RDI-AGB across natural reserves with different environmental conditions on a small spatial scale. These changes were probably modulated by site-specific factors. A positive RDI-AGB was attributed to positive impacts of local climate conditions (i.e., mean annual temperature and potential evapotranspiration) and stand age on both DI and AGB, which was observed in the Changbai Mountains Natural Reserve. In contrast, a negative RDI-AGB was likely due to opposite directions in the effects of the site-dependent factors (elevation, mean annual precipitation, vapor pressure deficit, and seasonality of temperature) on DI and AGB, appearing in the Honghuaerji Natural Reserve. In addition, complex impacts of site factors on DI and AGB leading to no obvious RDI-AGB was observed in the Shengshan Natural Reserve. Our results highlight the importance of site-dependent factors in modulating species diversity–productivity relationships and the need to use site-specific strategies in management and conservation for forest-dominated natural reserves and other forest ecosystems with heterogeneous environmental conditions.

1. Introduction

Widespread tree mortality and forest degradation in conjunction with other factors (i.e., deforestation and land use change) have threatened about half of the tree species worldwide under the influence of both climate change and human activities [1,2]. Biodiversity loss can exert adverse impacts on ecosystem service functions and other ecological benefits [1,3,4]. For instance, several recent studies have reported that decreases of tree species due to tree mortality induced by climate drying in water-deficit areas have severely reduced the capacity of forest carbon sequestration and challenged sustainable forest management [5,6,7]. Therefore, it is necessary to assess the influences of changes in biodiversity on ecosystem service functions, since it is very important for accurately assessing the valuation of biodiversity protection and predicting future dynamics of ecological service functions [8,9]. However, many aspects of ecosystem service functions, i.e., climate regulation, water conservation, and soil protection, are not easily quantified [10], hampering the capacity to establish quantitative relationships between biodiversity and ecosystem service functions. As an important aspect of ecosystem functions, vegetation productivity can be accurately measured through several approaches such as periodical surveys of aboveground living wood, remote sensing, and tree-ring analysis [1,11,12,13,14]. Therefore, exploring the biodiversity–productivity relationship (BPR) provides an effective approach to quantitatively link biodiversity with ecosystem service functions and to predict the future trend of ecosystem productivity and carbon sink, given changes in biodiversity.
BPR is important in revealing characteristics of associations between species diversity and vegetation productivity and their variations across ecosystems. A large number of studies involving BPR have been conducted in grassland ecosystems, which typically reported positive BPRs and revealed the positive impacts of biodiversity on productivity in such ecosystems [15,16,17,18,19]. Compared with herbaceous communities, investigating BPR of forest ecosystems is comparatively rare, although this type of ecosystem accounts for a large part of global terrestrial ecosystems [1,20,21,22]. Previous studies on various regional scales have reported diverse results in characterizing BPRs of forest ecosystems and indicated an uncertainty in the interplay between species number and forest productivity [12,23]. While some studies have found linear positive BPRs, others have reported different types, including hump-shaped and linear negative BPRs [21,23,24]. The different results regarding BPRs among studies may be due to differences in ecological conditions, forest successional stages, or spatial scales [11,23]. A recent global-scale investigation, involving 777,126 permanent forest plots from 44 countries, revealed a consistent positive concave-down effect of biodiversity on forest productivity worldwide [1]. However, most forest plots in this study were located in North America, western Europe, Japan, and eastern Australia, and rather few appeared in other areas (including China), indicating that the BPRs of a considerable portion of forest ecosystems in the globe still need to be examined. In addition, although numerous studies have reported characteristics of BPRs of forest ecosystems on relatively large regional to global scales [1,12,21], less is known about BPRs on small spatial scales, which may show different patterns since BPR has been suggested to be scale-dependent [11].
Several mechanisms have been suggested to explain the observed BPRs across different ecosystems [25]. Two main hypotheses, namely the niche complementarity effect and the selection probability effect, have been used to elucidate the formation of positive BPRs [26]. The hypothesis of the niche complementarity effect suggests that increases in species number, with different species using different resources, can lead to complementarity in resource use, improve the utilization efficiency of resources in a given area, and thus help to promote the total productivity of the tree species within the region [11,26]. The selection probability effect hypothesis claims that increases in tree species can elevate the probability of possessing highly productive species, which will help boost vegetation productivity [11]. In addition to the two mechanisms for explaining positive BPRs, many other abiotic and biotic factors can also play important roles in driving various BPRs across different biomes [1,27,28]. For example, several studies have found that multiple environmental factors, involving the aspects of climate, soil fertility, and geographical location, can modulate the BPRs of forest ecosystems by affecting species number and forest productivity [1,29,30]. Moreover, by further exploring the relative importance of multiple factors, some recent studies have concluded that climate is a dominant factor in driving the BPR on large spatial scales [12,31]. On the other hand, a few investigations focusing on relatively small spatial scales have indicated that forest species composition, stand age, and other factors related to biological aspects were important determinants of BPRs [32,33].
In addition, different factors modulating BPRs have also been observed on the same spatial scale under different environmental conditions [11,23,25], which provides support for the Stress-Gradient Hypothesis (SGH) [34]. This hypothesis claims that shifts in stress (limiting factors) across different environmental contexts can affect the frequency of facilitative and competitive interactions among species and hence probably alter BPRs. Specifically, under high-stress conditions, facilitative interactions among species are expected to enhance productivity, whereas under low-stress conditions, competitive interactions are more likely to dominate. The SGH has been applied in various ecosystems to explain how environmental stressors, such as drought, temperature extremes, and nutrient deficiency, influence species interactions and hence affect productivity and ecosystem functions [34,35]. For instance, in arid and semi-arid regions, it has been shown that plant–plant facilitation increases under elevated drought stress, leading to higher overall productivity [36,37], indicating that the impacts of ecosystem engineers increase under stress conditions. Similarly, in alpine ecosystems, facilitation by nurse plants helps mitigate temperature stress for neighboring species, enhancing their growth and survival [34]. Despite these findings, there is limited research on how the SGH operates on small spatial scales within forest ecosystems, particularly in temperate forests with varying environmental conditions. Variations in environmental factors, such as soil fertility, stand age, and species composition, create heterogeneous environmental conditions within natural reserves, leading to differences in resource availability and species interactions. However, most studies have focused on large-scale patterns, leaving a gap in understanding the fine-scale processes that modulate BPR through environmental stressors [32].
Forest-predominant natural reserves account for a considerable proportion of global reserves, which play key roles in protecting forest biodiversity and maintaining ecological function [38,39]. Clarifying the change patterns of BPRs for such reserves across different environmental conditions as well as the underlying causes can help improve our understandings on the driving mechanisms behind the observed diverse BPRs and provide important insights into natural reserve management and conservation. In a recent study, we reported that climate played an important role in a positive BPR of forest-dominated natural reserves on a large spatial scale [40]. In the current study, focusing on a much smaller spatial scale (the plot level), we further investigated how environmental stressors modulate the relationships between tree species diversity and aboveground biomass in three forest-dominated natural reserves in a temperate forest zone (located in east, north central, and west parts of northeastern China; Figure 1) and their driving mechanisms using ground-based data for 22,139 trees of 77 species from 185 plots. We hypothesized that environmental stressors, such as limitations in temperature, precipitation and other factors, play critical roles in forming species diversity–biomass relationships within these reserves, through mechanisms outlined by the Stress-Gradient Hypothesis. Specifically, we aimed to: (1) assess the variation in the relationships between tree species diversity and aboveground biomass across different natural reserves with contrasting environmental conditions, (2) identify the environmental stressors that significantly influence species diversity–biomass relationships on a small spatial scale, and (3) evaluate the relative importance of these stressors in modulating diversity–biomass relationships within the natural reserves. This study contributes to the development of the Stress-Gradient Hypothesis and promotes the understanding of BPR formation mechanisms in forest ecosystems.

2. Material and Methods

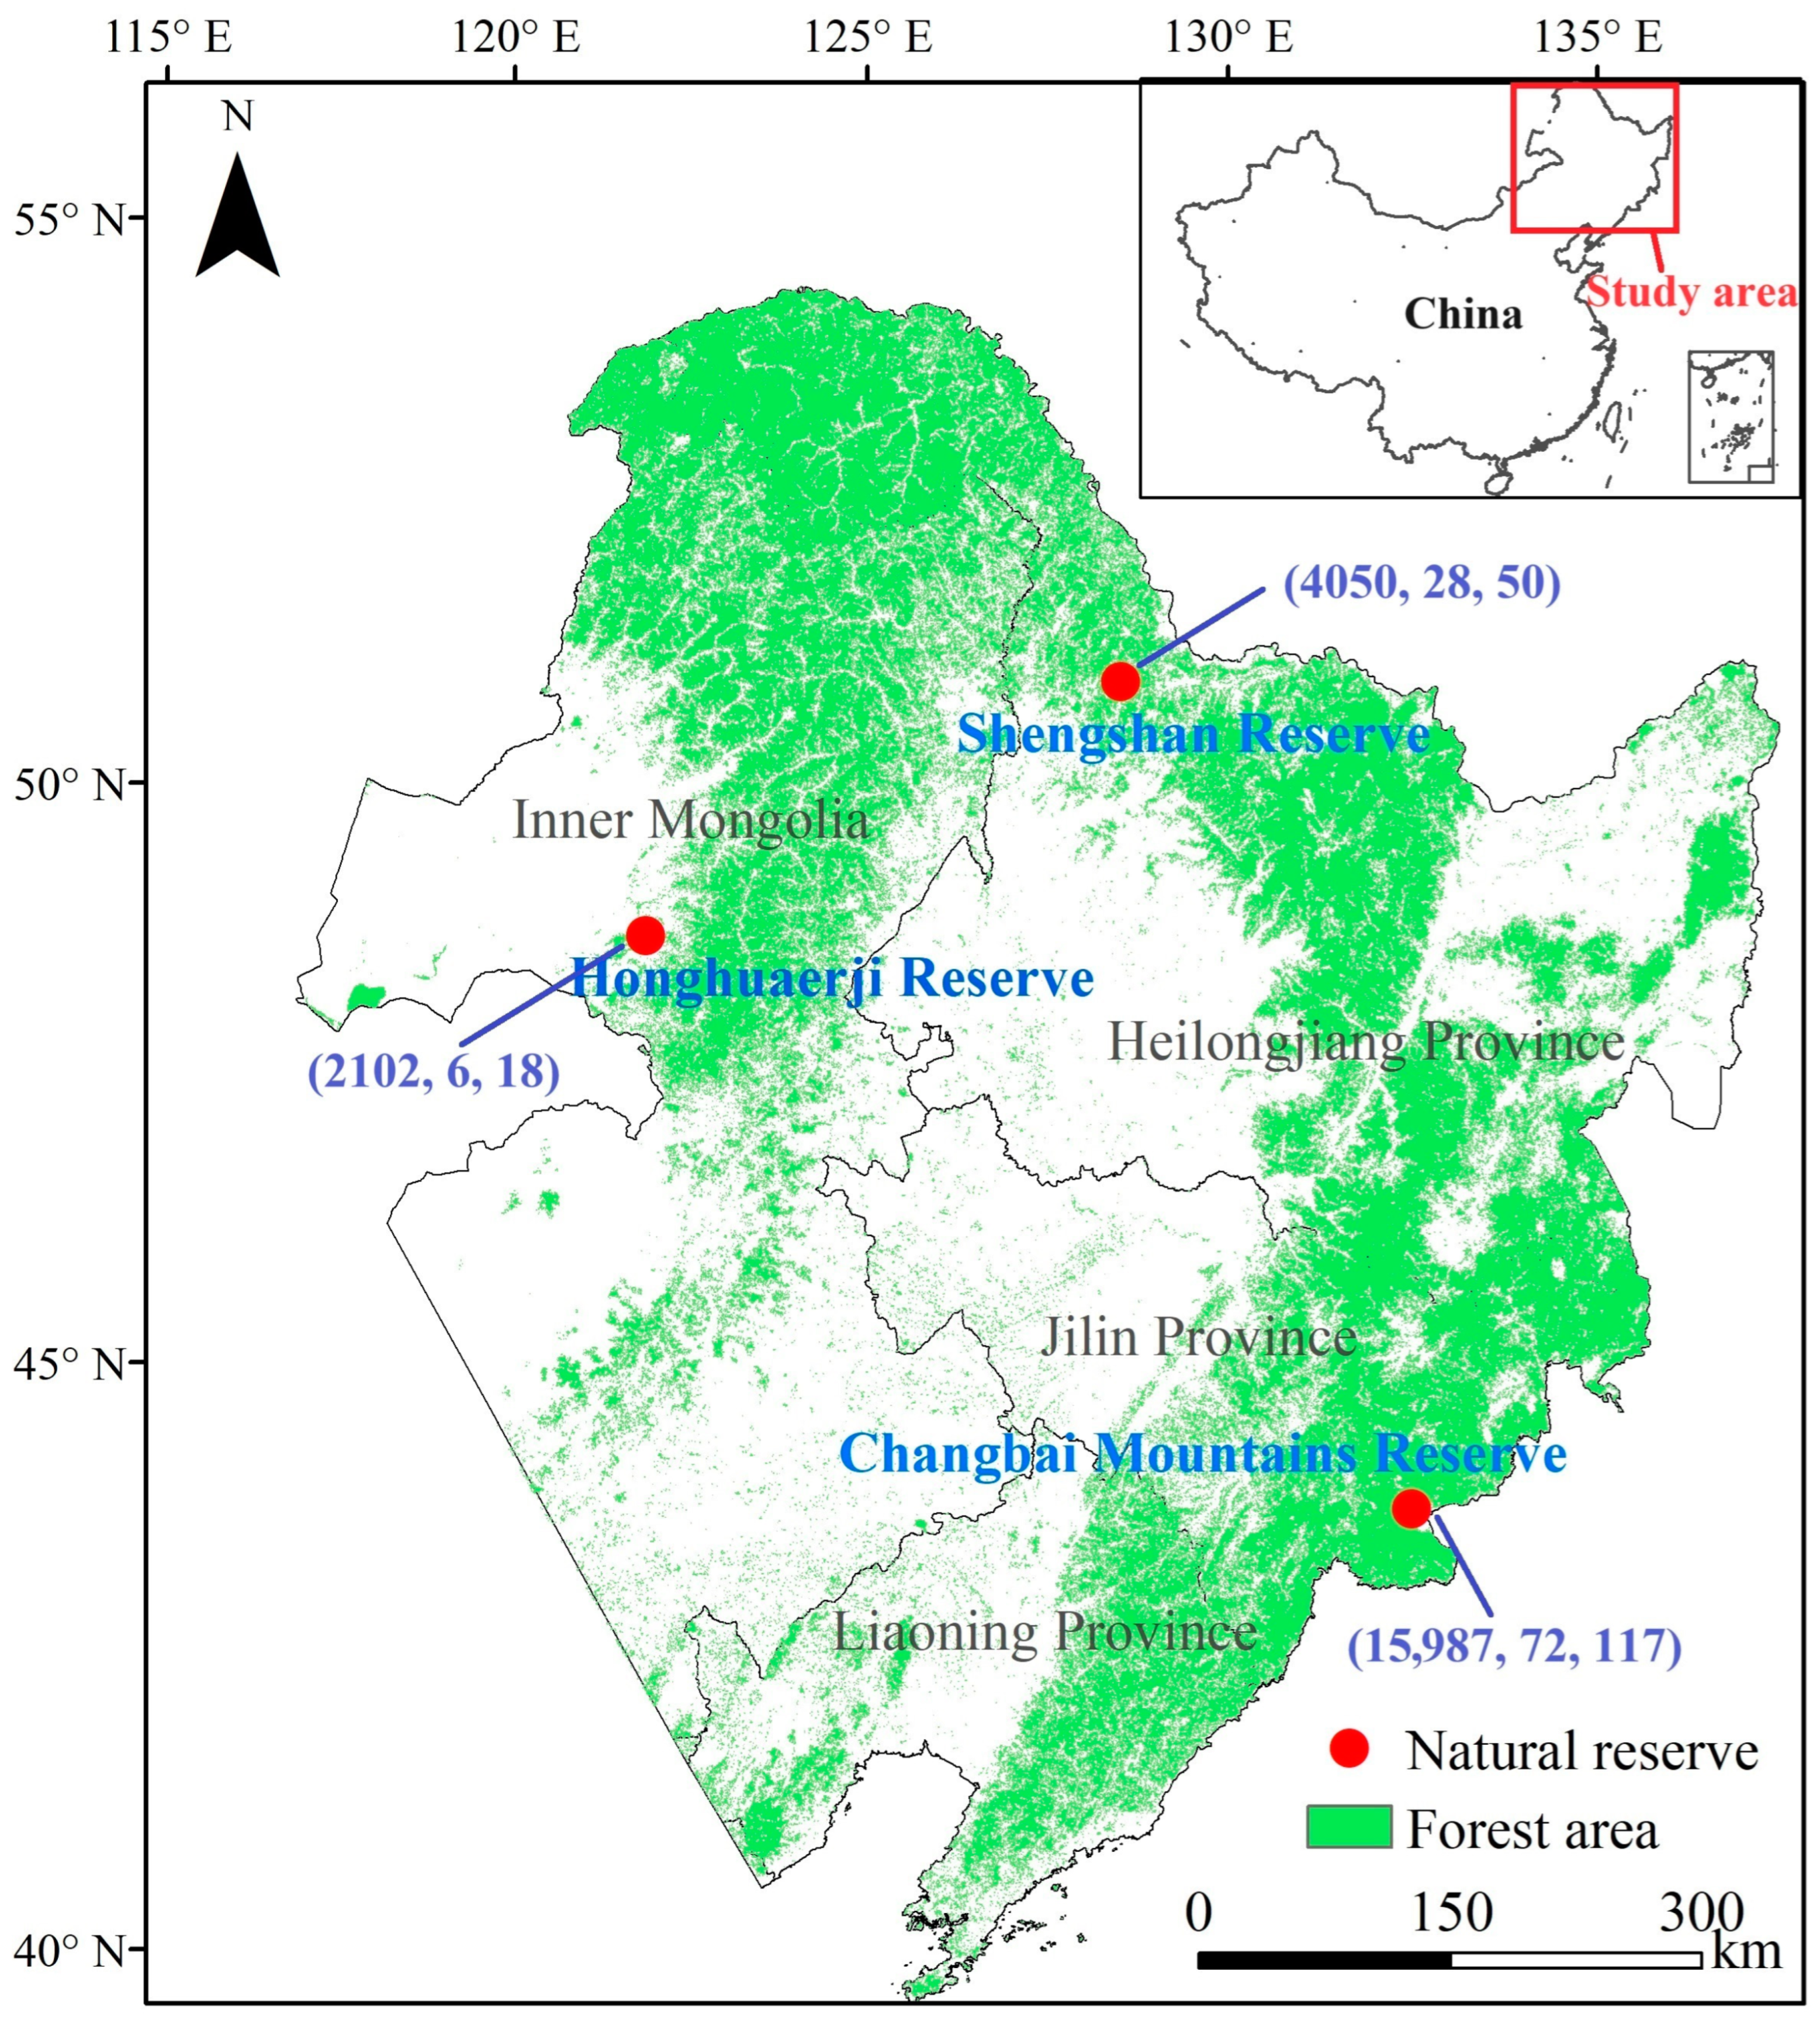
2.1. Description of the Study Area

The study area is located in northeastern China, where the eastern, northern, and western parts are surrounded by mountains (such as Changbai Mountains, Small Xing’an Mountains, and Great Xing’an Mountains), and the central and southern parts are plains (for instance, Songnen Plain and Liaohe Plain). The climate in this region is characterized by a temperate monsoon climate, with most of the precipitation in a year being received from April to October. The annual total precipitation across the region ranges from less than 300 mm to 1000 mm. The annual mean temperature is between −5 °C and 11 °C. The forest type in northeast China is dominated by typical temperate forests, including broadleaved deciduous forest, mixed coniferous and broadleaved forest, and coniferous forest. The soil types are mainly black soil, meadow soil, white soil, and marsh soil.
The investigated three forest-dominated natural reserves, Changbai Mountains Natural Reserve, Shengshan Natural Reserve, and Honghuaerji Natural Reserve are respectively located in the eastern, northern central, and western parts of Northeast China and show obvious differences in environmental conditions (Figure 1 and Figure S1). Overall, the environmental condition of the Changbai Mountains Natural Reserve is most suitable for the survival and growth of trees, with the temperature, precipitation, and water balance (difference between annual total precipitation and annual potential evapotranspiration) being the highest among the three reserves (Figure S1). On the contrary, the values of the three climate-related indicators of the Honghuaerji Natural Reserve are all the lowest. The environmental situation of the Shengshan Natural Reserve is moderate among the reserves analyzed. The vegetation types in the Changbai Mountains Natural Reserve are very abundant, with Korean pine broad-leaved forest, coniferous forest, birch forest, meadow, and alpine tundra sequentially occurring from the bottom to the top of the mountains where the dominant tree species are Pinus koraiensis Siebold & Zucc., Larix olgensis Henry, Tilia tuan Szyszyl., Betula platyphylla Sukaczev, and so on. In the Honghuaerji Natural Reserve, because of harsh environmental conditions, the number of tree species are very limited, mainly including Pinus sylvestris var. mongolica Litv., Salix arbutifolia Pall., and Empetrum nigrum L. var. japonicum K. Koch. The tree species in the Shengshan Natural Reserve include Picea asperata Mast., Abies fabri (Mast.) Craib, Betula platyphylla Sukaczev, Fraxinus mandshurica Rupr., Quercus mongolica Fisch. ex Ledeb., Eleutherococcus senticosus (Rupr. & Maxim.) Maxim., and so on.

2.2. Data Acquisition

2.2.1. Ground Survey Data

The ground survey data were acquired from two basic special surveys in northeastern China: the Special Survey of Northeast Forest Plant Germplasm Resources (2007FY110400) and the Survey of Plant Communities and Soil Biology in Northeast National Forest Reserve and Adjacent Areas (2014FY110600). The data were sampled from 2008 to 2017. To obtain the data, the following procedures were adopted: first, the geographical range of Northeast China was divided into a lot of grids with the aid of the vegetation distribution map of the region, which was performed in the software ArcGIS 9.2 before the survey; second, the locations of the grids above were found and determined using the instrument GPS eXplorist210 at the field investigation stage, and then the plots, each having a size of 30 m × 30 m, were established in each grid with the help of the forestry compass instrument DQL-2s; third, in each plot, the species name and the serial number for each tree were recorded, and then the tree height and diameter at breast height (DBH) were measured. Additionally, the number of trees of each tree species in each plot were counted. The methods of obtaining the data were the same across plots and reserves. In this study, the survey data for the Changbai Mountains Natural Reserve, Honghuaerji Natural Reserve, and Shengshan Natural Reserve were employed, including the geographic locations (longitude, latitude, and elevation) of the plots within the natural reserves, the tree species name, and the DBH of the trees. Altogether, the data for 185 plots involving 77 species and 22,139 trees for the three reserves were collected. The sampling information for each of the reserves is shown in Figure 1.

2.2.2. Environmental Factors Data

Referring to Liang et al. (2016) [1], the environmental factors from four aspects (geographical location, climate, soil, and forest stand age) were employed. Climate variables included annual average temperature (MAT), annual total precipitation (MAP), potential evapotranspiration (PET), saturated vapor pressure deficit (VPD), seasonality of temperature (ST)-differences in temperature across seasons, and seasonality of precipitation (SP)-difference in precipitation across seasons and precipitation in the driest season (DP). As for soil indicators, soil organic matter (SOM), soil total nitrogen content (TN), and soil total phosphorus content (TP) at a depth of 0–30 cm were considered. Forest stand age (AGE) was represented by the maximum tree age of each plot, which was determined by calculating the number of tree rings of the largest individual in each plot. The climate data were obtained from the worldclim v2 database [42], and the soil data from the Soilgrids 2.0 database [43]. In addition to obtaining the above factors for each plot, we also calculated MAP and MAT for each reserve by averaging the values of corresponding indicators for all plots within the reserve to compare the climate conditions among the three reserves.

2.3. Species Diversity and Forest Productivity

2.3.1. Tree Species Diversity

The Shannon index [44] is used for reflecting the species diversity index (DI). The number of trees included in each tree species in each plot was used to calculate the DI of the plot, which was fulfilled through the R package Vegan in R 3.5.2. The formula for obtaining the DI was as follows:
D I = i = 1 s P i l n ( P i )
where S is the number of trees for species i, and Pi is the relative abundance for species i.
The formula for calculating Pi was as follows:
P i = m i M × 100 %
where m i is the amount of tree individuals of species i in a plot; M is the total amount of tree individuals of all species in a plot.
The Richness, Gini index, and Pielou index, which can be used to reflect species diversity, were also calculated using the number of tree species and tree individuals for each species within each plot, according to a previous study [45].

2.3.2. Aboveground Biomass

Aboveground biomass (AGB) is typically used to represent forest productivity aboveground. The AGB for each tree (including leaf, stem, and branch) in each plot was obtained through the allometric growth equation, which was developed by Zhou et al. (2018) [46]. The parameters of the equation were determined according to the traits of the tree species in northeast China (main temperate tree species and mixed species were included). The AGB for each plot was obtained from the total values of the indicator for all the trees within the plot. The formula for calculating AGB was as follows:
A G B = a × D b
where D is diameter at breast height of the trees; a and b are the corresponding parameters for the formula.

2.4. Statistical Analysis

Pearson correlation analysis [47] in SPSS Statistics 17.0 was used to examine the relationship between DI and AGB. To test the robustness of the diversity–AGB relationship, the correlations of Richness, Gini index, and Pielou index with AGB were also calculated using the same method. In addition, Pearson correlation analysis in SPSS Statistics 17.0 was used to investigate the relationships between DI, AGB, and each of the environmental factors described in Section 2.2.2. Furthermore, a linear regression equation [48] was employed to further explore the relationships of DI and AGB with all factors considered to have potential important impacts on the two metrics, which were determined by a significant (p < 0.1) correlation from simple correlation analysis between these variables. To decrease the number of independent variables and the effects of the collinearity among the variables in linear regression analysis, the potentially important factors of the climate and soil aspects were combined using the principal component analysis method [49]. During the analysis, we only considered the first principal component (PC1), as the cumulative variances of PC1 for each aspect in all natural reserves were larger than 80% (Table S1). Therefore, the score of the first principal component was used to represent all potential important factors for each aspect in a reserve.

3. Results

Species diversity, aboveground biomass, and their relationships varied among the investigated natural reserves with different environmental conditions on a small spatial scale. These changes were related with differences in site-dependent factors.

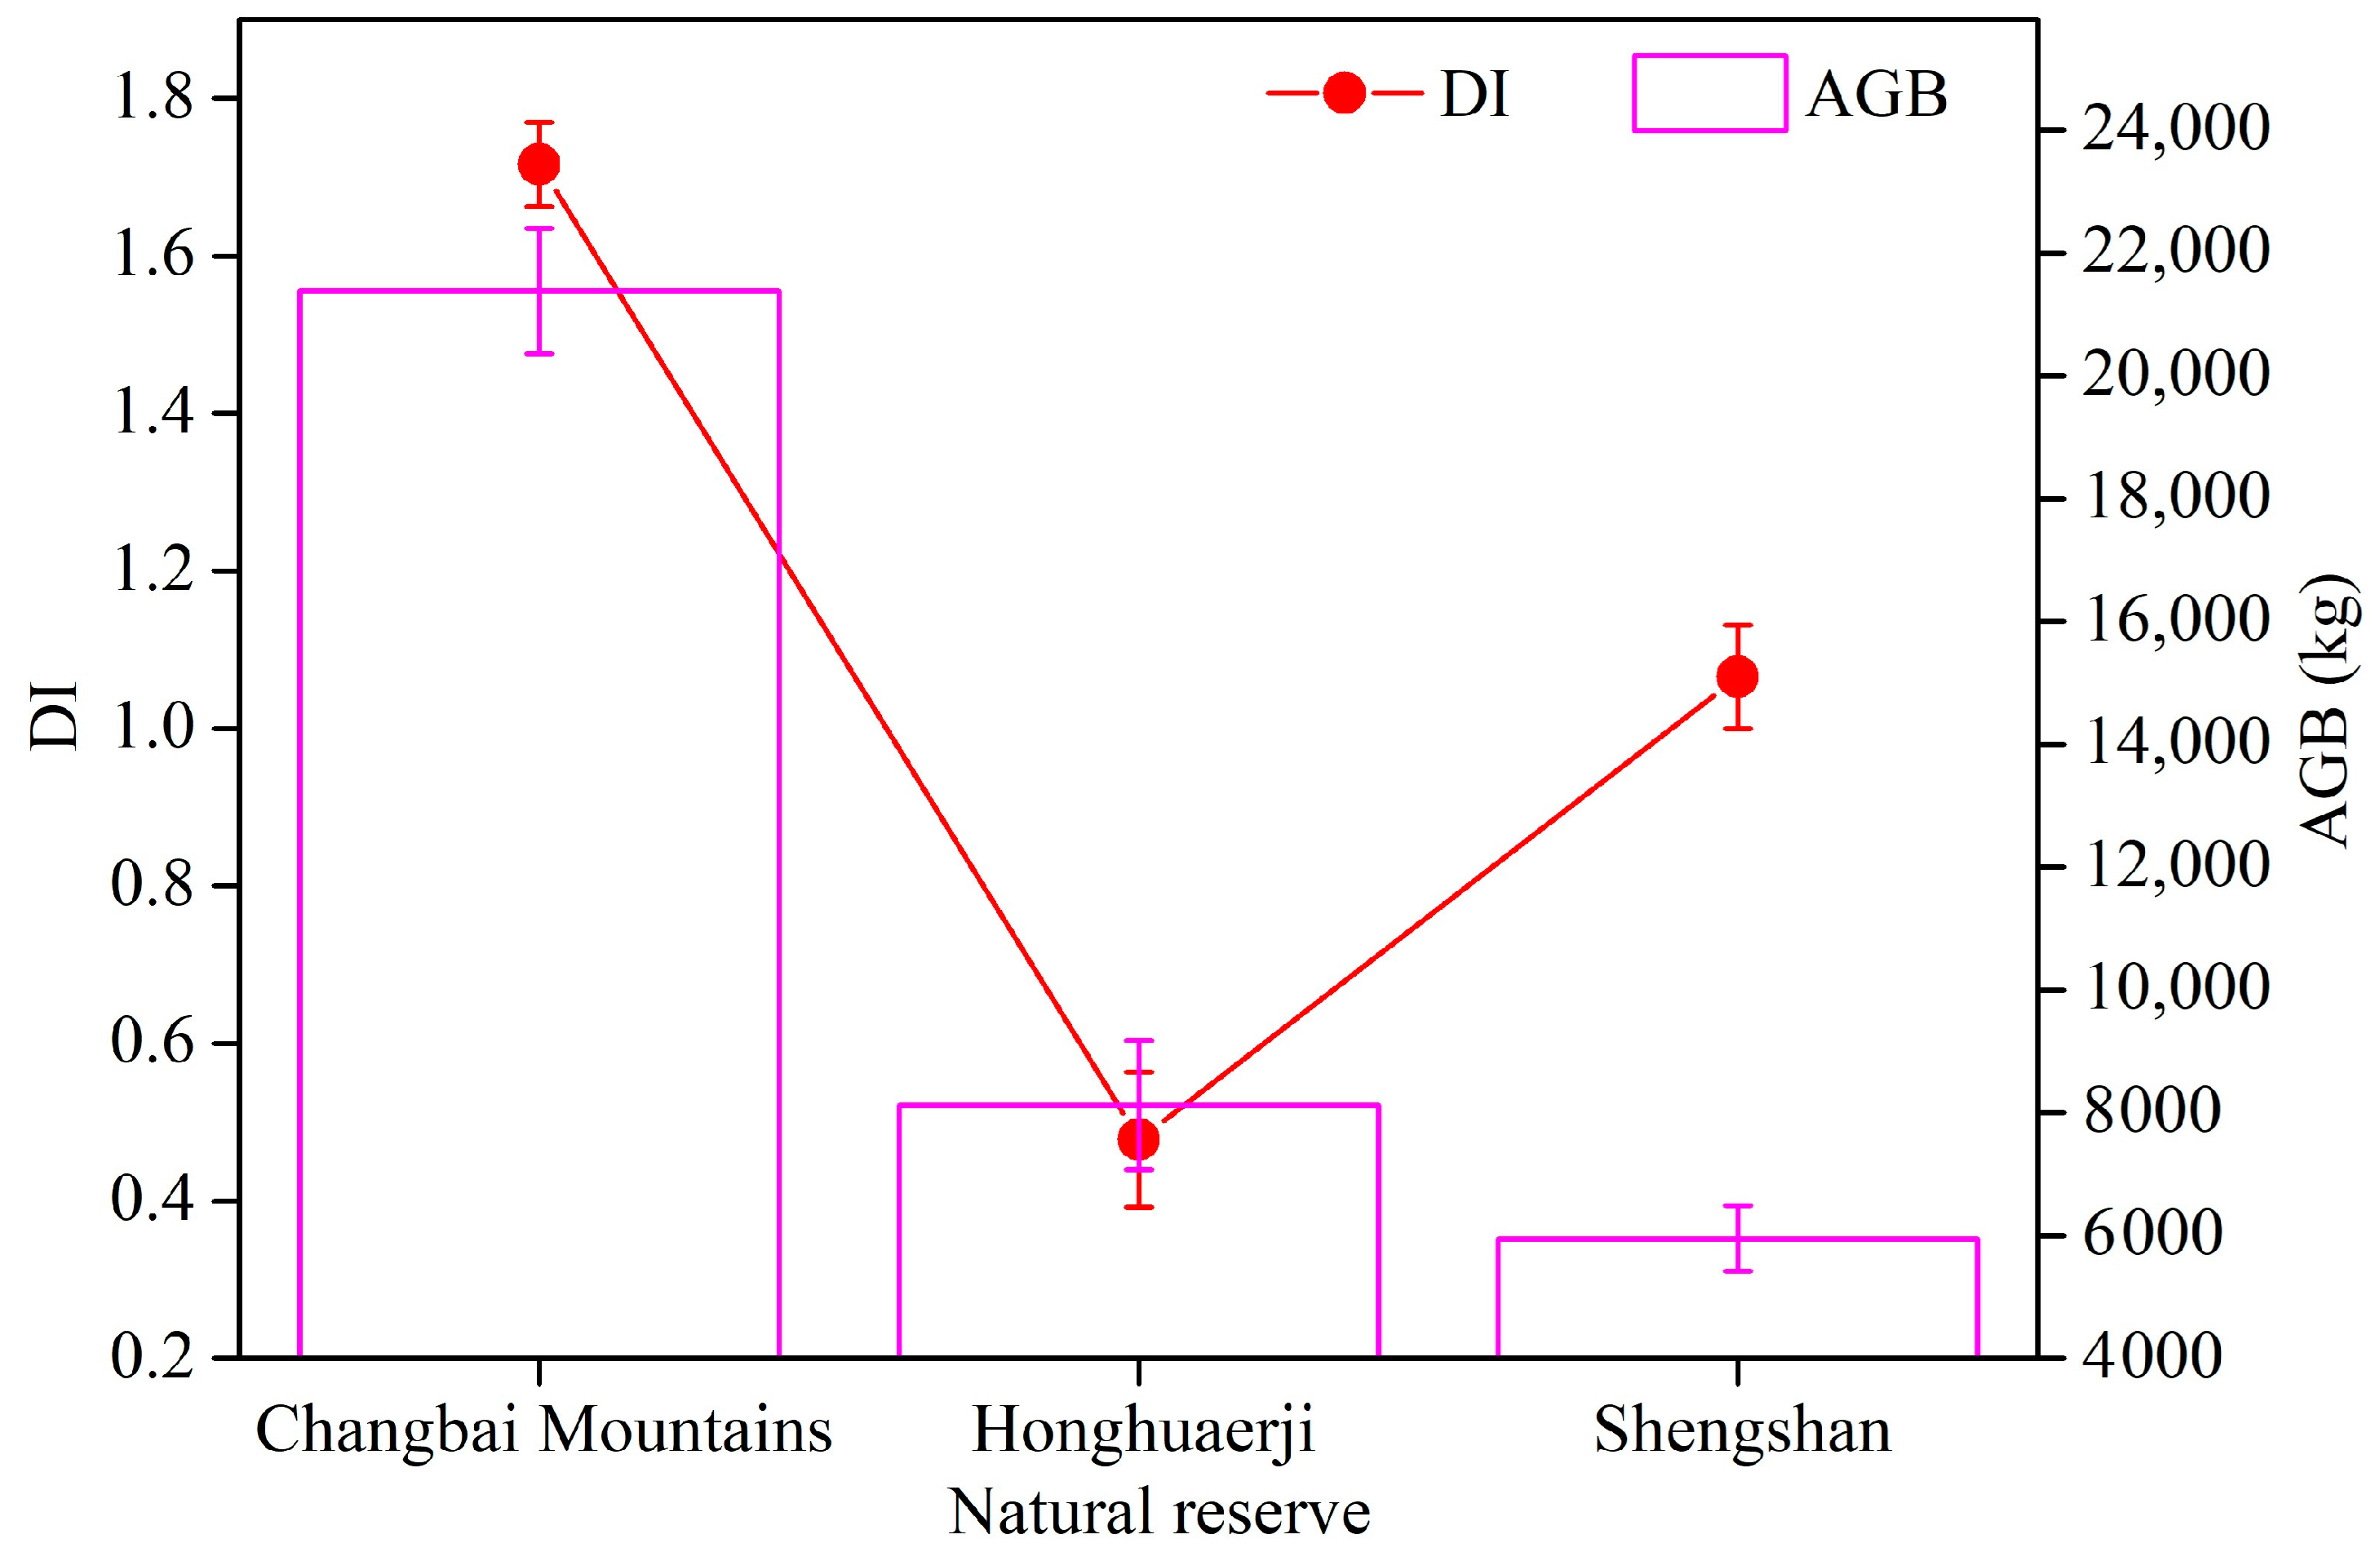
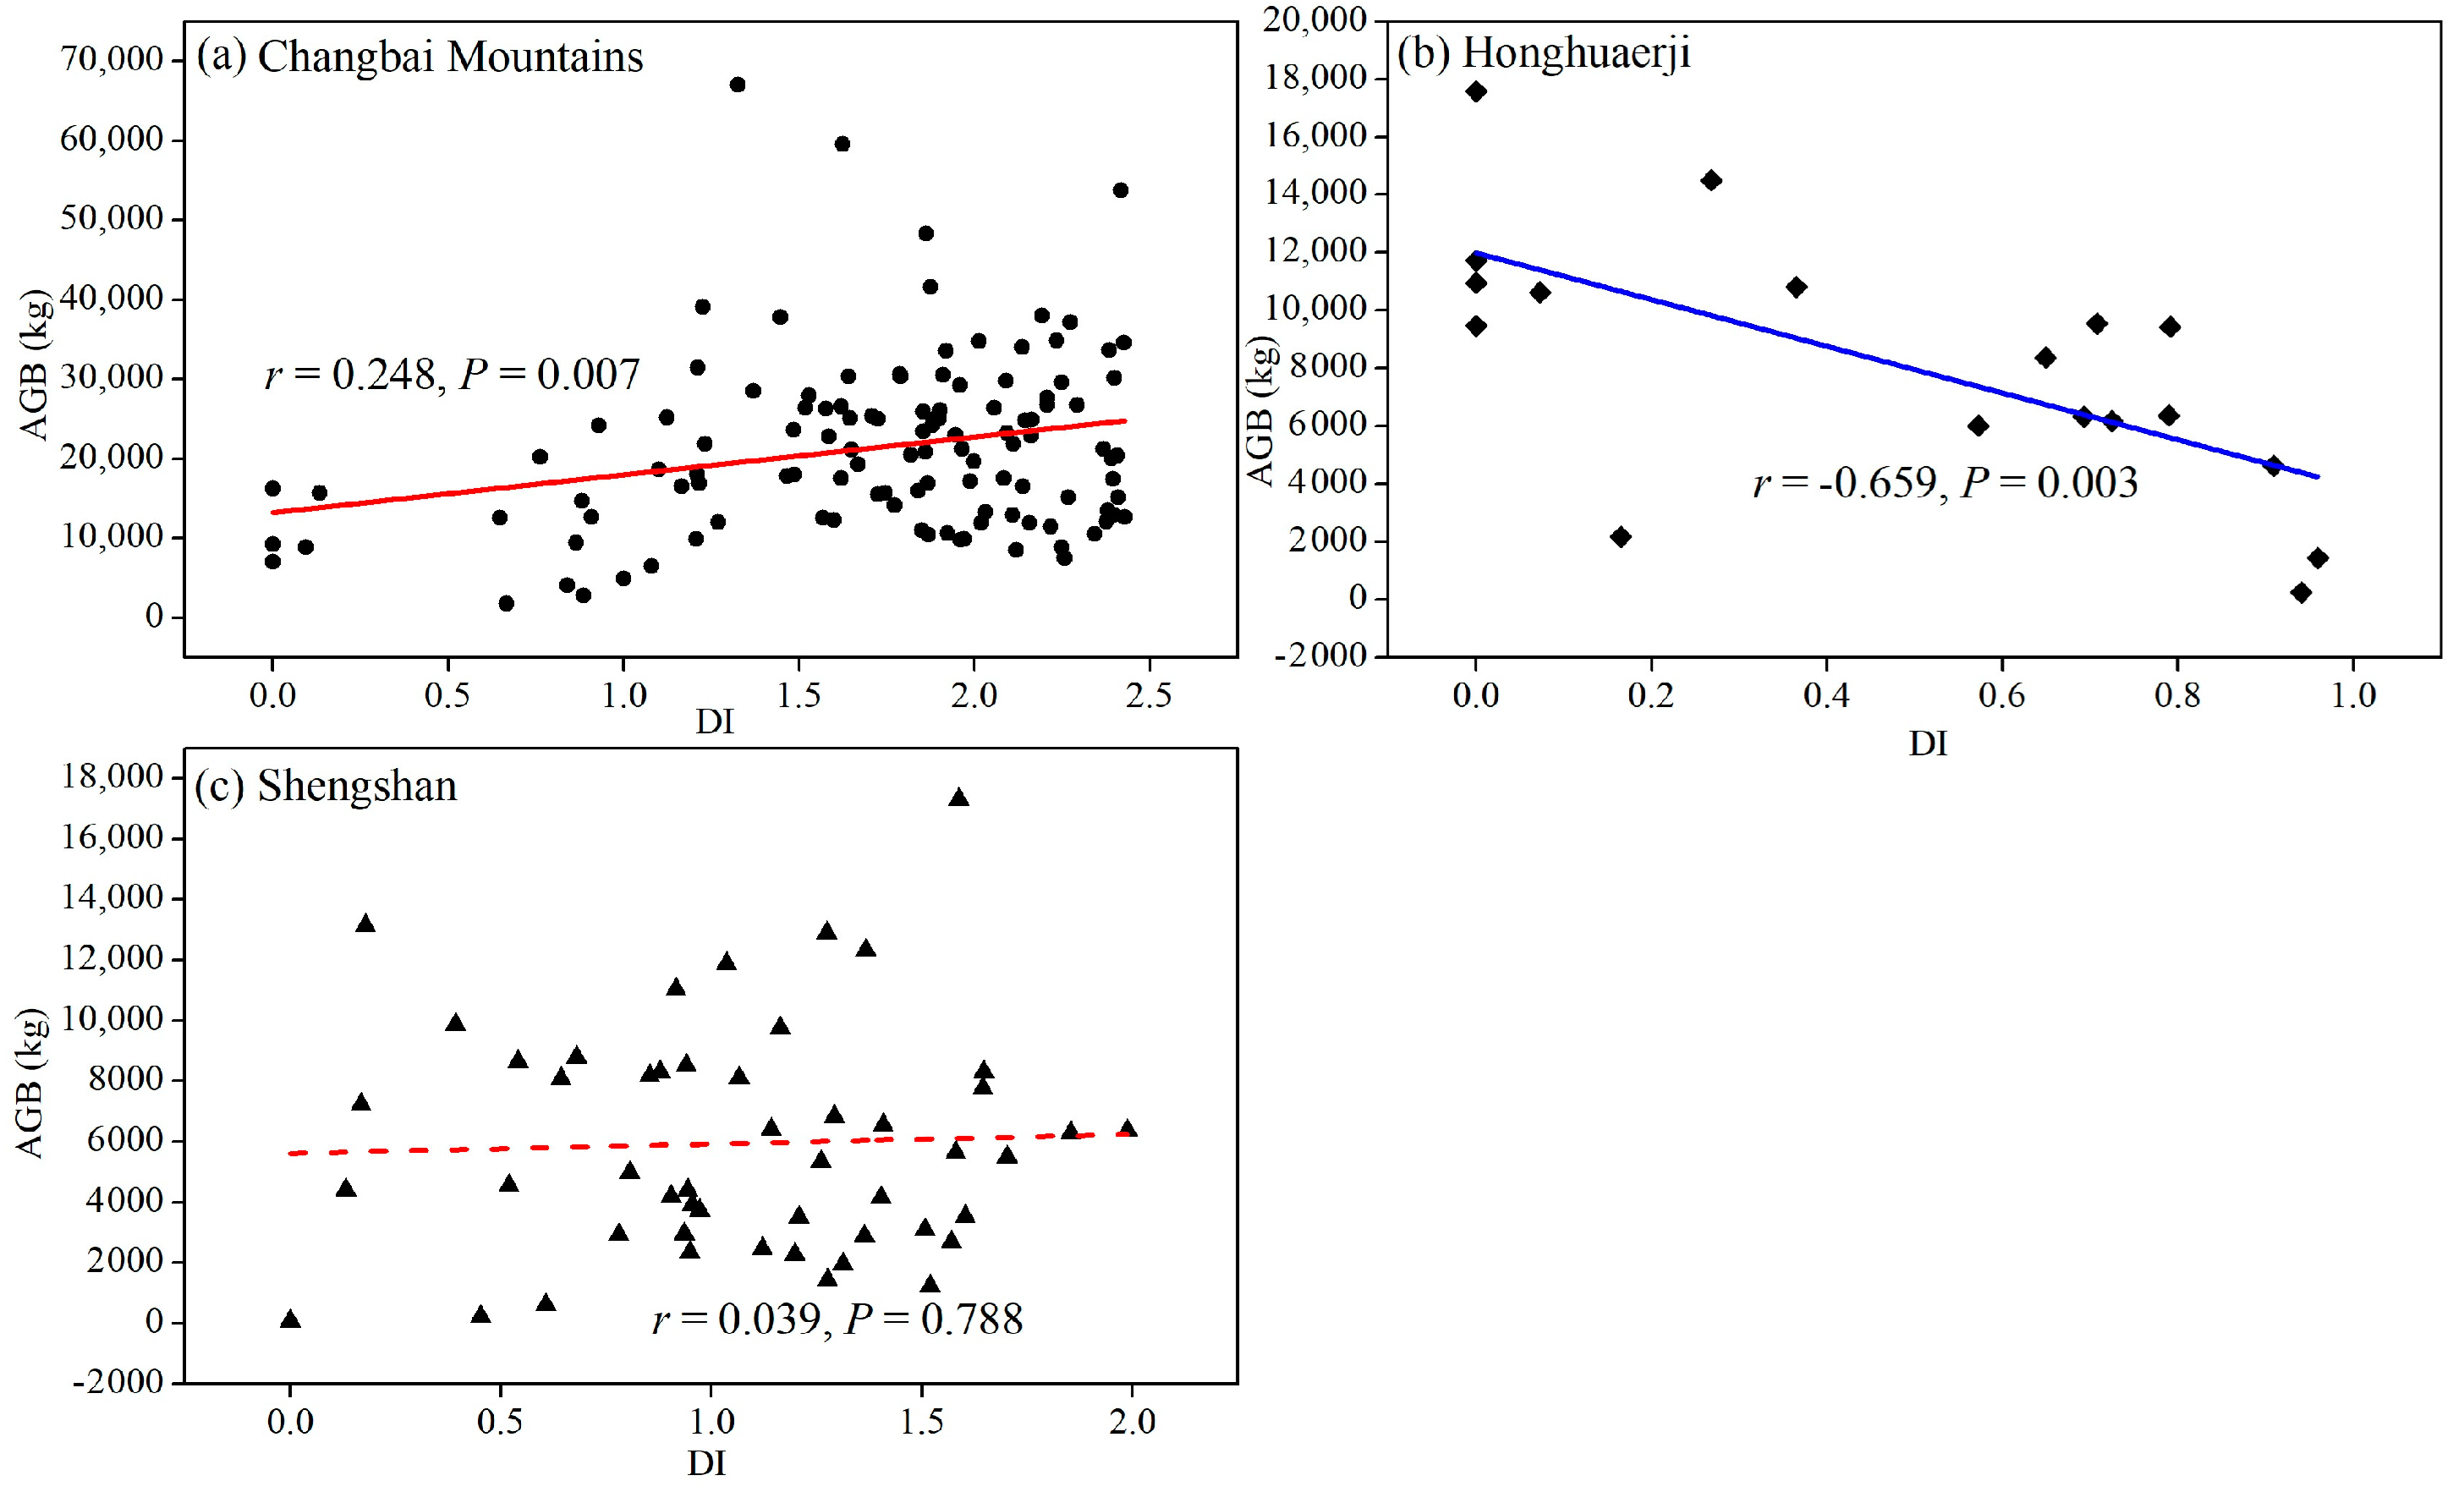
3.1. Changes in Relationships between Species Diversity and Aboveground Biomass

There were distinct differences in both species diversity and aboveground biomass among the natural reserves we studied. Both DI and AGB were obviously higher in the Changbai Mountains Natural Reserve than in the other two reserves (Figure 2), which coincided with the most suitable climate conditions for tree survival and growth, i.e., highest MAT, MAP, and water balance in this reserve among the three reserves analyzed (Figure S1). The DI in the Shengshan Natural Reserve was clearly higher than that in the Honghuaerji Natural Reserve, which corresponded well to the patterns of MAT, MAP, and water balance between the two reserves. In contrast, the AGB in the former reserve was obviously lower than that in the latter one.
The relationships between DI and AGB also changed largely across the natural reserves we analyzed on a small spatial scale. At the plot level, there was a significant (p < 0.01) and positive correlation between DI and AGB in the Changbai Mountains Natural Reserve (Figure 3a). In contrast, a significant (p < 0.01) but reversed relationship for these two metrics occurred in the Honghuaerji Natural Reserve (Figure 3b). In the Shengshan Natural Reserve, there was no obvious relationship between the two variables (Figure 3c). The patterns of the relationships between DI and AGB were also verified by those for Richness, Gini index, and Pielou index in these three reserves (Figures S2–S4), implying the reliability of our results in revealing the relationships between species diversity and aboveground biomass for the reserves investigated.

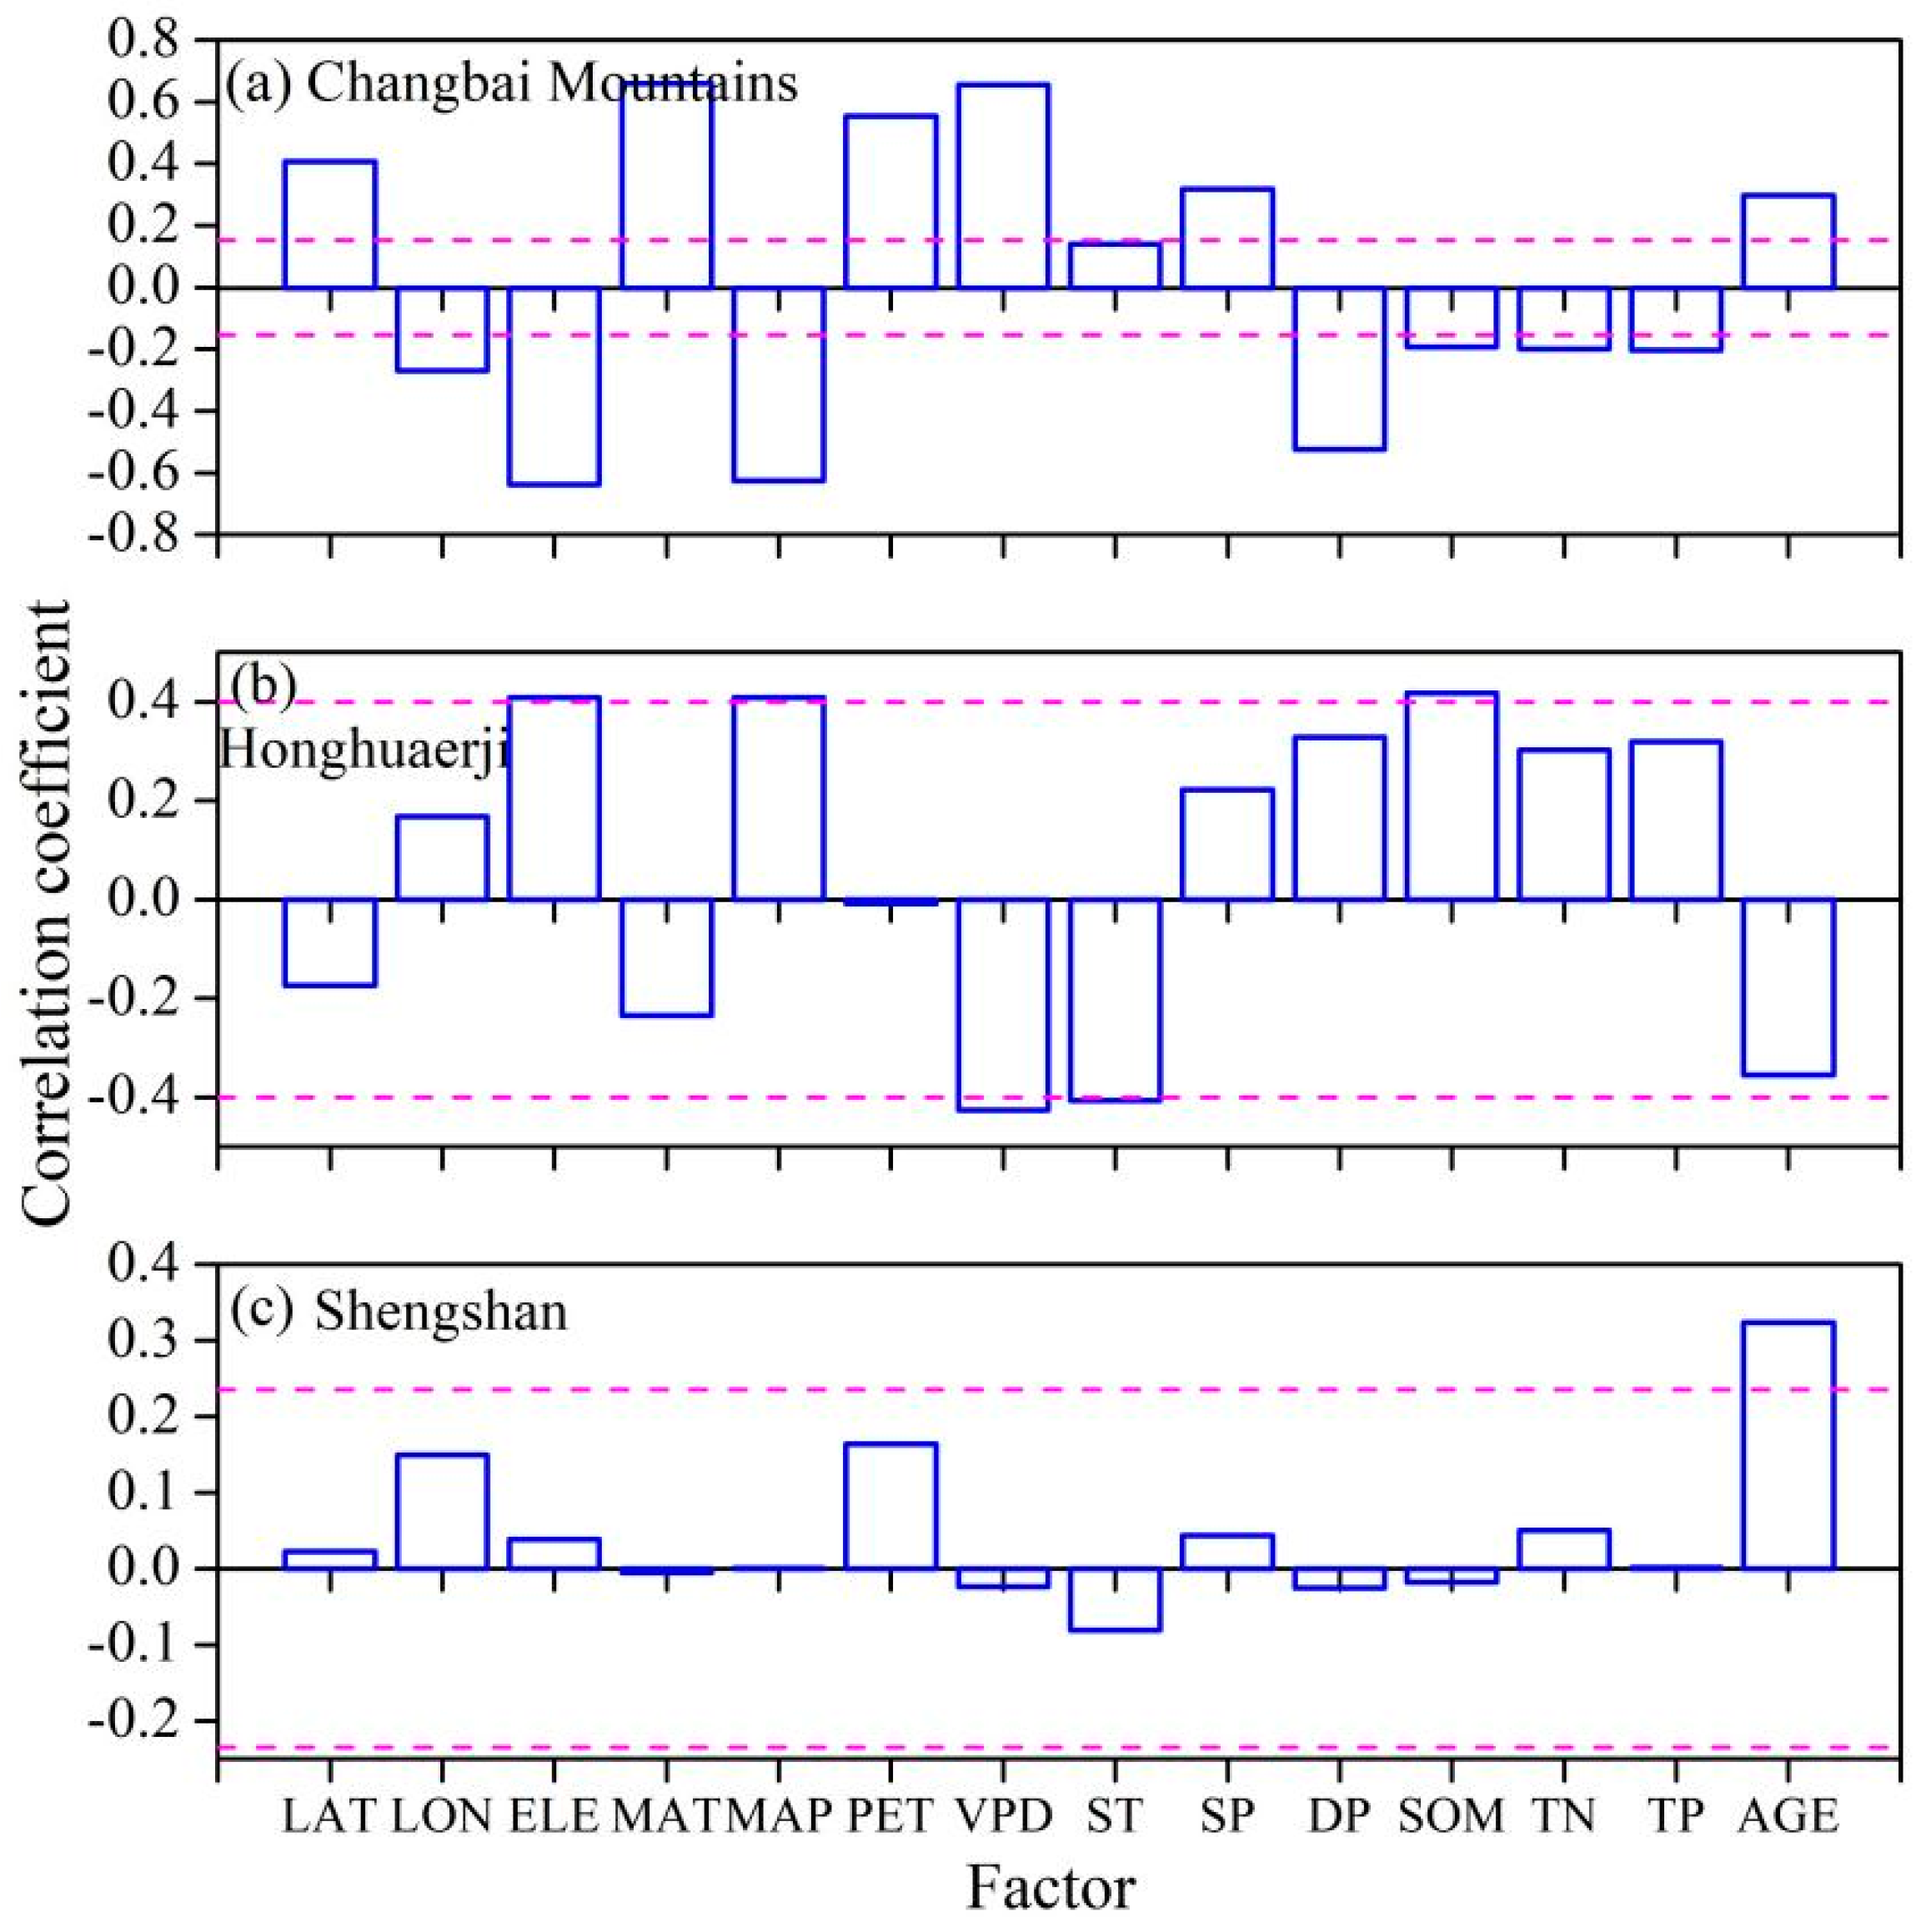
3.2. The Influencing Factors of the Species Diversity–Aboveground Biomass Relationship

The influence patterns of environmental factors on species diversity, aboveground biomass, and hence on their relationships varied considerably across the natural reserves investigated. The DI of the Changbai Mountains Natural Reserve was significantly (p < 0.1) and positively correlated with thermal factors, such as annual average temperature (MAT), potential evapotranspiration (PET), and saturated vapor pressure deficit (VPD), and forest stand age (AGE) (Figure 4a). On the contrary, the reversed relationships were observed between DI and water-related factors, i.e., MAP and DP. The reverse correlation pattern for heat- and water-related factors may be due to the fact that there were opposite relationships between these two kinds of factors (i.e., the correlation coefficient between MAT and MAP was −0.973 (p < 0.001). When MAP was controlled, the partial correlation between DI and MAT was significant (p < 0.05; Figure S5). On the contrary, the correlation for MAP was not significant (p = 0.297) if MAT was controlled. These results indicate that DI in the reserve was mainly affected by heat-related factors. In addition to heat-related climatic factors and stand age, we also found negative correlations of DI with elevation and the factors related to soil fertility, i.e., SOM, TN and TP, in the reserve (Figure 4a). In the Honghuaerji Natural Reserve, the DI was significantly (p < 0.1) positively correlated with water-related factor, such as MAP, as well as elevation and SOM, but negatively with thermal factors, i.e., VPD and ST (Figure 4b). The DI in the Shengshan Natural reserve only showed a significant (p < 0.1) and positive correlation with AGE (Figure 4c).
The correlation patterns of AGB with environmental factors were quite similar to those of DI in the Changbai Mountains Natural Reserve, but there were also some discrepancies between them (Figure 4a and Figure 5a). Compared with DI, AGB in the reserve showed obviously weaker correlations with heat-related factors, i.e., MAT, PET, and VPD, and with elevation but a stronger correlation with AGE. As for the Honghuaerji Natural Reserve, the directions of correlations between AGB and most of the environmental factors, such as MAP, elevation, SOM, and TN, were generally opposite to those for DI (Figure 4b and Figure 5b). It is worth noting that AGB was positively correlated with both MAT and ST in this reserve, with an obviously stronger positive correlation appearing in the latter environmental variable (Figure 5b). In addition, we found that there was a significant (p < 0.1) positive correlation between AGB and AGE, which was not observed for DI (Figure 4b and Figure 5b). In the Shengshan Natural Reserve, similar to the DI, the AGB was also significantly (p < 0.1) correlated with AGE, but additionally affected by climate factors, i.e., ST and DP, and latitude (Figure 4c and Figure 5c).
For clarifying the impacts of forest stand development on the species diversity–productivity relationship, we further analyzed the changes in species diversity and aboveground biomass with increasing forest stand age for the natural reserves we studied (Figure 6). In general, both DI and AGB significantly (p < 0.05) increased with the increase in AGE in the Changbai Mountains and Shengshan Natural Reserves (Figure 6a,c). Furthermore, a positive impact of AGE on AGB was also observed in the Honghuaerji Natural Reserve (Figure 6b). In contrast, negative but not significant relationships occurred between DI and AGE for this reserve. To explore simultaneous impacts of multiple factors and further determine the dominators for the dynamics of DI, AGB, and their relationships, we established the interrelations between the two metrics and their influencing factors using the multiple linear regression method for each of the reserves investigated (Table 1, Table 2 and Table 3). Both stand age and heat-related climate factors (as respectively reflected by LN(AGE) and CLI_PC1), had significant (p < 0.1) positive impacts on DI in the Changbai Mountains Natural Reserve (Table 1). Compared with DI, the influence of stand age on AGB strengthened and that of heat-related climate aspect weakened in this reserve, which was consistent with the impact pattern of single factors (Figure 4a and Figure 5a). In the Honghuaerji Natural Reserve, AGB was simultaneously influenced significantly (p < 0.1) by the aspects of stand age (LN(AGE)), climate (CLI_PC1), and elevation (LN(ELE)), whereas these impact patterns were not observed for DI (Table 2). As for the Shengshan Natural Reserve, both DI and AGB were affected by stand age (LN(AGE); Table 3).

4. Discussions

4.1. Changes in the Relationship between Species Diversity and Aboveground Biomass across the Investigated Natural Reserves

Our results suggest that higher availability in both temperature (heat) and water could favor more abundant tree species and higher aboveground biomass and hence forest productivity in forest-dominated natural reserves at relatively high latitudes. This is indicated by good consistencies in distribution patterns of high–low values between the climate variables and the metrics of diversity and productivity (i.e., DI and AGB) for the natural reserves investigated (Figure 2 and Figure S1), which implies the importance of climate in driving the latter two metrics and their relationships in natural reserves. This results is in line with evidence that climate, particularly temperature, plays an important role in determining vegetation growth and species distribution in high-latitude areas [50,51,52]. It is worth mentioning that the AGB of the Shengshan Natural Reserve is singularly low, although both temperature and precipitation of this reserve are moderate among the reserves analyzed, indicating that other factors may be more important in modulating the forest productivity of the reserve. Meanwhile, the AGB in the Honghuaerji Natural Reserve is relatively high, although the environmental conditions in the reserve are the harshest among the reserves investigated (Figure S1). This may be due to the fact that Mongolian pine plantations account for a considerable proportion of the forests of the reserve and possess relatively high productivity relative to many of other natural forests in water-deficit regions. Collectively, our study reveals the important roles of environmental conditions in regulating both species diversity and productivity, which could further influence their interrelations.
Furthermore, we found changes in species diversity–aboveground biomass relationships in forest-dominated natural reserves with different environmental conditions, which was consistent with our hypothesis that the associations between the two metrics would vary across environmental conditions. The diversity–aboveground biomass relationships reflected by DI and AGB were also verified by the associations of AGB with the other three diversity indexes, i.e., Richness, Gini index, and Pielou index (Figures S2–S4), which further confirms the robustness of the obtained species diversity–productivity relationships for each natural reserve. In addition, the conclusions obtained by the current study are also supported by a number of previous studies that reported variations in relations between species number and vegetation productivity across different biomes or regions [11,12] and even at different phases of ecosystem development within a region [53,54]. Positive diversity–productivity relationships have been reported in boreal and Mediterranean forests [21,24], whereas negative relations were found in forests of other regions [12], indicating the regional differences for such relationships. The varying relationships between species diversity and aboveground biomass among the natural reserves indicate that different factors might have played roles in the formations of such relationships. This highlights the importance of understanding the diverse relationships between species diversity and productivity through clarifying the driving factors behind them. It is noted that in this study, we only consider the forest productivity aboveground and neglect the underground part, which may add some uncertainty in our analysis on the diversity–productivity relationships. Thus, the species diversity–aboveground biomass relationships revealed by our results may have potential limitations in reflecting the associations between biodiversity and forest productivity. The diversity–productivity relationships across ecosystems are quite complex and further studies are needed to incorporate the analysis of underground organs, such as the roots of trees, for more comprehensively revealing such relationships. In addition, although this study employed ground data incorporating 22,139 trees of 185 plots from the investigated natural reserves, there are potential limitations in exactly revealing the relationships between tree species diversity and forest productivity since information for some parts of the reserves was not included. Therefore, remote sensing data of fine spatial resolution and more ground survey data are still needed to improve our understanding of the species diversity–productivity in the study region.

4.2. Site-Dependent Factors Modulate the Species Diversity–Aboveground Biomass Relationship on a Small Spatial Scale

Varying relationships between species diversity and aboveground biomass among the natural reserves with different environmental conditions are likely associated with changes in influencing factors as well as in their relative importance across different reserves. These results support the assumption that the associations between species diversity and productivity are driven by site-specific factors. Differences in site-related factors (such as climate condition, soil fertility, and species composition) across the natural reserves may create different environmental stressors that lead to diverse species interactions and hence various species diversity–productivity relationships. This is consistent with the Stress-Gradient Hypothesis, which highlights the important roles of shifts in environmental stressors in species interactions and vegetation productivity across ecosystems [34]. Our findings for the natural reserves in northeastern China also correspond well to previous reports about ecological context-dependent relationships between species diversity and vegetation productivity for grassland and forest ecosystems in other regions [11,12,55]. Large differences in environmental contexts among the natural reserves we studied probably lead to different influencing environmental factors and hence changing relationships between species diversity and productivity. Specifically, because of relatively high latitudes compounded by high elevations with large variations in values (ranging between 748 and 2006 m a.s.l. for the plots investigated) in the Changbai Mountains Natural Reserve, heat-related factors (i.e., MAT) are likely to play key roles in limiting both species diversity and forest productivity, as indicated by significant (p < 0.1) positive correlations of these factors with DI and AGB (Figure 4a and Figure 5a). The roles of heat condition in forming the relations between species number and productivity in the Changbai Mountains Natural Reserve agree well with evidence that temperature and other heat-related factors are important factors in driving biodiversity and vegetation productivity in high elevations and/or latitudes where the temperatures are generally low [56,57]. As climate warming is projected to be continuous in the near future [58,59], we speculate that the number of tree species and forest productivity may further increase, which could potentially affect the relationship between the two metrics in the reserve. In addition to the impacts of thermal factors, we found that stand age simultaneously affected species diversity and forest productivity in the Changbai Mountains Natural Reserve, as reflected by the positive relationship of AGE with DI and AGB (Figure 4, Figure 5 and Figure 6). This result is in line with previous findings that age-related succession can play a remarkable role in modulating species number and forest productivity and hence their associations in some other ecosystems dominated by herbaceous or woody plant communities [33].
Inconsistent with the positive diversity–aboveground biomass relationship and its driving factors in the Changbai Mountains Natural Reserve, we found a negative species diversity–aboveground biomass relationship in the Honghuaerji Natural Reserve, where DI positively responds to both elevation and MAP. As precipitation is typically elevation-dependent and generally increases with elevation [60,61], the elevation probably influences species diversity by altering water availability in the reserve, since the precipitation is relatively deficient with MAP less than 400 mm. The positive association between species diversity and water availability in the Honghuaerji Natural Reserve is consistent with previous reports that climate drying can adversely affect biodiversity across various biomes of the globe [62,63]. This highlights the need for strengthening biodiversity conservation under the influence of climate change, particularly for those areas where water deficit is pronounced. Unlike species diversity, aboveground biomass in the Honghuaerji Natural Reserve is probably dominated by temperature and stand age, as shown by significant (p < 0.1) and positive correlations of AGB with ST and AGE (Figure 5b). Notably, compared with MAT, the positive association of AGB with ST was obviously higher, which indicates the importance of the seasonality of temperature to tree growth and forest productivity in this reserve. The finding of the role of temperature seasonality in AGB for the natural reserves in our study area can also be supported by evidence that the aggregation of temperature in a particular season within a year, i.e., the growing season, is the predominate factor for vegetation activities in high-latitude areas [64,65]. Because the temperature is lowest in the Honghuaerji Natural Reserve among the reserves analyzed and the elevation is relatively high (ranging from 797 to 847 m a.s.l. for the plots investigated), the combination of these environmental conditions can result in a relatively short period of growth [66,67], and hence, the seasonality of temperature is likely to be a key factor in determining forest productivity. Altogether, our results imply that the opposite relationship between species diversity and aboveground biomass in the Honghuaerji Natural Reserve can be likely attributed to the different factors in driving the two metrics and the opposite directions in influencing these factors.
Our results also indicate that complex influencing factors may lead to no obvious relationship between species diversity and forest productivity, as appeared in the Shengshan Natural Reserve, where species diversity and aboveground biomass were simultaneously influenced by stand age but forest productivity was additionally affected by several other factors such as latitude, ST, and DP (Figure 4c, Figure 5c and Figure 6c). Ambiguous relationships of species diversity with productivity has also been reported in other areas where the potential driving factors for the two variables are inconsistent and rather complex [11,23], which may bring about large uncertainty in predicting the dynamics of the relationship in the future.
This study suggests that site-dependent factors play important roles in driving the relationships between species diversity and forest productivity on small spatial scales and differences in environmental conditions across sites/regions are likely to result in variations in species diversity–productivity relationships. The Stress-Gradient Hypothesis claims that changes in stress along with different environmental conditions can lead to variations in interactions among species, which can further affect the number of tree species and its relationships with forest productivity, as indicated by our results. Our study, thus, supports and further develops the hypothesis to some degree.

4.3. Implications for Forest Management and Conservation

Our study reveals that various relationships between species diversity and aboveground biomass across the forest-predominant natural reserves with contrasting environmental contexts o a small spatial scale can be driven by site-specific factors. This indicates the importance of using diverse strategies in forest management and conservation for various natural ecosystems. As for the forest-dominated ecosystems possessing positive associations between species number and productivity, such as in the Changbai Mountains Natural Reserve, it is necessary to facilitate or strengthen those factors that can promote both species diversity and forest productivity and to alleviate or eliminate the factors decreasing the two metrics. As for this kind of ecosystem, the objective of forest management should focus on maximizing both biodiversity and forest productivity. With regard to the forest ecosystems having reverted relationships between species diversity and productivity, such as in the Honghuaerji Natural Reserve, it is of great importance to balance these two metrics in forest management by regulating the driving mechanisms behind them. In other words, it is inevitable to optimize one of the two metrics at the expense of another. As for those forest ecosystems (such as the Shengshan Natural Reserve) with no obvious relationship between species richness and forest productivity, it is necessary to first clarify the influencing mechanisms by examining complex influencing driving factors and then take rational countermeasures to optimize the two metrics related to ecological functions by regulating their influencing factors.

5. Conclusions

Collectively, our study suggests that diverse relationships between species diversity and aboveground biomass occurred among the forest-dominated natural reserves in northeastern China with different environmental conditions on relatively small spatial scales; these changes were probably regulated by site-specific factors. Specifically, the positive association between species diversity and aboveground biomass in the Changbai Mountains Natural Reserve is attributed to the positive impacts of both heat-related climate factors and stand age on these two metrics, since these two kinds of factors were positively correlated with both DI and AGB. A negative diversity–productivity relationship occurred in the Honghuaerji Natural Reserve, which may be due to the fact that species diversity was related to elevation and water-related climate factors, i.e., MAP, while forest productivity was dominated by stand age and heat-related climate factors, i.e., ST, VPD, and MAT. These two kinds of factors are generally opposite in the change trends. In addition, because the influencing factors of species diversity and aboveground biomass were different and complex, no obvious relationship between the two metrics was observed for the Shengshan Natural Reserve. These results highlight the importance of using diverse strategies for forest conservation and sustainable management in forest ecosystems with different environmental conditions. Future research involving more natural reserves across different biomes and including data of more indicators such as underground biomass are needed.

Supplementary Materials

The following supporting information can be downloaded at: https://www.mdpi.com/article/10.3390/su16198378/s1, Figure S1: The climate conditions for the natural reserves analyzed. (a) Annual total precipitation (MAP) and annual mean temperature (MAT); (b) Annual water balance (Calculated from differences between MAP and annual PET); Figure S2: Scatter plots showing the relationships between diversity indicators ((a) Richness, (b) Gini index, (c) Pielou index) and aboveground biomass (AGB) for Changbai Mountains Natural Reserve. Solid and dashed lines denote that the linear relationships were statistically significant and insignificant at the level of 10%, respectively; Figure S3: Scatter plots showing the relationship between diversity indicators ((a) Richness, (b) Gini index, (c) Pielou index) and aboveground biomass (AGB) for Honghuaerji Natural Reserve. Solid line denotes that the linear relationship was statistically significant at the level of 10%; Figure S4: Scatter plots showing the relationship between diversity indicators ((a) Richness, (b) Gini index, (c) Pielou index) and aboveground biomass (AGB) for Shengshan Natural Reserve. Dashed lines denotes that the linear relationship was not statistically significant at the level of 10%; Figure S5: Partial correlations of tree species diversity index (DI) with annual mean temperature (MAT) and annual total precipitation (MAP) for Changbai Mountains Natural Reserve. The partial correlation coefficient between DI with one climate factor was calculated when another factor was controlled. The dashed horizontal line denotes the correlation reaching statistical significance at the level of 5%; Table S1: The statistics of the principal component analysis for each of the natural reserves analyzed.

Author Contributions

L.Y. performed data analyses and wrote the paper; J.Z. designed the frame of the study, collected the data, and modified the paper; J.W., Z.G., C.F. and J.Y. collected the data; S.H. collected the data and modified the paper. All authors contributed to the final manuscript. All authors have read and agreed to the published version of the manuscript.

Funding

This study was supported by the Qufu Normal University Research Initiation Fund (613001) and the National Natural Science Foundation of China (41430639).

Data Availability Statement

Data will be made available on request through the corresponding author.

Conflicts of Interest

The authors declare no conflicts of interest.

References

  1. Liang, J.; Crowther, T.W.; Picard, N.; Wiser, S.; Zhou, M.; Alberti, G.; Schulze, E.-D.; McGuire, A.D.; Bozzato, F.; Pretzsch, H.; et al. Positive biodiversity-productivity relationship predominant in global forests. Science 2016, 354, aaf8957. [Google Scholar] [CrossRef] [PubMed]
  2. ter Steege, H.; Pitman, N.C.A.; Killeen, T.J.; Laurance, W.F.; Peres, C.A.; Guevara, J.E.; Salomão, R.P.; Castilho, C.V.; Amaral, I.L.; de Almeida Matos, F.D.; et al. Estimating the global conservation status of more than 15,000 Amazonian tree species. Sci. Adv. 2015, 1, e1500936. [Google Scholar] [CrossRef] [PubMed]
  3. A Williams, B.; Grantham, H.S.; Watson, J.E.M.; Alvarez, S.J.; Simmonds, J.S.; A Rogéliz, C.; Da Silva, M.; Forero-Medina, G.; Etter, A.; Nogales, J.; et al. Minimising the loss of biodiversity and ecosystem services in an intact landscape under risk of rapid agricultural development. Environ. Res. Lett. 2020, 15, 014001. [Google Scholar] [CrossRef]
  4. Le Provost, G.; Schenk, N.V.; Penone, C.; Thiele, J.; Westphal, C.; Allan, E.; Ayasse, M.; Blüthgen, N.; Boeddinghaus, R.S.; Larissa Boesing, A.; et al. The supply of multiple ecosystem services requires biodiversity across spatial scales. Nat. Ecol. Evol. 2022, 7, 236–249. [Google Scholar] [CrossRef] [PubMed]
  5. Anderegg, W.R.; Anderegg, L.D.; Kerr, K.L.; Trugman, A.T. Widespread drought-induced tree mortality at dry range edges indicates that climate stress exceeds species’ compensating mechanisms. Glob. Chang. Biol. 2019, 25, 3793–3802. [Google Scholar] [CrossRef]
  6. Hofhansl, F.; Chacón-Madrigal, E.; Fuchslueger, L.; Jenking, D.; Morera-Beita, A.; Plutzar, C.; Silla, F.; Andersen, K.M.; Buchs, D.M.; Dullinger, S.; et al. Climatic and edaphic controls over tropical forest diversity and vegetation carbon storage. Sci. Rep. 2020, 10, 5066. [Google Scholar] [CrossRef]
  7. Wright, L.S.; Pessarrodona, A.; Foggo, A. Climate-driven shifts in kelp forest composition reduce carbon sequestration potential. Glob. Chang. Biol. 2022, 28, 5514–5531. [Google Scholar] [CrossRef]
  8. Arthington, A.H.; Naiman, R.J.; McClain, M.E.; Nilsson, C. Preserving the biodiversity and ecological services of rivers: New challenges and research opportunities. Freshw. Biol. 2010, 55, 1–16. [Google Scholar] [CrossRef]
  9. Manning, P.; Loos, J.; Barnes, A.D.; Batáry, P.; Bianchi, F.J.J.A.; Buchmann, N.; De Deyn, G.B.; Ebeling, A.; Eisenhauer, N.; Fischer, M.; et al. Transferring biodiversity-ecosystem function research to the management of ‘real-world’ ecosystems. In Advances in Ecological Research; Eisenhauer, N., Bohan, D.A., Dumbrell, A.J., Eds.; Academic Press: Cambridge, MA, USA, 2019; pp. 323–356. [Google Scholar]
  10. Costanza, R.; d’Arge, R.; de Groot, R.; Farber, S.; Grasso, M.; Hannon, B.; Limburg, K.; Naeem, S.; O’Neill, R.V.; Paruelo, J.; et al. The value of the world’s ecosystem services and natural capital. Nature 1997, 387, 253–260. [Google Scholar] [CrossRef]
  11. Waide, R.B.; Willig, M.R.; Steiner, C.F.; Mittelbach, G.; Gough, L.; Dodson, S.I.; Juday, G.P.; Parmenter, R. The relationship between productivity and species richness. Annu. Rev. Ecol. Evol. Syst. 1999, 30, 257–300. [Google Scholar] [CrossRef]
  12. Fei, S.; Jo, I.; Guo, Q.; Wardle, D.A.; Fang, J.; Chen, A.; Oswalt, C.M.; Brockerhoff, E.G. Impacts of climate on the biodiversity-productivity relationship in natural forests. Nat. Commun. 2018, 9, 5436. [Google Scholar] [CrossRef] [PubMed]
  13. Park, T.; Ganguly, S.; Tømmervik, H.; Euskirchen, E.S.; Høgda, K.-A.; Karlsen, S.R.; Brovkin, V.; Nemani, R.R.; Myneni, R.B. Changes in growing season duration and productivity of northern vegetation inferred from long-term remote sensing data. Environ. Res. Lett. 2016, 11, 084001. [Google Scholar] [CrossRef]
  14. Levesque, M.; Andreu-Hayles, L.; Smith, W.K.; Williams, A.P.; Hobi, M.L.; Allred, B.W.; Pederson, N. Tree-ring isotopes capture interannual vegetation productivity dynamics at the biome scale. Nat. Commun. 2019, 10, 742. [Google Scholar] [CrossRef]
  15. Hector, A.; Schmid, B.; Beierkuhnlein, C.; Caldeira, M.C.; Diemer, M.; Dimitrakopoulos, P.G.; Finn, J.A.; Freitas, H.; Giller, P.S.; Good, J.; et al. Plant diversity and productivity experiments in European grasslands. Science 1999, 286, 1123–1127. [Google Scholar] [CrossRef]
  16. Tilman, D.; Reich, P.B.; Knops, J.; Wedin, D.; Mielke, T.; Lehman, C. Diversity and productivity in a long-term grassland experiment. Science 2001, 294, 843–845. [Google Scholar] [CrossRef]
  17. Isbell, F.I.; Polley, H.W.; Wilsey, B.J. Biodiversity, productivity and the temporal stability of productivity: Patterns and processes. Ecol. Lett. 2009, 12, 443–451. [Google Scholar] [CrossRef] [PubMed]
  18. Liu, J.; Liu, D.; Xu, K.; Gao, L.M.; Ge, X.J.; Burgess, K.S.; Cadotte, M.W. Biodiversity explains maximum variation in productivity under experimental warming, nitrogen addition, and grazing in mountain grasslands. Ecol. Evol. 2018, 8, 10094–10112. [Google Scholar] [CrossRef]
  19. Wagg, C.; Roscher, C.; Weigelt, A.; Vogel, A.; Ebeling, A.; de Luca, E.; Roeder, A.; Kleinspehn, C.; Temperton, V.M.; Meyer, S.T.; et al. Biodiversity–stability relationships strengthen over time in a long-term grassland experiment. Nat. Commun. 2022, 13, 7752. [Google Scholar] [CrossRef] [PubMed]
  20. Lin, S.X.; Fan, C.Y.; Zhang, C.Y.; Zhao, X.H.; von Gadow, K. Anthropogenic disturbance mediates soil water effect on diversity-productivity relationships in a temperate forest region. For. Ecol. Manag. 2022, 525, 120544. [Google Scholar] [CrossRef]
  21. Paquette, A.; Messier, C. The effect of biodiversity on tree productivity: From temperate to boreal forests. Glob. Ecol. Biogeogr. 2011, 20, 170–180. [Google Scholar] [CrossRef]
  22. Liang, J.; Zhou, M.; Tobin, P.C.; McGuire, A.D.; Reich, P.B. Biodiversity influences plant productivity through niche-efficiency. Proc. Natl. Acad. Sci. USA 2015, 112, 5738–5743. [Google Scholar] [CrossRef] [PubMed]
  23. Ratcliffe, S.; Wirth, C.; Jucker, T.; van der Plas, F.; Scherer-Lorenzen, M.; Verheyen, K.; Allan, E.; Benavides, R.; Bruelheide, H.; Ohse, B.; et al. Biodiversity and ecosystem functioning relations in European forests depend on environmental context. Ecol. Lett. 2017, 20, 1414–1426. [Google Scholar] [CrossRef]
  24. Vilà, M.; Vayreda, J.; Comas, L.; Ibáñez, J.J.; Mata, T.; Obón, B. Species richness and wood production: A positive association in Mediterranean forests. Ecol. Lett. 2007, 10, 241–250. [Google Scholar] [CrossRef]
  25. Grace, J.B.; Anderson, T.M.; Seabloom, E.W.; Borer, E.T.; Adler, P.B.; Harpole, W.S.; Hautier, Y.; Hillebrand, H.; Lind, E.M.; Pärtel, M.; et al. Integrative modelling reveals mechanisms linking productivity and plant species richness. Nature 2016, 529, 390–393. [Google Scholar] [CrossRef] [PubMed]
  26. Huston, M.A. Hidden treatments in ecological experiments: Re-evaluating the ecosystem function of biodiversity. Oecologia 1997, 110, 449–460. [Google Scholar] [CrossRef] [PubMed]
  27. Jucker, T.; Avacariței, D.; Barnoaiea, I.; Duduman, G.; Bouriaud, O.; Coomes, D.A. Climate modulates the effects of tree diversity on forest productivity. J. Ecol. 2016, 104, 388–398. [Google Scholar] [CrossRef]
  28. Liu, J.; Xu, Y.; Shan, Y.X.; Burgess, K.S.; Ge, X.J. Biotic and abiotic factors determine species diversity-productivity relationships in mountain meadows. J. Plant Ecol. 2021, 14, 1175–1188. [Google Scholar] [CrossRef]
  29. Vilà, M.; Inchausti, P.; Vayreda, J.; Barrantes, O.; Gracia, C.; Ibáñez, J.J.; Mata, T. Confounding factors in the observational productivity-diversity relationship in forests. In Forest Diversity and Function: Temperate and Boreal Systems; Scherer-Lorenzen, M., Körner, C., Schulze, E.-D., Eds.; Springer: Berlin/Heidelberg, Germany, 2005; pp. 65–86. [Google Scholar]
  30. Ammer, C. Diversity and forest productivity in a changing climate. New Phytol. 2019, 221, 50–66. [Google Scholar] [CrossRef]
  31. Jactel, H.; Gritti, E.S.; Drössler, L.; Forrester, D.I.; Mason, W.L.; Morin, X.; Pretzsch, H.; Castagneyrol, B. Positive biodiversity-productivity relationships in forests: Climate matters. Biol. Lett. 2018, 14, 20170747. [Google Scholar] [CrossRef]
  32. Nguyen, H.; Herbohn, J.; Firn, J.; Lamb, D. Biodiversity–productivity relationships in small-scale mixed-species plantations using native species in Leyte province, Philippines. For. Ecol. Manag. 2012, 274, 81–90. [Google Scholar] [CrossRef]
  33. Taylor, A.R.; Gao, B.; Chen, H.Y.H. The effect of species diversity on tree growth varies during forest succession in the boreal forest of central Canada. For. Ecol. Manag. 2020, 455, 117641. [Google Scholar] [CrossRef]
  34. Maestre, F.T.; Callaway, R.M.; Valladares, F.; Lortie, C.J. Refining the stress-gradient hypothesis for competition and facilitation in plant communities. J. Ecol. 2009, 97, 199–205. [Google Scholar] [CrossRef]
  35. Maestre, F.T.; Valladares, F.; Reynolds, J.F. The stress-gradient hypothesis does not fit all relationships between plant-plant interactions and abiotic stress: Further insights from arid environments. J. Ecol. 2006, 94, 17–22. [Google Scholar] [CrossRef]
  36. Armas, C.; Rodriguez-Echeverria, S.; Pugnaire, F.I. A field test of the stress-gradient hypothesis along an aridity gradient. J. Veg. Sci. 2011, 22, 818–827. [Google Scholar] [CrossRef]
  37. Dohn, J.; Dembele, F.; Karembe, M.; Moustakas, A.; Amevor, K.A.; Hanan, N.P. Tree effects on grass growth in savannas: Competition, facilitation and the stress-gradient hypothesis. J. Ecol. 2013, 101, 202–209. [Google Scholar] [CrossRef]
  38. Scott, J.M.; Davis, F.W.; McGhie, R.G.; Wright, R.G.; Groves, C.; Estes, J. Nature reserves: Do they capture the full range of America’s biological diversity? Ecol. Appl. 2001, 11, 999–1007. [Google Scholar] [CrossRef]
  39. Zhao, L.; Du, M.; Du, W.; Guo, J.; Liao, Z.; Kang, X.; Liu, Q. Evaluation of the Carbon Sink Capacity of the Proposed Kunlun Mountain National Park. Int. J. Environ. Res. Public Health 2022, 19, 9887. [Google Scholar] [CrossRef]
  40. Yang, L.L.; Zhang, J.H.; Wang, J.H.; Gu, Y.; Han, S.J. A linear positive relationship between tree species diversity and forest productivity across forest-dominated natural reserves on a large spatial scale. For. Ecol. Manag. 2023, 548, 121409. [Google Scholar] [CrossRef]
  41. Friedl, M.; Sulla-Menashe, D. MCD12Q1 MODIS/Terra+Aqua Land Cover Type; Yearly L3 Global 500m SIN Grid V006; NASA EOSDIS Land Processes DAAC: Sioux Falls, SD, USA, 2019. [Google Scholar]
  42. Fick, S.E.; Hijmans, R.J. WorldClim 2: New 1-km spatial resolution climate surfaces for global land areas. Int. J. Climatol. 2017, 37, 4302–4315. [Google Scholar] [CrossRef]
  43. Poggio, L.; Sousa, L.M.D.; Batjes, N.H.; Heuvelink, G.B.M.; Kempen, B.; Ribeiro, E.; Rossiter, D. SoilGrids 2.0: Producing soil information for the globe with quantified spatial uncertainty. Soil 2021, 7, 217–240. [Google Scholar] [CrossRef]
  44. Magurran, A.E. Ecological Diversity and Its Measurement; Princeton University Press: Princeton, NJ, USA, 1988. [Google Scholar]
  45. Yu, S.; Ma, K.; Xu, C.; Jin, S.; Song, X.; Chen, L. Characteristics of species diversity of Quercus mongolica community under environmental gradients. Chin. J. Ecol. 2004, 24, 2932–2939. (In Chinese) [Google Scholar]
  46. Zhou, G.Y.; Yin, G.C.; Tang, X.L. Carbon Storage-Biomass Equation of Forest Ecosystem in China; Science Press: Beijing, China, 2018. (In Chinese) [Google Scholar]
  47. Holgado-Tello, F.P.; Chacon-Moscoso, S.; Barbero-Garcia, I.; Vila-Abad, E. Polychoric versus Pearson correlations in exploratory and confirmatory factor analysis of ordinal variables. Qual. Quant. 2010, 44, 153–166. [Google Scholar] [CrossRef]
  48. Montgomery, D.C.; Peck, E.A.; Vining, G.G. Introduction to Linear Regression Analysis; John Wiley Sons: Hoboken, NJ, USA, 2021. [Google Scholar]
  49. Abdi, H.; Williams, L.J. Principal component analysis. WIRES Comput. Stat. 2010, 2, 433–459. [Google Scholar] [CrossRef]
  50. Bonan, G.B.; Shugart, H.H.; Urban, D.L. The sensitivity of some high-latitude boreal forests to climatic parameters. Clim. Change 1990, 16, 9–29. [Google Scholar] [CrossRef]
  51. Prevéy, J.; Vellend, M.; Rüger, N.; Hollister, R.D.; Bjorkman, A.D.; Myers-Smith, I.H.; Elmendorf, S.C.; Clark, K.; Cooper, E.J.; Elberling, B.; et al. Greater temperature sensitivity of plant phenology at colder sites: Implications for convergence across northern latitudes. Glob. Chang. Biol. 2017, 23, 2660–2671. [Google Scholar] [CrossRef]
  52. Liu, J.; Wennberg, P.O.; Parazoo, N.C.; Yin, Y.; Frankenberg, C. Observational constraints on the response of high-latitude northern forests to warming. AGU Adv. 2020, 2, e2020AV000228. [Google Scholar] [CrossRef]
  53. Chase, J.M.; Leibold, M.A. Spatial scale dictates the productivity–biodiversity relationship. Nature 2002, 416, 427–430. [Google Scholar] [CrossRef]
  54. Chase, J.M.; Ryberg, W.A. Connectivity, scale-dependence, and the productivity-diversity relationship. Ecol. Lett. 2004, 7, 676–683. [Google Scholar] [CrossRef]
  55. Belotea, R.T.; Prisley, S.; Jones, R.H.; Fitzpatrick, M.; de Beurs, K. Forest productivity and tree diversity relationships depend on ecological context within mid-Atlantic and Appalachian forests (USA). For. Ecol. Manag. 2011, 261, 1315–1324. [Google Scholar] [CrossRef]
  56. Kvíderová, J.; Shukla, S.P.; Pushparaj, B.; Elster, J. Perspectives of low temperature biomass production of polar microalgae and biotechnology expansion into high latitudes. In Psychrophiles: From Biodiversity to Biotechnology; Margesin, R., Ed.; Springer: Cham, Switzerland, 2017; pp. 585–600. [Google Scholar]
  57. Righetti, D.; Vogt, M.; Gruber, N.; Psomas, A.; Zimmermann, N.E. Global pattern of phytoplankton diversity driven by temperature and environmental variability. Sci. Adv. 2019, 5, eaau6253. [Google Scholar] [CrossRef]
  58. Dai, A. Increasing drought under global warming in observations and models. Nat. Clim. Chang. 2013, 3, 52–58. [Google Scholar] [CrossRef]
  59. Trenberth, K.E.; Dai, A.G.; van der Schrier, G.; Jones, P.D.; Barichivich, J.; Briffa, K.R.; Sheffield, J. Global warming and changes in drought. Nat. Clim. Chang. 2014, 4, 17–22. [Google Scholar] [CrossRef]
  60. Rowe, A.K.; Rutledge, S.A.; Lang, T.J.; Ciesielski, P.E.; Saleeby, S.M. Elevation-dependent trends in precipitation observed during NAME. Mon. Weather Rev. 2008, 136, 4962–4979. [Google Scholar] [CrossRef]
  61. Dimri, A.P.; Palazzi, E.; Daloz, A.S. Elevation dependent precipitation and temperature changes over Indian Himalayan region. Clim. Dyn. 2022, 59, 1–21. [Google Scholar] [CrossRef]
  62. Cheng, H.; Sinha, A.; Cruz, F.W.; Wang, X.; Edwards, R.L.; D’horta, F.M.; Ribas, C.C.; Vuille, M.; Stott, L.D.; Auler, A.S. Climate change patterns in Amazonia and biodiversity. Nat. Commun. 2013, 4, 1411. [Google Scholar] [CrossRef]
  63. Atkinson, S.T.; Cale, D.; Pinder, A.; Chambers, J.M.; Halse, S.A.; Robson, B.J. Substantial long-term loss of alpha and gamma diversity of lake invertebrates in a landscape exposed to a drying climate. Glob. Chang. Biol. 2021, 27, 6263–6279. [Google Scholar] [CrossRef]
  64. Xu, L.; Myneni, R.B.; Chapin III, F.S.; Callaghan, T.V.; Pinzon, J.E.; Tucker, C.J.; Zhu, Z.; Bi, J.; Ciais, P.; Tømmervik, H.; et al. Temperature and vegetation seasonality diminishment over northern lands. Nat. Clim. Chang. 2013, 3, 581–586. [Google Scholar] [CrossRef]
  65. Wang, M.; Li, P.; Peng, C.H.; Xiao, J.F.; Zhou, X.L.; Luo, Y.P.; Zhang, C.C. Divergent responses of autumn vegetation phenology to climate extremes over northern middle and high latitudes. Glob. Ecol. Biogeogr. 2022, 31, 2281–2296. [Google Scholar] [CrossRef]
  66. Berdanier, A.B.; Klein, J.A. Growing season length and soil moisture interactively constrain high elevation aboveground net primary production. Ecosystems 2011, 14, 963–974. [Google Scholar] [CrossRef]
  67. Gugger, S.; Kesselring, H.; Stöcklin, J.; Hamann, E. Lower plasticity exhibited by high- versus mid-elevation species in their phenological responses to manipulated temperature and drought. Ann. Bot. 2015, 116, 953–962. [Google Scholar] [CrossRef]
Figure 1. Spatial distribution of the natural reserves analyzed. The three values within each parentheses beside the reserve denote the number of trees, species, and plots. The forest cover data were obtained from the land cover datasets of MOD12Q1 (Friedl et al., 2019 [41]).
Sustainability 16 08378 g001
Figure 2. The average tree species diversity index (DI) and aboveground biomass (AGB) of all plots for each reserves analyzed. The upper and lower parts of the error bar denote +1 standard error and −1 standard error, respectively.
Sustainability 16 08378 g002
Figure 3. The relationship between tree species diversity index (DI) and aboveground biomass (AGB) for each of the natural reserves analyzed, including Changbai Mountains Natural Reserve (a), Honghuaerji Natural Reserve (b) and Shengshan Natural Reserve (c). Solid and dashed lines denote that the linear relationships between DI and AGB were statistically significant and insignificant at the level of 5%, respectively.
Sustainability 16 08378 g003
Figure 4. The correlations of tree species diversity index (DI) with its influencing factors for each of the natural reserves analyzed, including Changbai Mountains Natural Reserve (a), Honghuaerji Natural Reserve (b) and Shengshan Natural Reserve (c). The dashed horizontal line denotes the correlation reaching statistical significance at the level of 10%.
Sustainability 16 08378 g004
Figure 5. The correlations of aboveground biomass (AGB) with its influencing factors for each of the natural reserves analyzed, including Changbai Mountains Natural Reserve (a), Honghuaerji Natural Reserve (b) and Shengshan Natural Reserve (c). The dashed horizontal line denotes the correlation reaching statistical significance at the level of 10%.
Sustainability 16 08378 g005
Figure 6. The scatter diagram showing variations of tree species diversity index (DI) and aboveground biomass (AGB) with increasing AGE for each of the natural reserves analyzed, including Changbai Mountains Natural Reserve (a), Honghuaerji Natural Reserve (b) and Shengshan Natural Reserve (c). Solid and dashed lines denote that the linear relationships between DI and AGB were statistically significant and insignificant at the level of 5%, respectively.
Sustainability 16 08378 g006
Table 1. The relationships of tree species diversity index (DI) and aboveground biomass (AGB) with factors in the Changbai Mountains Natural Reserve.
Linear Regression EquationRFp
DI = 0.016LN(ELE) + 0.37CLI_PC1 + 0.03SOI_PC1 + 0.76LN(AGE) − 2.06
                        (0.98)               (0.042)              (0.52)           (0.004)          (0.65)
0.6924.74<0.001
LN(AGB) = 0.43LN(ELE) + 0.28CLI_PC1 + 0.009SOI_PC1 + 2.23LN(AGE) − 3.93
                                 (0.49)                 (0.10)                (0.83)            (<0.001)        (0.34)
0.7535.22<0.001
LN(ELE) and LN(AGE) denote the natural logarithms of elevation and stand age, respectively; CLI_PC1 and SOI_PC1 denote the scores of the first principal components for heat-related climate and soil aspects, respectively.
Table 2. The relationships of tree species diversity index (DI) and aboveground biomass (AGB) with factors in the Hoghuaerji Natural Reserve.
Linear Regression EquationRFp
DI = −16.13LN(ELE) − 0.51CLI_PC1 + 0.091SOI_PC1 − 0.28LN(AGE) + 110.053
                        (0.49)                (0.35)                (0.35)                   (0.44)           (0.48)
0.611.880.17
LN(AGB) = 97.94LN(ELE) + 2.40CLI_PC1 − 0.27SOI_PC1 + 1.94LN(AGE) − 657.71
                              (0.054)                 (0.044)                (0.184)             (0.021)        (0.053)
0.816.180.005
LN(ELE) and LN(AGE) denote the natural logarithms of elevation and stand age, respectively; CLI_PC1 and SOI_PC1 denote the scores of the first principal components for climate and soil aspects, respectively.
Table 3. The relationships of tree species diversity index (DI) and aboveground biomass (AGB) with factors in the Shengshan Natural Reserve.
Linear Regression EquationRFp
DI = 110.35LN(LAT) − 0.002CLI_PC1 + 0.92LN(AGE) − 433.37
                   (0.25)                    (0.99)                  (0.013)        (0.25)
0.372.450.076
LN(AGB) = 12.40LN(LAT) − 0.18CLI_PC1 + 1.42LN(AGE) − 45.83
                             (0.95)                  (0.42)                (0.064)         (0.95)
0.433.380.026
LN(LAT) and LN(AGE) denote the natural logarithms of latitude and stand age, respectively; CLI_PC1 denotes the score of the first principal component for climate aspect.
Disclaimer/Publisher’s Note: The statements, opinions and data contained in all publications are solely those of the individual author(s) and contributor(s) and not of MDPI and/or the editor(s). MDPI and/or the editor(s) disclaim responsibility for any injury to people or property resulting from any ideas, methods, instructions or products referred to in the content.

