
Comparative Analysis of Carbon Emissions from Filled Embankment and Excavated Graben Schemes of Railway Subgrade Engineering

Abstract
1. Introduction
2. Materials and Methods
2.1. Life Cycle Assessment Theory
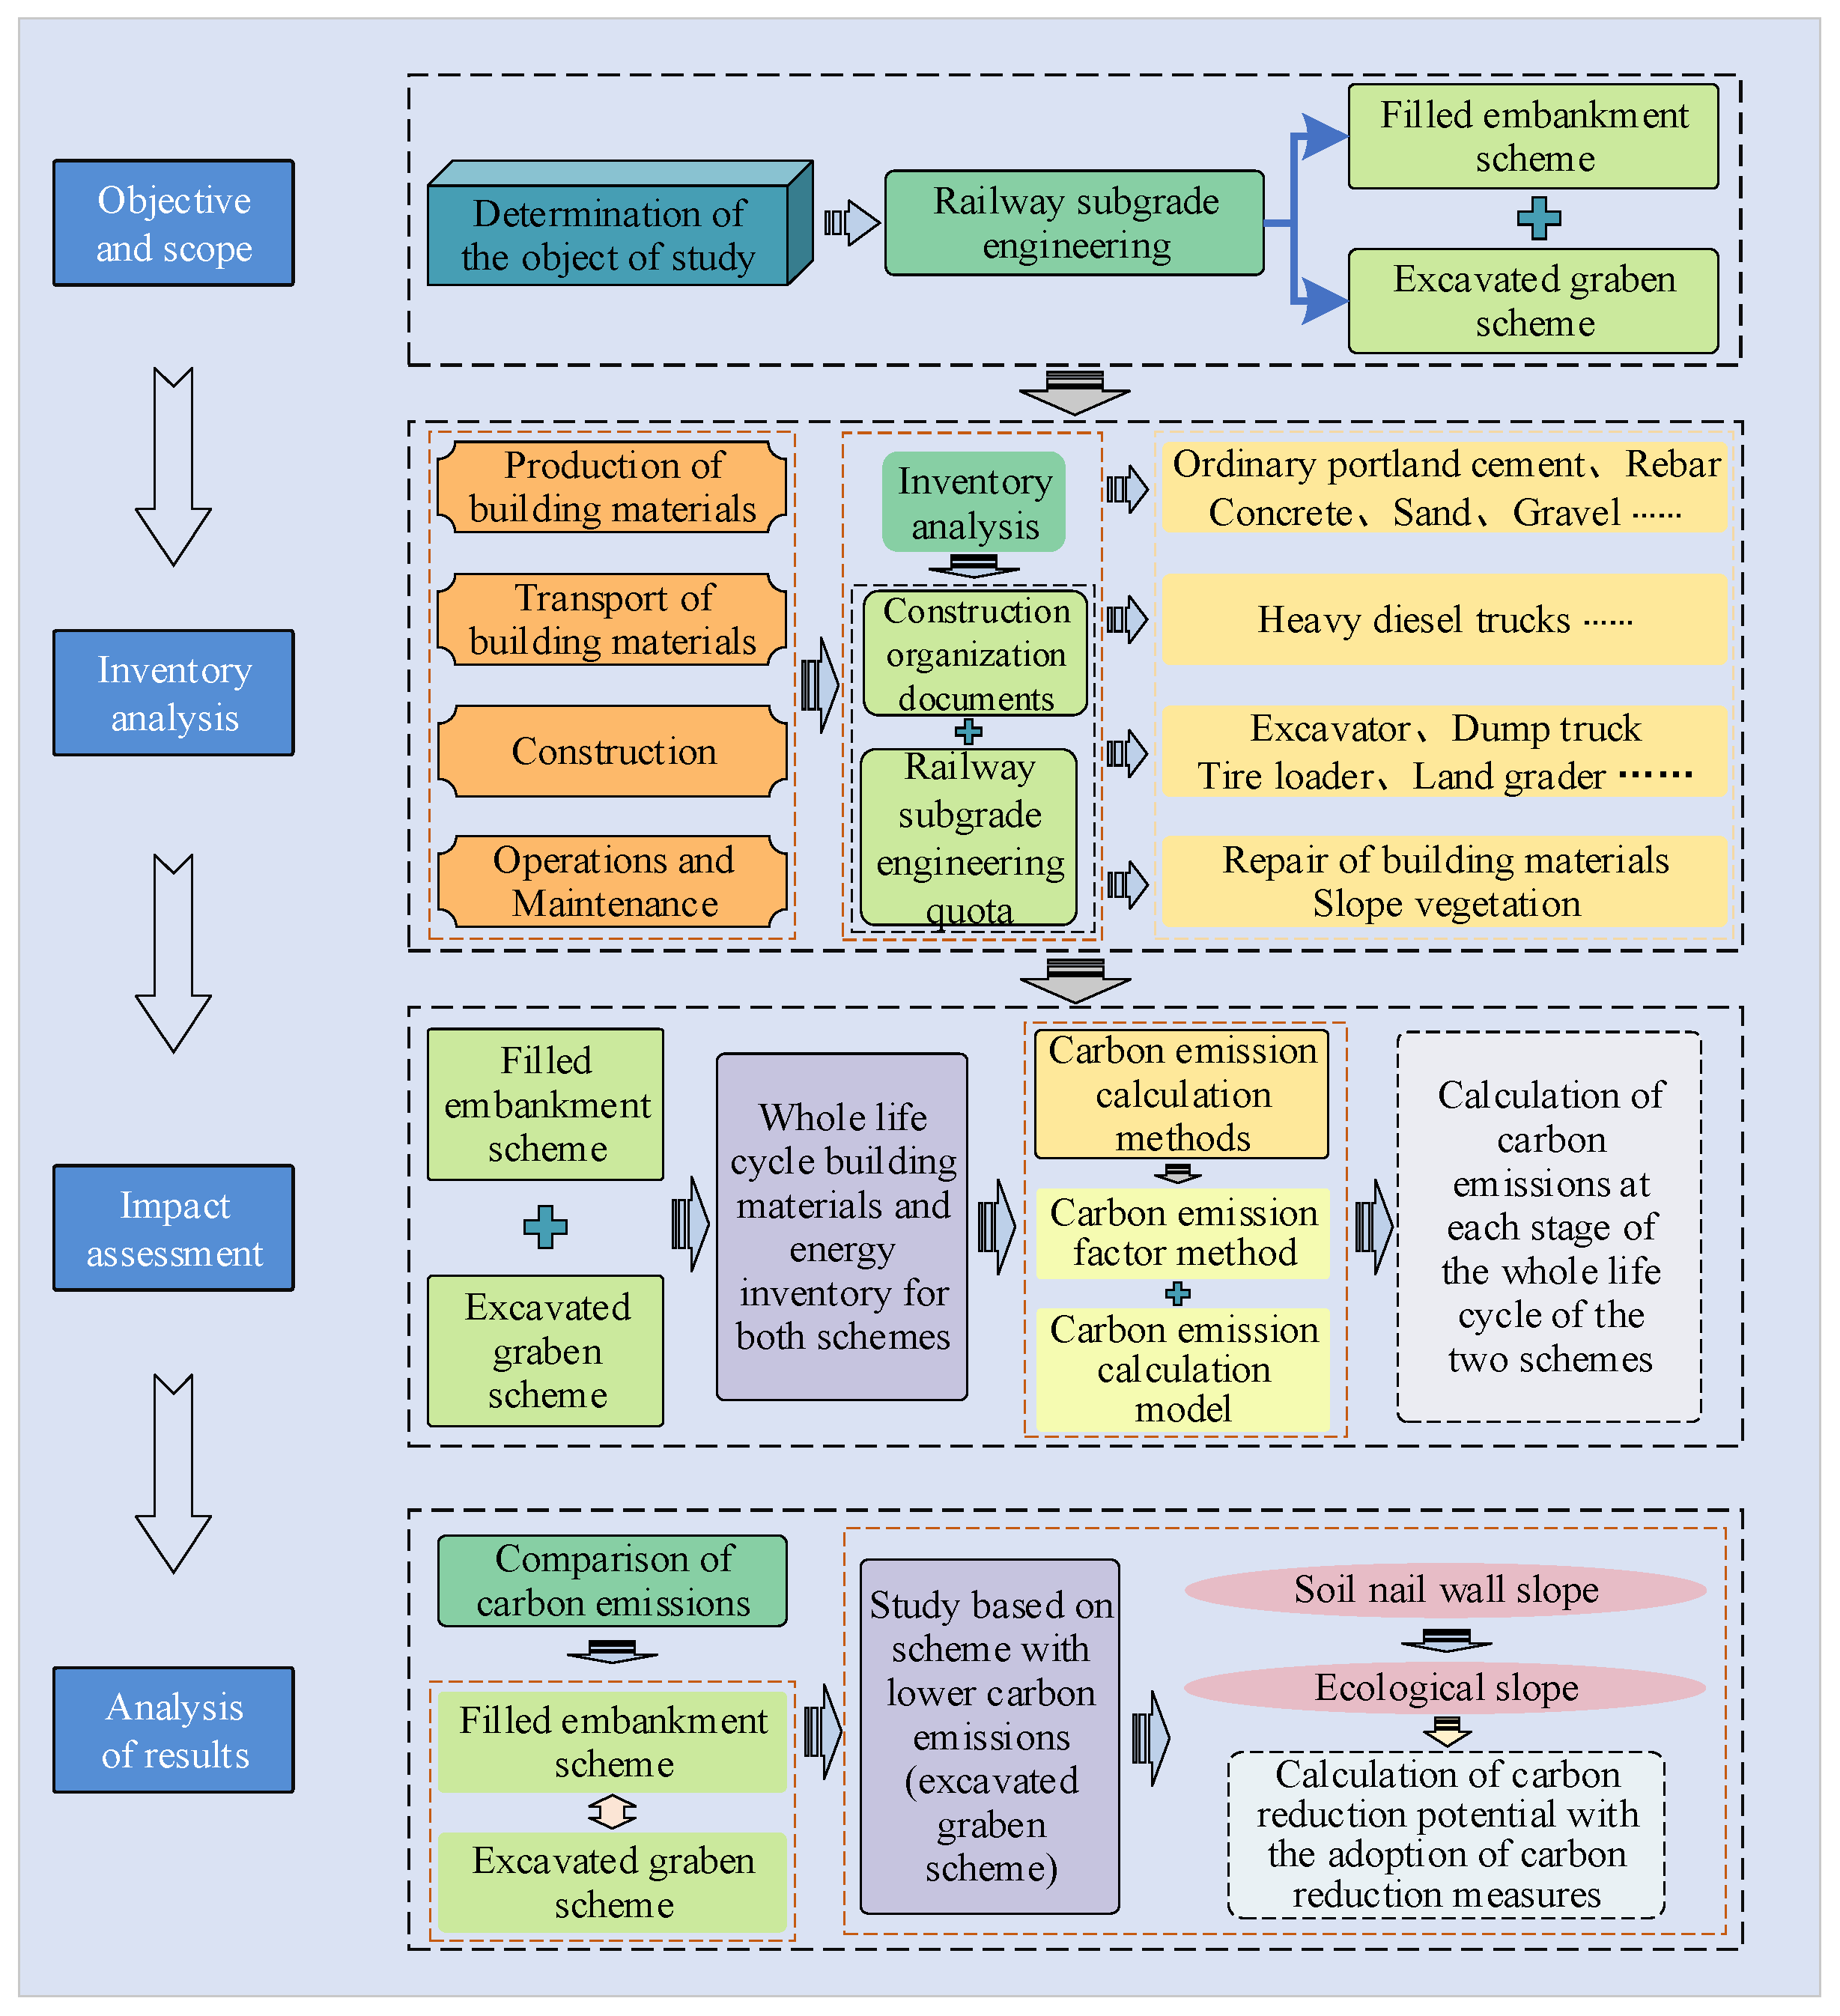
2.2. Boundary for Carbon Emissions from Railway Subgrade Engineering
2.3. Methods for Calculating Carbon Emissions from Railway Subgrade Engineering
2.3.1. Carbon Emission Factor Method
- Determine the accounting boundary: define the scope for carbon emission accounting for the railway subgrade filled embankment scheme and excavated graben scheme, including the production of building materials, transportation of building materials, construction, and operation and maintenance stages.
- Collect activity data: at the building material production and building material transportation stages, it is necessary to collect data on building material consumption and building material transportation distance according to the documents of the railway subgrade engineering organization; at the construction stage, it is necessary to collect data on energy consumption by construction machinery; at the operation and maintenance stage, it is necessary to collect data on building material consumption and energy consumption by maintenance machinery.
- Determine the carbon emission factor: According to the type and characteristics of activity data, determine the corresponding carbon emission factor. This paper synthesizes the relevant literature and the “Building construction carbon emission calculation standard” and sorts out the main building materials and energy carbon emission factors involved in the full life cycle of the railway subgrade filled embankment scheme and excavated graben scheme, as indicated in Table 1.
- Calculate the carbon emissions: Multiply the activity data with the carbon emission factor to calculate the carbon emissions of each stage of the railway subgrade engineering scheme. Then, summarize the carbon emissions of each stage to get the total carbon emissions for the whole life cycle of the railway subgrade engineering scheme.
2.3.2. Carbon Emission Calculation Model
- (1)
- Building materials production stage:
- (2)
- Building material transportation stage:
- (3)
- Construction stage:
- (4)
- Operation and maintenance stage:
3. Case Study
3.1. Project Overview
3.2. Measurement of Carbon Emissions
- (1)
- Carbon emission in the building material production stage
- (2)
- Carbon emissions in the building material transportation stage
- (3)
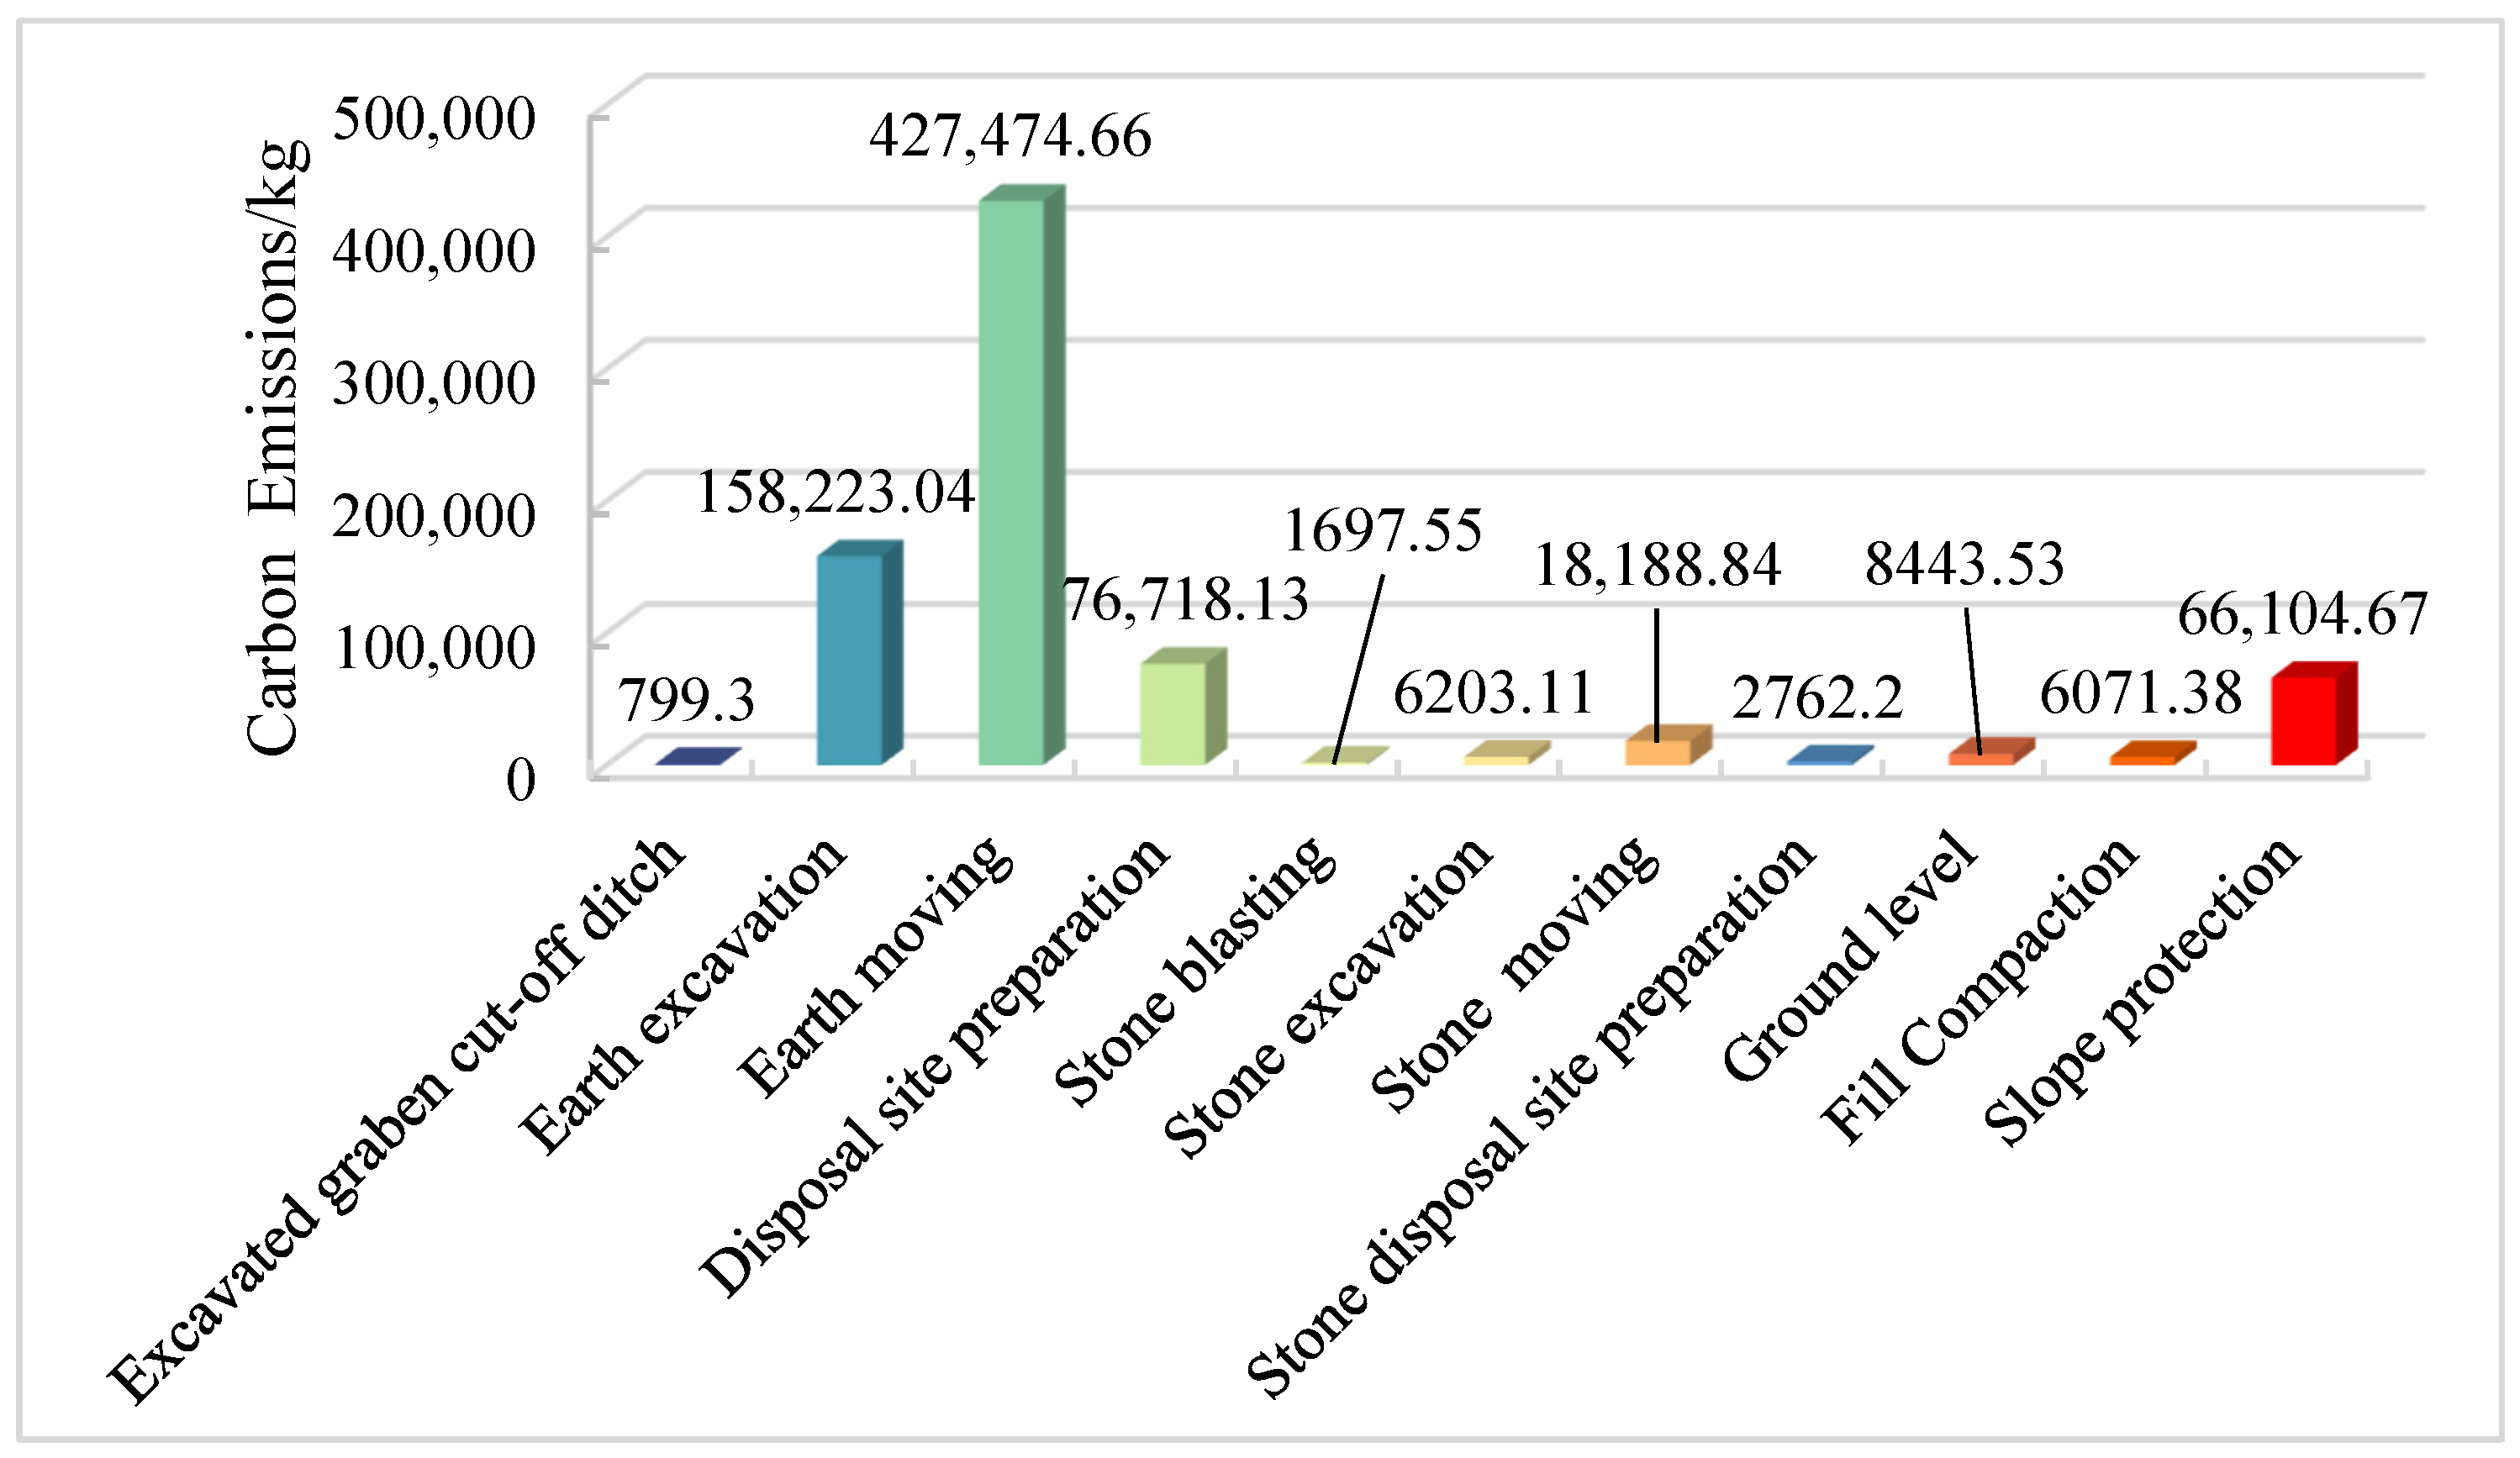
- Carbon emissions in the construction stage
- (4)
- Carbon emissions in the operation and maintenance stage
- (5)
- Whole life cycle carbon emissions
3.3. Sensitivity Analysis
3.3.1. Sensitivity Analysis of Carbon Emission Factors
3.3.2. Sensitivity Analysis of the Transportation Distance of Building Materials
3.3.3. Analysis of Results
4. Research on Carbon Reduction Measures
4.1. Carbon Reduction in the Ecological Slope
4.1.1. Computation of Changes in Carbon Emissions
- (1)
- Change in carbon emissions in the building material production stage
- (2)
- Change in carbon emissions during the building material transportation stage
- (3)
- Changes in carbon emissions in the construction stage
- (4)
- Changes in carbon emissions during the operation and maintenance stage
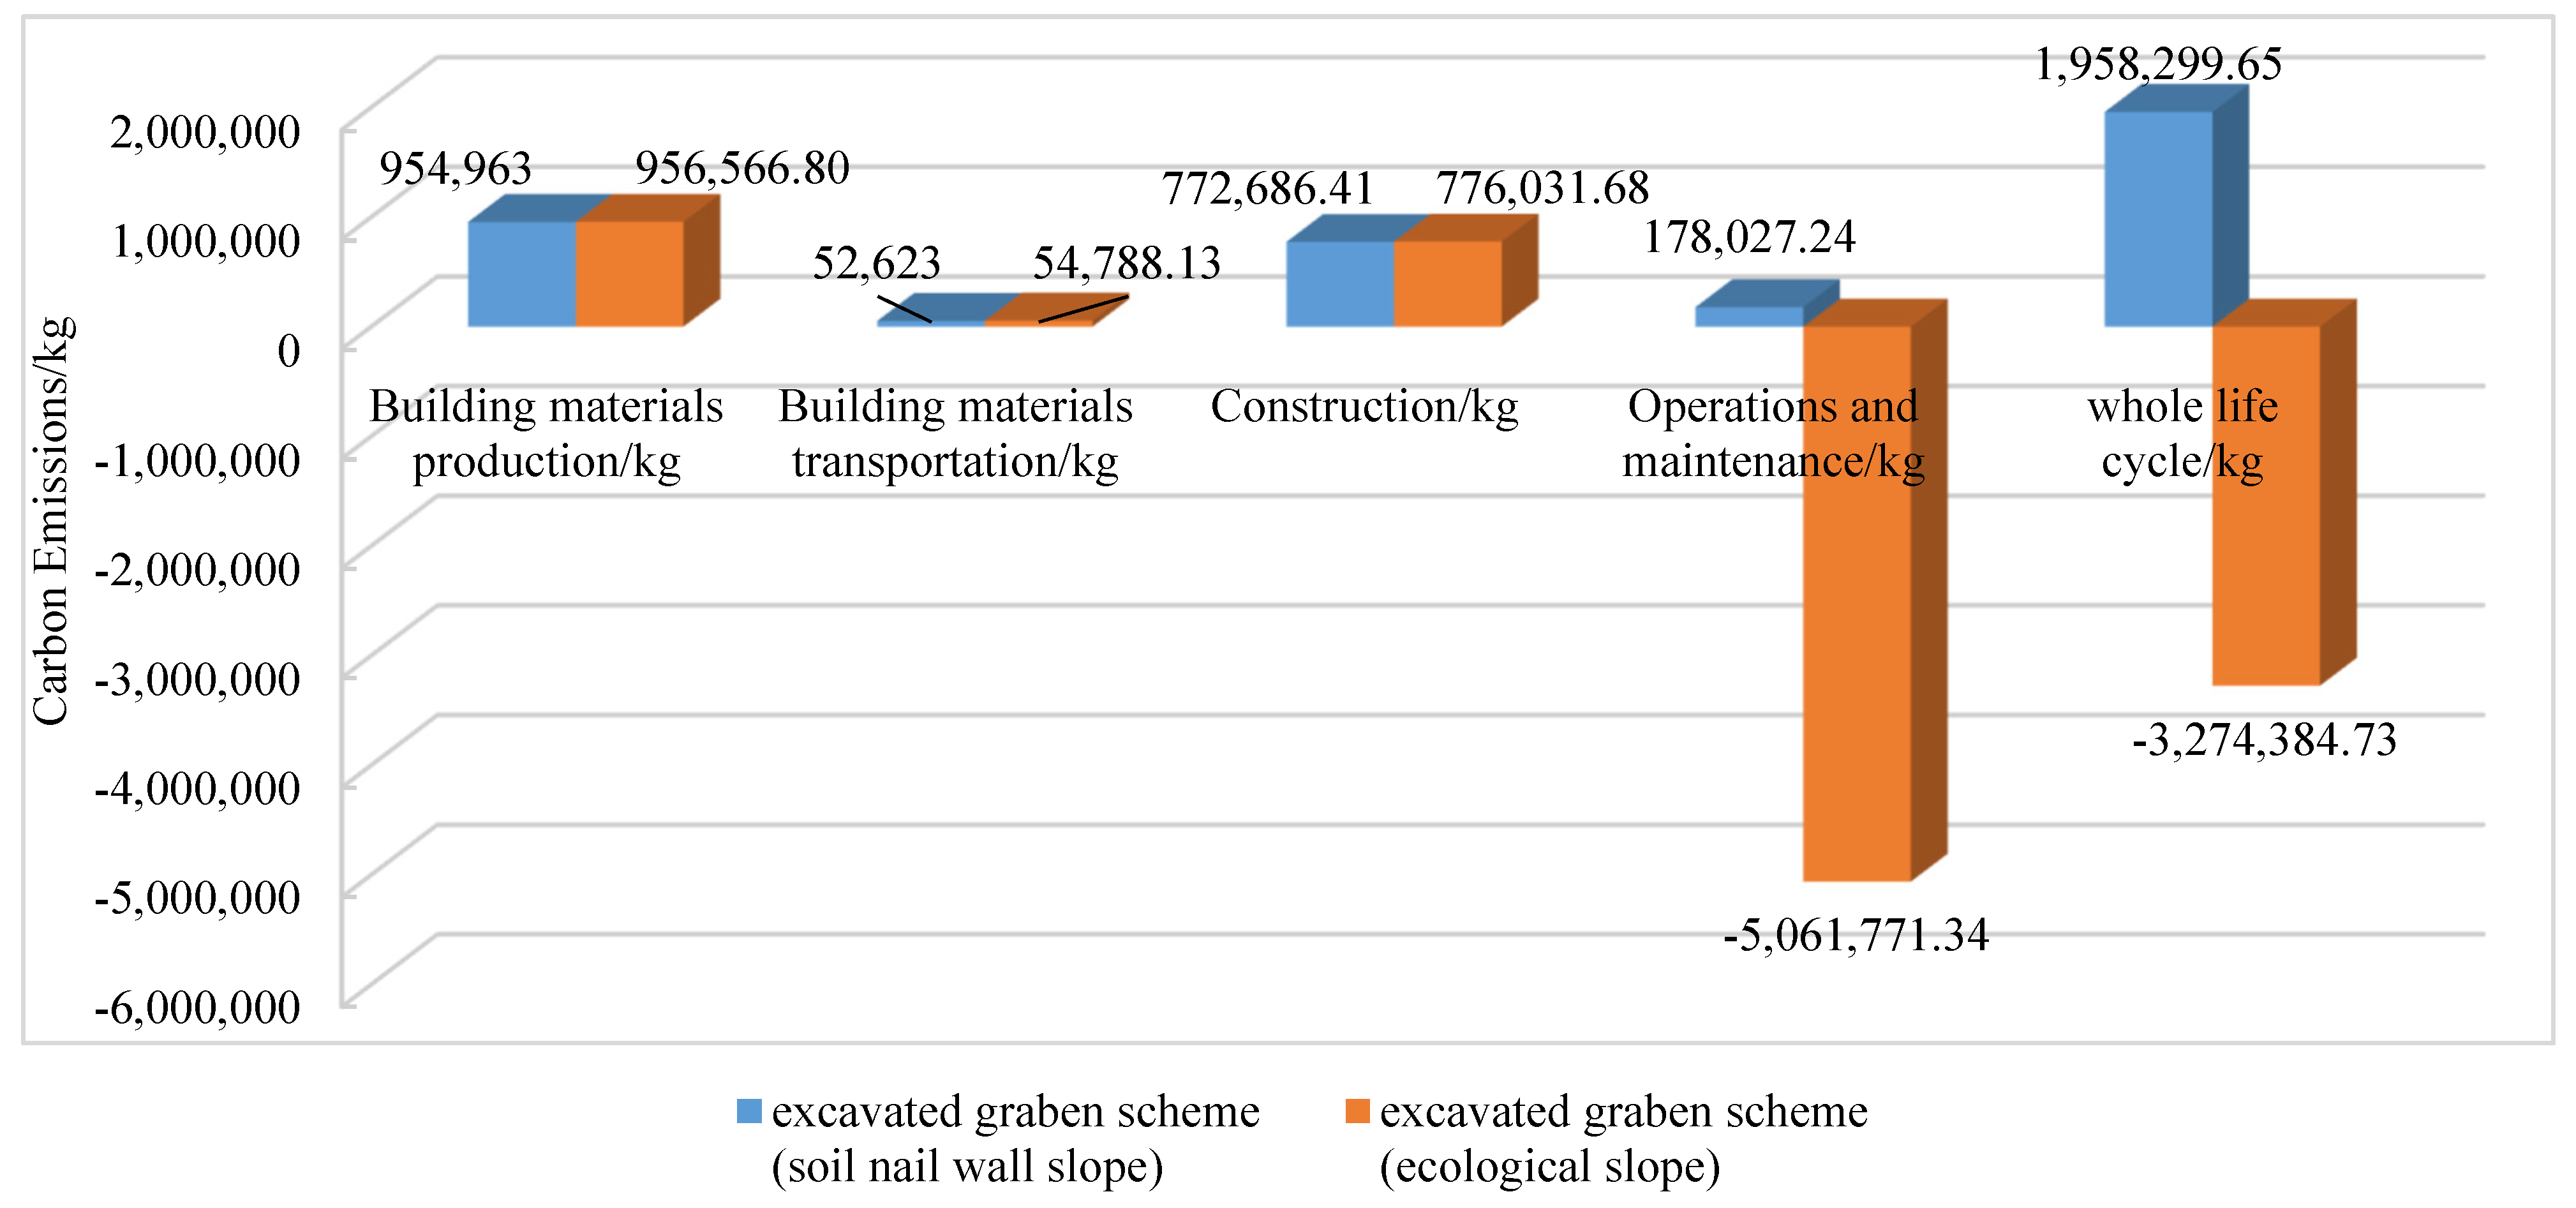
4.1.2. Carbon Emissions from the Ecological Slope of the Excavated Graben Scheme
4.1.3. “Carbon Reduction—Economic” Benefit Analysis
4.2. Combined Effects of “Slope Gradient–Vegetation Selection” on Carbon Emissions of Ecological Slope
5. Discussion
5.1. Impacts and Challenges of Adopting Ecological Slopes for Railway Subgrade Engineering
5.1.1. Contribution to Carbon-Neutral Targets
5.1.2. The Challenges Ahead
5.2. Research Significance
5.2.1. Theoretical Significance
5.2.2. Practical Significance
5.3. Future Research Directions
6. Conclusions
Author Contributions
Funding
Institutional Review Board Statement
Informed Consent Statement
Data Availability Statement
Conflicts of Interest
References
- Andrade, C.E.S.D.; D’Agosto, M.D.A. Energy Use and Carbon Dioxide Emissions Assessment in the Lifecycle of Passenger Rail Systems: The Case of the Rio de Janeiro Metro. J. Clean. Prod. 2016, 126, 526–536. [Google Scholar] [CrossRef]
- Lou, H.; Shi, X.; Ren, X.; Yang, S.; Cai, M.; Pan, Z.; Zhu, Y.; Feng, D.; Zhou, B. Limited Terrestrial Carbon Sinks and Increasing Carbon Emissions from the Hu Line Spatial Pattern Perspective in China. Ecol. Indic. 2024, 162, 112035. [Google Scholar] [CrossRef]
- D’Acierno, L.; Botte, M. A Passenger-Oriented Optimization Model for Implementing Energy-Saving Strategies in Railway Contexts. Energies 2018, 11, 2946. [Google Scholar] [CrossRef]
- Bueno, G.; Hoyos, D.; Capellán-Pérez, I. Evaluating the Environmental Performance of the High Speed Rail Project in the Basque Country, Spain. Res. Transp. Econ. 2017, 62, 44–56. [Google Scholar] [CrossRef]
- Liu, X.; Schraven, D.; De Bruijne, M.; De Jong, M.; Hertogh, M. Navigating Transitions for Sustainable Infrastructures—The Case of a New High-Speed Railway Station in Jingmen, China. Sustainability 2019, 11, 4197. [Google Scholar] [CrossRef]
- Åkerman, J. The Role of High-Speed Rail in Mitigating Climate Change—The Swedish Case Europabanan from a Life Cycle Perspective. Transp. Res. Part D Transp. Environ. 2011, 16, 208–217. [Google Scholar] [CrossRef]
- Hu, X.; Zhang, X.; Dong, L.; Li, H.; He, Z.; Chen, H. Carbon Emission Factors Identification and Measurement Model Construction for Railway Construction Projects. Int. J. Environ. Res. Public Health 2022, 19, 11379. [Google Scholar] [CrossRef]
- Lee, C.K.; Kim, J.S. A Research on the Greenhouse Gas Emission Reduction of Railway Structure Construction Stage. J. Korean Soc. Railw. 2011, 14, 425–432. [Google Scholar] [CrossRef]
- Najafpour Navaei, T.; Blainey, S.; Preston, J.; Powrie, W. Carbon Footprinting of Railway Infrastructure: A Standardized, Consistent Data Collection Method. Carbon Manag. 2024, 15, 2368839. [Google Scholar] [CrossRef]
- Wang, Y.-Z.; Zhou, S.; Ou, X.-M. Development and Application of a Life Cycle Energy Consumption and CO2 Emissions Analysis Model for High-Speed Railway Transport in China. Adv. Clim. Chang. Res. 2021, 12, 270–280. [Google Scholar] [CrossRef]
- Lin, J.; Li, H.; Huang, W.; Xu, W.; Cheng, S. A Carbon Footprint of High-Speed Railways in China: A Case Study of the Beijing-Shanghai Line. J. Ind. Ecol. 2019, 23, 869–878. [Google Scholar] [CrossRef]
- Kaewunruen, S.; Sresakoolchai, J.; Peng, J. Life Cycle Cost, Energy and Carbon Assessments of Beijing-Shanghai High-Speed Railway. Sustainability 2019, 12, 206. [Google Scholar] [CrossRef]
- Cheng, S.; Lin, J.; Xu, W.; Yang, D.; Liu, J.; Li, H. Carbon, Water, Land and Material Footprints of China’s High-Speed Railway Construction. Transp. Res. Part D Transp. Environ. 2020, 82, 102314. [Google Scholar] [CrossRef]
- Lin, J.; Cheng, S.; Li, H.; Yang, D.; Lin, T. Environmental Footprints of High-Speed Railway Construction in China: A Case Study of the Beijing–Tianjin Line. Int. J. Environ. Res. Public Health 2019, 17, 105. [Google Scholar] [CrossRef]
- Chang, Y.; Lei, S.; Teng, J.; Zhang, J.; Zhang, L.; Xu, X. The Energy Use and Environmental Emissions of High-Speed Rail Transportation in China: A Bottom-up Modeling. Energy 2019, 182, 1193–1201. [Google Scholar] [CrossRef]
- Chang, B.; Kendall, A. Life Cycle Greenhouse Gas Assessment of Infrastructure Construction for California’s High-Speed Rail System. Transp. Res. Part D Transp. Environ. 2011, 16, 429–434. [Google Scholar] [CrossRef]
- Lee, J.-Y.; Lee, C.-K.; Chun, Y.-Y. Greenhouse Gas Emissions from High-Speed Rail Infrastructure Construction in Korea. Transp. Res. Part D Transp. Environ. 2020, 87, 102514. [Google Scholar] [CrossRef]
- Liu, M.; Jia, S.; Li, P.; Liu, X.; Zhang, Y. Predicting GHG Emissions from Subway Lines in the Planning Stage on a City Level. J. Clean. Prod. 2020, 259, 120823. [Google Scholar] [CrossRef]
- Li, Y.; He, Q.; Luo, X.; Zhang, Y.; Dong, L. Calculation of Life-Cycle Greenhouse Gas Emissions of Urban Rail Transit Systems: A Case Study of Shanghai Metro. Resour. Conserv. Recycl. 2018, 128, 451–457. [Google Scholar] [CrossRef]
- Liu, M.; Jia, S.; He, X. A Quota-Based GHG Emissions Quantification Model for the Construction of Subway Stations in China. J. Clean. Prod. 2018, 198, 847–858. [Google Scholar] [CrossRef]
- Liu, M.; Jia, S.; Liu, X. Evaluation of Mitigation Potential of GHG Emissions from the Construction of Prefabricated Subway Station. J. Clean. Prod. 2019, 236, 117700. [Google Scholar] [CrossRef]
- Jia, S.; Liu, M. Embodied GHG Emissions of High Speed Rail Stations: Quantification, Data-Driven Prediction and Cost-Benefit Analysis. J. Clean. Prod. 2022, 366, 133006. [Google Scholar] [CrossRef]
- Wu, N.; Zhang, J.; Li, X.; Wang, X.; Liu, C.; Yang, K.; Kuang, D.; Feng, K. Carbon Emissions Assessment Study of Standard Ring Materialization Stage of Assembled Subway Stations. In Proceedings of the ICCREM 2022, Virtual Conference, 15 December 2022; American Society of Civil Engineers: Reston, VA, USA, 2022; pp. 193–203. [Google Scholar]
- Wang, N.; Satola, D.; Houlihan Wiberg, A.; Liu, C.; Gustavsen, A. Reduction Strategies for Greenhouse Gas Emissions from High-Speed Railway Station Buildings in a Cold Climate Zone of China. Sustainability 2020, 12, 1704. [Google Scholar] [CrossRef]
- Kaewunruen, S.; Sresakoolchai, J.; Yu, S. Global Warming Potentials Due to Railway Tunnel Construction and Maintenance. Appl. Sci. 2020, 10, 6459. [Google Scholar] [CrossRef]
- Wu, H.; Yang, K.; Chen, K.; Zhou, W.; Yu, T.; Wang, K. GHG Emission Quantification and Reduction Pathway of Subway Shield Tunnel Engineering: A Case Study on Guangzhou Metro, China. Environ. Sci. Pollut. Res. 2024, 31, 54768–54784. [Google Scholar] [CrossRef]
- Chen, G.; Li, W.; Yang, F.; Cao, T.; Wu, Z.; Lu, Y.; Wu, C. Study on Resourceful Treatment and Carbon Reduction Intensity of Metro Shield Slag: An Example of a Tunnel Interval of Shenzhen Line 13. Buildings 2023, 13, 2816. [Google Scholar] [CrossRef]
- Pritchard, J.A.; Preston, J. Understanding the Contribution of Tunnels to the Overall Energy Consumption of and Carbon Emissions from a Railway. Transp. Res. Part D Transp. Environ. 2018, 65, 551–563. [Google Scholar] [CrossRef]
- Ortega, A.; Blainey, S.; Preston, J. Assessing Whole-Life Carbon Footprint of Under Sleeper Pad Installation for Ballasted Track. J. Transp. Eng. Part A Syst. 2018, 144, 04018073. [Google Scholar] [CrossRef]
- Li, X.; Xie, W.; Xu, L.; Li, L.; Jim, C.Y.; Wei, T. Holistic Life-Cycle Accounting of Carbon Emissions of Prefabricated Buildings Using LCA and BIM. Energy Build. 2022, 266, 112136. [Google Scholar] [CrossRef]
- Li, J.; Li, S.; Wu, F. Research on Carbon Emission Reduction Benefit of Wind Power Project Based on Life Cycle Assessment Theory. Renew. Energy 2020, 155, 456–468. [Google Scholar] [CrossRef]
- Wu, H.; Zhou, W.; Chen, K.; Zhang, L.; Zhang, Z.; Li, Y.; Hu, Z. Carbon Emissions Assessment for Building Decoration Based on Life Cycle Assessment: A Case Study of Office Buildings. Sustainability 2023, 15, 14055. [Google Scholar] [CrossRef]
- Zhang, Y.; Yan, D.; Hu, S.; Guo, S. Modelling of Energy Consumption and Carbon Emission from the Building Construction Sector in China, a Process-Based LCA Approach. Energy Policy 2019, 134, 110949. [Google Scholar] [CrossRef]
- Liu, W.; Huang, Q. Research on Carbon Footprint Accounting in the Materialization Stage of Prefabricated Housing Based on DEMATEL-ISM-MICMAC. Appl. Sci. 2023, 13, 13148. [Google Scholar] [CrossRef]
- Zhan, Z.; Xia, P.; Xia, D. Study on Carbon Emission Measurement and Influencing Factors for Prefabricated Buildings at the Materialization Stage Based on LCA. Sustainability 2023, 15, 13648. [Google Scholar] [CrossRef]
- Luo, X.; Ren, M.; Zhao, J.; Wang, Z.; Ge, J.; Gao, W. Life Cycle Assessment for Carbon Emission Impact Analysis for the Renovation of Old Residential Areas. J. Clean. Prod. 2022, 367, 132930. [Google Scholar] [CrossRef]
- Li, X.; Wang, C.; Kassem, M.A.; Wu, S.-Y.; Wei, T.-B. Case Study on Carbon Footprint Life-Cycle Assessment for Construction Delivery Stage in China. Sustainability 2022, 14, 5180. [Google Scholar] [CrossRef]
- Hosseinian, S.M.; Faghani, M. Assessing the Effect of Structural Parameters and Building Site in Achieving Low Carbon Building Materialization Using a Life-Cycle Assessment Approach. J. Build. Eng. 2021, 44, 103318. [Google Scholar] [CrossRef]
- Zhang, X.; Xu, J.; Zhang, X.; Li, Y. Life Cycle Carbon Emission Reduction Potential of a New Steel-Bamboo Composite Frame Structure for Residential Houses. J. Build. Eng. 2021, 39, 102295. [Google Scholar] [CrossRef]
- Cao, J.; Zhu, Y.; Zhang, J.; Wang, H.; Zhu, H. The Sustainability Study and Exploration in the Building Commercial Complex System Based on Life Cycle Assessment (LCA)–Emergy–Carbon Emission Analysis. Processes 2023, 11, 1989. [Google Scholar] [CrossRef]
- Liu, K.; Leng, J. Quantitative Research on Embodied Carbon Emissions in the Design Stage: A Case Study from an Educational Building in China. J. Asian Archit. Build. Eng. 2022, 21, 1182–1192. [Google Scholar] [CrossRef]
- Raja, J.; Dixon, N.; Fowmes, G.; Frost, M.; Assinder, P. Obtaining Reliable Embodied Carbon Values for Geosynthetics. Geosynth. Int. 2015, 22, 393–401. [Google Scholar] [CrossRef]
- Zhou, F.; Ning, Y.; Guo, X.; Guo, S. Analyze Differences in Carbon Emissions from Traditional and Prefabricated Buildings Combining the Life Cycle. Buildings 2023, 13, 874. [Google Scholar] [CrossRef]
- Han, Q.; Chang, J.; Liu, G.; Zhang, H. The Carbon Emission Assessment of a Building with Different Prefabrication Rates in the Construction Stage. Int. J. Environ. Res. Public Health 2022, 19, 2366. [Google Scholar] [CrossRef]
- Yang, H.; Kikuta, K.; Hayashi, M. Research on the Whole Lifecycle Emission Reduction Effect of Buildings with Different Structures in Severely Cold Regions—A Case Study in China. Energies 2023, 16, 5285. [Google Scholar] [CrossRef]
- TZJ 2000-2017; Railway Engineering Budget Quota—Railway Subgrade Engineering. Chinese Standard: Beijing, China, 2017.
- TZJ 3004-2017; Railway Engineering Construction Machinery Bench Cost Quota. Chinese Standard: Beijing, China, 2017.
- Yang, X.; Liu, Y.; Liu, K.; Wei, J.; Hu, G.; Pei, S. Application and Configuration Analysis of Electric Muck Transfer Equipment in Plateau Railway Tunnel: A Case Study in Southwest China. Sci. Rep. 2024, 14, 7222. [Google Scholar] [CrossRef]
- Rungskunroch, P.; Shen, Z.-J.; Kaewunruen, S. Getting It Right on the Policy Prioritization for Rail Decarbonization: Evidence From Whole-Life CO2e Emissions of Railway Systems. Front. Built Environ. 2021, 7, 638507. [Google Scholar] [CrossRef]
- Zhang, X.; Zhang, X. Comparison and Sensitivity Analysis of Embodied Carbon Emissions and Costs Associated with Rural House Construction in China to Identify Sustainable Structural Forms. J. Clean. Prod. 2021, 293, 126190. [Google Scholar] [CrossRef]
- Voit, K.; Kuschel, E. Rock Material Recycling in Tunnel Engineering. Appl. Sci. 2020, 10, 2722. [Google Scholar] [CrossRef]
- Tawk, M.; Qi, Y.; Indraratna, B.; Rujikiatkamjorn, C.; Heitor, A. Behavior of a Mixture of Coal Wash and Rubber Crumbs under Cyclic Loading. J. Mater. Civ. Eng. 2021, 33, 04021054. [Google Scholar] [CrossRef]
- Vukićević, M.; Popović, Z.; Despotović, J.; Lazarević, L. Fly Ash and Slag Utilization for the Serbian Railway Substructure. Transport 2016, 33, 389–398. [Google Scholar] [CrossRef]
- Xu, P.; Zhu, J.; Li, H.; Xiong, Z.; Xu, X. Coupling Analysis between Cost and Carbon Emission of Bamboo Building Materials: A Perspective of Supply Chain. Energy Build. 2023, 280, 112718. [Google Scholar] [CrossRef]
- De Bortoli, A.; Agez, M. Environmentally-Extended Input-Output Analyses Efficiently Sketch Large-Scale Environmental Transition Plans: Illustration by Canada’s Road Industry. J. Clean. Prod. 2023, 388, 136039. [Google Scholar] [CrossRef]
- Fu, S.; Li, Z.; Lin, T.; Chen, Q.; Ren, H. A Positive Flow Control System for Electric Excavators Based on Variable Speed Control. Appl. Sci. 2020, 10, 4826. [Google Scholar] [CrossRef]
- Lin, T.; Lin, Y.; Ren, H.; Chen, H.; Chen, Q.; Li, Z. Development and Key Technologies of Pure Electric Construction Machinery. Renew. Sustain. Energy Rev. 2020, 132, 110080. [Google Scholar] [CrossRef]
- Trinh, H.-A.; Truong, H.V.A.; Do, T.C.; Nguyen, M.H.; Phan, V.D.; Ahn, K.K. Optimization-Based Energy Management Strategies for Hybrid Construction Machinery: A Review. Energy Rep. 2022, 8, 6035–6057. [Google Scholar] [CrossRef]
- Blair, J.; Roldan, C.; Ghosh, S.; Yung, S.-H. Greening Rail Infrastructure for Carbon Benefits. Procedia Eng. 2017, 180, 1716–1724. [Google Scholar] [CrossRef]


| Stage | Type | Carbon Emission Factors | Unit |
|---|---|---|---|
| Building material production | Ordinary portland cement [35] | 0.735 | tCO2e/t |
| Ordinary cement, Grade 32.5 [7] | 0.802 | tCO2e/t | |
| M30 cement mortar [36] | 0.792 | tCO2e/t | |
| C20 concrete [37] | 0.235 | tCO2e/m3 | |
| Rebar [38] | 2.15 | tCO2e/t | |
| Galvanized iron wire [39] | 2.35 | kgCO2e/kg | |
| Sand [40] | 2.51 | kgCO2e/t | |
| Gravel [41] | 2.00 | kgCO2e/t | |
| Geogrid [15] | 3.00 | kgCO2e/kg | |
| Nonwoven geotextile [42] | 0.06 | kgCO2e/kg | |
| Polyvinyl chloride (PVC) pipe [17] | 1.34 | kgCO2e/kg | |
| Construction | Diesel [43] | 3.67 | kgCO2e/kg |
| Gasoline [44] | 2.91 | kgCO2e/kg | |
| Electricity [14] | 0.9397 | kgCO2e/(Kw·h) |
| Types of Building Materials | Unit | Quantity of Building Materials | Carbon Emissions/kg | Transportaion Distance for Building Materials/km | Carbon Emissions/kg |
|---|---|---|---|---|---|
| Ordinary silicate cement | t | 6626 | 7,791,919 | 36 | 38,641 |
| Sand | m3 | 20,909 | 73,476 | 14 | 66,391 |
| Gravel | m3 | 13,220 | 39,660 | 14 | 29,983 |
| Geogrid | m2 | 60,966 | 67,670 | 36 | 18,961 |
| Earthwork | m3 | 120,746 | — | 14 | 629,857 |
| Galvanized iron wire | kg | 48,830 | 114,750 | 24 | 190 |
| Rebar | kg | 37,900 | 81,485 | 24 | 147 |
| M30 cement mortar | kg | 250,680 | 198,539 | 24 | 975 |
| C20 concrete | m3 | 1774 | 416,251 | 24 | 16,554 |
| Polyvinyl chloride (PVC) | t | 9.54 | 13 | 4.7 | 7.3 |
| Types of Building Materials | Unit | Quantity of Building Materials | Carbon Emissions/kg | Transportation Distance for Building Materials/km | Carbon Emissions/kg |
|---|---|---|---|---|---|
| Group A fill | m3 | 4021 | 23,666 | 20 | 35,174 |
| Composite geomembrane | m2 | 6701 | 2902 | 20 | 7 |
| Galvanized iron wire | kg | 55,350 | 130,073 | 22 | 197 |
| Rebar | kg | 67,961 | 146,116 | 22 | 242 |
| M30 cement mortar | kg | 268,576 | 212,712 | 22 | 957 |
| C20 concrete | m3 | 1873 | 439,481 | 22 | 16,021 |
| Polyvinyl chloride (PVC) | t | 9.65 | 13 | 16 | 25 |
| Construction Process | Machinery | Specification | Energy Consumption per Unit Shift/kg | kg/CO2 Taiwanese Troupe | Taiwanese Troupe | Total Carbon Emissions /kg | ||
|---|---|---|---|---|---|---|---|---|
| Gasoline | Diesel | Electrical | ||||||
| Dredge | Crawler hydraulic single bucket excavator | 1 m3 | 132.8 | 487.38 | 27 | 13,159.26 | ||
| Dump truck with cover | 12 t | 61.29 | 224.93 | 377.28 | 84,861.59 | |||
| Digging up the roots | Crawler hydraulic single bucket excavator | 1 m3 | 132.8 | 487.38 | 13.33 | 6496.78 | ||
| Tire loader | 3 m3 | 87.09 | 319.62 | 4.45 | 1422.31 | |||
| Original ground clearance | Crawler bulldozers | 135 kw | 107.52 | 394.60 | 15 | 5919 | ||
| Railway subgrade drainage ditch construction | Crawler hydraulic single bucket excavator | 0.6 m3 | 44.08 | 161.77 | 3 | 485.31 | ||
| Soft soil ground replenishment | Crawler bulldozers | 135 kw | 107.52 | 394.60 | 2 | 789.20 | ||
| Self-propelled vibratory rollers | 25 t | 118.54 | 435.04 | 2.52 | 1096.30 | |||
| Land grader | 120 kw | 63.44 | 232.82 | 2.28 | 530.83 | |||
| Pulverized coal Piles construction | Powder jet mixing pile forming machine | d ≤ 0.5 m | 271.68 | 294.12 | 318.13 | 93,568.4 | ||
| Sand bedding construction | Crawler bulldozers | 75 kw | 49.73 | 182.51 | 91.02 | 16,612.06 | ||
| Self-propelled vibratory rollers | 15 t | 88.70 | 325.53 | 176.69 | 57,517.90 | |||
| Frog tamper | 250 Nm | 7.48 | 8.10 | 5925.63 | 47,997.60 | |||
| Impact rollers | 25 t | 290.30 | 1065.4 | 9.63 | 10,259.80 | |||
| Watering of sand bedding | Sprinkler truck | 9600 L | 40.78 | 118.67 | 305.19 | 36,216.90 | ||
| Railway base filling | Crawler bulldozers | 105 kw | 65.18 | 239.21 | 163.84 | 39,192.17 | ||
| Self-propelled vibratory rollers | 15 t | 88.70 | 325.53 | 250.58 | 81,571.31 | |||
| Land grader | 120 kw | 63.44 | 232.82 | 38.55 | 8975.21 | |||
| Bridge and culvert transition fill | Self-propelled vibratory rollers | 25 t | 118.54 | 435.04 | 3.47 | 1509.59 | ||
| Land grader | 120 kw | 63.44 | 232.82 | 3.47 | 807.89 | |||
| Internal combustion tamping machine | 7 kw | 10 | 36.70 | 6.94 | 254.70 | |||
| Slope protection | Electric air compressor | 20 m3/min | 691.60 | 649.90 | 181.60 | 118,021.84 | ||
| Mortar mixer | 400 L | 20.16 | 18.94 | 13.76 | 260.61 | |||
| Steel bar cutting machine | d ≤ 40 | 33.32 | 31.31 | 8.25 | 258.31 | |||
| Construction Process | Machinery | Specification | Energy Consumption per Unit Shift/kg | kg/CO2 Taiwanese Troupe | Taiwanese Troupe | Total Carbon Emissions /kg | ||
|---|---|---|---|---|---|---|---|---|
| Gasoline | Diesel | Electrical | ||||||
| Excavated graben cut-off ditch construction | Crawler hydraulic single bucket excavator | 1 m3 | 132.8 | (466.64) | 487.38 (438.50) | 1.64 | 799.30 (719.14) | |
| Earth excavation | Crawler hydraulic single bucket excavator | 1 m3 | 132.8 | (466.64) | 487.38 (438.50) | 324.64 | 158,223.04 (142,354.64) | |
| Earthmoving | Self-discharging truck | 25 t | 106.24 | (350) | 389.90 (328.90) | 1096.37 | 427,474.66 (360,596.09) | |
| Disposal site preparation | Crawler bulldozers | 135 kw | 107.52 | (240) | 394.60 (225.53) | 194.42 | 76,718.13 (43,847.54) | |
| Stone blasting | Crawler type hydraulic breaking hammer | 200 kW | 137.09 | 503.12 | 0.73 | 367.28 | ||
| Crawler type hydraulic surface drilling rig | d ≤ 152 | 77.95 | 286.08 | 4.65 | 1330.27 | |||
| Stone excavation | Crawler hydraulic single bucket excavator | 1 m3 | 107.52 | 394.6 | 15.72 | 6203.11 | ||
| Stone moving | Self-discharging truck | 25 t | 106.24 | (350) | 389.90 (328.90) | 46.65 | 18,188.84 (15,343.19) | |
| Stone disposal site preparation | Crawler bulldozers | 135 kw | 107.52 | (240) | 394.60 (225.53) | 7 | 2762.20 (1578.71) | |
| Ground level | Crawler bulldozers | 135 kw | 88.7 | 325.53 | 1.89 | 615.25 | ||
| Impact rollers | 25 t | 290.3 | 1065.4 | 7.28 | 7756.11 | |||
| Land grader | 120 kW | 63.44 | 232.82 | 0.31 | 72.17 | |||
| Fill compaction | Crawler bulldozers | 135 kw | 107.52 | (240) | 394.60 (225.53) | 5.41 | 2134.79 (1220.12) | |
| Self-propelled vibratory rollers | 15 t | 88.7 | (114.8) | 325.53 (107.88) | 10.72 | 3489.68 (1156.47) | ||
| Land grader | 120 kw | 63.44 | 232.82 | 0.8 | 186.26 | |||
| Tire loader | 3.5 m3 | 132.8 | (480) | 487.38 (451.06) | 0.34 | 165.71 (153.36) | ||
| Sprinkler truck | 9600 L | 40.78 | 118.67 | 0.8 | 94.94 | |||
| Slope protection | Electric air compressor | 20 m3/min | 691.6 | 649.90 | 101.27 | 65,815.37 | ||
| Mortar mixer | 400 L | 20.16 | 18.94 | 7.67 | 145.27 | |||
| Steel bar cutting machine | d ≤ 40 | 33.32 | 31.31 | 4.6 | 144.03 | |||
| Scheme | Type of Building Materials/Energy | Carbon Emissions/kg | Sensitivity Factor/% | ||||
|---|---|---|---|---|---|---|---|
| 20% | 10% | Reference | −10% | −20% | |||
| Filled embankment scheme | Ordinary silicate cement | 12,792,964 | 12,013,772 | 11,234,580 | 10,455,388 | 9,676,196 | 69.357 |
| Sand | 11,249,275 | 11,241,928 | 11,234,580 | 11,227,232 | 11,219,885 | 0.654 | |
| Gravel | 11,242,512 | 11,238,546 | 11,234,580 | 11,230,614 | 11,226,648 | 0.353 | |
| Geogrid | 11,248,114 | 11,241,347 | 11,234,580 | 11,227,813 | 11,221,046 | 0.602 | |
| Galvanized iron wire | 11,257,530 | 11,246,055 | 11,234,580 | 11,223,105 | 11,211,630 | 1.021 | |
| Rebar | 11,250,877 | 11,242,729 | 11,234,580 | 11,226,432 | 11,218,283 | 0.725 | |
| M30 cement mortar | 11,274,288 | 11,254,434 | 11,234,580 | 11,214,726 | 11,194,872 | 1.767 | |
| C20 concrete | 11,317,830 | 11,276,205 | 11,234,580 | 11,192,955 | 11,151,330 | 3.705 | |
| PVC pipe | 11,234,583 | 11,234,581 | 11,234,580 | 11,234,579 | 11,234,577 | 0.001 | |
| Diesel | 11,300,872 | 11,267,726 | 11,234,580 | 11,201,434 | 11,168,288 | 2.95 | |
| Gasoline | 11,241,823 | 11,238,202 | 11,234,580 | 11,230,958 | 11,227,337 | 0.322 | |
| Electronic | 11,286,601 | 11,260,591 | 11,234,580 | 11,208,569 | 11,182,559 | 2.315 | |
| Excavated graben scheme | Gravel | 1,974,643 | 1,972,277 | 1,969,910 | 1,967,543 | 1,965,177 | 1.201 |
| Nonwoven geotextile | 1,970,490 | 1,970,200 | 1,969,910 | 1,969,620 | 1,969,330 | 0.147 | |
| Galvanized iron wire | 1,995,925 | 1,982,917 | 1,969,910 | 1,956,903 | 1,943,895 | 6.603 | |
| Rebar | 1,999,133 | 1,984,522 | 1,969,910 | 1,955,298 | 1,940,687 | 7.417 | |
| M30 cement mortar | 2,012,452 | 1,991,181 | 1,969,910 | 1,948,639 | 1,927,368 | 10.798 | |
| C20 concrete | 2,057,806 | 2,013,858 | 1,969,910 | 1,925,962 | 1,882,014 | 22.31 | |
| PVC pipe | 1,969,913 | 1,969,911 | 1,969,910 | 1,969,909 | 1,969,907 | 0.001 | |
| Diesel | 2,111,309 | 2,040,609 | 1,969,910 | 1,899,211 | 1,828,511 | 35.89 | |
| Gasoline | 1,969,929 | 1,969,919 | 1,969,910 | 1,969,901 | 1,969,891 | 0.005 | |
| Electronic | 1,985,141 | 1,977,526 | 1,969,910 | 1,962,294 | 1,954,679 | 3.866 | |
| Scheme | Type of Building Material | Carbon Emission/kg | Sensitivity Factor/% | ||||
|---|---|---|---|---|---|---|---|
| 20% | 10% | Reference | −10% | −20% | |||
| Filled embankment scheme | Ordinary silicate cement | 11,242,308 | 11,238,444 | 11,234,580 | 11,230,716 | 11,226,852 | 0.3439 |
| Sand | 11,247,858 | 11,241,219 | 11,234,580 | 11,227,941 | 11,221,302 | 0.591 | |
| Gravel | 11,240,577 | 11,237,578 | 11,234,580 | 11,231,582 | 11,228,583 | 0.2669 | |
| Geogrid | 11,238,372 | 11,236,476 | 11,234,580 | 11,232,684 | 11,230,788 | 0.1688 | |
| Earthwork | 11,360,551 | 11,297,566 | 11,234,580 | 11,171,594 | 11,108,609 | 5.6064 | |
| Galvanized iron wire | 11,234,618 | 11,234,599 | 11,234,580 | 11,234,561 | 11,234,542 | 0.0017 | |
| Rebar | 11,234,609 | 11,234,595 | 11,234,580 | 11,234,565 | 11,234,551 | 0.0013 | |
| M30 cement mortar | 11,234,775 | 11,234,678 | 11,234,580 | 11,234,483 | 11,234,385 | 0.0087 | |
| C20 concrete | 11,237,891 | 11,236,235 | 11,234,580 | 11,232,925 | 11,231,269 | 0.1473 | |
| PVC pipe | 11,234,581 | 11,234,581 | 11,234,580 | 11,234,579 | 11,234,579 | 0.0001 | |
| Excavated graben scheme | Gravel | 1,976,945 | 1,973,427 | 1,969,910 | 1,966,393 | 1,962,875 | 1.7856 |
| Nonwoven geotextile | 1,969,911 | 1,969,911 | 1,969,910 | 1,969,909 | 1,969,909 | 0.0004 | |
| Galvanized iron wire | 1,969,949 | 1,969,930 | 1,969,910 | 1,969,890 | 1,969,871 | 0.01 | |
| Rebar | 1,969,958 | 1,969,934 | 1,969,910 | 1,969,886 | 1,969,862 | 0.0123 | |
| M30 cement mortar | 1,970,101 | 1,970,006 | 1,969,910 | 1,969,814 | 1,969,719 | 0.0486 | |
| C20 concrete | 1,973,114 | 1,971,512 | 1,969,910 | 1,968,308 | 1,966,706 | 0.8133 | |
| PVC pipe | 1,969,915 | 1,969,913 | 1,969,910 | 1,969,908 | 1,969,905 | 0.0013 | |
| Building Material Types | Unit | Quantity of Building Materials | Carbon Emissions/kg | Transportation Distance for Building Materials/km | Carbon Emissions/kg |
|---|---|---|---|---|---|
| Geotextile | m2 | 13,420 | 362.34 | 500 | 489.16 |
| Planting bag | m2 | 45,981 | 1241.46 | 500 | 1675.97 |
| Construction Process | Machinery | Specification | Energy Consumption per Unit Shift/kg | kg/CO2 Taiwanese Troupe | Taiwanese Troupe | Total Carbon Emissions /kg | ||
|---|---|---|---|---|---|---|---|---|
| Gasoline | Diesel | Electrical | ||||||
| Ecological slope | Hydraulic grass sprayer | 4000 L | 29.03 | 106.54 | 2.42 | 257.36 | ||
| Heavy-duty vehicle | 6 t | 34.56 | 100.57 | 28.18 | 2834.26 | |||
| Single-stage centrifugal freshwater pumps | 12.5 m3/h–50 m | 22.44 | 17.50 | 14.49 | 253.65 | |||
| Building Material Production/kg | Building Material Transportation/kg | Construction /kg | Operation and Maintenance /kg | Whole Life Cycle/kg | |
|---|---|---|---|---|---|
| Excavated graben scheme (soil nail wall slope) | 954,963 | 52,623 | 772,686.41 | 178,027.24 | 1,958,299.65 |
| Change in carbon emissions | +1603.80 | +2165.13 | +3345.27 | −5,239,798.58 | |
| Excavated graben scheme (ecological slope) | 956,566.80 | 54,788.13 | 776,031.68 | −5,061,771.34 | −3,274,384.73 |
| Categorization | Quantity of Building Materials/ Machinery Shift | Unit Price | Construction Cost /yuan |
|---|---|---|---|
| Geotextile | 14,760 m2 | 2.87 yuan/m2 | 42,361.2 |
| Planting bag | 50,579.1 m2 | 2.87 yuan/m2 | 145,162.02 |
| Grass seed mix | 335.5 kg | 31.02 yuan/kg | 10,407.21 |
| Heavy-duty diesel trucks | 23.55 shift | 476.7 yuan/shift | 11,226.29 |
| Spray planter | 2.662 shift | 321.16 yuan/shift | 854.93 |
| Heavy-duty | 30.99 shift | 369.31 yuan/shift | 11,444.92 |
| Single-stage centrifugal Freshwater pumps | 15.94 shift | 83.77 yuan/shift | 1335.29 |
| Slope Type | Categorization | Quantity of Building Materials/ Machinery Shift | Unit Price | Construction Cost /yuan |
|---|---|---|---|---|
| Soil nail wall slope | Ordinary silicate cement | 46,467.62 kg | 0.33 yuan/kg | 15,334.31 |
| Medium coarse sand | 58.77 m3 | 34.25 yuan/m3 | 2012.87 | |
| Reinforcing Steel | 47,290.97 kg | 2.64 yuan/kg | 124,848.16 | |
| Heavy-duty Diesel Trucks | 6.08 shift | 476.7 yuan/shift | 2898.34 | |
| Electric Air Compressor | 101.27 shift | 501.09 yuan/shift | 50,745.38 | |
| Mortar Mixer | 7.67 shift | 97.19 yuan/shift | 745.45 | |
| Reinforcing Steel Cutting Machine | 4.6 shift | 22.51 yuan/shift | 103.55 | |
| Ecological slope | Geotextile | 14,760 m2 | 2.87 yuan/m2 | 42,361.2 |
| Geobags | 50,579.1 m2 | 2.87 yuan/m2 | 145,162.02 | |
| Grass Seed Mixer | 335.5 kg | 31.02 yuan/kg | 10,407.21 | |
| Galvanized Low Carbon Steel Wire | 241.56 kg | 3.64 yuan/kg | 879.28 | |
| Heavy-duty Diesel Trucks | 23.55 shift | 476.7 yuan/shift | 11,226.29 | |
| Spray Grass Planter | 2.662 shift | 321.16 yuan/shift | 854.93 | |
| Heavy-duty Vehicle | 30.99 shift | 369.31 yuan/shift | 11,444.92 | |
| Single-stage centrifugal Freshwater pumps | 15.94 shift | 83.77 yuan/shift | 1335.29 |
| Slope | Building Material Production/t | Building Material Transportation/t | Construction /t | Operation and Maintenance/t | Whole Life Cycle/t | ||||
|---|---|---|---|---|---|---|---|---|---|
| Hyssop | Knotweed | Ryegrass | Hyssop | Knotweed | Ryegrass | ||||
| 1:0.4 | 7.26 | 0.017 | 133.55 | −6523.44 | −5031.18 | −2227.54 | −6382.61 | −4890.35 | −2086.71 |
| 1:0.5 | 7.54 | 0.018 | 166.13 | −6773.15 | −5223.14 | −2311 | −6599.46 | −5049.45 | −2137.31 |
| 1:0.6 | 7.87 | 0.018 | 198.74 | −7063.34 | −5446.34 | −2408.34 | −6856.71 | −5239.71 | −2201.71 |
Disclaimer/Publisher’s Note: The statements, opinions and data contained in all publications are solely those of the individual author(s) and contributor(s) and not of MDPI and/or the editor(s). MDPI and/or the editor(s) disclaim responsibility for any injury to people or property resulting from any ideas, methods, instructions or products referred to in the content. |
© 2024 by the authors. Licensee MDPI, Basel, Switzerland. This article is an open access article distributed under the terms and conditions of the Creative Commons Attribution (CC BY) license (https://creativecommons.org/licenses/by/4.0/).
Share and Cite
Shen, Z.; Bao, X.; Li, Z.; Lv, X. Comparative Analysis of Carbon Emissions from Filled Embankment and Excavated Graben Schemes of Railway Subgrade Engineering. Sustainability 2024, 16, 8384. https://doi.org/10.3390/su16198384
Shen Z, Bao X, Li Z, Lv X. Comparative Analysis of Carbon Emissions from Filled Embankment and Excavated Graben Schemes of Railway Subgrade Engineering. Sustainability. 2024; 16(19):8384. https://doi.org/10.3390/su16198384
Chicago/Turabian StyleShen, Zhongshuai, Xueying Bao, Zilong Li, and Xiangru Lv. 2024. "Comparative Analysis of Carbon Emissions from Filled Embankment and Excavated Graben Schemes of Railway Subgrade Engineering" Sustainability 16, no. 19: 8384. https://doi.org/10.3390/su16198384
APA StyleShen, Z., Bao, X., Li, Z., & Lv, X. (2024). Comparative Analysis of Carbon Emissions from Filled Embankment and Excavated Graben Schemes of Railway Subgrade Engineering. Sustainability, 16(19), 8384. https://doi.org/10.3390/su16198384