Article

Characteristics of Spatial and Temporal Variation in Drought in the Sichuan Basin from 1963 to 2022

1
College of Resources and Environment, Aba Teachers College, Wenchuan 623002, China
2
College of Geography and Environmental Science, Northwest Normal University, Lanzhou 730070, China
*
Author to whom correspondence should be addressed.
Sustainability 2024, 16(19), 8397; https://doi.org/10.3390/su16198397
Submission received: 23 August 2024 / Revised: 21 September 2024 / Accepted: 24 September 2024 / Published: 27 September 2024

Abstract

:
The study of regional drought characteristics is vital for identifying drought patterns and offering scientifically informed guidance for drought warnings. This research focuses on the Sichuan Basin, where the Standardized Precipitation Evapotranspiration Index (SPEI) was calculated across various time scales using meteorological data from 1963 to 2022. Wavelet analysis was applied to examine the periodic fluctuations of the SPEI across different time scales. Drought events were identified using run-length theory and spatially visualized with ArcGIS 10.7 interpolation techniques to elucidate the temporal and spatial dynamics of drought occurrences. The findings are as follows: (1) Over nearly 60 years, the SPEI in the Sichuan Basin fluctuated between −1.5 and 1, with an insignificant annual downward trend but a significant downward trend in autumn (p < 0.05). (2) The SPEI displayed a primary cycle of 6 years in spring, autumn, and winter, while the summer cycle matched the annual SPEI cycle of 8 years. (3) Drought events were more frequent in the eastern part of the basin compared to the west. The area with high drought frequency shifted counterclockwise from east to north, northwest, west, and south with the changing seasons. (4) Drought duration was longer in the western and northern regions of the basin than in the east. Severe drought events were mainly concentrated in the Chengdu Plain and the Central Sichuan Hilly Region, although the drought intensity index was lowest in the Chengdu Plain and Chongqing in eastern Sichuan. The peak values of drought showed an insignificant decreasing trend, indicating a potential expansion in the extreme impacts of drought disasters in the study area.

1. Introduction

Drought is one of the most widespread and severe natural disasters in the world [1]. With the ongoing trend of global warming, the frequency, intensity, and affected areas of droughts in various regions are increasing, leading to an expansion in the risk levels and areas affected by drought disasters [2]. These hazards threaten food security and ecological stability, becoming key factors that restrict the sustainable development of the social economy [3,4,5]. As a result, identifying, evaluating, monitoring, and predicting regional drought disasters has become a critical issue [6,7,8,9,10,11].
The formation and development of droughts are characterized by the continuous accumulation of surface water deficits. To study and monitor drought conditions, scientists worldwide have developed various drought indices. In 1993, McKee et al. introduced the Standardized Precipitation Index (SPI) in the United States, utilizing long-term precipitation data for the monitoring and evaluation of both droughts and floods [12]. However, the SPI only considers the effect of rainfall on drought. In 2010, Vicente Serrano introduced potential evapotranspiration and developed the Standardized Precipitation Evapotranspiration Index (SPEI) based on SPI [13]. Since then, the SPEI index has been widely used and validated in Africa [14,15], parts of Europe [16,17,18], North and South America [19,20,21], and other regions. Wang Dong and Zeng et al. used the SPEI index to study drought events and processes in Southwest China, the Yangtze River Basin, and other areas [22,23,24,25,26]. This suggests that the SPEI index is effective in assessing drought conditions in southern China within the context of global warming.
The Sichuan Basin is a crucial region for the production of grain and oil crops in China, significantly contributing to the country’s agricultural economy. However, droughts pose a substantial threat to agricultural production and economic development in this area [27,28]. Although the Sichuan Basin is situated in a subtropical humid climate zone and experiences abundant annual precipitation in most areas, the distribution of this precipitation is highly uneven due to the region’s topography and monsoon influences. This variability in time and space leads to frequent droughts, with extreme drought events occurring regularly. Notable instances include the severe droughts of 2006, 2010, 2016, and 2022 [29,30,31,32]. The extreme heat and drought during the summer of 2022, for instance, triggered a large-scale power rationing event in Sichuan, the largest hydroelectric power-producing province in China. The drought-affected arable land in the Yangtze River Basin reached 44,213 km2 [33]. This uneven distribution of water resources across both space and time poses a significant challenge to sustainable agricultural production and the overall living standards of the region’s population [34,35,36].
Recent studies have examined drought conditions in Southwest China and the Sichuan Basin [26,29,37]. For example, Tan et al. [27] used a weighted comprehensive analysis to explore the causes of drought in the Sichuan Basin, considering both natural and social factors. While their study offers practical insights, it also introduces subjective elements into drought assessment. Additionally, research on drought characteristics in Sichuan Province has been conducted using various indices, such as the Standardized Precipitation Index (SPI), the SPEI [32,38], the humidity index [34], and remote sensing monitoring [39,40]. Although these studies have yielded significant findings, they share several common limitations. Firstly, most studies define their study areas based on administrative boundaries rather than natural geographic units. Sichuan Province can be divided into distinct natural regions, including the Sichuan Basin, the northwest highlands, and the southwest mountainous areas. These regions exhibit significant climatic variations, making it challenging to apply a single drought index uniformly across different topographical regions. Secondly, when calculating drought indices, many studies focus solely on precipitation or use simplified methods like the Thornthwaite equation to estimate potential evapotranspiration. Finally, the identification of drought events is often based on the magnitude of a calculated drought index. This approach can fragment a severe, prolonged drought event into multiple smaller events, thereby diminishing the accuracy of drought event identification. In conclusion, there is a notable gap in research focusing on drought within the natural region of the Sichuan Basin. To effectively assess meteorological drought risks and implement appropriate mitigation measures, a comprehensive analysis of the temporal and spatial characteristics of drought patterns in the Sichuan Basin is essential.
In this study, we analyzed the characteristics of meteorological drought in the Sichuan Basin by calculating the SPEI at various time scales. The Morlet wavelet was employed to examine the seasonal and annual cycles of the SPEI. Subsequently, drought characteristics were identified using run-length theory and spatially visualized with ArcGIS. This study aims to uncover and summarize the evolving patterns of meteorological drought in the Sichuan Basin, providing a foundation for timely responses to drought risk and the efficient allocation of water resources within the basin. According to the research content and methods, the flowchart of this study is shown in Figure 1.

2. Data and Methods

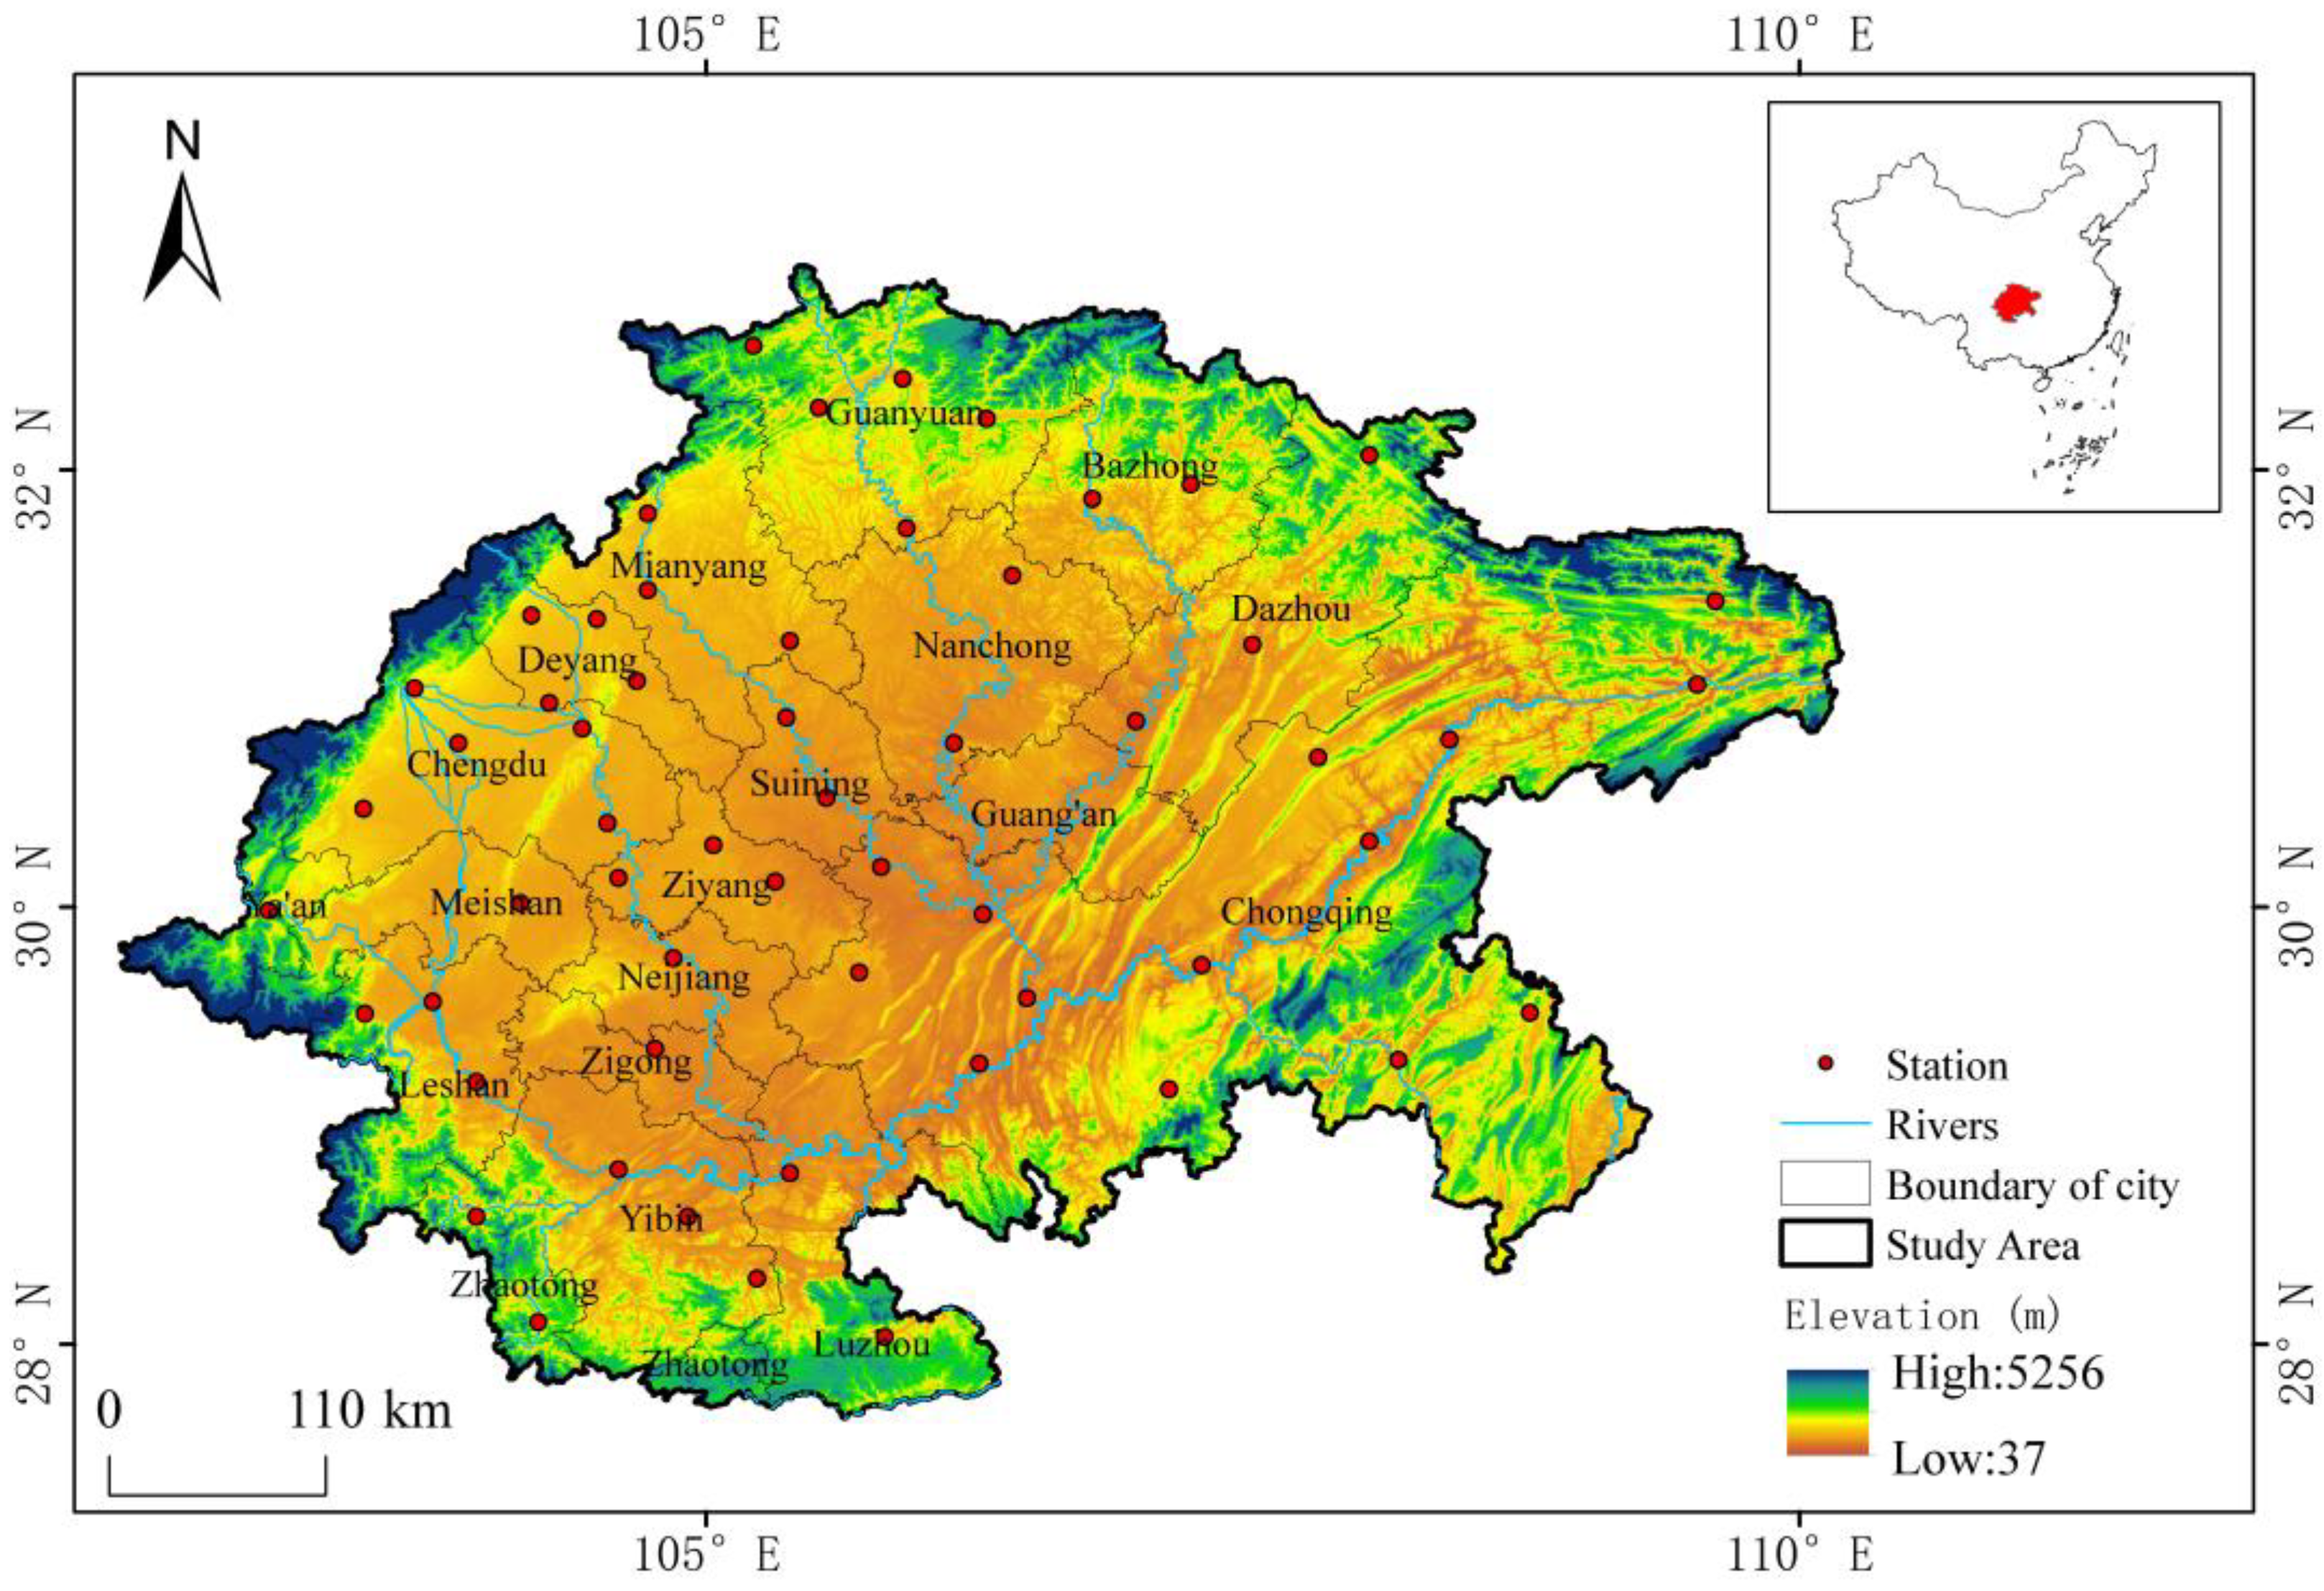
2.1. Overview of the Research Area and Data Sources

The Sichuan Basin, located in southwest China, is encircled by significant geographic features including the Qinghai–Tibet Plateau, the Daba Mountains, the Huaying Mountains, and the Yunnan–Guizhou Plateau. The surrounding mountains rise to elevations exceeding 1000 m above sea level, while the central basin floor ranges between 250 and 750 m above sea level. Geographically, the basin can be divided from west to east into the Chengdu Plain, the central Sichuan Hills, and the parallel ridge-valley region in eastern Sichuan. The Sichuan Basin’s climate is influenced by a subtropical humid monsoon and its complex terrain, resulting in an average annual precipitation of approximately 850 mm, with 50% to 60% of it occurring during the summer months. There is notable spatial variability in precipitation, with more pronounced differences in the western region compared to the eastern part, leading to distinct drought patterns across the basin [41]. Droughts in this region not only have a detrimental effect on agricultural productivity but also have extensive implications for industrial and urban areas. They exacerbate water pollution and can trigger environmental disasters. To support effective drought management policies, this study maintains a comprehensive county-level administrative unit, as depicted in Figure 2.
The meteorological data utilized in this study were sourced from the Resource and Environmental Sciences Data Center, Chinese Academy of Sciences (https://www.resdc.cn (accessed on 15 November 2023)). This study analyzed monthly meteorological data from 57 national meteorological stations in the Sichuan Basin, covering a comprehensive period from 1963 to 2022. The data included measurements of precipitation (mm), average temperature (°C), minimum and maximum temperatures (°C), mean relative humidity (%), mean wind speed (m/s), and sunshine duration. Among the 57 stations, 6 had missing data for certain periods. To address this, an interpolation method was employed to fill in the gaps, ensuring the continuity and reliability of the dataset [42].

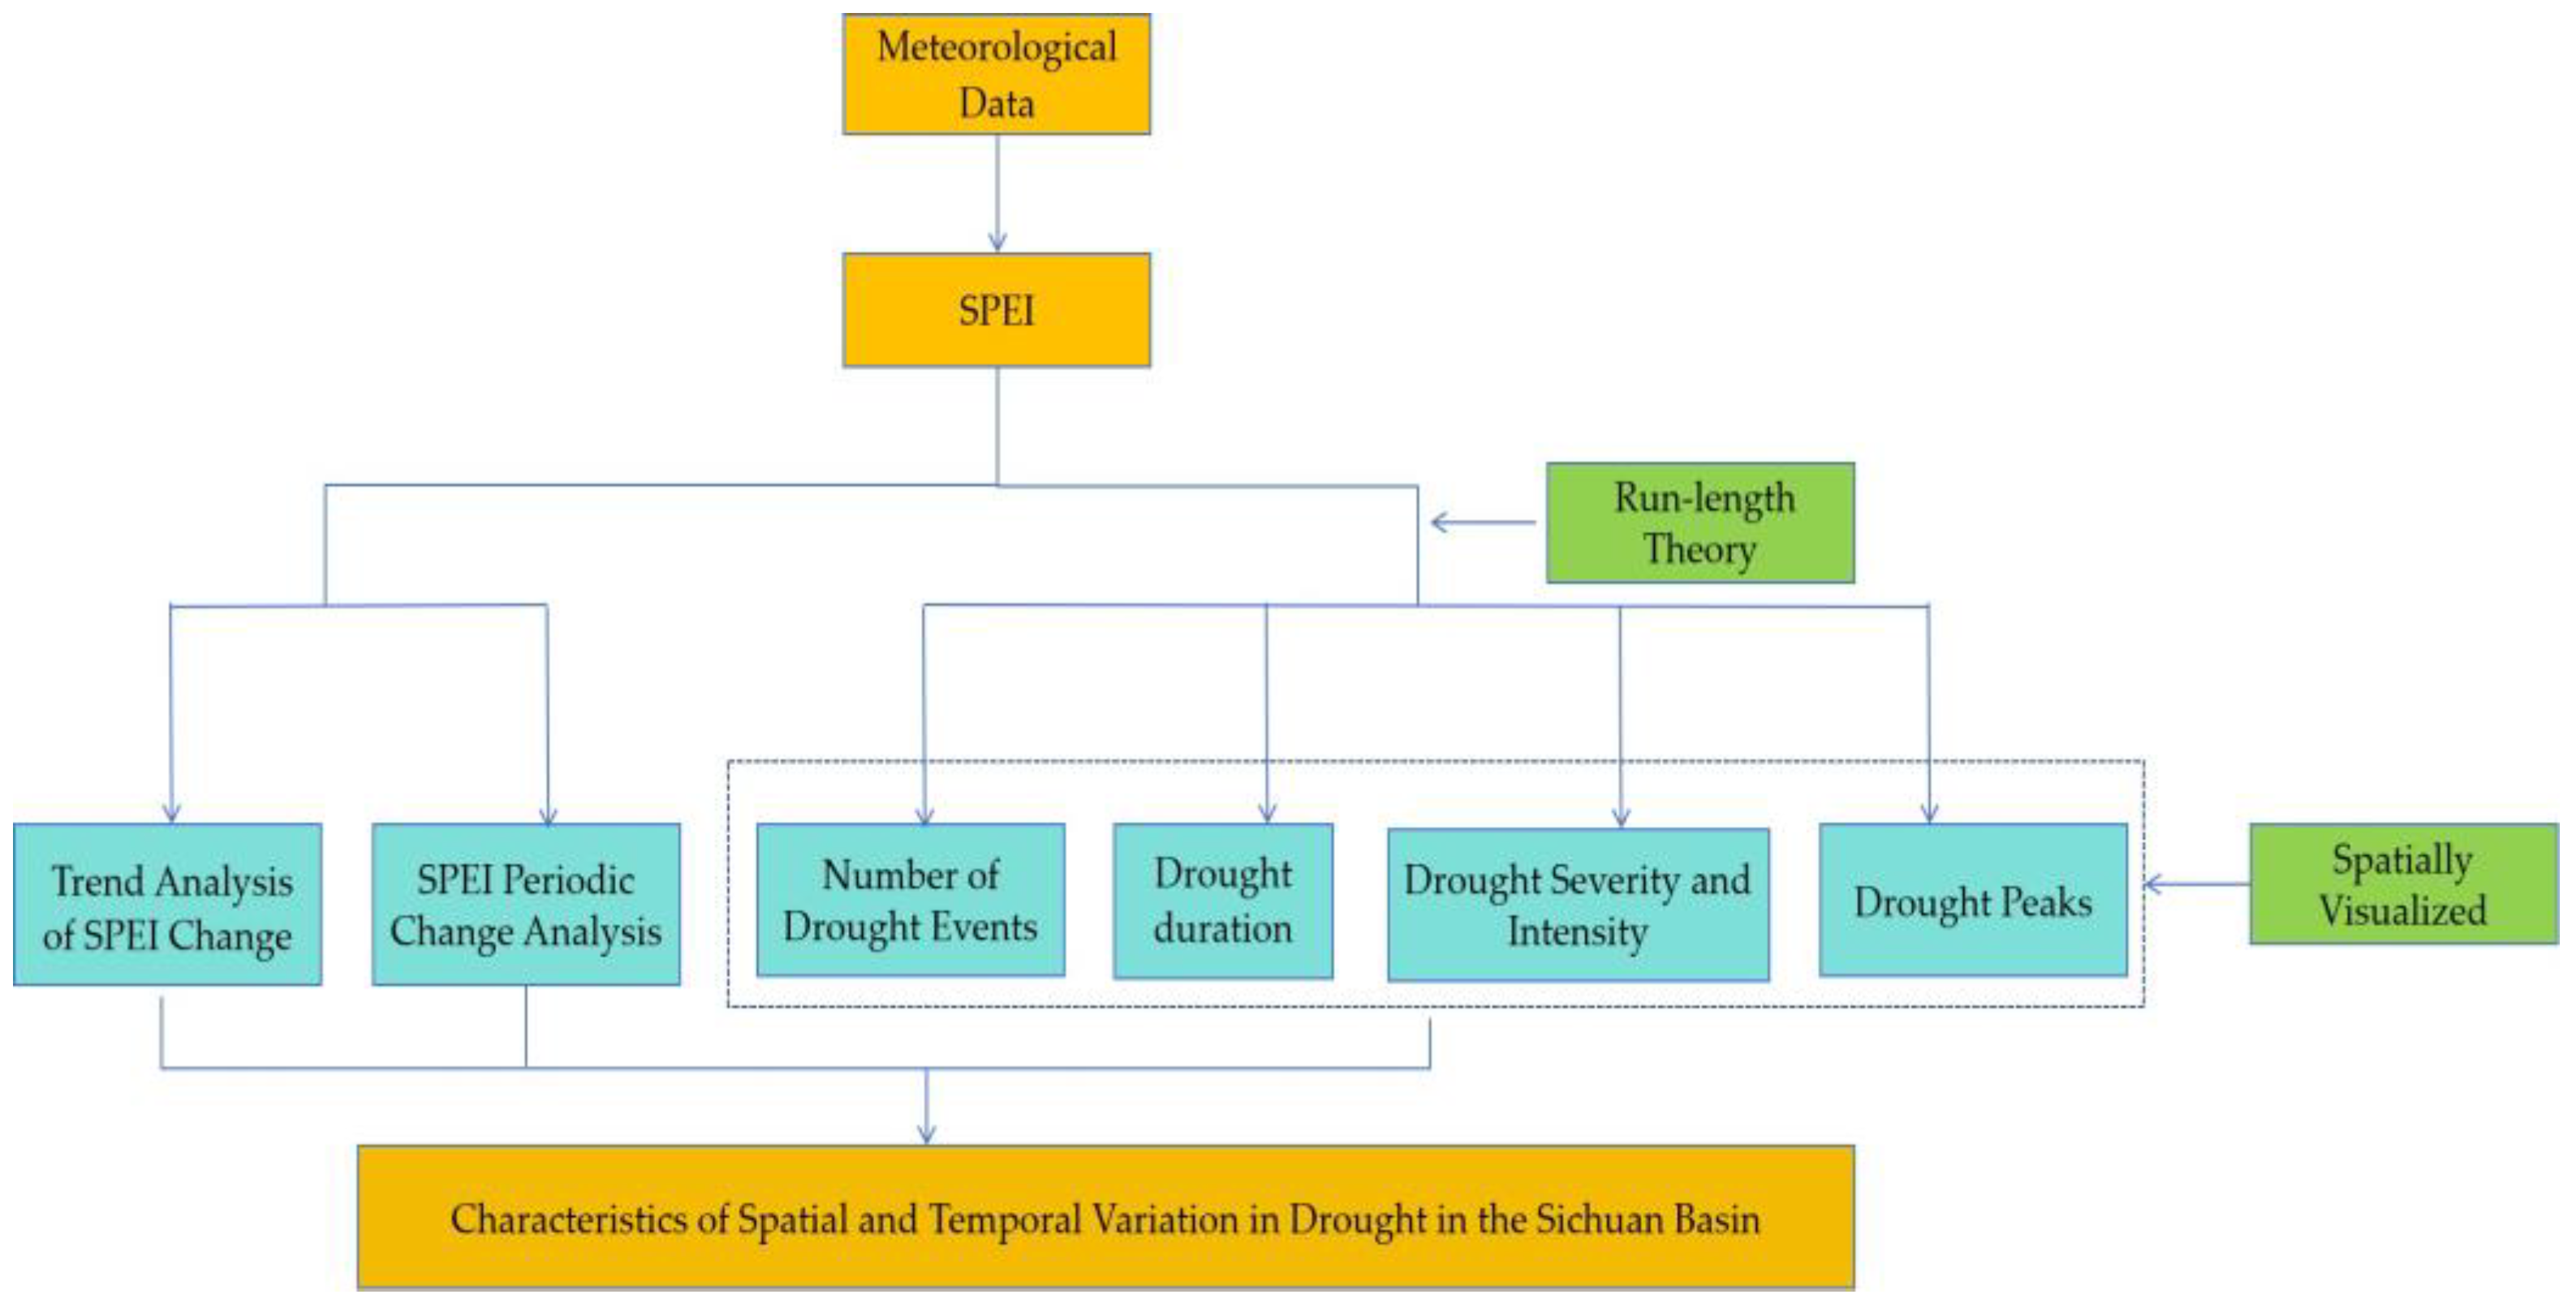
2.2. Research Methods

2.2.1. Standardized Precipitation Evapotranspiration Index

Based on the principle of water budget balance, the calculation process of SPEI was as follows [43]:
(1) The difference between monthly precipitation and potential evapotranspiration was calculated at different time scales D i :
D i = P i E T 0 i
where P i represents monthly precipitation and potential evapotranspiration. Potential evapotranspiration E T 0 was calculated from the highly approved Penman–Monteith model as follows:
E T 0 = 0.408 Δ R n G + γ 900 T + 273.15 U 2 e s e a Δ + γ 1 + 0.34 u 2
where R n is the net radiation amount, T is the average air temperature at 2 m above the surface, U 2 is the average wind speed at 2 m above the surface, G is the soil heat flux, e s is the saturated water vapor pressure, e a is the actual water vapor pressure, Δ is the slope of the saturated water vapor pressure curve at the current air temperature, and γ is the dry gauge constant.
Then, the cumulative D n k of the water deficit at different time scales is established:
D n k = i = 0 k 1 ( P n i E T n 1 )
where k is the time scale (unit: month) and n is the number of calculations, n k .
(2) The data series fitting D i : use the log-logistic chance distribution function f ( x ) to standardize the D i sequence, and find the cumulative probability function F ( x ) :
f x = β α x y α β 1 [ 1 + ( x y α ) β ] 2
where f ( x ) is the probability density function, α is the scale parameter, β is the shape parameter, and y is the position parameter. The probability distribution function of D i is calculated as follows:
F ( x ) = [ 1 + ( a x y ) β ] 1
(3) Standardize the cumulative distribution function and calculate the value of SPEI. P is the cumulative probability, probability-weighted moment:
W = 2 ln ( P )
S P E I = W a 0 + a 1 W + a 2 W 2 1 + b 1 W + b 2 W 2 + b 3 W 3
In the formula, when P 0.5 , P = 1 F ( x ) . And then P > 0.5 , the P is 1 P . Meanwhile, the Standardized Precipitation Evaporation Index takes the opposite number. The arguments are as follows: a 0 = 2.515517 , a 1 = 0.189269 , a 2 = 0.010328 , b 1 = 1.432788 , b 2 = 0.189269 , and b 3 = 0.001308 .
The SPEI is a valuable tool for characterizing drought conditions over varying time scales. In this study, we analyzed the SPEI data from 1963 to 2022 in the Sichuan Basin. Specifically, the SPEI-3 and SPEI-12 indices were employed to assess seasonal and annual drought conditions, respectively. Following the National Meteorological Scale Standard (GB/T 20481-2017 [44]), the SPEI classifications were categorized into five distinct grades, as detailed in Table 1.

2.2.2. Wavelet Analysis

Wavelet analysis is widely utilized to uncover the periodic variation characteristics of elements across multiple time scales. In this study, we employed the complex Morlet wavelet as the base function to analyze the contour lines of the wavelet’s real part and the wavelet variance values of the SPEI at both annual and seasonal scales. This approach was aimed at identifying the variation cycles of SPEI within the study area. The specific calculation methods used in this analysis are thoroughly detailed in the referenced literature [45].

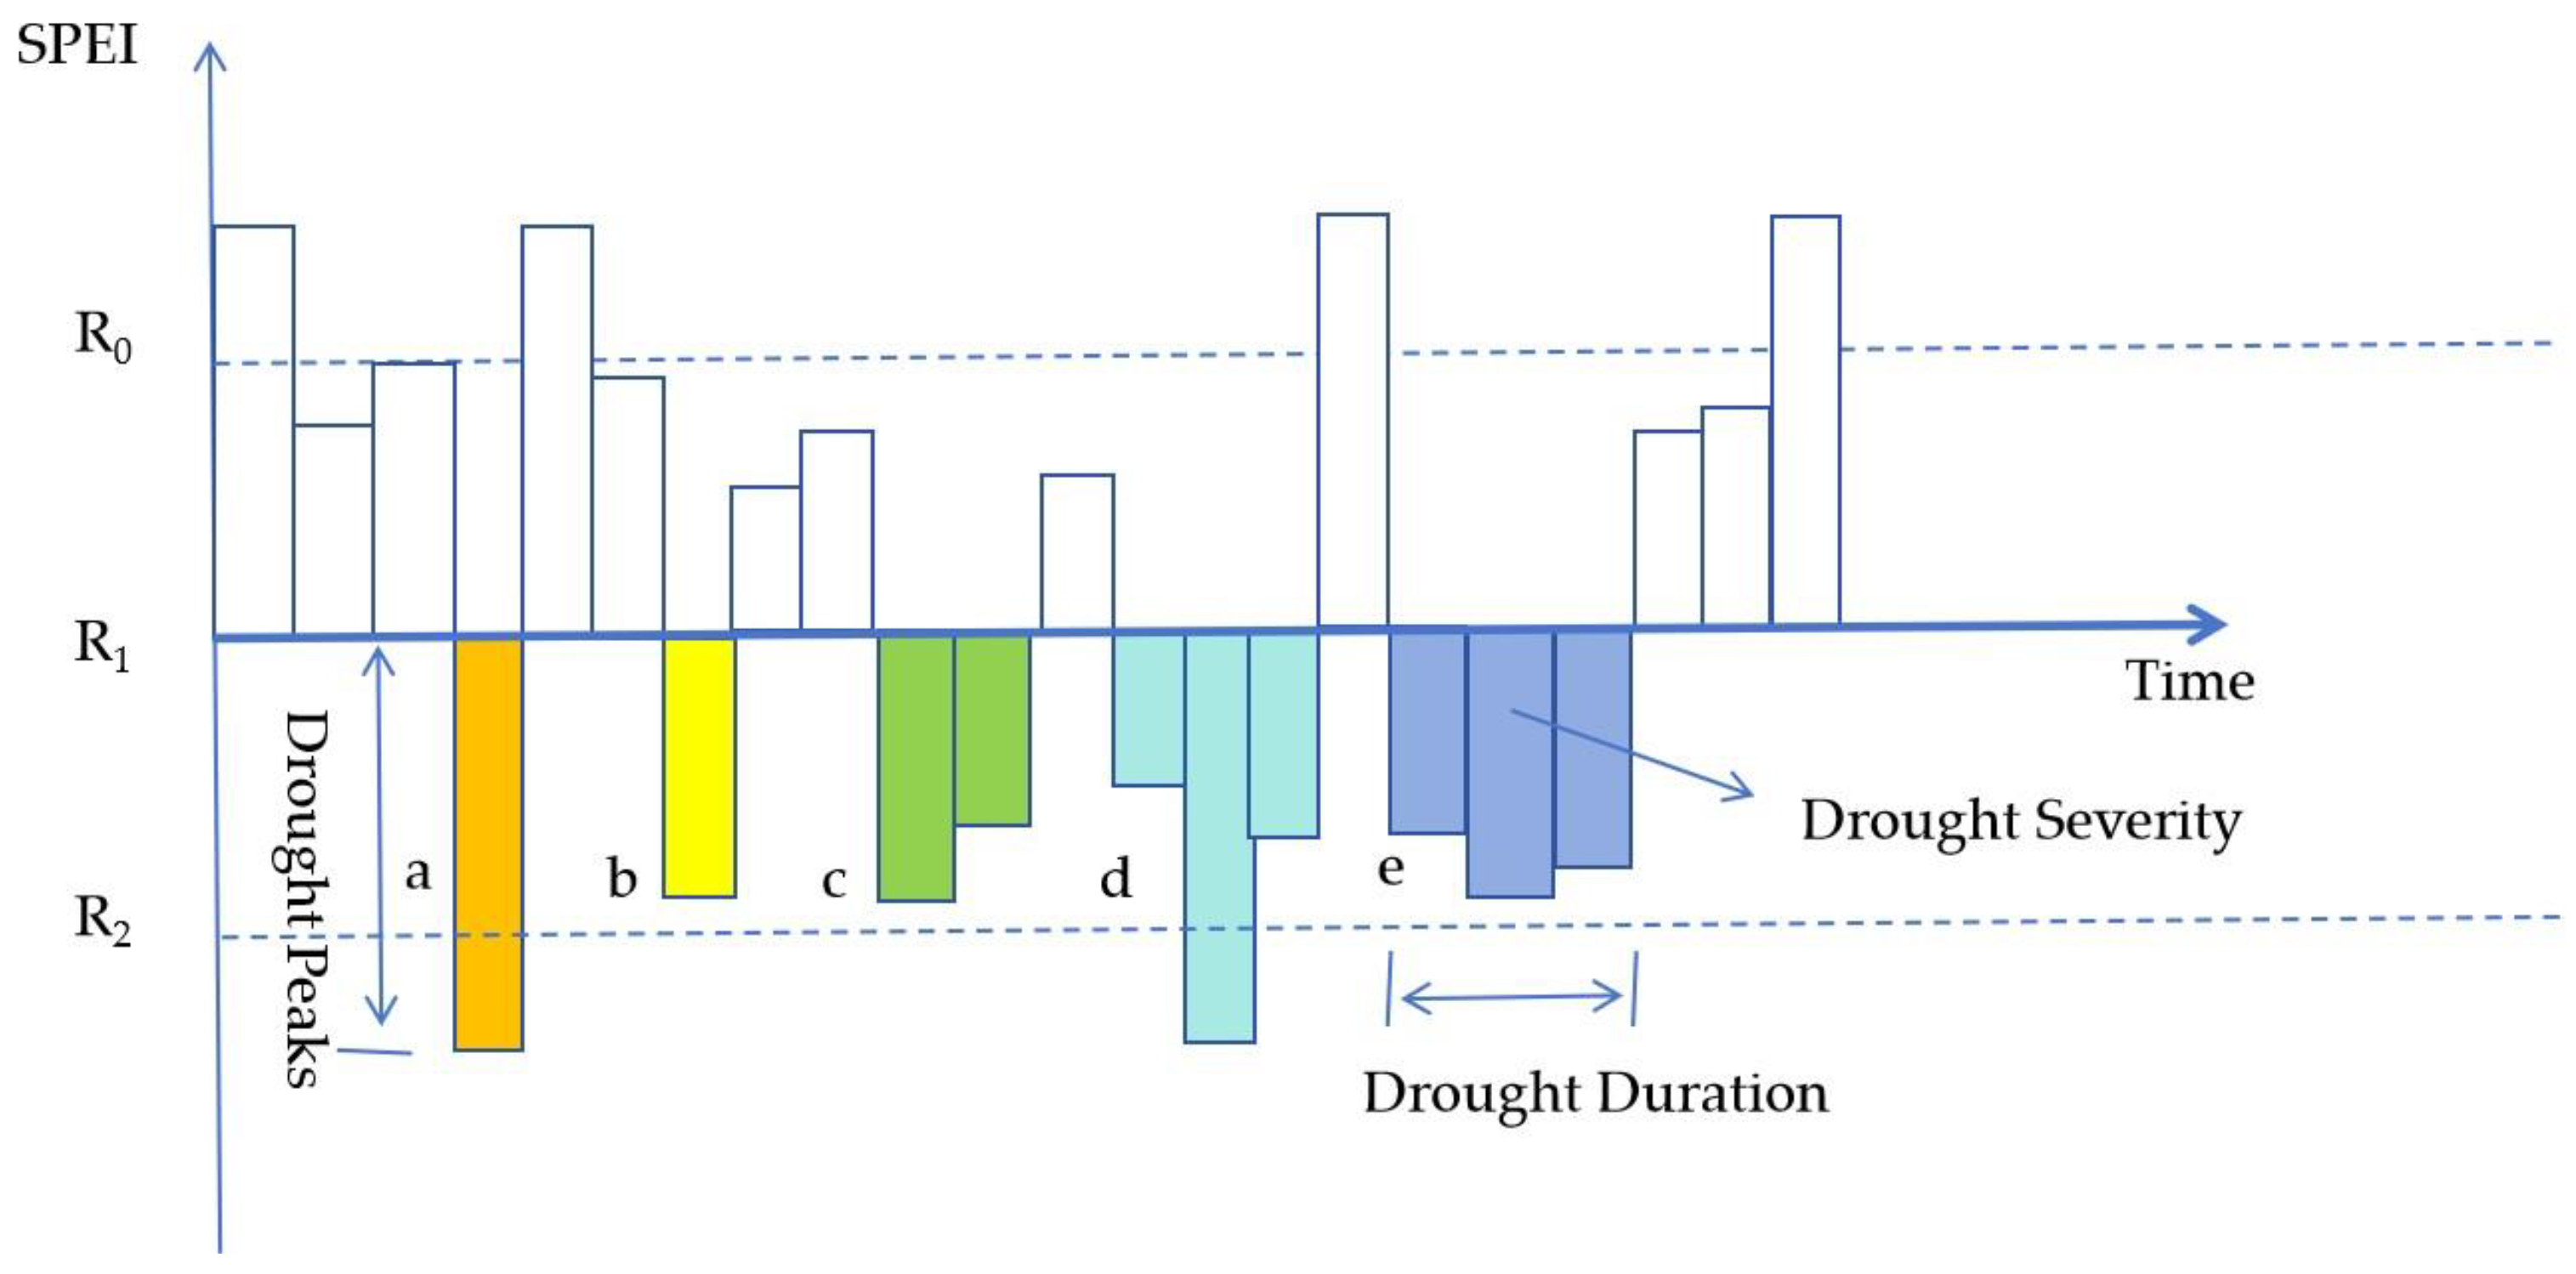
2.2.3. Run-Length Theory

Identifying drought events and their characteristics at annual and seasonal scales using run-length theory involves analyzing the SPEI. A drought event is deemed to start when the SPEI falls below a certain threshold, and it is considered to end when the index rises above another threshold. The period between the start and end of a drought event is termed the drought duration [46]. Traditional methods using a single threshold can fragment extended drought events into multiple shorter occurrences, which reduces the accuracy of disaster identification. To address this issue, this study utilizes a three-threshold approach [47], setting three predefined thresholds: R0, R1, and R2. This method defines a drought event by considering the cumulative value of the SPEI as the drought severity, the minimum SPEI value as the drought peak, and the ratio of drought severity to drought duration as the drought intensity [48]. The extraction of drought events is shown in Figure 3, and the specific determination process is as follows:
First, it is determined whether the drought index value is less than R1. If it is, a preliminary judgment is made that a drought event has occurred. As shown in the figure, there are a total of 5 drought events, namely a, b, c, d, and e.
Next, for the adjacent drought events, if the drought index during the interval time is less than R0, these events are merged into a single drought event; otherwise, they are considered two separate drought events. In the figure, c + d represents a drought event, while e represents a single drought event.
Finally, for a drought event lasting only one month, if its SPEI value is greater than R2, it is deemed not to have occurred, and this drought event is disregarded. In the figure, a represents a drought event, while b is excluded.
Given that drought events are a negative run-length process, R0 is set to 0. According to the standard for drought classification, the critical value for light drought is −0.5, so R2 is set to −0.5. If the SPEI value remains between −0.5 and −0.3 for an extended period, drought conditions are relatively common, which is why R1 is set to −0.3. The three-threshold run-length theory method for drought identification effectively addresses the impact of minor drought events on the recognition of long-duration drought processes, considering the possibility of temporary drought relief. Additionally, by comparing the drought index with thresholds for short-duration drought processes, it can be reasonably determined whether to classify them as a single drought event. This approach reduces the impact of minor drought events and enhances the accuracy of drought identification.

3. Results and Analysis

3.1. Trend Analysis of SPEI Change in the Sichuan Basin

3.1.1. Drought Evolution Law at Different Time Scales

The SPEI shows significant variations and sensitivity to meteorological factors across different time scales, with shorter time scales exhibiting a greater range of exponential fluctuations. Smaller time scales exhibit more pronounced fluctuations in the index. Monthly SPEI is particularly useful for assessing soil water content and can help guide agricultural irrigation schedules. In contrast, seasonal and annual SPEI scales are more affected by seasonal and annual meteorological changes, providing a better reflection of river water and groundwater levels.
Figure 4 depicts SPEI changes across monthly (a), seasonal (b), and annual (c) scales in the Sichuan Basin from 1963 to 2022. According to the figure, the SPEI from 1963 to 2022 reveals the following distributions: on a monthly scale, there were 108 months categorized as light drought, 38 as moderate drought, 4 as severe drought, and 1 as extreme drought. At the seasonal level, there were 36 seasons experiencing light drought, 10 with moderate drought, and two with severe drought. On an annual basis, over 60 years, there were 9 years classified as light drought and 1 as moderate drought. The annual SPEI for the Sichuan Basin fluctuated between −1.5 and 1, indicating a slight drying trend with a linear rate of −0.02 per decade. However, this trend was not statistically significant (as illustrated in Figure 4d).
The longstanding colloquial expression “nine droughts in ten years” in the Sichuan Basin is supported by historical records, including the Chinese Meteorological Disaster Ceremony, the Annals of Sichuan Province, and Water Conservancy documents. Notable droughts occurred in 1966, 1971, 1987, 1993, 1994, 1998, 2001, 2006, 2016, and 2022, which aligns with the trend observed in the annual SPEI (Figure 4c). Additionally, due to significant spatial and temporal variations in precipitation within the Sichuan Basin, it is common for the same year to experience phenomena such as “Western flooding and Eastern drought”, “Flooding followed by drought”, or “Drought followed by flooding”. For instance, in July 1981, most of the basin experienced a historically rare flood. However, after the flood receded, a period of sunny and hot weather in mid-August led to severe summer drought in some areas. Similarly, in 1988, while the western part of the basin experienced a typical rainy year, the eastern part received relatively less precipitation. Therefore, relying solely on the annual magnitude of the SPEI is insufficient to fully determine drought conditions in each region of the basin. A spatial analysis of drought conditions across different regions of the basin is necessary for a comprehensive understanding.

3.1.2. SPEI Change Analysis at Seasonal Scale

According to Figure 5, the Standardized Precipitation Evapotranspiration Index (SPEI) from 1963 to 2022 showed no significant trends in summer. However, a trend test indicated a downward trend in autumn (p < 0.05), while the other seasons did not exhibit statistically significant trends; thus, the observed downward trend in these seasons was not considered significant. Furthermore, the rate of decline in SPEI varied across different seasons.
In spring (Figure 5a), the SPEI change rate showed a tendency of −0.023 per decade. By spring 2020, the SPEI value had dropped to −1.41, indicating moderate drought. In contrast, summer (Figure 5b) exhibited a slight upward trend in the SPEI change rate at 0.018 per decade, making it the only season trending towards wetter conditions. However, this trend was not statistically significant. During 2006 and 2022, the SPEI in summer fell below −1.5, indicating severe drought during these two summers, consistent with findings from previous studies [49].
Autumn demonstrated the most pronounced drying trend among the four seasons, with a change rate of −0.063 per decade. From the 1990s to the 2000s, the SPEI value in autumn was above mild drought for 11 years, suggesting an increased frequency of autumn droughts in the Sichuan Basin during this period (Figure 5c). Winter showed a tendency of −0.039 per decade in SPEI variation. In winter 1969, the SPEI value reached −1.45, the lowest level in the past 60 years (Figure 5d). During the study period, there were 16 years when the SPEI indicated or exceeded light drought in winter, making it the season with the highest frequency of drought occurrences among the four seasons. Conversely, summer had the fewest drought occurrences, with only nine instances.
Precipitation in the Sichuan Basin is mainly concentrated from June to October, while winter precipitation is relatively scarce. This uneven distribution of water resources, both temporally and spatially, leads to seasonal water scarcity. Consequently, the analysis highlights a notable drying trend in autumn and a wetter tendency in summer, although the latter is not statistically significant. Annually, a drying trend prevails in the Sichuan Basin, with autumn contributing most significantly to the annual droughts.

3.2. SPEI Periodic Change Analysis in the Sichuan Basin

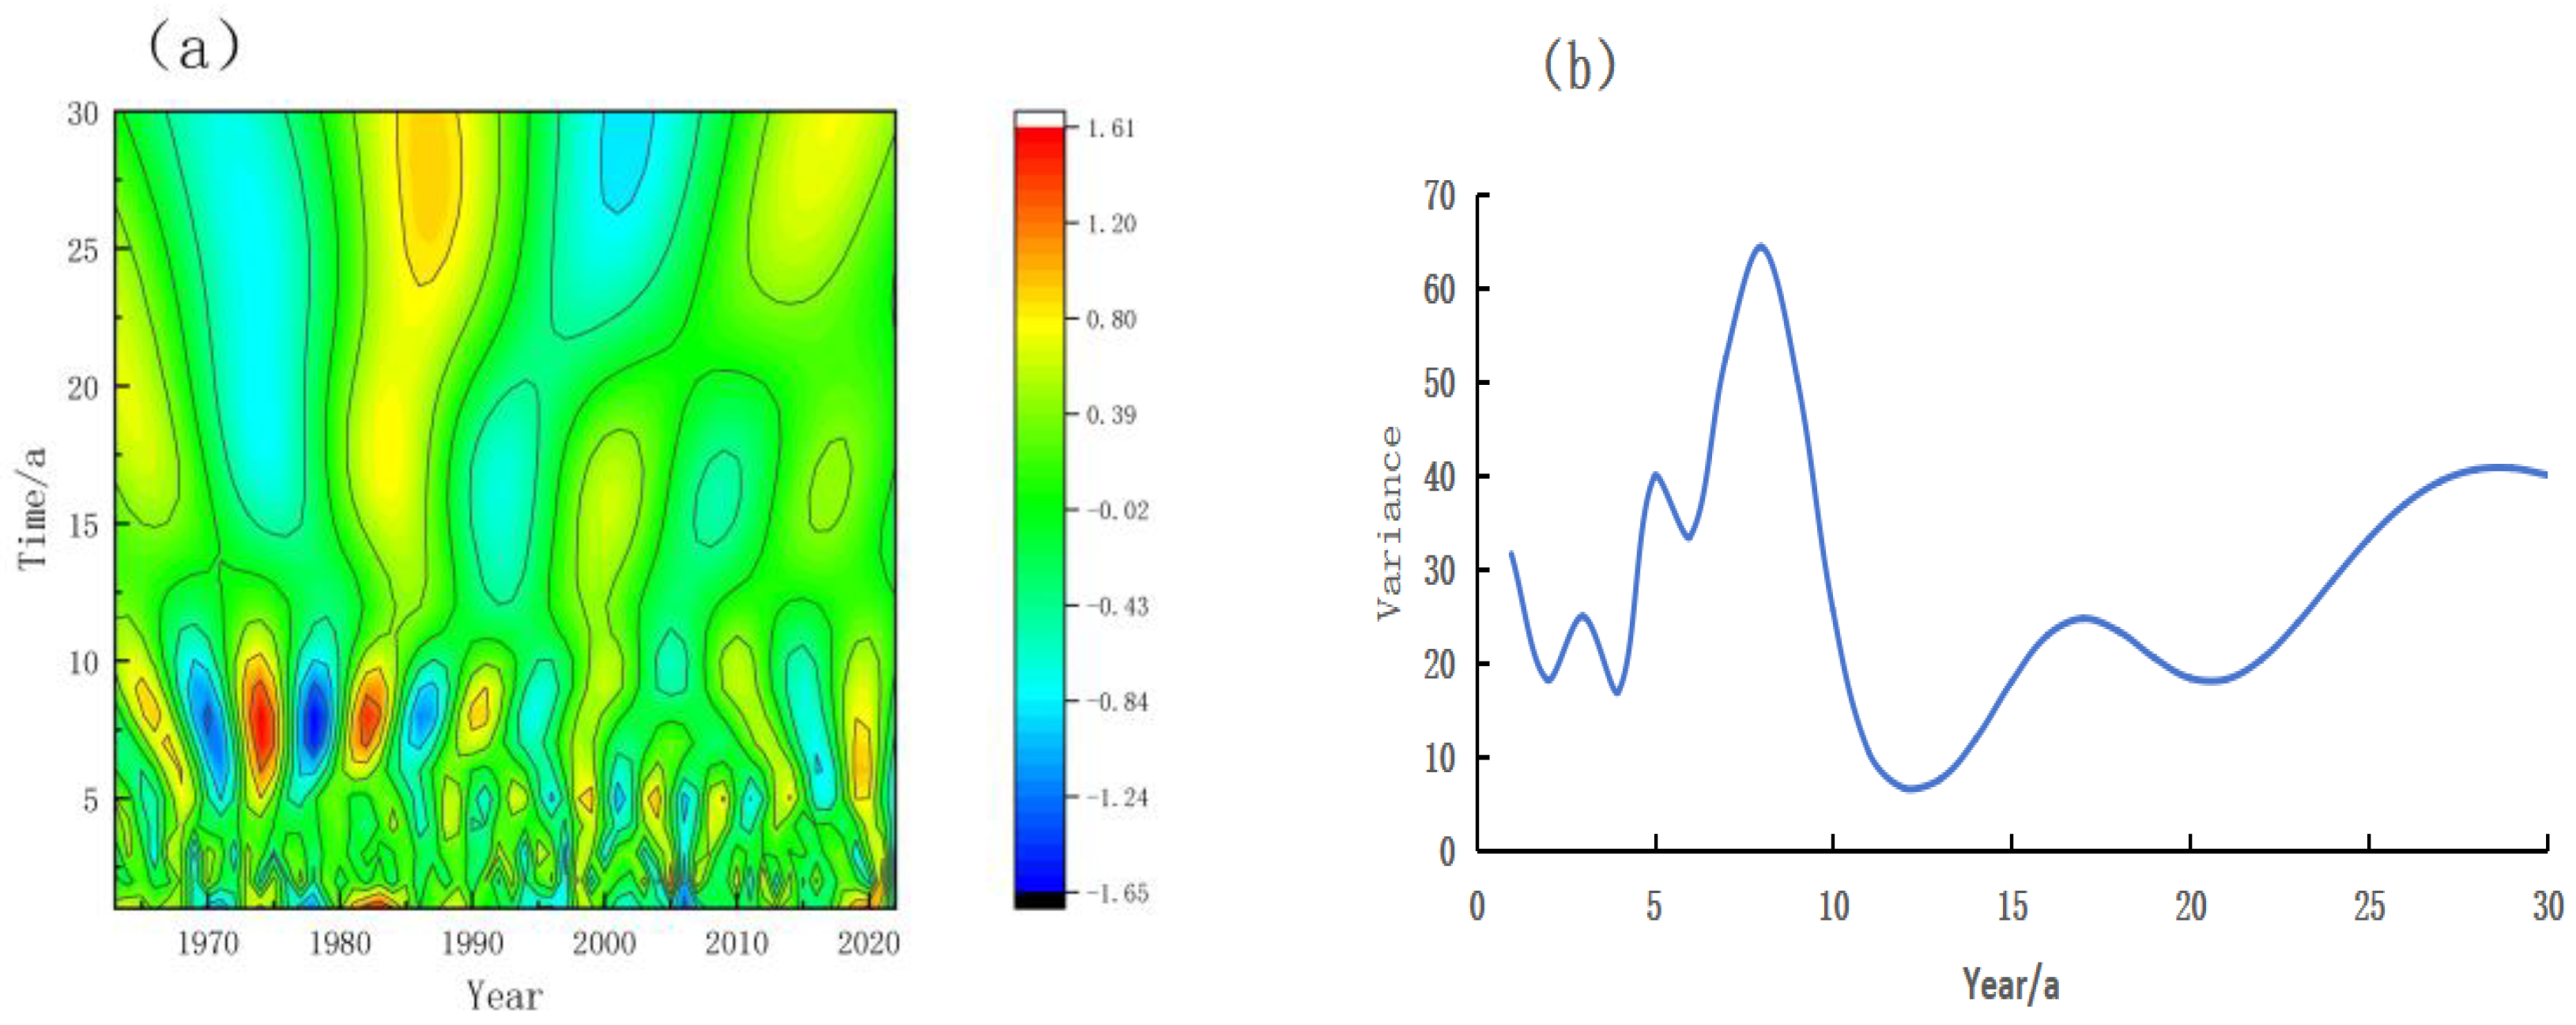
3.2.1. Interannual SPEI Cycle Change

Wavelet analysis of the annual-scale SPEI for the Sichuan Basin from 1963 to 2022 reveals two significant cycles: 5-year and 8-year cycles. This is illustrated in the solid contour map of the wavelet coefficient of the SPEI (Figure 6a). The variance diagram of wavelet coefficients (Figure 6b) further highlights that the dominant cycle is 8 years. This 8-year cycle has been consistently evident over the past 60 years but appears to have diminished in the early 21st century, with a resurgence observed after the 2010s. Additionally, the 5-year cycle has been prominent since the 1990s.

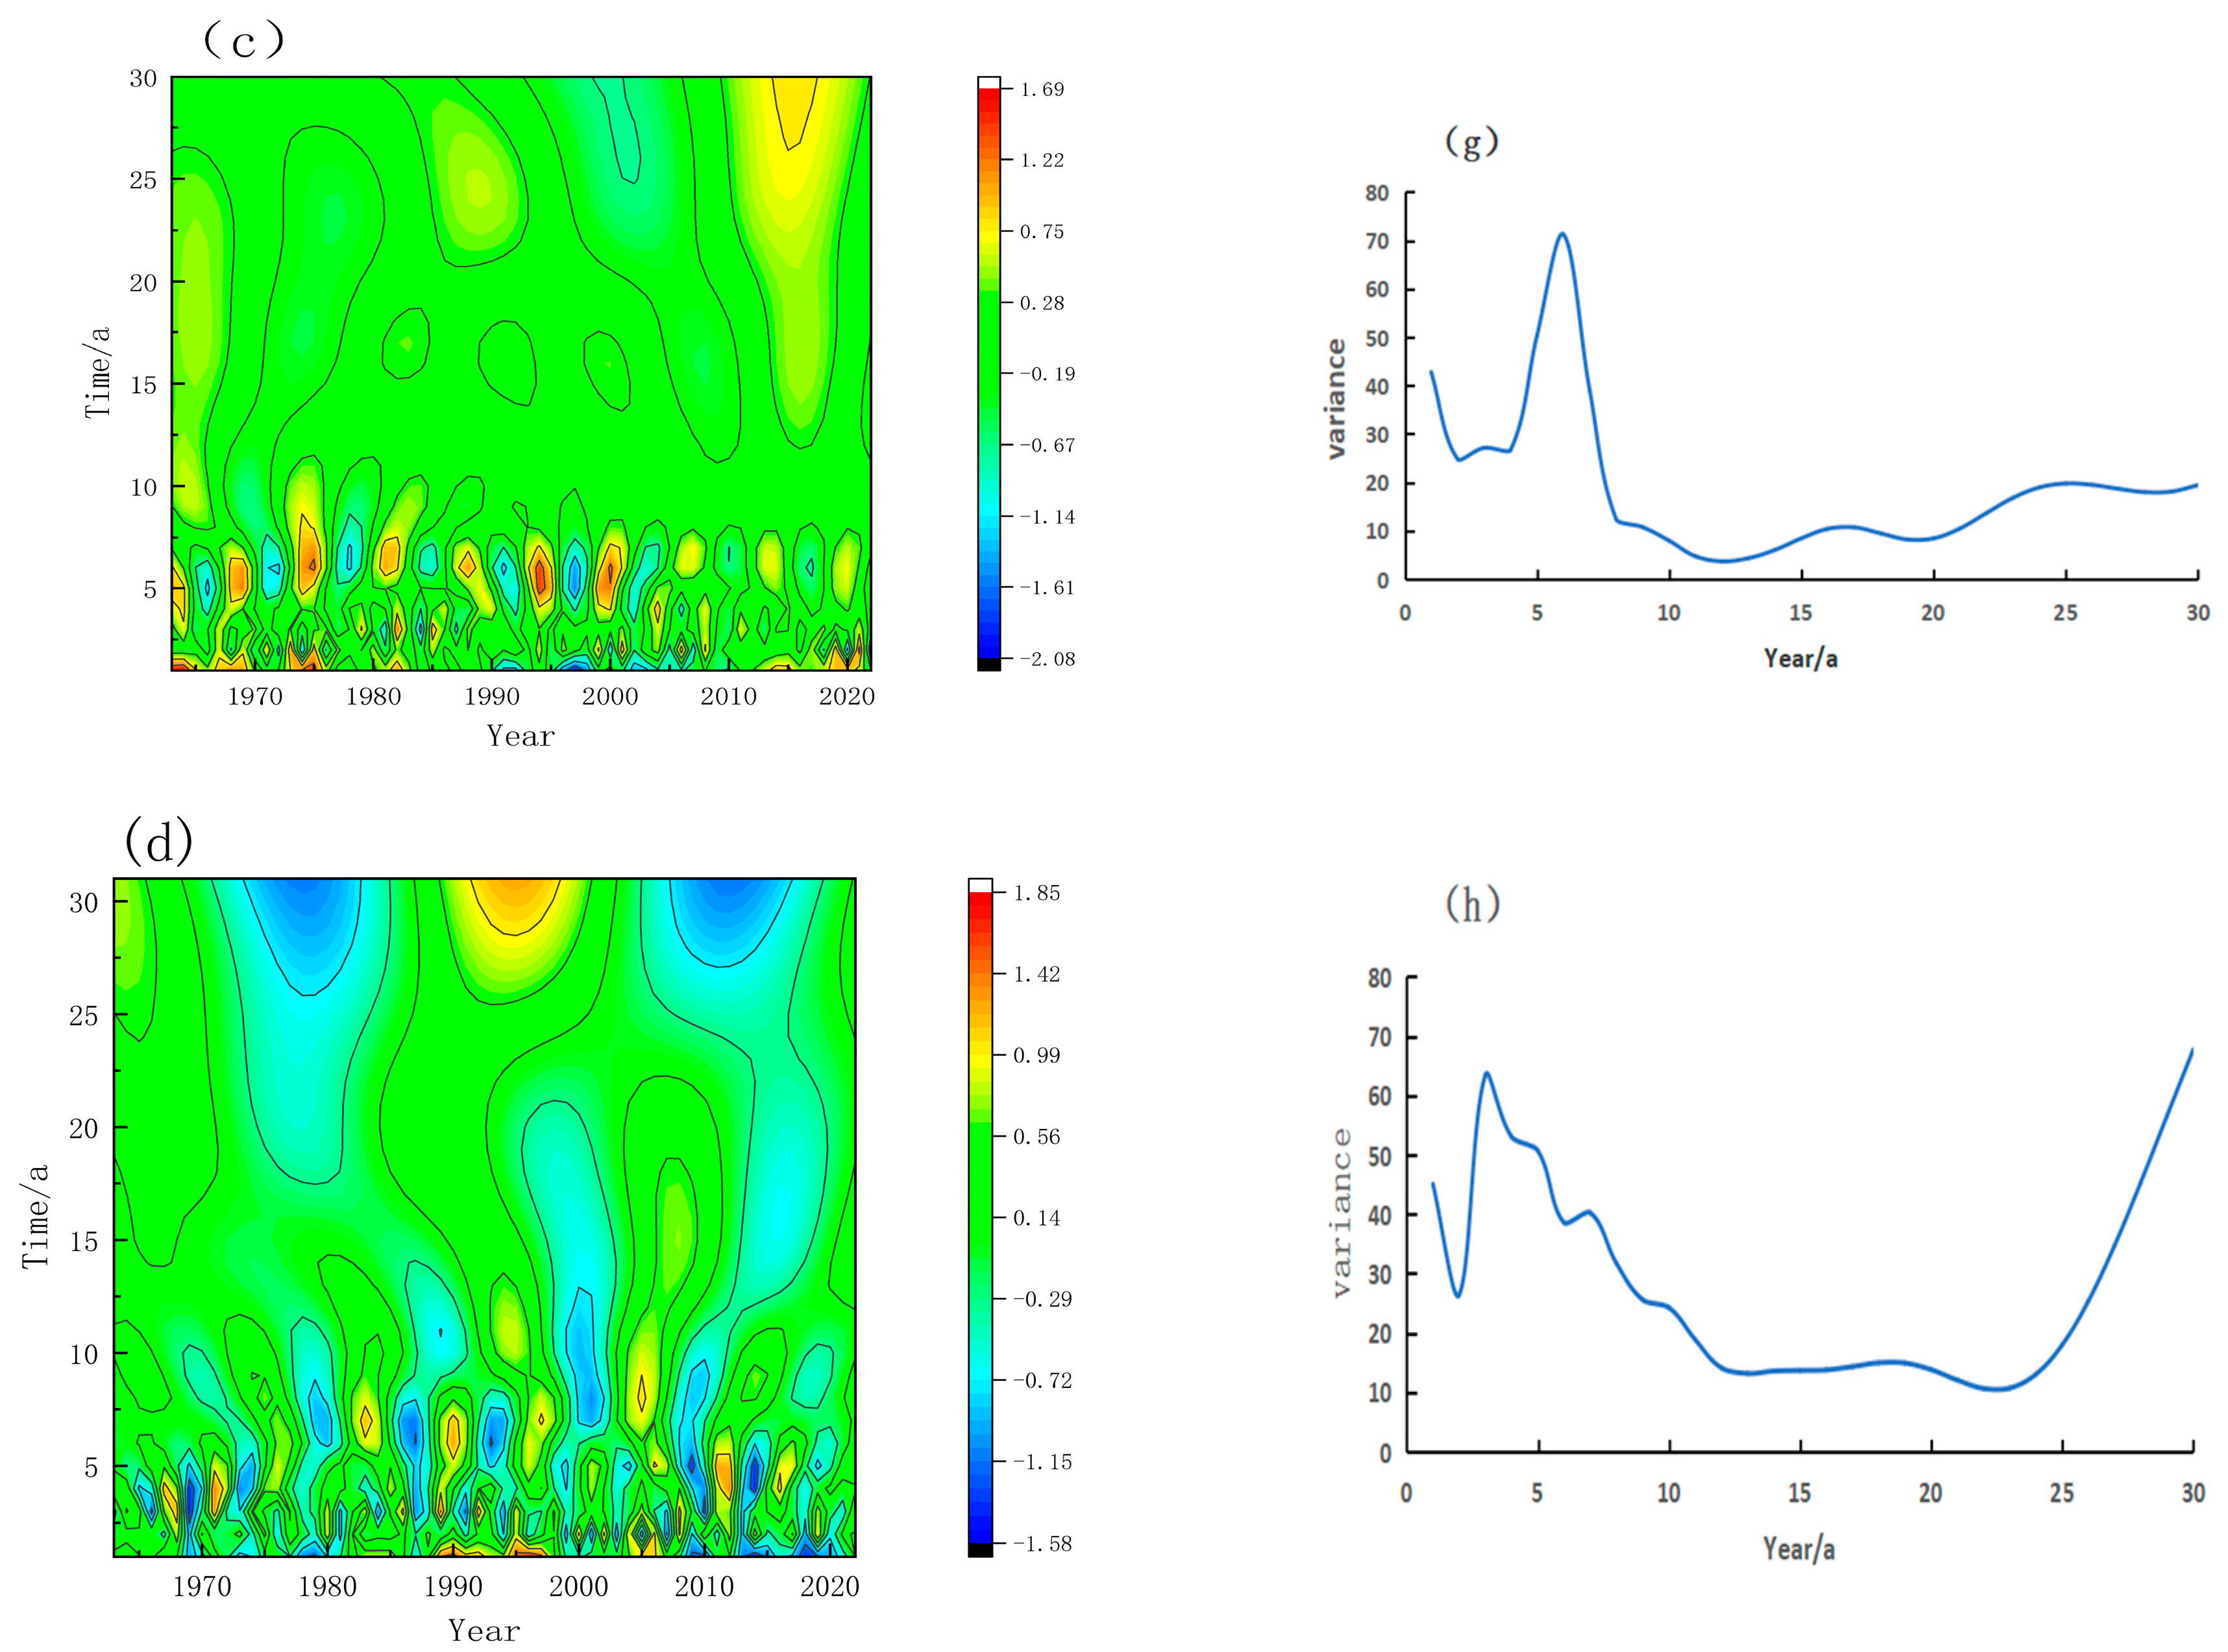
3.2.2. SPEI Periodic Change at Seasonal Scale

Figure 7 displays the contour maps of the wavelet coefficients (Figure 7a–d) and the variance in the wavelet coefficients across each season (Figure 7e–h). The variation in the SPEI cycle differs slightly across seasons. In spring, the SPEI-3 exhibits 6-year and 3-year cycles, with the 6-year cycle becoming particularly pronounced after the 1980s. During summer, SPEI-3 displays 2-, 5-, and 8-year cycles, with the 8-year cycle being dominant and consistent from 1962 to 2022. The 5-year cycle emerged post-1980s. In the fall, the SPEI reveals a distinct 6-year cycle, especially before the 2010s. In winter, SPEI-3 shows 3-year and 6-year cycles, with the 6-year cycle remaining significant throughout the period, though it has slightly weakened since 2000. In summary, from 1962 to 2022, the SPEI at the seasonal scale in the Sichuan Basin exhibited a primary 6-year cycle in spring, autumn, and winter, while the main cycle in summer aligns with the 8-year cycle observed in the annual SPEI changes.

3.3. Spatiotemporal Variation in the Number of Drought Events in the Sichuan Basin

3.3.1. Analysis of the Change in Drought Times

Drought event names are defined by the starting year of each drought event on both annual and seasonal scales. Figure 8 illustrates the number of annual-scale drought events in the Sichuan Basin from 1963 to 2022. Over the past 60 years, the basin has experienced a maximum of 28 drought events and a minimum of 12. Overall, the eastern region has experienced a higher frequency of drought events compared to the western region. In particular, the areas of Chongqing and Dazhou in the eastern part of the basin, as well as Yibin and Leshan in the south, are notable for their high incidence of drought events.
Figure 9 illustrates the station ratios for different drought levels each year. Over the past 60 years, drought has occurred annually in the Sichuan Basin; however, the proportion of sites and regions experiencing drought varies from year to year. On average, the probability of a drought-free occurrence at each station is 65%, with light and medium droughts being the most common. Specifically, 20.68% of stations experience light drought, while 11.99% experience medium drought. During atypical years, the proportion of severe drought increases. Since 1963, the highest frequency of light drought was recorded in 1969 (42.11%), medium drought in 2022 (35.09%), and severe drought in 2006 (36.84% of stations). In 2022, the drought level and extent reached their highest in the past years, with the proportion of drought-free stations dropping to its lowest. Consequently, 87.72% of the stations experienced varying degrees of drought. Studies indicate that in 2022, the Yangtze River Basin experienced intense, prolonged, and widespread drought conditions, with the Sichuan Basin facing a “once-in-a-century” drought, which extended into the spring of 2023 [36].

3.3.2. Change in Drought Times at the Seasonal Scale

On a seasonal scale, the frequency of droughts varies significantly across the Sichuan Basin. As shown in Figure 10a, the spring season experiences the highest number of droughts in Chongqing, located in the eastern part of the basin, as well as in Dazhou in the northeast, parts of Suining in the Sichuan hills, and northern Leshan. In contrast, the lowest drought frequencies are observed in the Chengdu Plain and the northwest of the study area. During summer, the highest drought incidence occurs in the northern and central regions, while the lowest frequencies are found near Tongjiang in the north. Most of the central and western areas experience minimal drought conditions during this time.
In autumn, the focus of drought activity shifts to the north and west, with reduced frequency in the northeastern and central parts of the basin. Over the past 60 years, the winter months have seen the highest drought frequencies in the western and southern parts of the basin, while Bazhong in the north and Dazhou in the northeast experience the fewest winter droughts.
Overall, the pattern of high drought frequency areas across the basin demonstrates a gradual shift with the changing seasons, moving in a counterclockwise direction from the east to the northeast, northwest, west, and south. This shifting pattern is particularly notable for its rotation around the basin’s center. Therefore, in agricultural production, it is crucial for the eastern region of the basin to prioritize water conservation and retention during the growing seasons of rapeseed, rice, and corn. Meanwhile, the western region should focus on maintaining adequate soil moisture during the growth period of winter wheat.

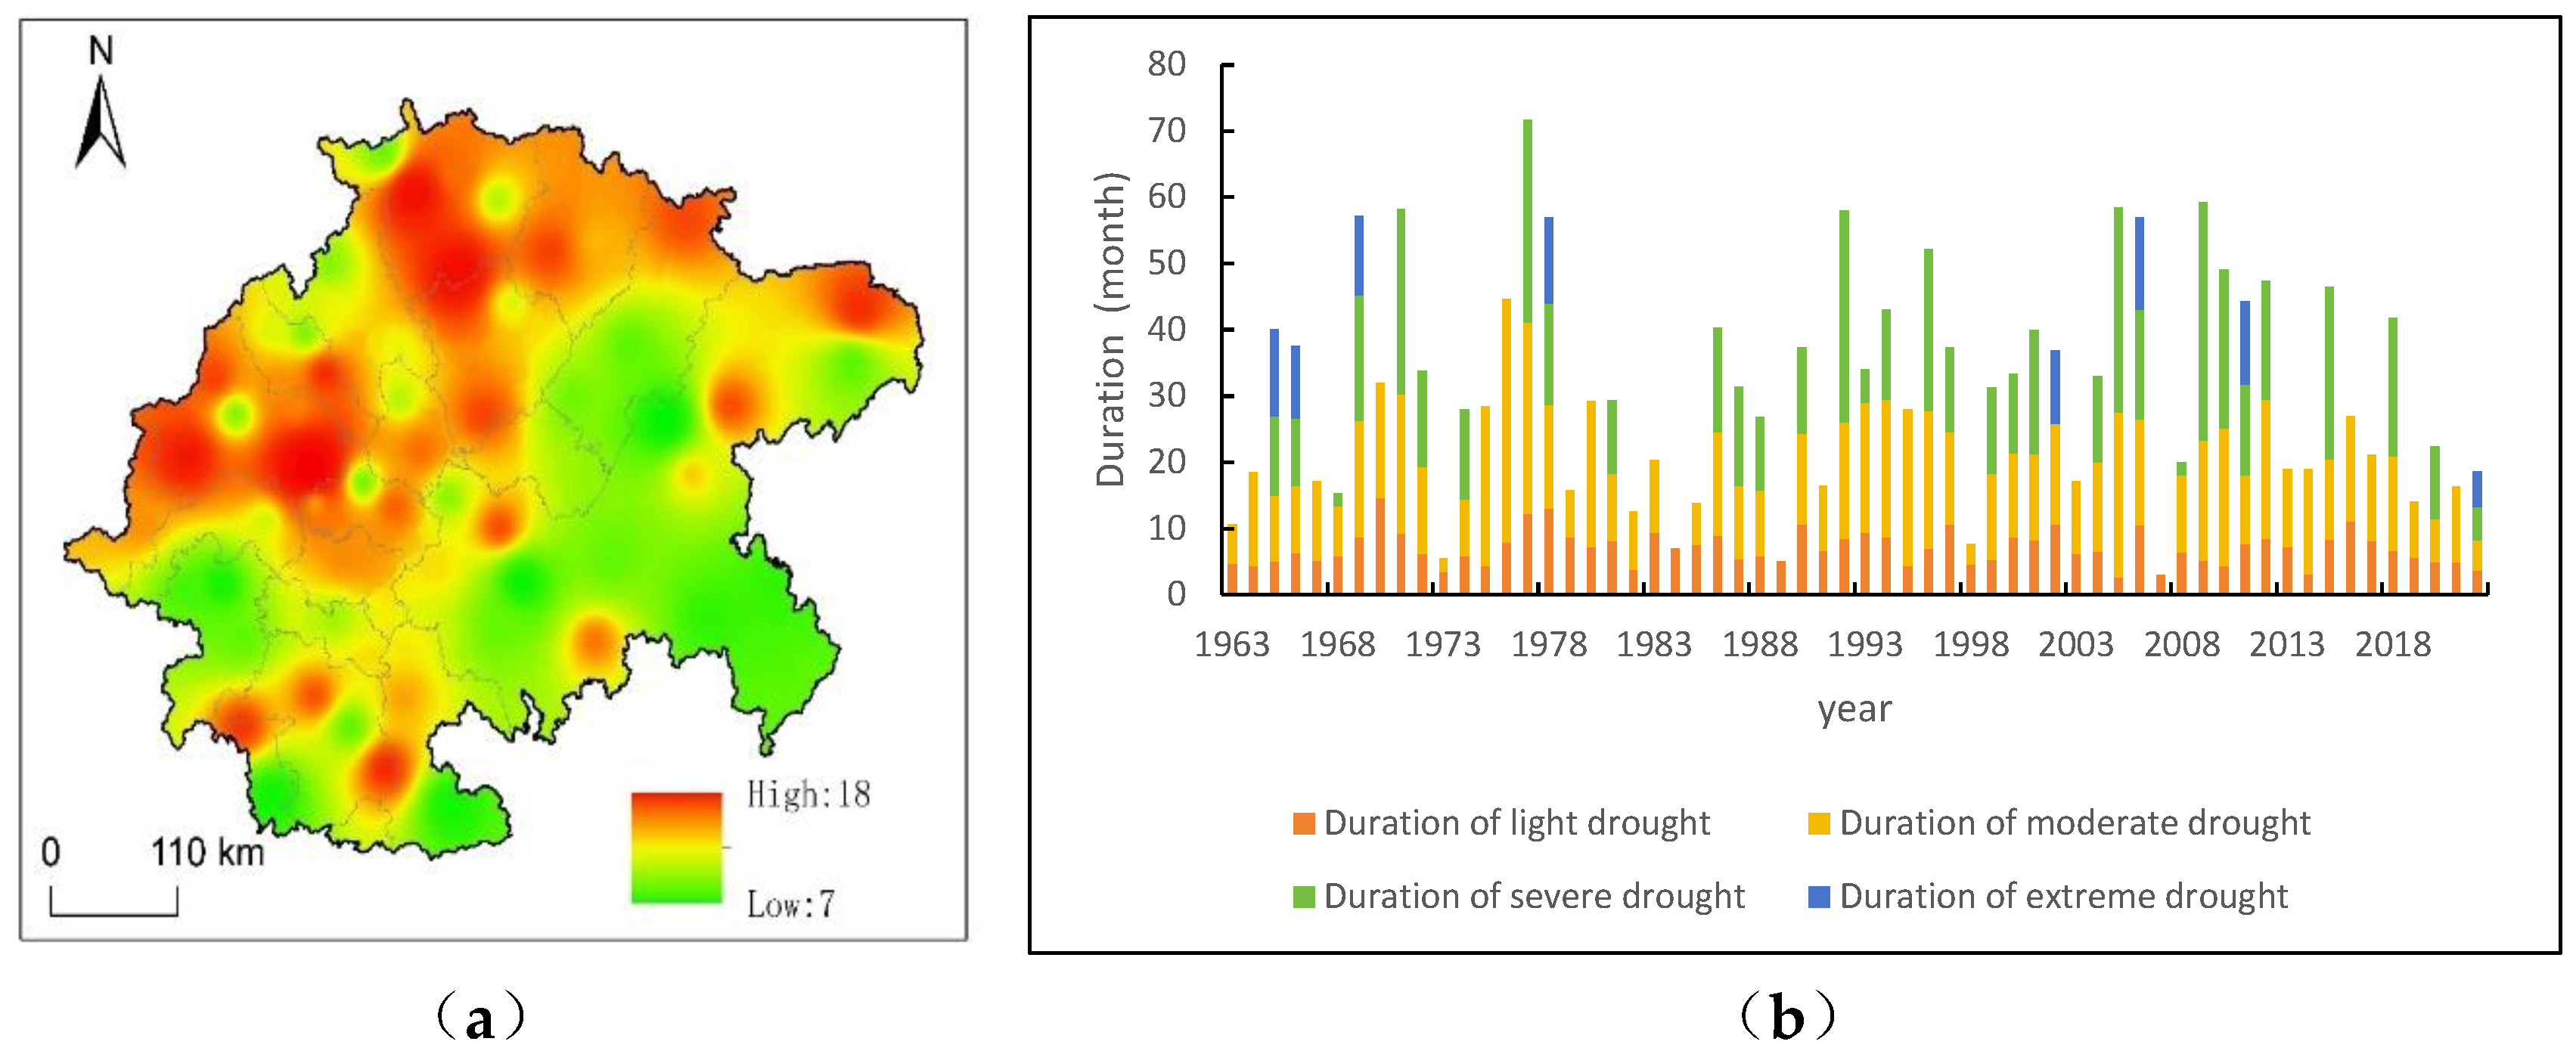
3.4. Analysis of the Temporal and Duration Changes in Drought in the Sichuan Basin

3.4.1. Spatiotemporal Analysis of Annual Drought

Figure 11 illustrates the spatial distribution of the average drought durations in the Sichuan Basin from 1963 to 2022, as measured on the SPEI-12 scale (Figure 11a), and the annual drought durations by severity. Over the past 60 years, the longest average drought durations in the Sichuan Basin reached 18 months, affecting areas such as Wuxi and Wanyuan in the northern part of the basin, Guangyuan in the northwest, and most of the Chengdu Plain. Conversely, the shortest drought durations, lasting 7 months, occurred in eastern Chongqing and eastern Yibin.
Yearly analysis (Figure 11b) reveals that the light drought event that began in 1970 lasted the longest, at 14 months. Meanwhile, the medium drought in 1976 had the longest duration, extending for 36 months. According to meteorological disaster records, the 1976 drought-impacted areas including Jiange, Bazhong, Dachuan, and Wanzhou in the northern part of the basin, with some regions experiencing drought conditions until 1979. The severe drought of 1992 had an average duration of 32 months, the longest among severe drought events. Extreme droughts were less frequent annually; however, the extreme drought in 2006 lasted an average of 14 months, the longest observed in recent years.
This study also identified variations in the mean durations of drought across different severity grades. The average duration of light droughts is 7 months, medium droughts last on average 14 months, severe droughts average 15 months, and extreme droughts last about 11 months. Although light droughts occur more frequently, they are the shortest in duration and have a relatively brief impact. In contrast, medium, severe, and extreme droughts generally last around a year, indicating a longer impact period.

3.4.2. Analysis of Seasonal Drought Duration

At the SPEI-3 scale, the variability in drought duration within the Sichuan Basin was minimal. The drought duration ranged from a maximum of 6.7 months to a minimum of approximately 2.33 months, with all instances occurring in the autumn. As illustrated in Figure 12, the drought durations in spring, summer, autumn, and winter were similar, though their spatial distributions varied. The longest spring droughts were observed in Chengdu and Meishan in the western part of the basin, Neijiang, Zigong, and certain areas of Yibin in the southern part, Gaoping and Qu County in the central region, and Wuxi and Zhong County in Chongqing. The longest autumn droughts were concentrated in two areas: one extending from the north of Chongqing to the west of Dazhou, Bazhong, and Guangyuan, and the other along the southwestern edge of the basin. In summary, the eastern part of the basin experiences prolonged drought durations across all four seasons. Therefore, it is crucial for these regions to prioritize the development of water infrastructure and effective water resource management to balance the supply and demand for water.

3.5. Analysis of Drought Severity Change in the Sichuan Basin

3.5.1. Analysis of the Change in Drought Severity and Intensity

The severity of a drought is represented by the cumulative value of the SPEI for a single event, reflecting the disaster’s absolute severity. A more negative value indicates greater severity. Drought intensity, on the other hand, is measured by the average value of the SPEI during a single event, indicating the overall severity of the drought. A lower negative value signifies a more severe drought condition overall. As illustrated in Figure 13, from 1963 to 2022, the areas with the lowest drought severity values were primarily concentrated in the Chengdu Plain and the Central Sichuan Hilly Region, including Bazhong, Guangyuan, Nanchong, Suining, and Chengdu, with the lowest recorded value reaching −21.57. Conversely, the areas with the highest drought severity values were mostly situated in the eastern part of the basin in Chongqing, the southern part of Dazhou, and the southern edge of the basin, with the highest value being −8.26. Over the past 60 years, the lowest drought intensity index, −1.19, was observed in the Chengdu Plain and much of Eastern Chongqing (Figure 13b), indicating that these regions, on average, experienced moderate drought conditions. In contrast, other regions primarily experienced light drought.

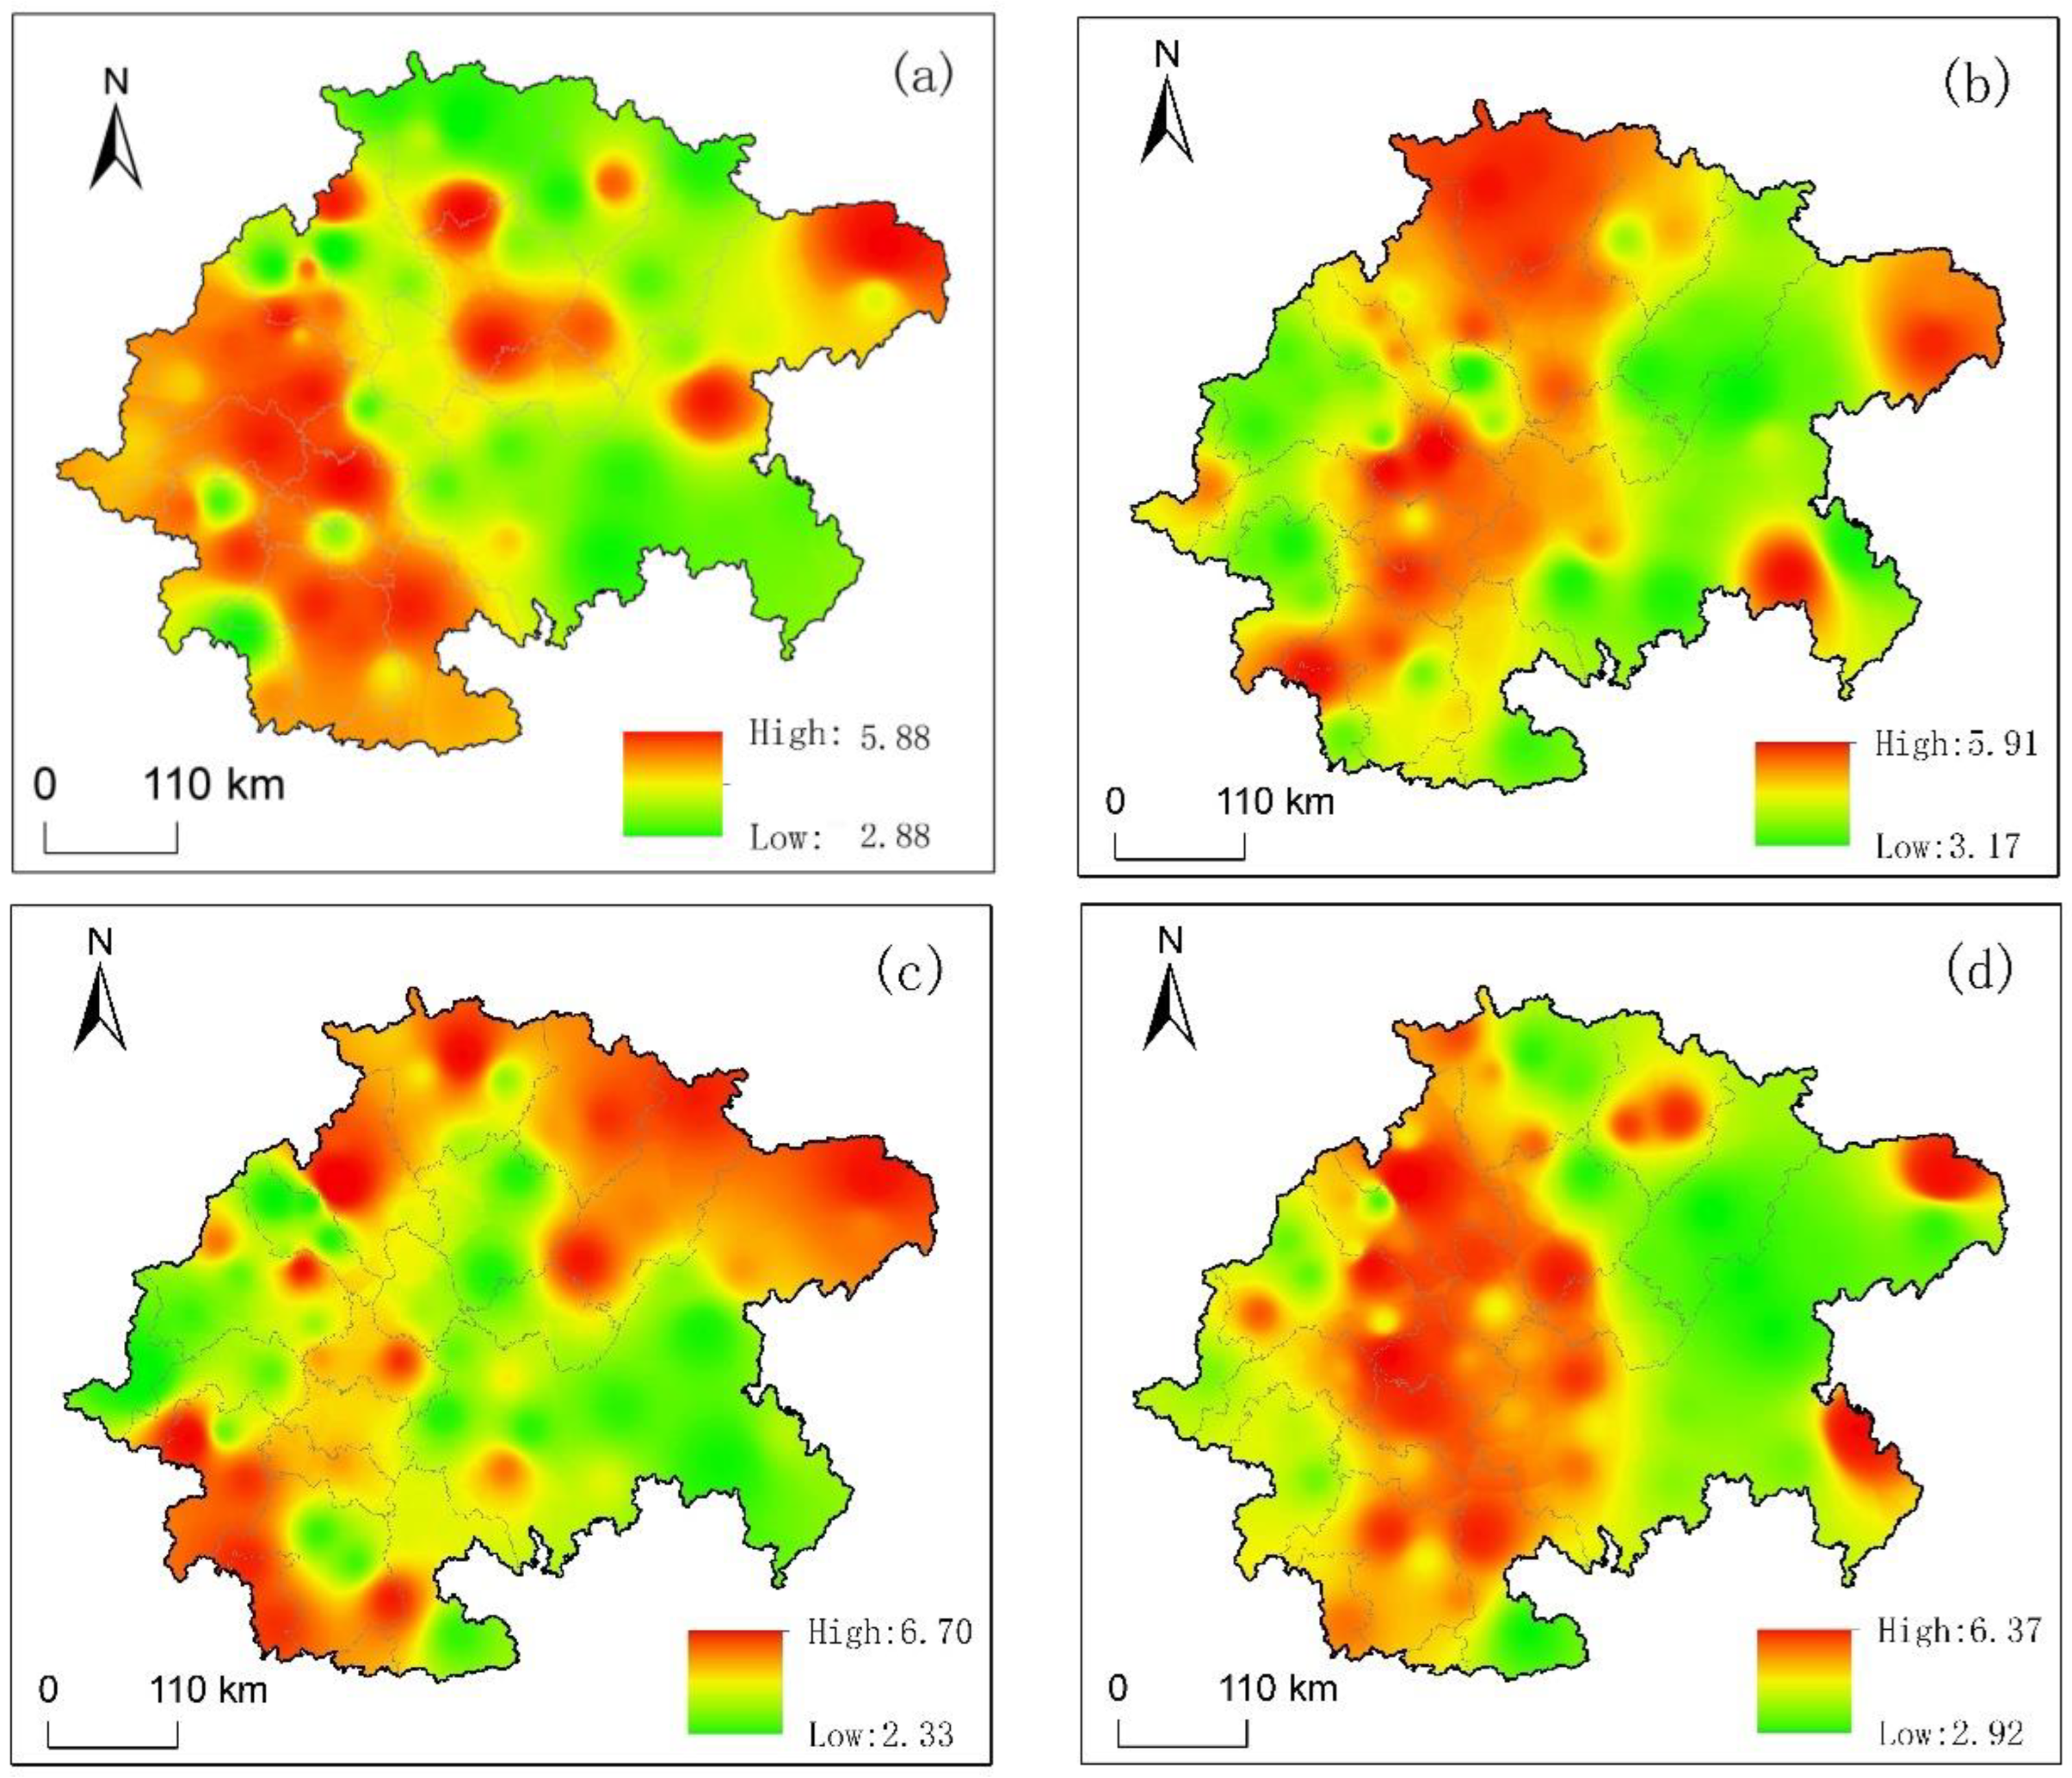
3.5.2. Spatial Variation Analysis of Drought Severity and Drought Intensity in Each Season

The spatial distribution of drought severity varies significantly across different seasons (Figure 14). During autumn (Figure 14c), the drought severity reaches its lowest value of −8.31, primarily affecting the northern regions of Zhong County, Dazhou, and Bazhong in Chongqing, as well as Leshan and Zhaotong in the southern hills of the basin. In spring (Figure 14a), drought severity peaks at −8.06 in the northern part of Fuling and Chongqing, while it is least severe at −2.54 in the southern areas of Fuling and most parts of Guangyuan. In winter (Figure 14d), the highest drought severity of −7.93 is observed in the regions south and west of Cangxi, Yilong, Qu County, Fuling, and Nanchuan. In summer (Figure 14b), the lowest severity is recorded in Dazhou, Wanzhou, Liangping, and Leshan in the southwest of the basin, whereas the highest severity, at −6.73, is found in Guangyuan in the northwest. Despite the variations, the weakest severity across all four seasons remains relatively consistent, ranging from −2.54 to −3.19.
The intensity of drought displays minimal seasonal variation (Figure 15). The highest drought intensity ranges from −1.41 to −1.30, while the lowest ranges from −0.85 to −0.98, with these values spread across different regions. In spring (Figure 15a), the most severe drought occurs in the northeastern part of the basin. However, this area experiences the weakest drought intensity during summer (Figure 15b), indicating moderate drought conditions in spring and milder conditions in summer. In autumn (Figure 15c), the highest drought intensity is recorded in Dazhou, Wanzhou, and Gulin, reaching −1.41, which is the most severe intensity noted across all four seasons. During winter (Figure 15d), the central region of Chongqing, along with Suining, Ziyang, and Neijiang in the Central Sichuan Hilly Region, and the western edge of the Sichuan Basin, experiences the most severe drought conditions. Conversely, areas such as Langzhong, Yilong, Qu County, and Wanzhou exhibit the lowest drought intensity, presenting an anomaly compared to the conditions observed in autumn.

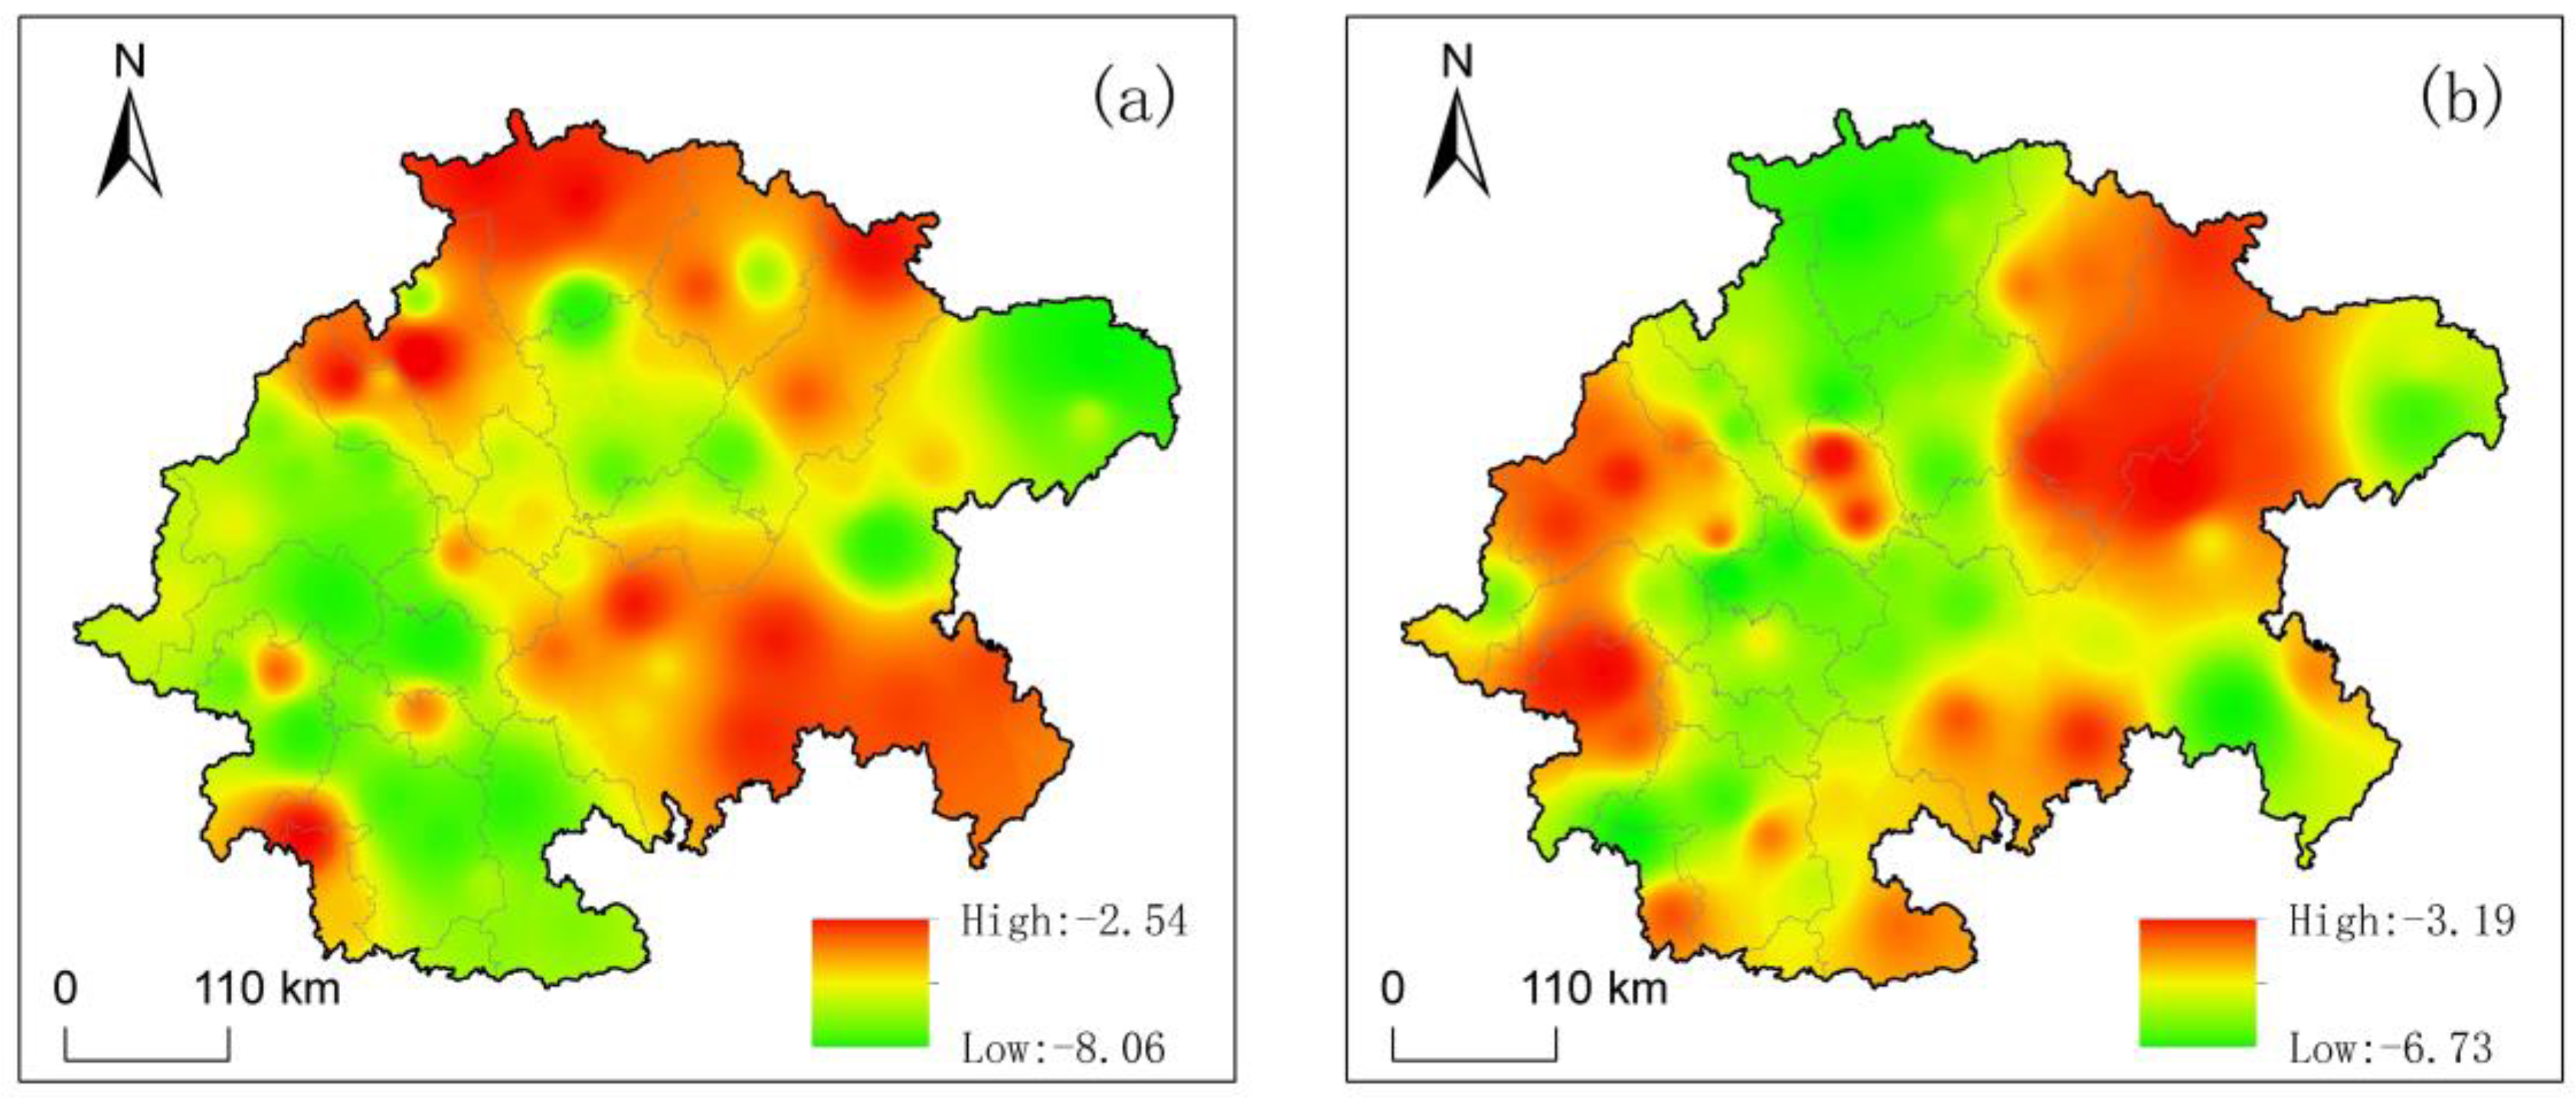
3.6. Analysis and Temporal Change in Drought Peaks in the Sichuan Basin

3.6.1. Interannual Change in Drought Peaks

Figure 16 presents two diagrams: (a) the spatial distribution of the average peak drought events at each station in the Sichuan Basin, and (b) the annual variation in peak drought events. The data show that the lowest average peak drought value is −1.70, which is primarily observed in Wanzhou, Dianjiang, Changshou, and Fuling in eastern Sichuan, and the Chengdu Plain in western Sichuan. This suggests that these areas are more susceptible to severe drought conditions.
Annually, as shown in Figure 14b, the peak drought rates in the Sichuan Basin ranged from −1 to −3.5, with a decreasing trend of −0.038 per decade, though this trend was not statistically significant. The lowest recorded drought peak in the past 60 years was −3.25 in 2006, a year marked by extreme drought in certain parts of the Sichuan Basin [49]. However, when analyzed in conjunction with the annual-scale SPEI, it is evident that the drought intensity in 2006 was only moderate overall. This discrepancy is likely due to the fact that extreme drought conditions were confined to Suining, Nanchong, and Guang’an, while the remaining regions experienced predominantly light to moderate drought.
From an interdecadal perspective, there were 39 years with drought peaks below −2. Specifically, there were 4 such years in the 1960s, 7 in the 1970s, 2 in the 1980s, 8 in the 1990s, 9 in the 2000s, and 9 in the 2010s up to 2022. These data indicate an increasing frequency of severe drought events in the Sichuan Basin since the beginning of the 21st century.

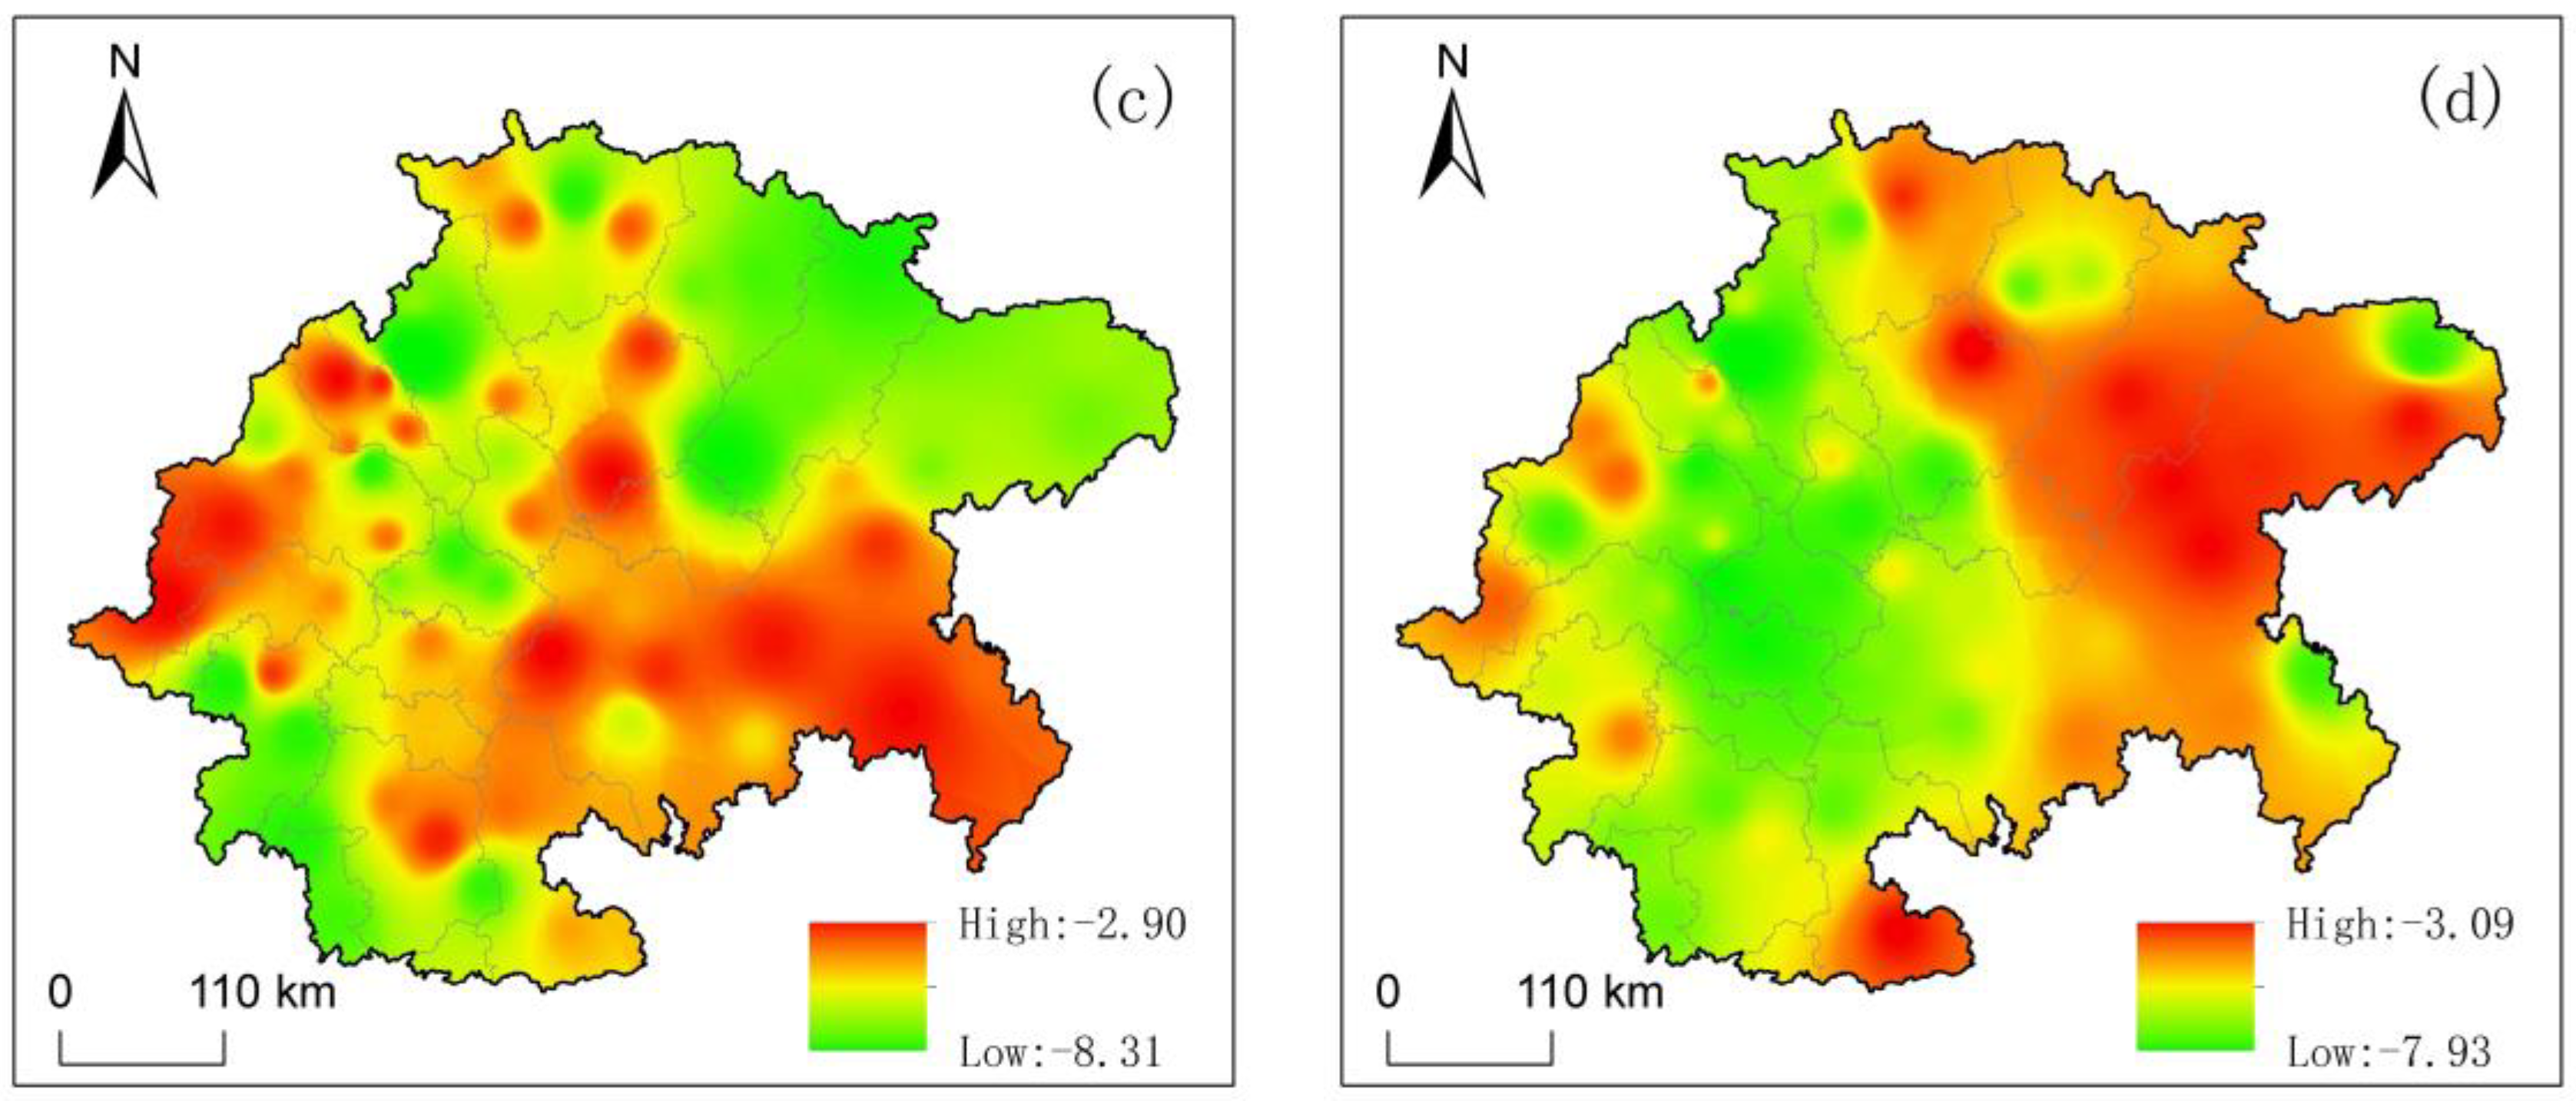
3.6.2. Analysis of Variation in Peak Drought in Four Seasons

The differences between the low and high values of drought peaks across different seasons are not significant; however, some variations in spatial distribution are evident. The lowest drought peak values are observed in autumn (Figure 17c), primarily in regions such as Qu County, Guang’an, Ziyang, Muchuan, and Pingshan, with the lowest peak value reaching −2, indicating an extreme drought level. In spring (Figure 17a), the lowest drought peak value is −1.92, found in the northern part of Chongqing and the southern end of Luzhou. The highest peak value of −1.00 is observed in Qingchuan, Jiangyou, and Jiange in the northwestern part of the basin. In summer (Figure 17b), this northwestern region experiences relatively lower drought peak values. Additionally, the eastern end of Chongqing, including Wulong, Pengshui, and Youyang, also shows lower peak values in summer, reaching −1.71. In winter (Figure 17d), the lowest drought peak value is −1.78, occurring in the northeastern part of the basin, specifically in Wanquan, with lower peak values also observed in Suining, Ziyang, and Neijiang.

4. Discussion

The SPEI is utilized to analyze drought characteristics in the Sichuan Basin. The findings reveal a general trend toward milder drought conditions since 1963, with a particularly notable increase in autumn droughts across all four seasons. This finding aligns with the conclusions of Zhang et al. [32,50]. In contrast, Zhang’s study indicates a persistent trend of dryness throughout all seasons in the Sichuan Basin, although the summer dryness is less pronounced. This finding differs from the humidification trend observed in the summer reported in the current study. The discrepancy may be due to differences in research scope: Zhang et al.’s [50] study concentrates on specific areas within the Sichuan Basin, whereas this study provides an analysis encompassing the entire basin. Furthermore, Zhang et al. [32] utilized the Thornthwaite method to calculate potential evapotranspiration, while this study employs the Penman–Monteith algorithm. Research shows that the method used to calculate potential evapotranspiration can significantly impact the Standardized Precipitation Evapotranspiration Index (SPEI) results; the Thornthwaite method tends to overestimate potential evapotranspiration, while the Penman–Monteith algorithm produces results that more accurately reflect actual evapotranspiration [51]. In a study of drought characteristics in Chongqing, Song et al. observed an overall increase in drought severity at the annual scale. The other three seasons also showed a drying trend, except for summer, which is consistent with the findings reported in Reference [52]. The primary factors contributing to the intensification of drought in the eastern part of the basin are increased evaporation due to seasonal warming and a decreasing trend in rainfall [26].
Liao et al.’s [53] study on flood disasters in the eastern Sichuan Basin identified clear cycles of approximately 6 years in both spring and autumn, which aligns with the conclusions of this paper. However, the observed variation cycles for drought and flood in summer and winter differed from the 8-year and 6-year cycles proposed here. Liao et al. suggested that the short-term cycles in these seasons demonstrated less regularity, with more consistent patterns emerging when the observation period exceeded 10 years. These discrepancies may be attributed to differences in the scope and time frame of the studies. Additionally, variations in research methodologies might also contribute to the differences observed in the drought and flood cycles [34].
There are notable differences in the frequency, duration, and intensity of drought events across various regions and seasons within the Sichuan Basin. The findings reveal that the eastern part of the basin experiences shorter average drought durations, which may be attributed to the high frequency of droughts in this area, though these are generally mild [52]. Consequently, in these regions, water storage and conservation should be considered regular government responsibilities.
Wang et al. observed that the annual drought intensity in the Central Sichuan Hilly Region is primarily moderate. Winter experiences the highest frequency of droughts, predominantly light, followed by summer, which sees the most frequent medium droughts. In contrast, autumn and spring have the fewest drought occurrences [54]. This observation aligns with the spatial distribution of drought intensity in these hilly areas, confirming that winter is the peak season for droughts. However, there are slight variations in drought severity across different seasons. In this study, mild and moderate droughts are the predominant conditions in winter in the hilly areas of central Sichuan.
The issue of drought peaks has been relatively underexplored in the existing literature. This study identifies a trend of insignificant decline in drought peaks within the Sichuan Basin, consistent with the findings of Zhang and He, who reported an increase in extreme drought frequency in southwestern China [29,32]. This study, however, emphasizes more severe drought conditions. Factors such as changes in sea surface temperatures in the tropical Pacific and Indian Oceans, along with the weakening of the southwest monsoon, may contribute to the rise in extreme droughts in this region [55]. The significant increase in extreme drought peaks since 2000 suggests a potential trend toward more severe drought disasters in the Sichuan Basin, which could pose significant challenges to agricultural production and water conservation efforts. This area warrants further investigation in future research.
Tan and colleagues utilized a weighted comprehensive analysis method to assess the spatiotemporal coupling of drought risk in the Sichuan Basin. Their findings indicate that, in the time-invariant dimension, areas with high drought risk are predominantly located in the central and eastern parts of the basin. These regions are characterized by low precipitation, a high proportion of cultivated land, and insufficient vegetation cover. On the other hand, in the time-variant dimension, high-risk areas are mainly concentrated in the northeastern part of the basin, largely due to lower average precipitation and GDP levels in that region [27].
Meteorological droughts can escalate into hydrological droughts, which adversely affect both production and daily life [56]. The Sichuan Basin, as a major commodity grain base in China, is vital for agricultural development. However, frequent droughts and their extensive impacts increase the uncertainty of agricultural production in the region. Enhancing agricultural water conservancy infrastructure is critical to building resilience against drought disasters. Effective drought mitigation or prevention relies on robust water management practices, including the construction of water conservancy projects, strengthening drought resistance capabilities, and promoting water-saving technologies. These measures can improve the utilization of natural precipitation and enhance the flood control and drought resistance functions of reservoirs, thus better preparing the region to manage extreme weather events.

5. Conclusions

This paper investigates the spatial and temporal changes in drought across the Sichuan Basin using different time scales of the SPEI from 1963 to 2022. The main conclusions are as follows:
(1)
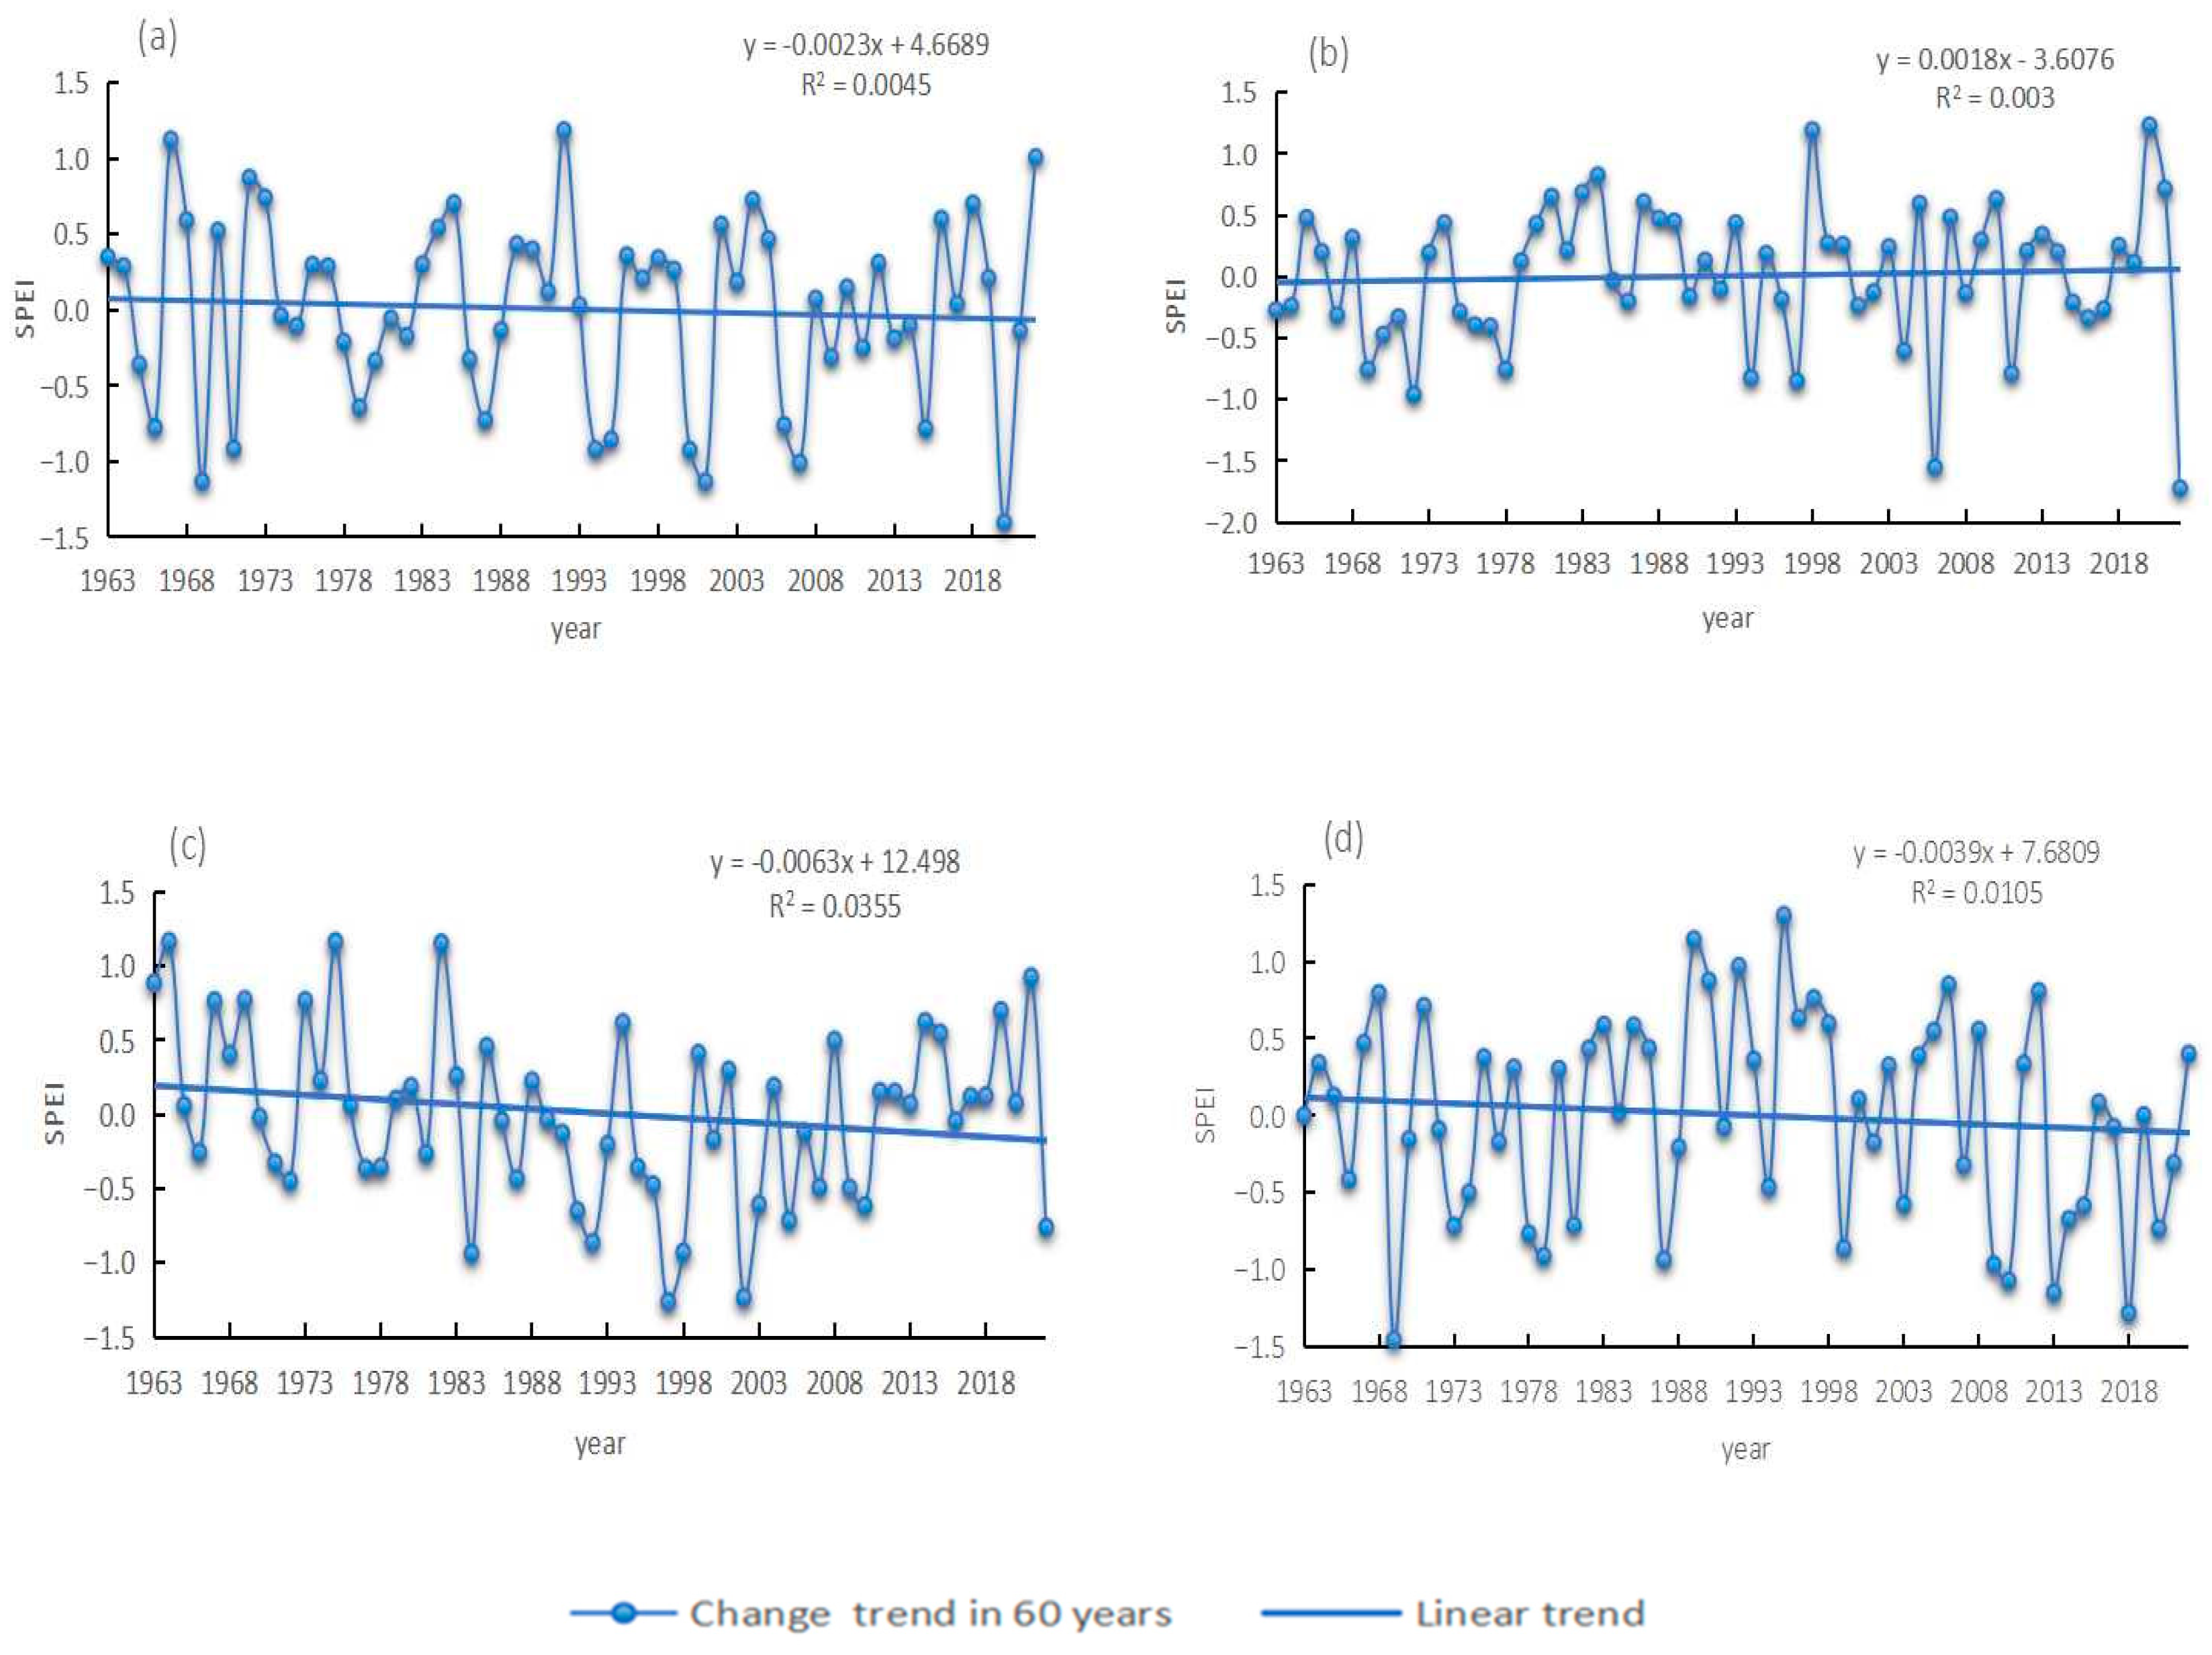
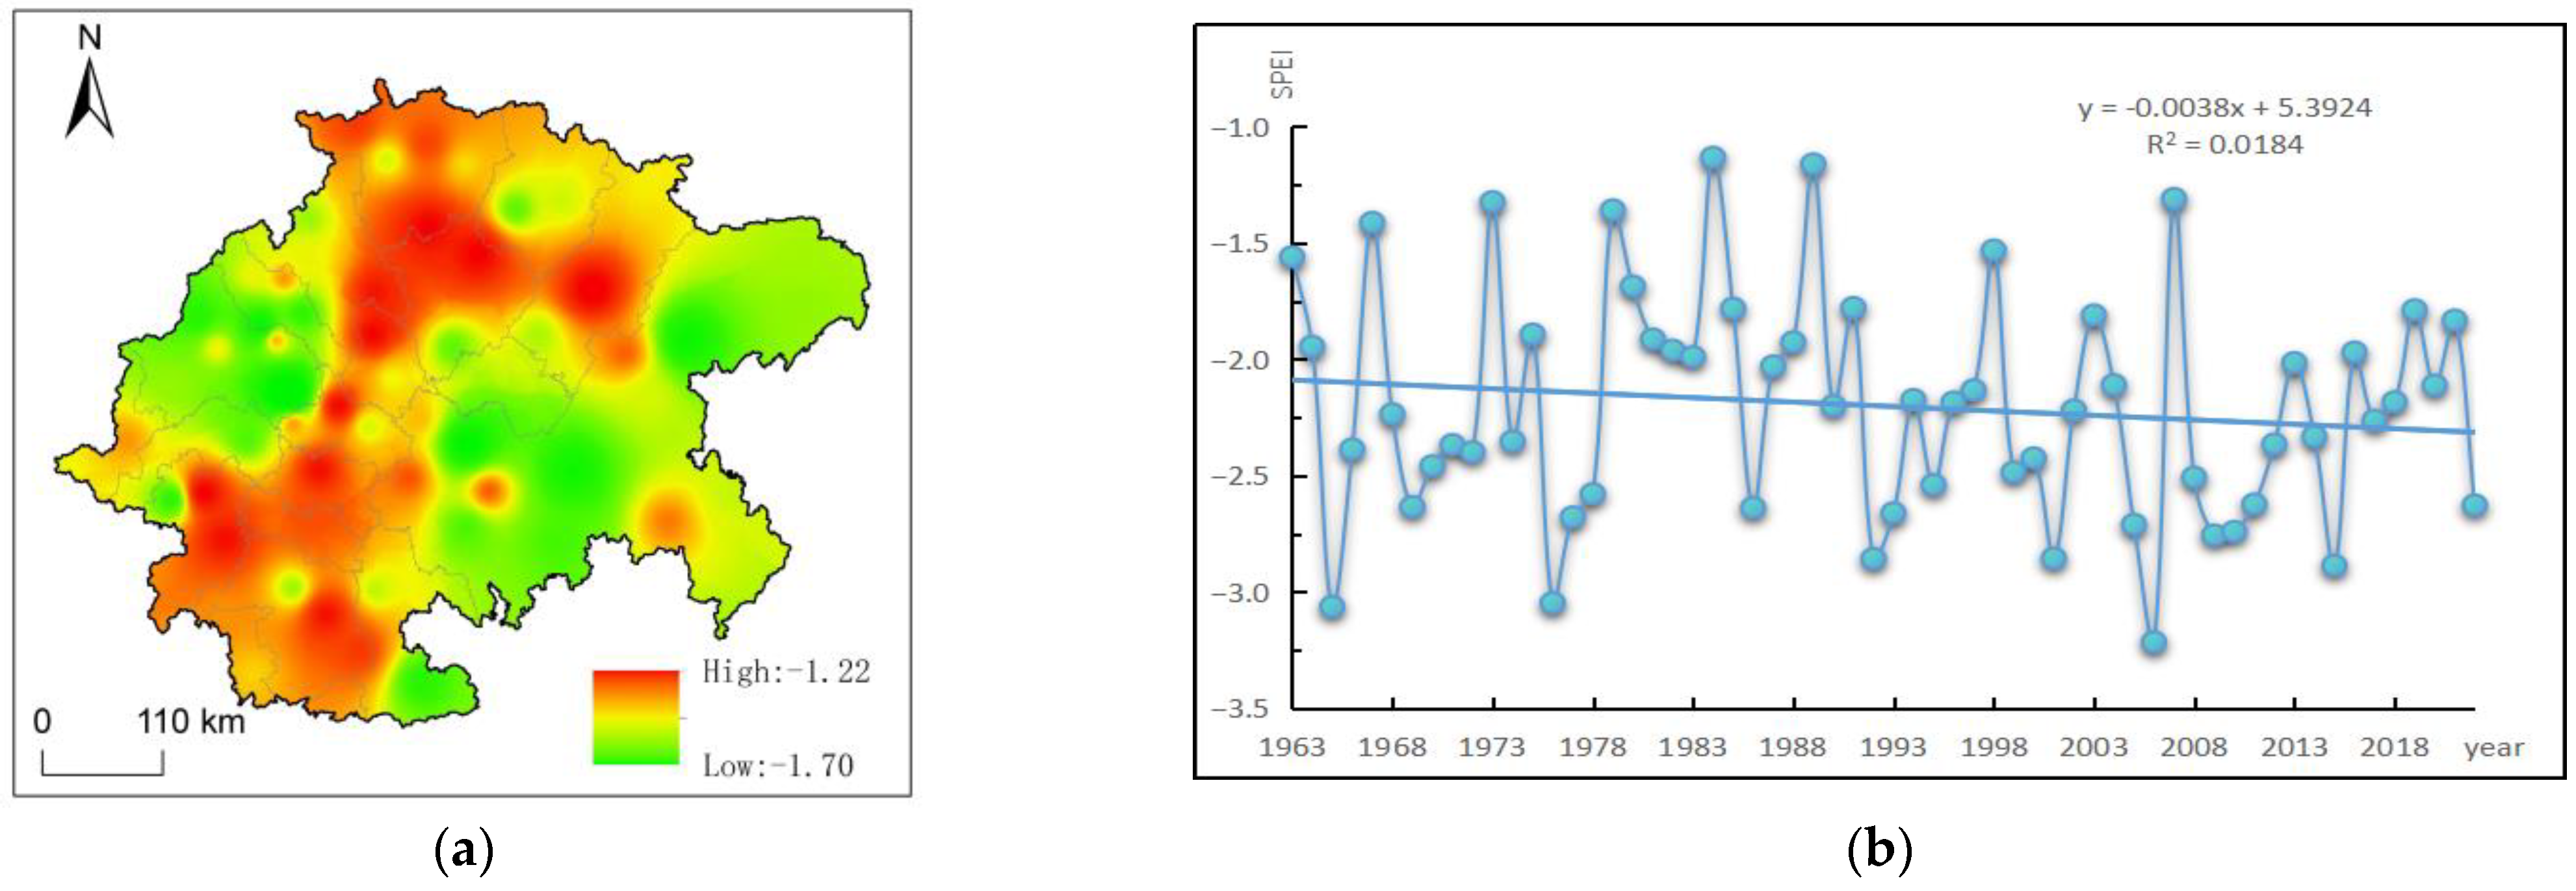
Between 1963 and 2022, the SPEI drought index for the Sichuan Basin fluctuated between −1.5 and 1, with a linear trend rate of −0.02 per decade. However, this downward trend was not statistically significant. The SPEI generally decreased in the Sichuan Basin, except during summer, with a notable downward trend observed in autumn (p < 0.05). Over the past 60 years, the seasonal SPEI in the Sichuan Basin has shown distinct cycles: a primary 6-year cycle in spring, autumn, and winter, and an 8-year cycle in summer.
(2)
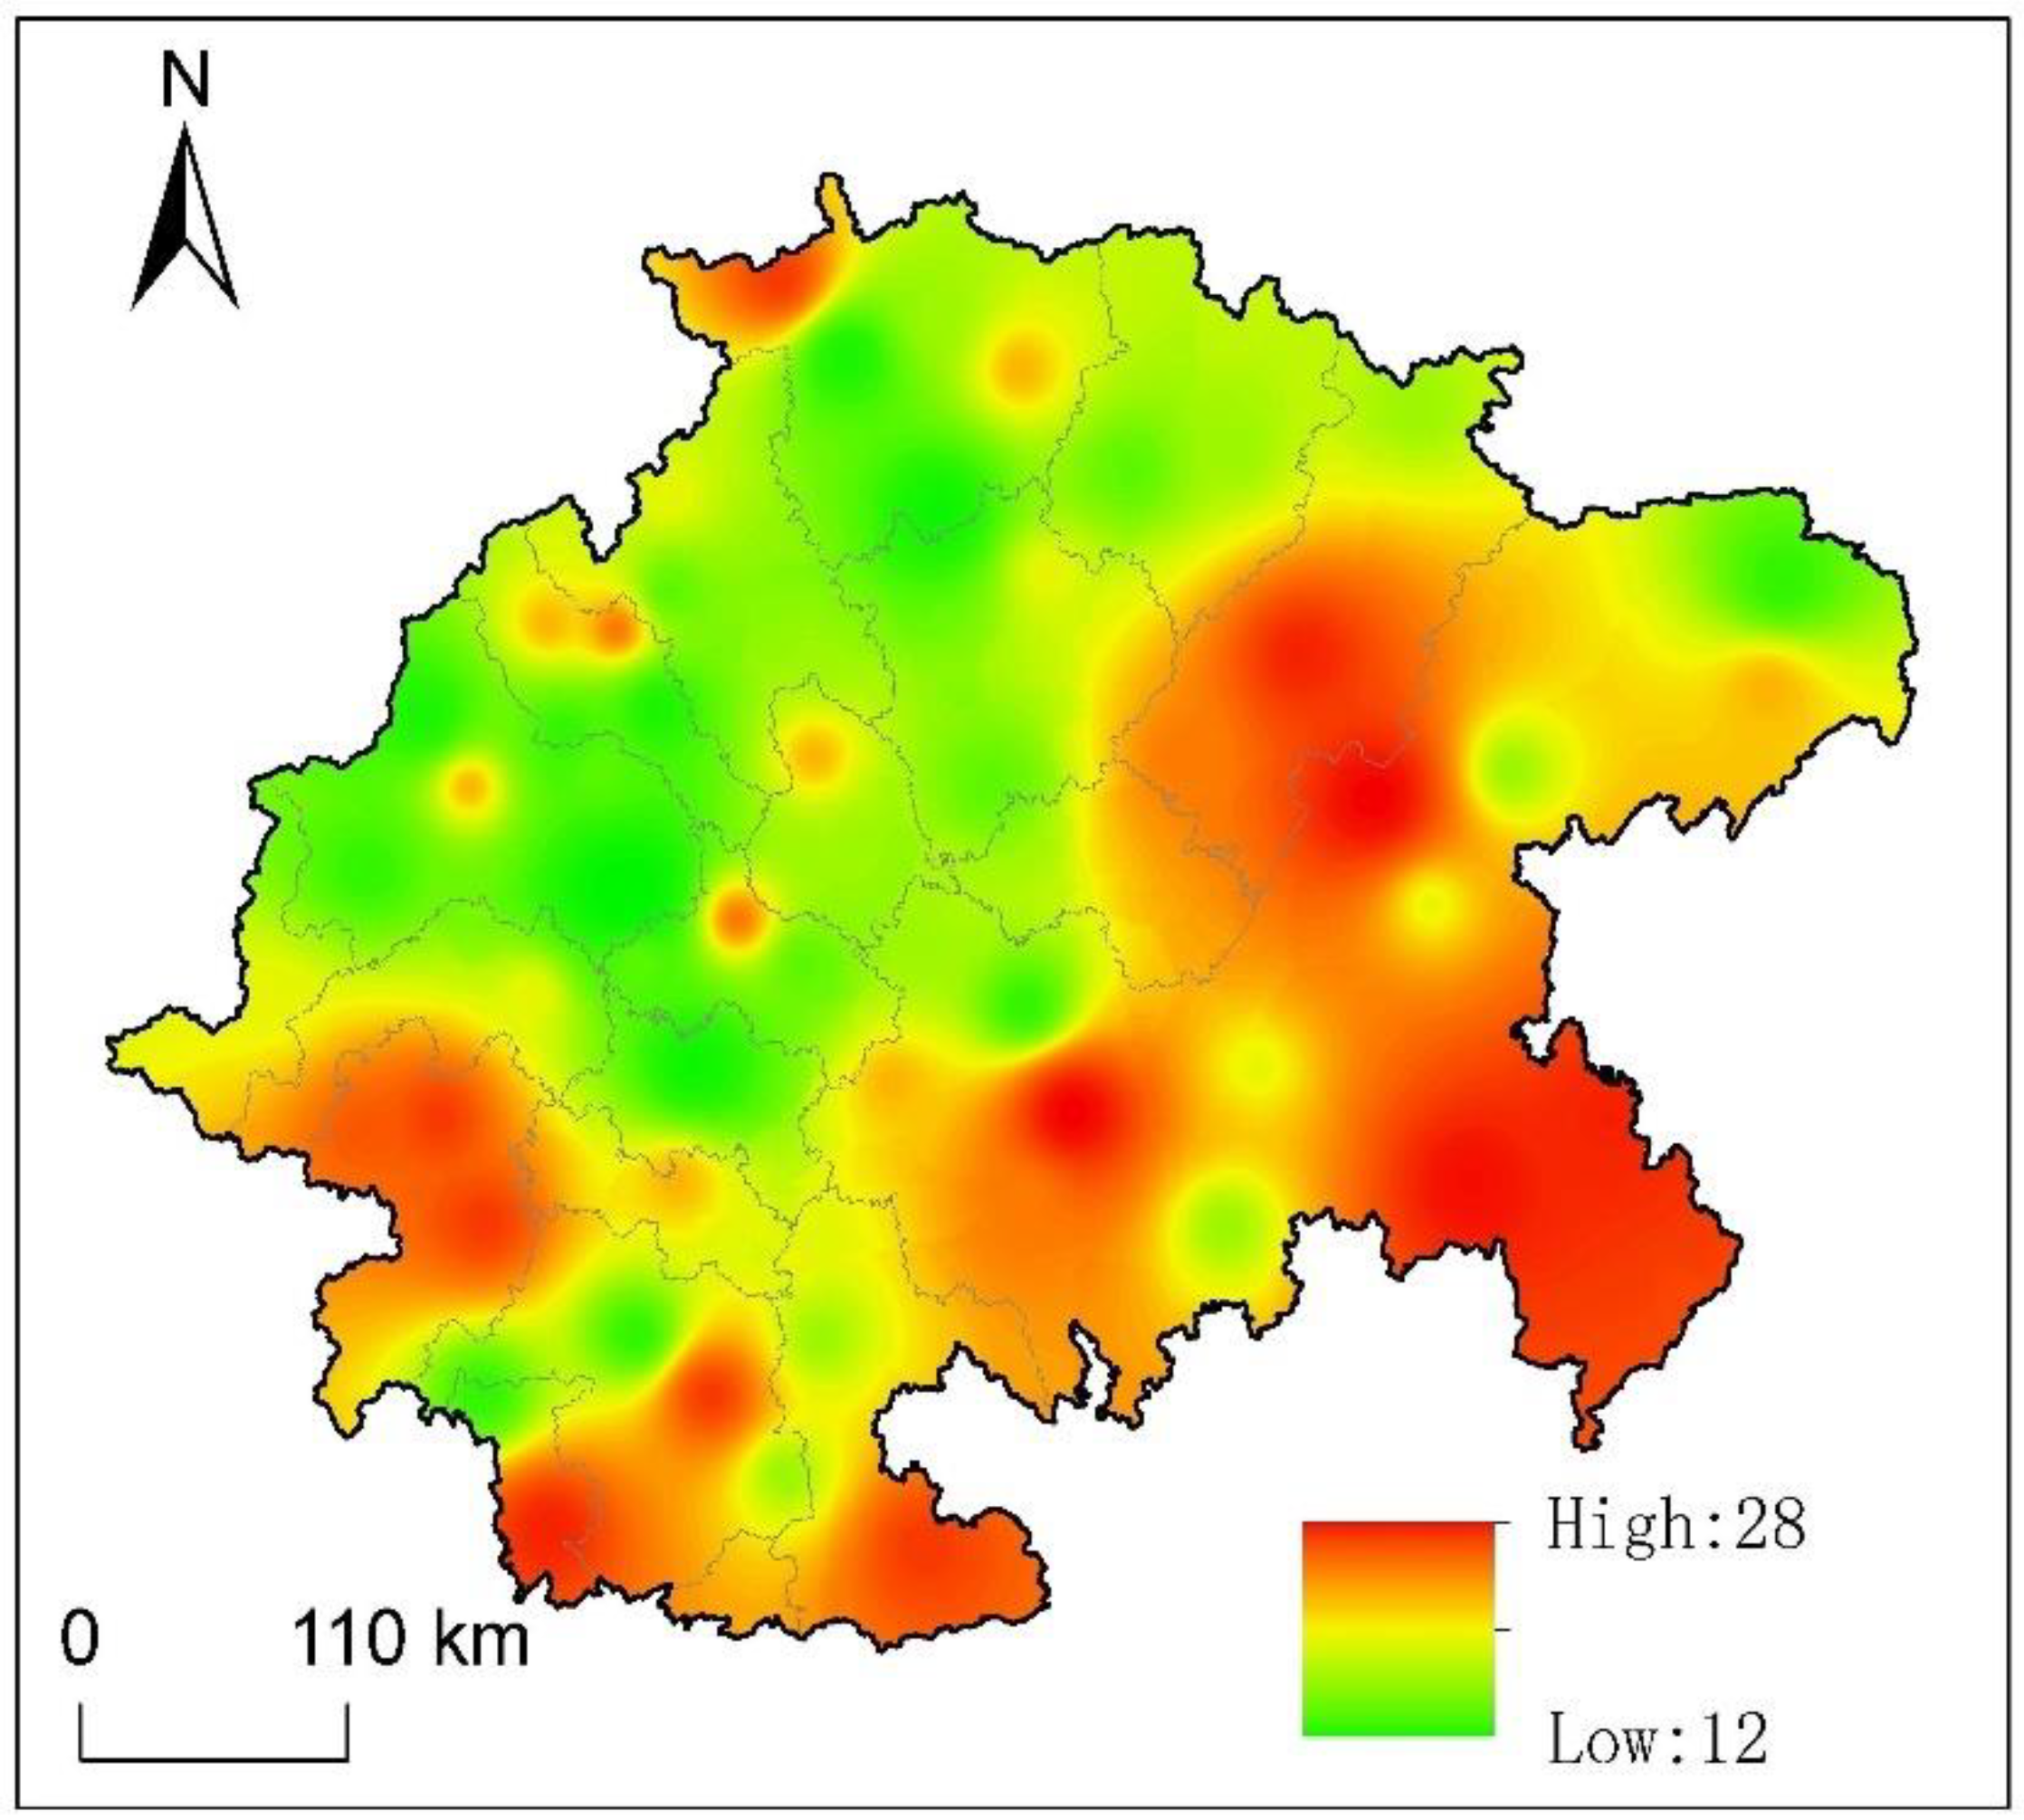
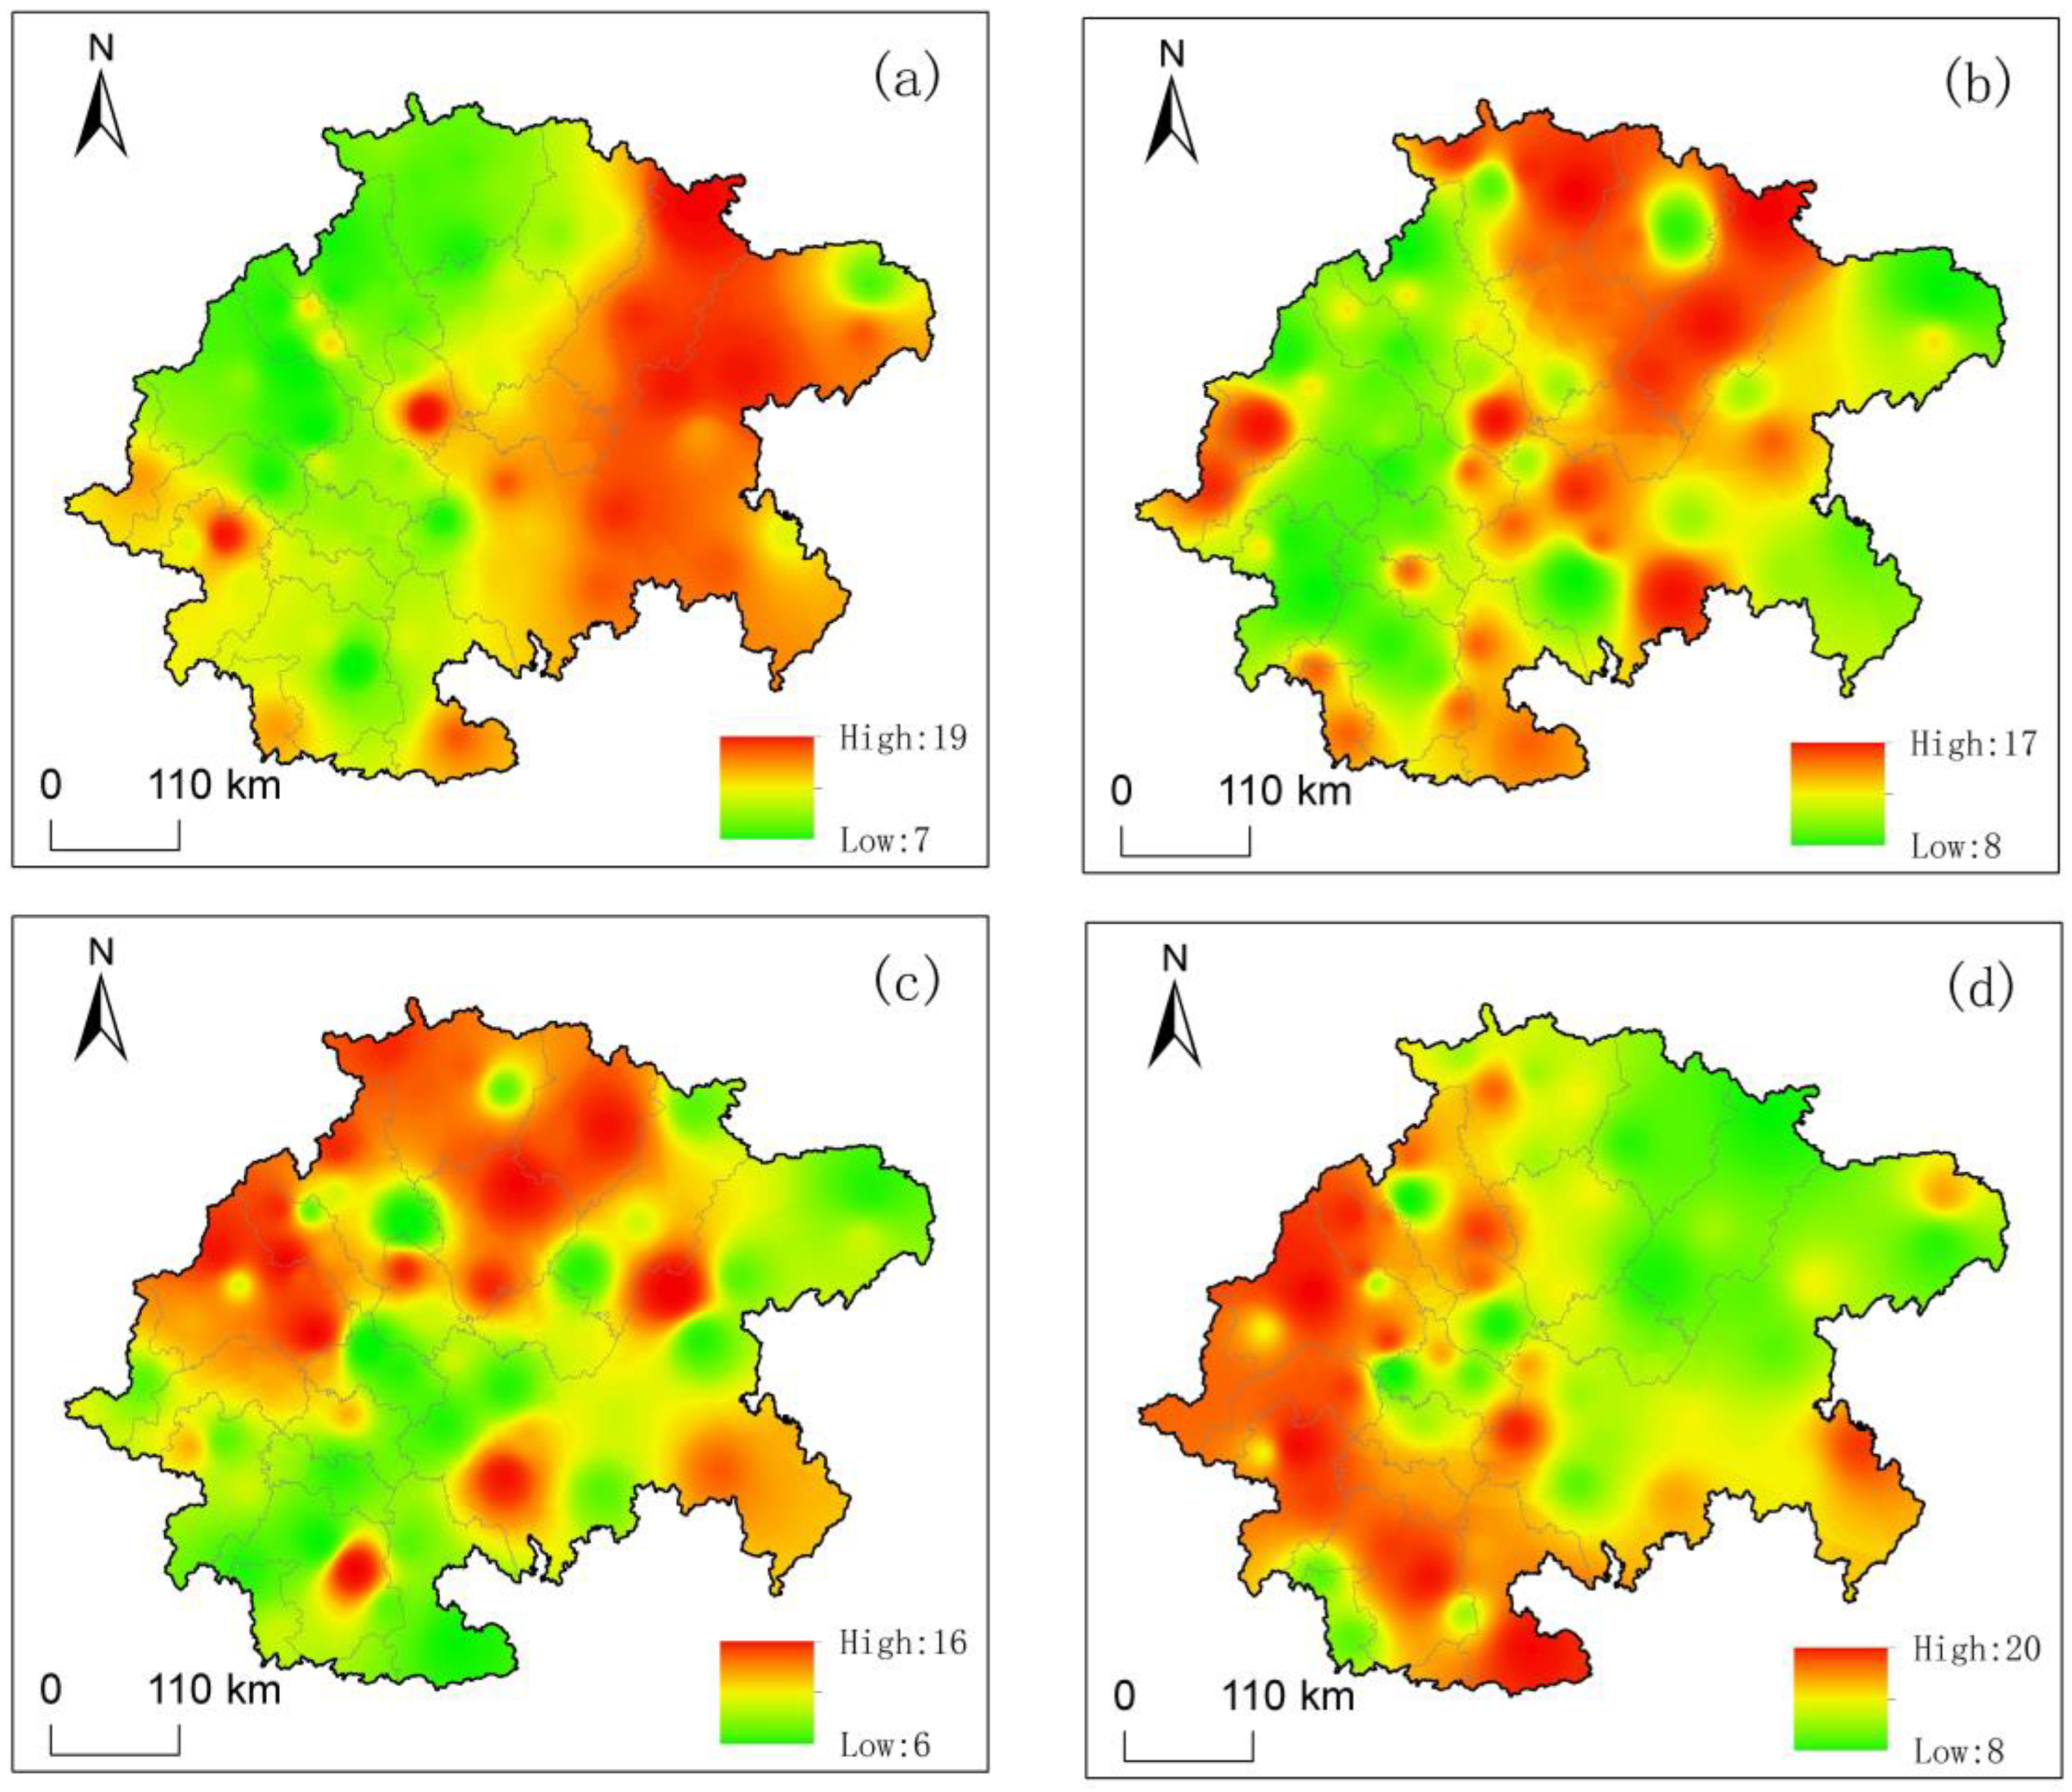
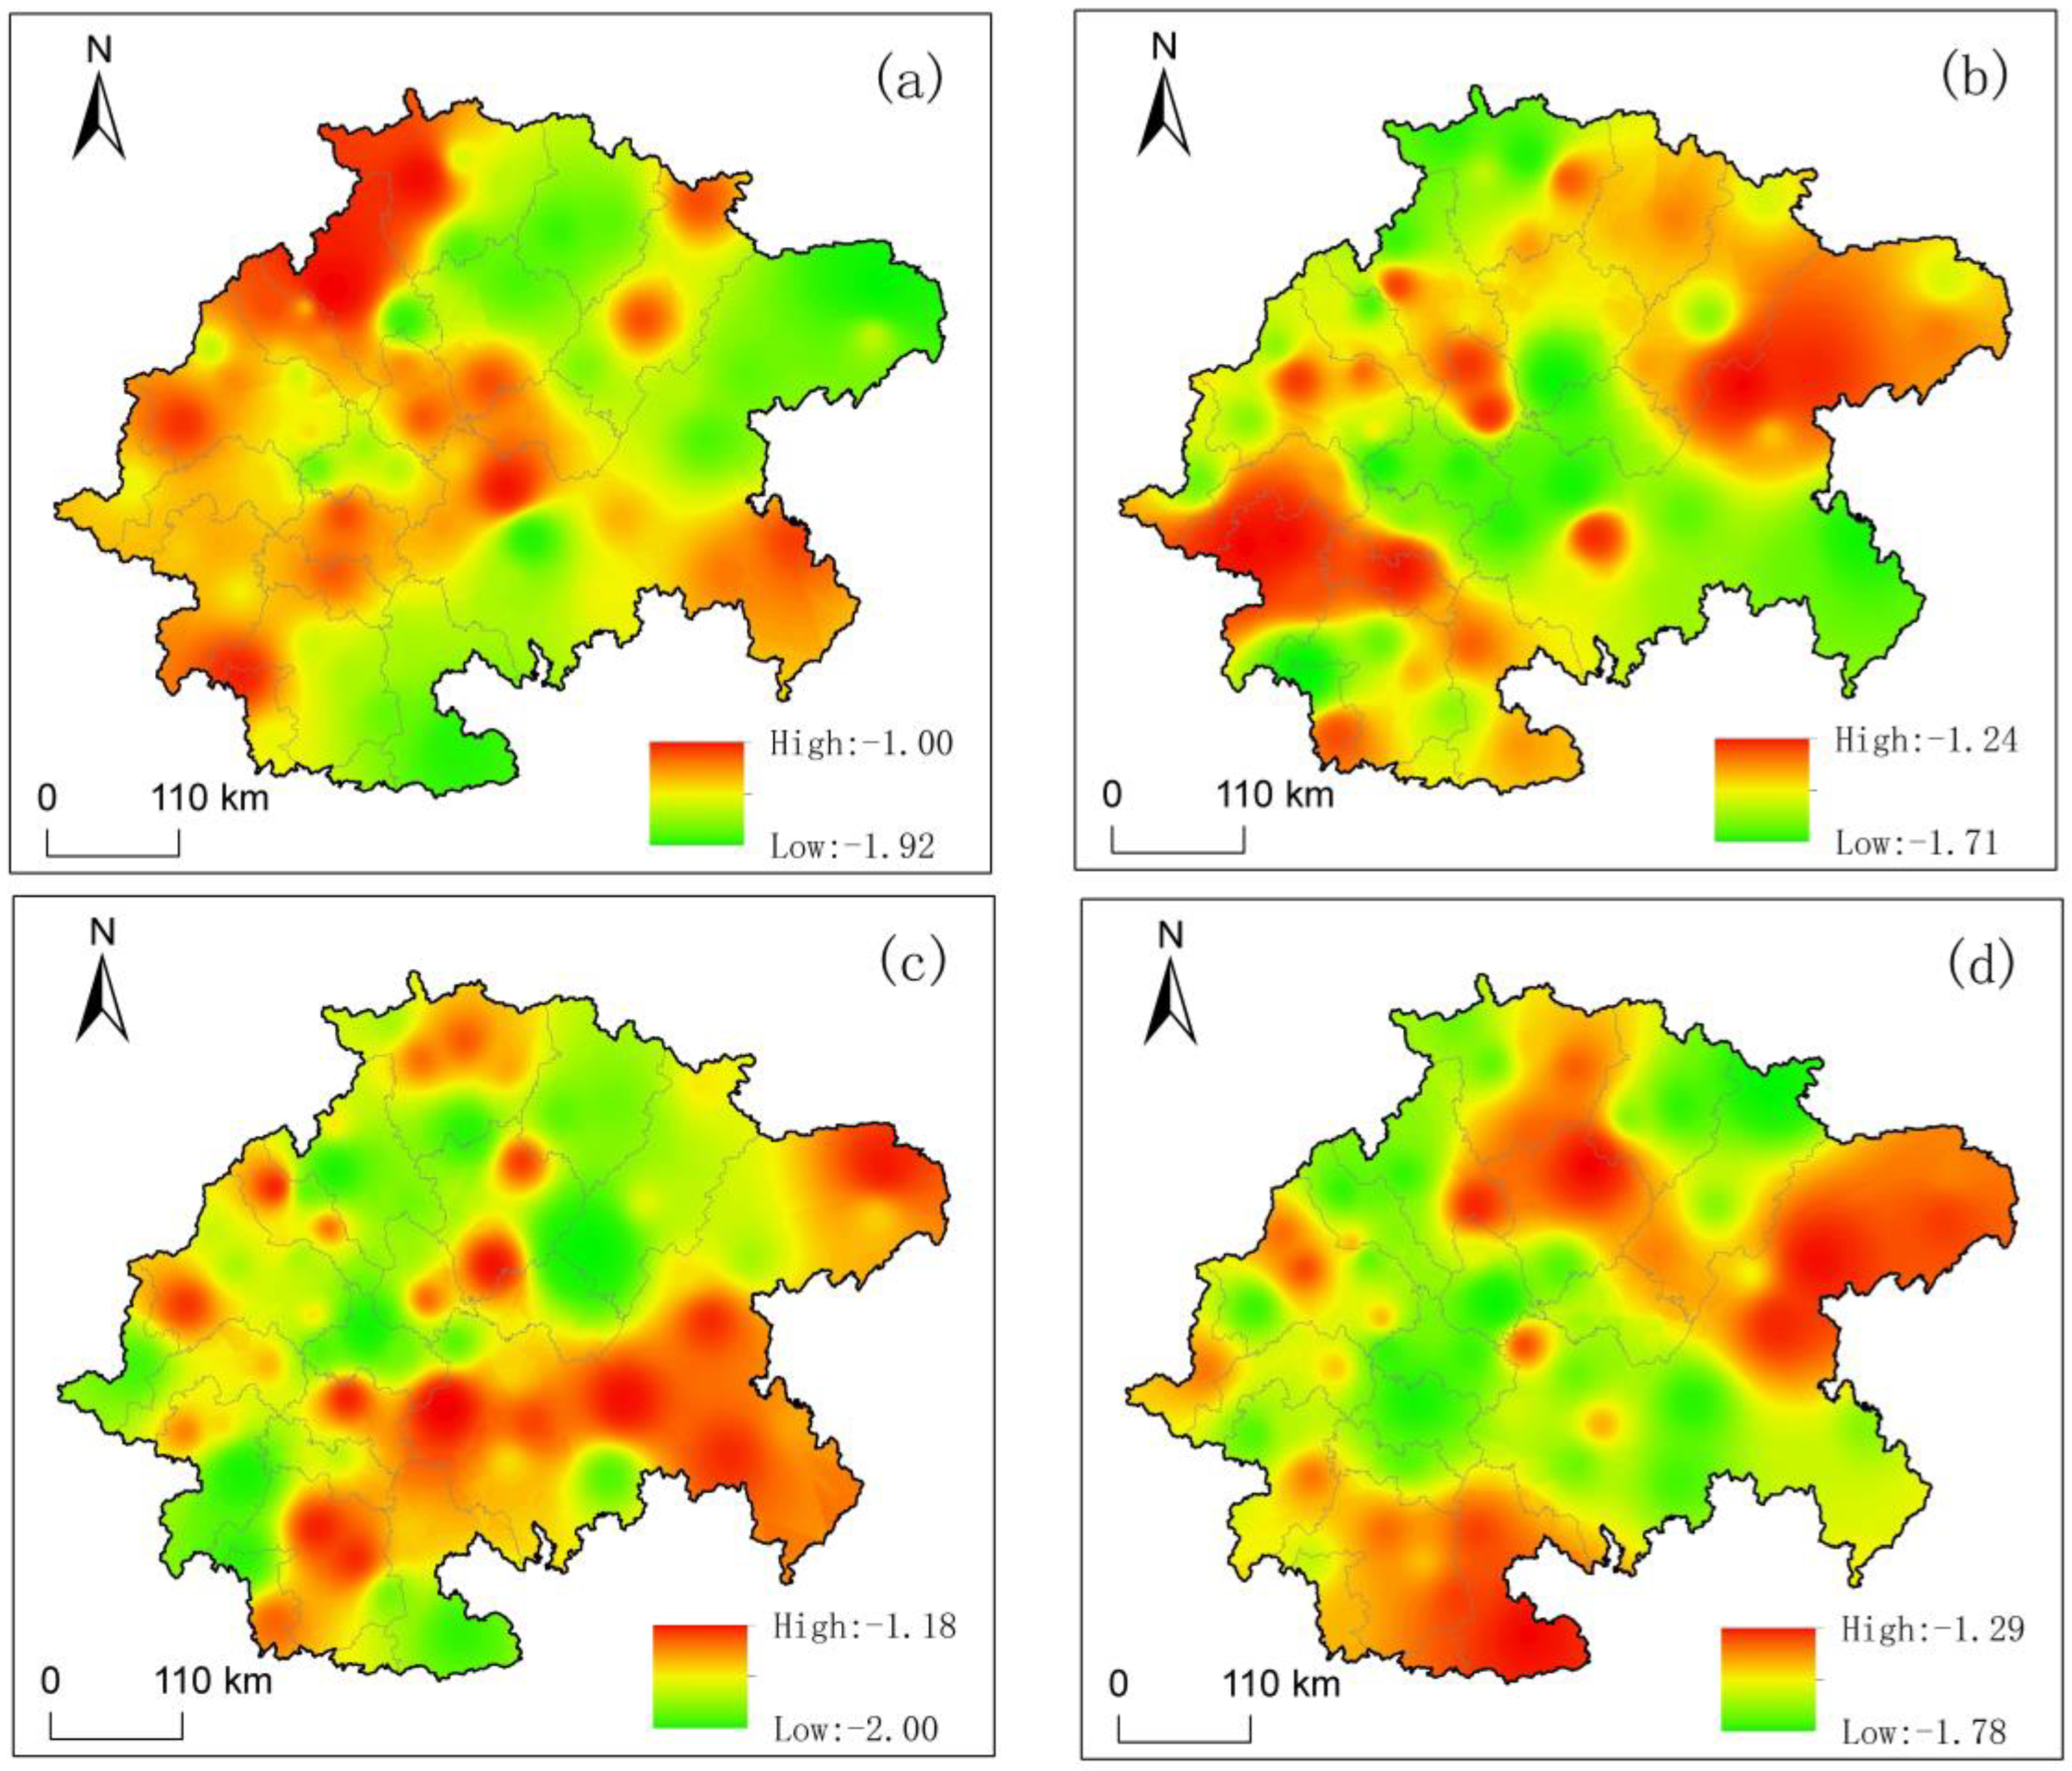
The study area exhibited significant spatial variations in drought frequency, duration, severity, and peak intensity. The eastern and southern regions of the basin experience droughts more frequently than the western areas. Seasonal changes show that the high-frequency drought areas shift gradually from east–north–northwest–west to south. Drought duration is generally longer in the western and northern sections compared to the eastern regions, with variations in drought intensity levels. Typically, light droughts have the shortest duration, while severe droughts last the longest.
(3)
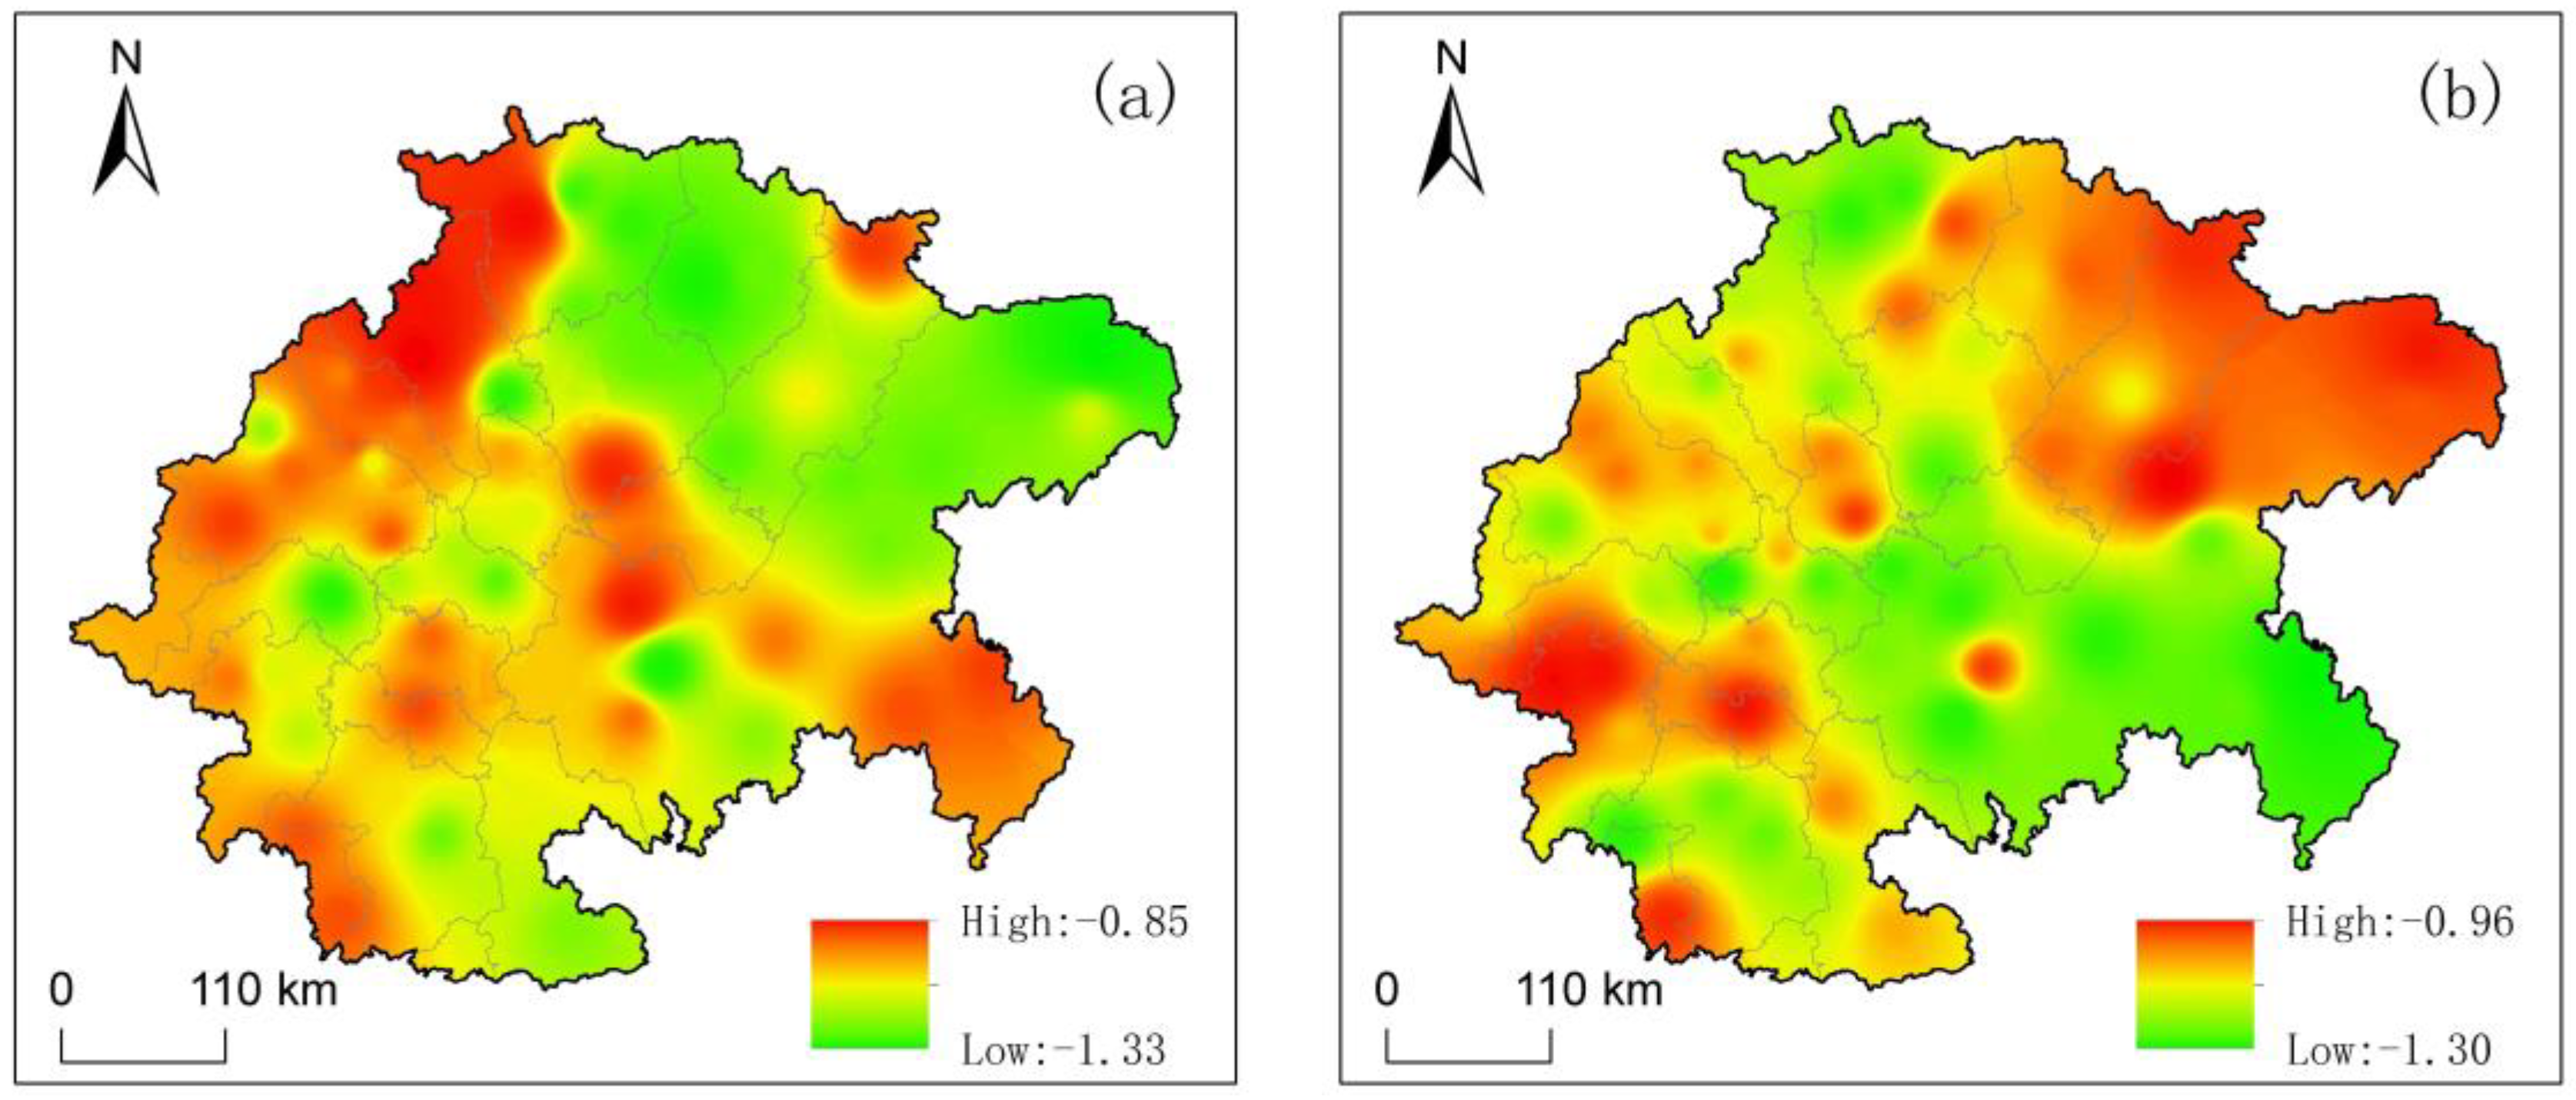
Extreme drought severity is predominantly concentrated in the Chengdu Plain and the Central Sichuan Hilly Region. Despite this, the drought intensity index is lowest in the Chengdu Plain and most parts of eastern Sichuan, registering at −1.19, suggesting that these areas experience medium-grade droughts on average. Seasonally, both light and severe droughts are widespread throughout the Sichuan Basin.
(4)
The lowest average peak value of drought events, recorded at −1.70, is found in the eastern and western regions of the basin. This indicates that, over the past 60 years, extreme drought conditions in the study area may have expanded.

Author Contributions

Methodology, Z.Y.; software, J.C. and Y.W.; resources, H.X. and Y.H.; writing—original draft preparation Z.Y.; writing—review and editing, Z.Y. and B.Z.; supervision, B.Z. All authors have read and agreed to the published version of the manuscript.

Funding

This research was funded by the Sichuan Provincial Department of Science and Technology Project, grant number 21RKX0483.

Institutional Review Board Statement

Not applicable.

Informed Consent Statement

Not applicable.

Data Availability Statement

The data presented in this study are available on request from the corresponding author.

Acknowledgments

We are grateful to the Meteorological Research Institute of the Minjiang River Upper Reaches, the Aba State Institute for Geological Environment Evolution and High-Quality Development Research for their technical support, as well as the financial support provided by the Resource and Environmental College Discipline Construction Fund of Aba Normal University.

Conflicts of Interest

The authors declare no conflicts of interest.

References

  1. Hoque, M.A.A.; Pradhan, B.; Ahmed, N.; Sohel, M.S.I. Agricultural drought risk assessment of Northern New South Wales, Australia using geospatial techniques. Sci. Total Environ. 2021, 756, 143600. [Google Scholar] [CrossRef] [PubMed]
  2. Zhang, Q.; Yao, Y.B.; Wang, Y.; Wang, S.P.; Wang, J.S.; Yang, J.H.; Wang, J.; Li, Y.P.; Shang, J.L.; Li, W.J. Characteristics of drought in Southern China under climatic warming, the risk, and countermeasures for prevention and control. Theor. Appl. Climatol. 2019, 136, 1157–1173. [Google Scholar] [CrossRef]
  3. Su, B.D.; Huang, J.L.; Fischer, T.; Wang, Y.J.; Kundzewicz, Z.W.; Zhai, J.Q.; Sun, H.M.; Wang, A.Q.; Zeng, X.F.; Wang, G.J.; et al. Drought losses in China might double between the 1.5 °C and 2.0 °C warming. Proc. Natl. Acad. Sci. USA 2018, 115, 10600–10605. [Google Scholar] [CrossRef]
  4. Zhang, Q.; Yao, Y.B.; Li, Y.H.; Huang, J.P.; Ma, Z.G.; Wang, Z.L.; Wang, S.P.; Wang, Y.; Zhang, Y. Progress and prospect on the study of causes and variation regularity of droughts in China. Acta Meteorol. Sin. 2020, 78, 500–521. [Google Scholar] [CrossRef]
  5. Lesk, C.; Rowhani, P.; Ramankutty, N. Influence of extreme weather disasters on global crop production. Nature 2016, 529, 84. [Google Scholar] [CrossRef]
  6. Alahacoon, N.; Edirisinghe, M. A comprehensive assessment of remote sensing and traditional based drought monitoring indices at global and regional scale. Geomat. Nat. Hazards Risk 2022, 13, 762–799. [Google Scholar] [CrossRef]
  7. Guillory, L.; Pudmenzky, C.; Nguyen-Huy, T.; Cobon, D.; Stone, R. A drought monitor for Australia. Environ. Model. Softw. 2023, 170. [Google Scholar] [CrossRef]
  8. Kulkarni, S.S.; Wardlow, B.D.; Bayissa, Y.A.; Tadesse, T.; Svoboda, M.D.; Gedam, S.S. Developing a Remote Sensing-Based Combined Drought Indicator Approach for Agricultural Drought Monitoring over Marathwada, India. Remote Sens. 2020, 12, 2091. [Google Scholar] [CrossRef]
  9. Liu, T.T.; Krop, R.; Haigh, T.; Smith, K.H.; Svoboda, M. Valuation of Drought Information: Understanding the Value of the US Drought Monitor in Land Management. Water 2021, 13, 112. [Google Scholar] [CrossRef]
  10. Shah, D.; Mishra, V. Integrated Drought Index (IDI) for Drought Monitoring and Assessment in India. Water Resour. Res. 2020, 56, e2019WR026284. [Google Scholar] [CrossRef]
  11. Zhang, Y.T.; Hao, Z.C.; Jiang, Y.T.; Singh, V.P. Impact-based evaluation of multivariate drought indicators for drought monitoring in China. Glob. Planet. Chang. 2023, 228, 104219. [Google Scholar] [CrossRef]
  12. McKee, T.B.; Doesken, N.J.; Kleist, J. The relationship of drought frequency and duration to time scales. In Proceedings of the 8th Conference on Applied Climatology, Anaheim, CA, USA, 17–22 January 1993; pp. 179–183. [Google Scholar]
  13. Vicente-Serrano, S.M.; Beguería, S.; López-Moreno, J.I. A Multiscalar Drought Index Sensitive to Global Warming: The Standardized Precipitation Evapotranspiration Index. J. Clim. 2010, 23, 1696–1718. [Google Scholar] [CrossRef]
  14. Botai, C.M.; Botai, J.O.; Dlamini, L.C.; Zwane, N.S.; Phaduli, E. Characteristics of Droughts in South Africa: A Case Study of Free State and North West Provinces. Water 2016, 8, 439. [Google Scholar] [CrossRef]
  15. Ogunjo, S.; Ife-Adediran, O.; Owoola, E.; Fuwape, I. Quantification of historical drought conditions over different climatic zones of Nigeria. Acta Geophys. 2019, 67, 879–889. [Google Scholar] [CrossRef]
  16. Peres, D.J.; Bonaccorso, B.; Palazzolo, N.; Cancelliere, A.; Mendicino, G.; Senatore, A. A dynamic approach for assessing climate change impacts on drought: An analysis in Southern Italy. Hydrol. Sci. J. 2023, 68, 1213–1228. [Google Scholar] [CrossRef]
  17. Spinoni, J.; Naumann, G.; Vogt, J.; Barbosa, P. European drought climatologies and trends based on a multi-indicator approach. Glob. Planet. Chang. 2015, 127, 50–57. [Google Scholar] [CrossRef]
  18. Ionita, M.; Nagavciuc, V. Changes in drought features at the European level over the last 120 years. Nat. Hazards Earth Syst. Sci. 2021, 21, 1685–1701. [Google Scholar] [CrossRef]
  19. Oertel, M.; Javier Meza, F.; Gironas, J.; Scott, C.A.; Rojas, F.; Pineda-Pablos, N. Drought Propagation in Semi-Arid River Basins in Latin America: Lessons from Mexico to the Southern Cone. Water 2018, 10, 1564. [Google Scholar] [CrossRef]
  20. Quesada-Montano, B.; Wetterhall, F.; Westerberg, I.K.; Hidalgo, H.G.; Halldin, S. Characterising droughts in Central America with uncertain hydro-meteorological data. Theor. Appl. Climatol. 2019, 137, 2125–2138. [Google Scholar] [CrossRef]
  21. Vicente-Serrano, S.M.; Chura, O.; Lopez-Moreno, J.I.; Azorin-Molina, C.; Sanchez-Lorenzo, A.; Aguilar, E.; Moran-Tejeda, E.; Trujillo, F.; Martinez, R.; Nieto, J.J. Spatio-temporal variability of droughts in Bolivia: 1955–2012. Int. J. Climatol. 2015, 35, 3024–3040. [Google Scholar] [CrossRef]
  22. Zeng, Z.; Wu, W.; Li, Z.; Zhou, Y.; Guo, Y.; Huang, H. Agricultural Drought Risk Assessment in Southwest China. Water 2019, 11, 1064. [Google Scholar] [CrossRef]
  23. Cao, B.; Zhang, B.; Ma, B.; Tang, M.; Wang, G.Q.; Wu, Q.H.; Jia, Y.Q. Spatial and temporal characteristics analysis of drought based on SPEI in the Middle and Lower Yangtze Basin. Acta Ecol. Sin. 2018, 38, 6258–6267. [Google Scholar]
  24. Li, S.; Zeng, L.; Zhang, C.J.; Xiao, Q.; Zhang, Q.; Gong, W.T. Spatio-temporal variations and propagation from meteoro-logical to hydrological drought in the upper Yangtze River basin over last 120 years. Clim. Chang. Res. 2023, 19, 263–277. [Google Scholar]
  25. Liu, Y.; Tian, J.Y.; Huang, T.T.; Jia, Z.F.; Guan, R.L.; Ma, X.Y. Analysis of NDVI changes and driving factors in the Yangtze River Basin. Sci. Geogr. Sin. 2023, 43, 1022–1031. [Google Scholar] [CrossRef]
  26. Wang, D.; Zhang, B.; An, M.L.; Zhang, T.F.; Ji, D.M.; Ren, P.G. Temporal and Spatial Distributions of Drought in Southwest China over the Past 53 years Based on Standardized Precipitation Evapotranspiration Index. J. Nat. Resour. 2014, 29, 1003–1016. [Google Scholar]
  27. Tan, H.Z.; Lu, X.N.; Yang, S.Q.; Wang, Y.Q.; Li, F.; Liu, J.B.; Chen, J.; Huang, Y. Drought risk assessment in the coupled spatial-temporal dimension of the Sichuan Basin, China. Nat. Hazards 2022, 114, 3205–3233. [Google Scholar] [CrossRef]
  28. Xu, C.C.; Wu, W.X.; Ge, Q.S.; Zhou, Y.; Lin, Y.M.; Li, Y.M. Simulating climate change impacts and potential adaptations on rice yields in the Sichuan Basin, China. Mitig. Adapt. Strateg. Glob. Chang. 2017, 22, 565–594. [Google Scholar] [CrossRef]
  29. He, J.Y.; Zhang, M.J.; Wang, P.; Wang, S.J.; Wang, X.M. Climate Characteristics of the Extreme Drought Events in Southwest China during Recent 50 Years. Acta Geogr. Sin. 2011, 66, 1179–1190. [Google Scholar]
  30. Li, Y.H.; Xu, H.M.; Gao, Y.H.; Li, Q.; Bai, Y.Y.; He, Z.N. Characteristics of Outgoing Longwave Radiation Related to Typical Flood and Drought Years over the East of Southwest China in Summer. Plateau Meteorol. 2009, 28, 861–869. [Google Scholar]
  31. Yin, H.; Li, Y.H. Summary of Advance on Drought Study in Southwest China. J. Arid Meteorol. 2013, 31, 182–193. [Google Scholar]
  32. Zhang, Y.; Xia, J.; Yang, F.; She, D.X.; Zou, L.; Hong, S.; Wang, Q.; Yuan, F.; Song, L.X. Analysis of Drought Characteristic of Sichuan Province, Southwestern China. Water 2023, 15, 1601. [Google Scholar] [CrossRef]
  33. Gao, H.J.; Guo, M.H.; Liu, J.Y.; Liu, T.J.; He, S.J. Power Supply Challenges and Prospects in New Power System from Sichuan Electricity Curtailment Events Caused by High-temperature Drought Weather. Proc. CSEE 2023, 43, 4517–4538. [Google Scholar] [CrossRef]
  34. Wang, M.T. Trends and Response Measures of Agricultural Seasonal Drought under Climate Change in Sichuan. Ph.D. Thesis, Sichuan Agricultural University, Chengdu, China, 2012. [Google Scholar]
  35. Xia, J.; Chen, J.; She, D.X. Impacts and countermeasures of extreme drought in the Yangtze River Basin in 2022. J. Hydraul. Eng. 2022, 53, 1143–1153. [Google Scholar] [CrossRef]
  36. Xu, J.J.; Yuan, Z. Drought Characteristics of Changjiang River Basin in 2022 and Drought Mitigation Response Pattern under New Circumstances. J. Chang. River Sci. Res. Inst. 2023, 40, 1–8. [Google Scholar]
  37. Huang, Y.H.; Xu, C.; Yang, H.J.; Wang, J.H.; Jiang, D.; Zhao, C.P. Temporal and Spatial Variability of Droughts in Southwest China from 1961 to 2012. Sustainability 2015, 7, 13597–13609. [Google Scholar] [CrossRef]
  38. Liu, C.H.; Yang, C.P.; Yang, Q.; Wang, J. Spatiotemporal drought analysis by the standardized precipitation index (SPI) and SPEI in Sichuan Province, China. Sci. Rep. 2021, 11, 1280. [Google Scholar] [CrossRef]
  39. Chen, Y.X.; Yang, J.J.; Xu, Y.Y.; Zhang, W.L.; Wang, Y.X.; Wei, J.X.; Cheng, W.X. Remote-Sensing Drought Monitoring in Sichuan Province from 2001 to 2020 Based on MODIS Data. Atmosphere 2022, 13, 1970. [Google Scholar] [CrossRef]
  40. Li, C.B.; Adu, B.; Li, H.H.; Yang, D.H. Spatial and temporal variations of drought in Sichuan Province from 2001 to 2020 based on modified temperature vegetation dryness index (TVDI). Ecol. Indic. 2022, 141, 108883. [Google Scholar] [CrossRef]
  41. Yu, X.; Li, C.; Huo, T.; Ji, Z. Information diffusion theory-based approach for the risk assessment of meteorological disasters in the Yangtze River Basin. Nat. Hazards 2020, 107, 2337–2362. [Google Scholar] [CrossRef]
  42. Wang, X.L.; Wen, Q.H.; Wu, Y. Penalized Maximal t Test for Detecting Undocumented Mean Change in Climate Data Series. J. Appl. Meteorol. Climatol. 2007, 46, 916–931. [Google Scholar] [CrossRef]
  43. Begueria, S.; Vicente-Serrano, S.M.; Reig, F.; Latorre, B. SPEI revisited: Parameter fitting, evapotranspiration models, tools, datasets and drought monitoring. Int. J. Climatol. 2014, 34, 3001–3023. [Google Scholar] [CrossRef]
  44. GB/T 20481-2017; Grades of Meteorological Drought. China Meteorological Administration: Beijing, China, 2017.
  45. Zhang, Y.Q.; Xiang, Y.; Chen, C.C.; Wei, R.C. Research on spatial-temporal variation of drought and flood events over Ganjiang basin. J. Meteorol. Sci. 2015, 35, 346–352. [Google Scholar]
  46. Montaseri, M.; Amirataee, B. Comprehensive stochastic assessment of meteorological drought indices. Int. J. Climatol. 2017, 37, 998–1013. [Google Scholar] [CrossRef]
  47. Wang, F.; Wang, Z.; Yang, H.; Di, D.; Zhao, Y.; Liang, Q.; Hussain, Z. Comprehensive evaluation of hydrological drought and its relationships with meteorological drought in the Yellow River basin, China. J. Hydrol. 2020, 584, 124751. [Google Scholar] [CrossRef]
  48. Yao, N.; Li, L.; Feng, P.; Feng, H.; Liu, D.L.; Liu, Y.; Jiang, K.; Hu, X.; Li, Y. Projections of drought characteristics in China based on a standardized precipitation and evapotranspiration index and multiple GCMs. Sci. Total Environ. 2020, 704, 135245. [Google Scholar] [CrossRef]
  49. Wang, Y.G.; Lan, L.; Lei, S.; Wang, X.X.; Wang, X.K. Study on spatial-and-temporal characteristics of typical drought events in Sichuan Province. China Flood Drought Manag. 2023, 33, 22–26. [Google Scholar] [CrossRef]
  50. Zhang, H.; Zhang, X.L.; Li, J.J.; Wang, M.T.; Ma, Z.L. SPEI-based analysis of temporal and spatial variation characteristicsfor seasonal drought in Sichuan Basin. Agric. Res. Arid Areas 2018, 36, 242–250+256. [Google Scholar]
  51. Cui, Y.Q.; Zhang, B.; Huang, H.; Zeng, J.J.; Wang, X.D.; Jiao, W.H. Spatiotemporal Characteristics of Drought in the North China Plain over the Past 58 Years. Atmosphere 2021, 12, 844. [Google Scholar] [CrossRef]
  52. Song, G.Y.; Zhou, C.B.; Fu, S.J. Analysis of drought characteristics and construction of prediction model in Chongqing based on SPEI index. Eng. J. Wuhan Univ. 2023, 56, 1458–1471. [Google Scholar] [CrossRef]
  53. Liao, G.M.; Yan, J.P.; Hu, N.N.; Liu, Y. Analysis on temporal series of precipitation and drought-flood about the recent 50 years in the east of Sichuan Basin. Resour. Environ. Yangtze Basin 2012, 21, 1160–1166. [Google Scholar]
  54. Wang, Z.; Liang, C.; Long, Y.D.; Zhan, C. Temporal and spatial distribution characteristics of drought in hilly region of central Sichuan based on SPEI. Yangtze River 2015, 46, 12–15+23. [Google Scholar] [CrossRef]
  55. Zhang, J.; Shen, Y. Spatio-temporal variations in extreme drought in China during 1961–2015. J. Geogr. Sci. 2019, 29, 67–83. [Google Scholar] [CrossRef]
  56. Sarwar, A.N.; Waseem, M.; Azam, M.; Abbas, A.; Ahmad, I.; Lee, J.E.; Haq, F.U. Shifting of Meteorological to Hydrological Drought Risk at Regional Scale. Appl. Sci. 2022, 12, 5560. [Google Scholar] [CrossRef]
Figure 1. Research flowchart.
Sustainability 16 08397 g001
Figure 2. Survey of the research area.
Sustainability 16 08397 g002
Figure 3. Using run-length theory to identify drought events.
Sustainability 16 08397 g003
Figure 4. SPEI for different time scales in 1963–2022: (a) monthly; (b) quarterly; (c) annual; and (d) SPEI-12 curve.
Sustainability 16 08397 g004
Figure 5. Trends in SPEI during spring (a), summer (b), autumn (c), and winter (d) in the Sichuan Basin from 1963 to 2022.
Sustainability 16 08397 g005
Figure 6. Wavelet analysis of annual SPEI in the Sichuan Basin: real part contour of wavelet coefficient (a); variance in wavelet coefficient (b).
Sustainability 16 08397 g006
Figure 7. Wavelet analysis of SPEI at seasonal scale in the Sichuan Basin: real part contour (ad) of four-season wavelet coefficients; four-season wavelet coefficient variance (eh).
Sustainability 16 08397 g007aSustainability 16 08397 g007b
Figure 8. Spatial distribution of SPEI drought times at the interannual scale in the Sichuan Basin.
Sustainability 16 08397 g008
Figure 9. SPEI station ratio of different drought grades in the Sichuan Basin from 1963 to 2022.
Sustainability 16 08397 g009
Figure 10. Spatial pattern of drought times in spring (a), summer (b), autumn (c), and winter (d) of the Sichuan Basin from 1963 to 2022.
Sustainability 16 08397 g010
Figure 11. Spatial distribution of the average duration of drought in the Sichuan Basin from 1963 to 2022 (a) and duration of different grades of drought annually (b).
Sustainability 16 08397 g011
Figure 12. Distribution of drought duration in the Sichuan Basin from 1963 to 2022: spring (a), summer (b), autumn (c), and winter (d) (unit: month).
Sustainability 16 08397 g012
Figure 13. Space distribution of drought severity (a) and drought intensity (b) at the interannual scale.
Sustainability 16 08397 g013
Figure 14. Spatial distribution of drought severity at seasonal scale: spring (a), summer (b), autumn (c), and winter (d).
Sustainability 16 08397 g014aSustainability 16 08397 g014b
Figure 15. Spatial distribution of drought intensity at seasonal scale: spring (a), summer (b), autumn (c), and winter (d).
Sustainability 16 08397 g015aSustainability 16 08397 g015b
Figure 16. Annual-scale spatial distribution of drought peak (a); interannual variation in drought peak (b).
Sustainability 16 08397 g016
Figure 17. Spatial distribution of peak drought values at the seasonal scale: spring (a), summer (b), autumn (c), and winter (d).
Sustainability 16 08397 g017
Table 1. The SPEI drought grade classification.
SPEI ValueDrought Grade
SPEI > −0.5No drought
−1 < SPEI ≤ −0.5Light drought
−1.5 < SPEI ≤ −1Moderate drought
−2 < SPEI ≤ −1.5Severe drought
SPEI ≤ −2Extreme drought
Disclaimer/Publisher’s Note: The statements, opinions and data contained in all publications are solely those of the individual author(s) and contributor(s) and not of MDPI and/or the editor(s). MDPI and/or the editor(s) disclaim responsibility for any injury to people or property resulting from any ideas, methods, instructions or products referred to in the content.

