Article

Air Pollution in the Port City of Lithuania: Characteristics of the Distribution of Nitrogen Dioxide and Solid Particles When Assessing the Demographic Distribution of the Population

by
Aistė Andriulė
1,*,
Erika Vasiliauskienė
1,2,
Paulius Rapalis
1 and
Inga Dailidienė
1,3
1
Marine Research Institute, Klaipeda University, H. Manto Str. 84, 92294 Klaipeda, Lithuania
2
Department of Business Administration, Klaipeda State University of Applied Sciences, 91223 Klapieda, Lithuania
3
Lithuanian Business College, 91249 Klaipeda, Lithuania
*
Author to whom correspondence should be addressed.
Sustainability 2024, 16(19), 8413; https://doi.org/10.3390/su16198413
Submission received: 5 August 2024 / Revised: 18 September 2024 / Accepted: 19 September 2024 / Published: 27 September 2024
(This article belongs to the Section Sustainability in Geographic Science)

Abstract

:
This research addresses a gap in localized air quality assessments by measuring pollution levels in Klaipeda, a Baltic port city, using passive solid particle collectors and nitrogen dioxide (NO2) diffusion tubes. Passive sampling techniques were employed due to their cost-effectiveness and ease of deployment, allowing for practical monitoring over short-term periods. By targeting diverse functional zones, this study aims to provide a comprehensive analysis of air pollution patterns and seasonal variations in the region. Air pollution, primarily from NO2 and particulate matter (PM), poses significant risks to public health, especially in densely populated urban areas. Air quality was assessed by measuring total suspended particulates (TSP) and NO2 concentrations across 19 strategically chosen sites, covering key functional zones, such as industrial areas, green spaces, residential neighborhoods, transport hubs, and the port. Results show elevated pollution levels near major roads and the port area, likely driven by heavy traffic, industrial emissions, and port activities. These patterns correlate with areas of higher population density, highlighting the intersection of air quality challenges with human health risks in urbanized zones. Seasonal data reveal a notable peak in NO2 concentrations during winter, likely due to increased heating demand and reduced atmospheric dispersion. These findings suggest that air quality management strategies should be adaptive to seasonal fluctuations, particularly by addressing emissions from heating sources in colder months. The study underscores the necessity of integrating sustainable urban planning with targeted air quality interventions. Expanding green spaces, enhancing traffic regulation, and establishing protective zones near industrial areas are critical strategies for mitigating pollution. These insights are essential for guiding both urban development and public health policies in Klaipeda and other coastal cities facing similar environmental challenges.

1. Introduction

Air pollution and climate change are among the most pressing global challenges, affecting both natural environments and human health. Countries around the world are striving to identify major pollutants and their sources due to their adverse effects on landscapes, soils, and public health. In Klaipėda, a port city in Lithuania, air pollution has become a growing concern, driven by increasing port activities, industrial emissions, and vehicular traffic. Although specific data on the contribution of various pollution sources in Klaipėda is limited, studies from similar coastal cities, such as Gdańsk and Gothenburg, estimate that port-related activities contribute significantly to local nitrogen dioxide (NO2) emissions, accounting for around 30–40% of the total [1]. Vehicular traffic is estimated to contribute approximately 35%, while industrial emissions make up around 25%. Recent reports from Klaipėda municipality have highlighted elevated levels of NO2 and particulate matter (PM) during periods of intensified port operations and traffic congestion.
Seaports, as major hubs of economic activity, are significant contributors to air pollution in coastal urban areas, and Klaipėda is no exception, as shown in the Klaipėda Municipality Air Quality Report. Klaipėda’s port, one of the largest in the region, plays a critical role in shaping the city’s air quality. However, smog is rarely recorded in Klaipėda. In rare cases, such as during droughts, the fire hazard may increase, and only locally, when the weather is calm with no wind. So far, the proximity of the Baltic Sea and the prevailing westerly winds blowing from the sea have contributed to cleaner air compared to other industrial inland cities in Lithuania.
Nevertheless, with the increasing volume of transport and port cargo operations in Klaipėda, residents’ complaints are growing, and increasing air pollution is being recorded. A significant issue is that the port’s cargo-handling companies are situated practically next to the city. Klaipėda, home to Lithuania’s only seaport, sees bulk cargoes, such as fertilizers, metal ore, crushed stone, and grain, being handled within the Klaipėda Strait, practically in the city center. This close proximity amplifies the air pollution challenge faced by the city.
Although seaports, as demonstrated in various studies, are primary contributors to air pollution in coastal cities, other human activities such as vehicular traffic, industrial processes, and residential heating also play significant roles. In Klaipėda, the heating season is particularly important, with the city relying on biomass (wood chips) and natural gas for district heating, while some households still use wood and peat briquettes in individual heating systems. Understanding the impact of these heating sources is crucial when assessing seasonal variations. With a long heating season lasting six to seven months, Klaipėda’s distinct seasonal patterns make it essential to evaluate how heating affects air quality throughout the year.
In addition to human activities, meteorological conditions, such as temperature, wind, and atmospheric pressure, also have a strong impact on air quality. Studies have shown that seasonal weather patterns can either enhance or limit pollutant dispersion, which makes it critical to account for these factors when evaluating pollution levels [2]. While this study does not specifically focus on meteorological data, it highlights the importance of seasonal variations in both heating emissions and atmospheric conditions. These fluctuations are essential for developing effective urban strategies and managing pollution, particularly in planning for port activities and addressing heating-related pollution during the colder months.
The combination of emissions from ports, traffic, industrial processes, and residential heating contributes to increased levels of harmful pollutants, particularly PM, NO2, and ground-level ozone (O3). Exposure to these pollutants poses significant risks, such as respiratory infections, cardiovascular diseases, stroke, and lung cancer. According to the World Bank, the economic cost of air pollution is staggering, amounting to $5 trillion annually in welfare costs globally [3]. As coastal cities like Klaipėda continue to grow, with increasing population density and economic activity, these health impacts are expected to worsen, making it vital to address both pollution sources and their long-term health effects [4].
This study aims to analyze the spatial and temporal distribution of air pollution in Klaipėda, focusing on NO2 and particulate matter (PM10 and PM2.5). PM2.5 refers to PM with a diameter of 2.5 μm or less, which is small enough to penetrate deep into the respiratory system, reaching the lungs and potentially entering the bloodstream. PM10 refers to PM with a diameter of 10 μm or less. These particles, though larger than PM2.5, can still be inhaled and affect the respiratory system, particularly in the upper airways. PM10 includes dust, pollen, and other larger particles suspended in the air, often originating from construction activities, road dust, and natural sources.
Despite being smaller than other major coastal cities like Gdańsk or Gothenburg, Klaipėda’s heavy port activities, industrial emissions, and dense vehicular traffic create a significant and underexplored case for air pollution analysis. Unlike larger cities, Klaipėda has not been extensively studied in terms of its pollution dynamics, making this research crucial for understanding the air quality challenges faced by smaller port cities.
Previous studies from larger port cities like Gdańsk and Gothenburg have demonstrated the significant impact of port activities on local NO2 and PM levels. However, limited research exists on how these factors affect smaller cities like Klaipėda, which, despite its size, experiences similar pressures from economic activities related to its port. Findings from major coastal cities such as Barcelona, Rotterdam, and Los Angeles [5,6] suggest that port emissions play a central role in local pollution levels, a trend likely mirrored in Klaipėda but requiring specific investigation.
By addressing this research gap, the study contributes a detailed analysis of Klaipėda’s air pollution distribution, with a focus on seasonal variations. These fluctuations are often tied to heightened port activity or increased heating usage in winter. While this study does not exclusively target smog events, it captures the seasonal peaks in pollutant concentrations, offering valuable insights into the pollution patterns of smaller coastal urban settings.
Comparing local pollution levels with WHO standards, this research identifies areas where pollutant concentrations may exceed safe limits, underscoring the need for targeted pollution control measures. The findings will help shape public health strategies and guide urban planning, particularly in smaller, rapidly developing coastal cities like Klaipėda, where economic growth and population pressures may exacerbate pollution-related challenges.

2. Materials and Methods
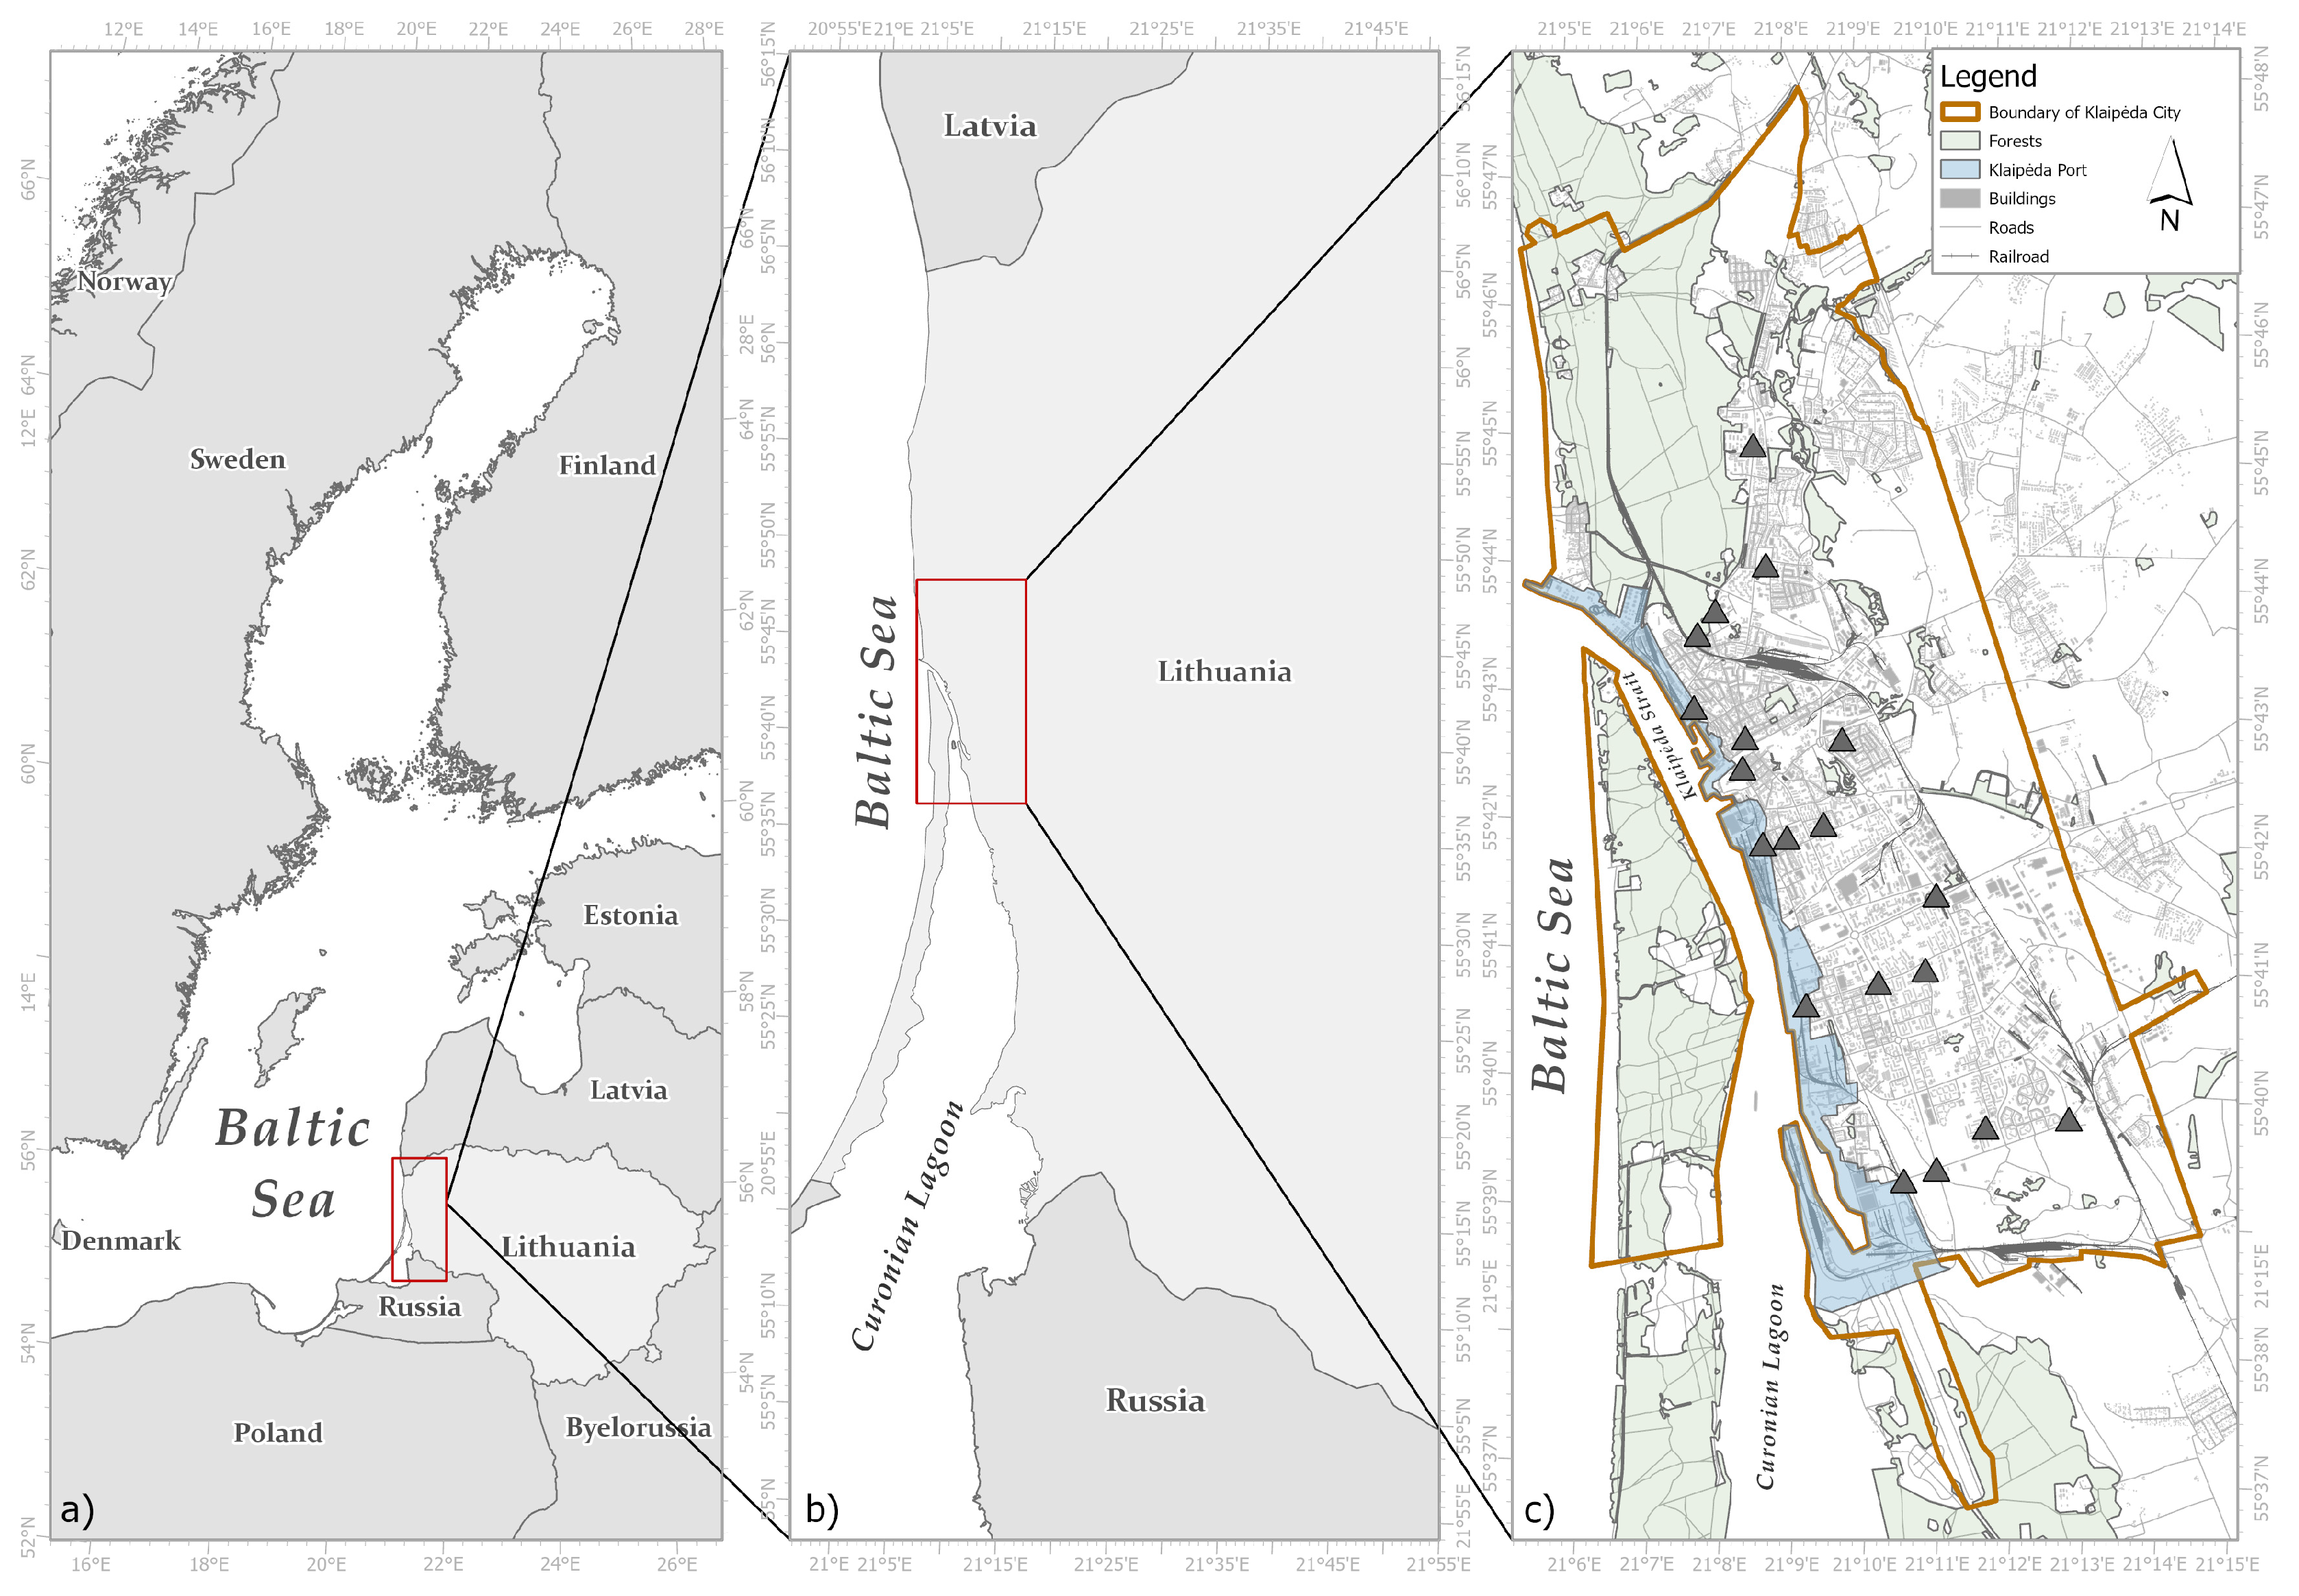
2.1. Study Area

The study’s area (Figure 1) is Klaipeda city (54°43′16″ N and 21°07′ E), covering an area of 98 km2, located in the western part of the country near the Baltic Sea. Klaipėda is the third-largest city in Lithuania by population, with approximately 166,000 residents. It is a significant transportation hub, connected by the international highway Vilnius-Klaipėda, and hosts a major commercial seaport, a railway station, and a bus station. The Klaipėda-Palanga International Airport is situated about 23 km north of the city. The international seaport in Klaipėda generates one-fifth of the national GDP, with a quay length of 24.7 km. Annually, around 7000 ships from approximately 70 countries dock at Klaipėda’s seaport.
The city is laid out in a north-south direction, extending 16 km, and is traversed by three main streets running from south to north. The first street runs parallel to the port (Minijos Street), and the other two (Taikos Avenue and Šilutės Road) are parallel to this.
For data collection and research purposes, 19 locations in the city were selected (Figure 2) and categorized into functional zones: port area (4 monitoring stations), transport hub (7 monitoring stations), residential neighborhoods (6 monitoring stations), old town zone (1 monitoring station), and green zone (1 monitoring station). Four air pollution monitoring stations were installed on Minijos Street, near port-operating companies, while the other seven were placed along the two other main streets crossing Klaipėda. The objective was to observe whether air pollution levels differ across the three main streets, considering the strong port influence on Minijos Street, as opposed to the other two streets that are farther from the port. In addition to the main streets, air pollution monitors were installed in residential neighborhoods (southern, central, and northern parts of the city) to assess air quality in areas secluded from main streets. To evaluate air quality in public gathering areas, one monitor was installed in the central city square and another in a green zone—a recreational area for families surrounded by a forest.
Measurements in green zones aim to assess their benefits in mitigating urban air pollution. The pollution measurements in these areas were designed to evaluate the effectiveness of green zones in improving air quality, particularly as forests and green spaces can influence the urban microclimate and potentially reduce pollutant levels.

2.2. Data and Methods

To achieve the main aim of this research—identifying hotspots of contaminants in Klaipėda city—TSP and NO2 were measured at 19 sites. The measurements employed original passive samplers and Palmes passive diffusion tubes.
The use of passive sampling methods, such as PM dust collectors and NO2 passive diffusion tubes, is a common approach in air quality-monitoring studies worldwide. These methods are valued for their simplicity, cost-effectiveness, and ability to cover large study areas over extended periods. However, they also come with certain limitations. Passive samplers provide an average concentration over time, which means they may miss short-term pollution spikes or peak events. Despite these limitations, they are widely used in many studies due to their reliability in capturing overall trends in air quality without the risk of data exaggeration that can occur with more reactive sampling methods [7].
In this study, PM dust collectors were used to measure TSP and PM, including PM10 and PM2.5. These dust collectors work by trapping airborne particulates on an adhesive surface, which is weighed before and after collection to determine the total mass of the collected particles. Measurements were carried out over four distinct eight-week periods to assess seasonal changes in PM levels: 5 July–30 August 2023, 8 October–3 December 2023, 6 January–2 March 2024, and 2 March–27 April 2024. However, during winter season, the limitations of passive sampling became evident, as snow cover at some sites led to incomplete data collection. Additionally, environmental challenges, such as strong winds dislodging plates from collectors and freezing temperatures causing plates to break, further affected data quality. Seasonal maps were generated using GPS-based tools to display data from all sites where measurements were successfully collected during each season, but only a few sites (18—port area, 11—transport hub, 6—port area, 5—transport hub, 8—port area, 12—transport hub, 13—residential area, 7—old town zone, and 19—residential area) were successfully measured in all four seasons.
For NO2, passive diffusion tubes were employed. These tubes rely on the principle of passive diffusion, where NO2 molecules diffuse through a membrane and are absorbed by a chemical reagent inside the tube. Palmes diffusion tubes provide a cost-effective and convenient method for monitoring NO2 concentrations; their accuracy can be affected by environmental factors, such as wind speed, temperature, and humidity. These factors introduce systematic biases, with studies showing that Palmes tubes often underestimate NO2 levels compared to continuous monitoring methods, particularly in challenging conditions [8].
The use of passive sampling methods, such as NO2 diffusion tubes and PM dust collectors, is widely recognized for its cost-effectiveness and practicality in air quality monitoring over large areas and extended periods. However, these methods introduce inherent uncertainties, which must be carefully considered when interpreting the data.
NO2 diffusion tubes operate on the principle of molecular diffusion and provide time-averaged concentrations over the exposure period. However, their performance can be affected by environmental variables, including temperature, humidity, and airflow. These factors can lead to potential under- or overestimation of actual NO2 concentrations, particularly in fluctuating weather conditions. According to Gradko Ltd. (Winchester, UK), the uncertainty of passive diffusion tubes is typically ±10–20%, depending on the deployment conditions and adherence to quality control protocols. This range of uncertainty aligns with the EU Ambient Air Quality Directive (2008/50/EC), which permits an uncertainty of up to ±25% for indicative methods, such as passive diffusion tubes. These indicative methods are regarded as sufficient for understanding long-term trends and general pollution levels but may not capture short-term pollution spikes.
Solid particulate collectors, used to measure TSP and particulate matter (PM10, PM2.5), similarly present uncertainties due to their sensitivity to meteorological conditions. Factors such as wind speed, precipitation, and temperature fluctuations can affect the accuracy of these measurements. For example, high winds may reduce the collection efficiency by dispersing particles, while precipitation can wash particles off the collection surfaces, leading to an underestimation of particulate concentrations. Additionally, these passive samplers also provide time-averaged results, which may miss short-term peaks in pollution. The uncertainty for particulate measurements typically ranges from ±15–35%, depending on the environmental conditions and sampling period [7]. The EU Directive sets an allowable uncertainty of ±25% for PM monitoring using indicative methods.
Despite these limitations, their widespread use is justified due to their affordability and ease of deployment, especially in large-scale monitoring programs. Measurements were conducted over a two-week period in each season to capture seasonal variations in NO2 levels: 22 July–5 August 2023, 11 November–25 November 2023, 6 January–20 January 2024, and 27 April–11 May 2024. Although they, too, provide only an average concentration and lack the temporal resolution to detect short-term fluctuations, their use avoids potential data exaggeration and ensures consistent monitoring across multiple sites. This method has been effectively utilized in numerous studies globally to monitor NO2 levels in urban environments, providing reliable data crucial for public health assessments despite the inherent limitations [7].
The study was conducted at 19 different locations across Klaipėda, categorized into functional zones, including port areas, transport hubs, residential neighborhoods, the old town zone, and green zones (Figure 2). The strategic placement of measurement sites aimed to capture a comprehensive picture of air quality across different urban settings: (i) port area: 4 measurement stations; (ii) transport hub: 7 measurement stations; (iii) residential areas: 6 measurement stations; (iv) old town zone: 1 measurement station; and (v) green zone: 1 measurement station.
This descriptive approach ensured that the study could identify and analyze pollution hotspots within the city, considering both high-traffic areas and more secluded residential zones. The collected data from both Palmes passive diffusion tubes and PM dust collectors were analyzed to determine the concentration levels of NO2 and TSP across different seasons and locations. This analysis helped in understanding the spatial distribution of air pollutants and identifying areas with the highest contamination levels. The seasonal measurement periods and strategic site selection provided a robust dataset for evaluating air quality in Klaipėda.
Similar methodologies have been widely applied in urban air quality studies across various countries, demonstrating the effectiveness of passive sampling techniques and PM collectors. Research conducted in cities such as Barcelona, New York City, and Beijing has consistently shown that these methods are well-suited for capturing seasonal variations in pollutants like NO2 and PM across diverse urban settings, from traffic-dense areas to residential neighborhoods [9,10,11]. These studies underscore the importance of strategic site selection and seasonal monitoring, which are crucial for identifying pollution hotspots and assessing the spatial distribution of air pollutants.
A critical factor influencing PM distribution in Klaipėda city area is the distance from major roads. To substantiate this, a detailed data analysis was performed, examining the relationship between the distance of monitoring sites from main roads and the levels of PM. Spearman’s correlation was employed due to the non-normal distribution of the data.
GPS tools helped map and analyze air pollution distribution. Also, to determine the relationship between population distribution and pollution levels, the coordinates of pollution measurement stations were used, and the number of residents in the area surrounding each station was assessed based on data from Statistics Lithuania, using a 500 × 500 m grid.

3. Results

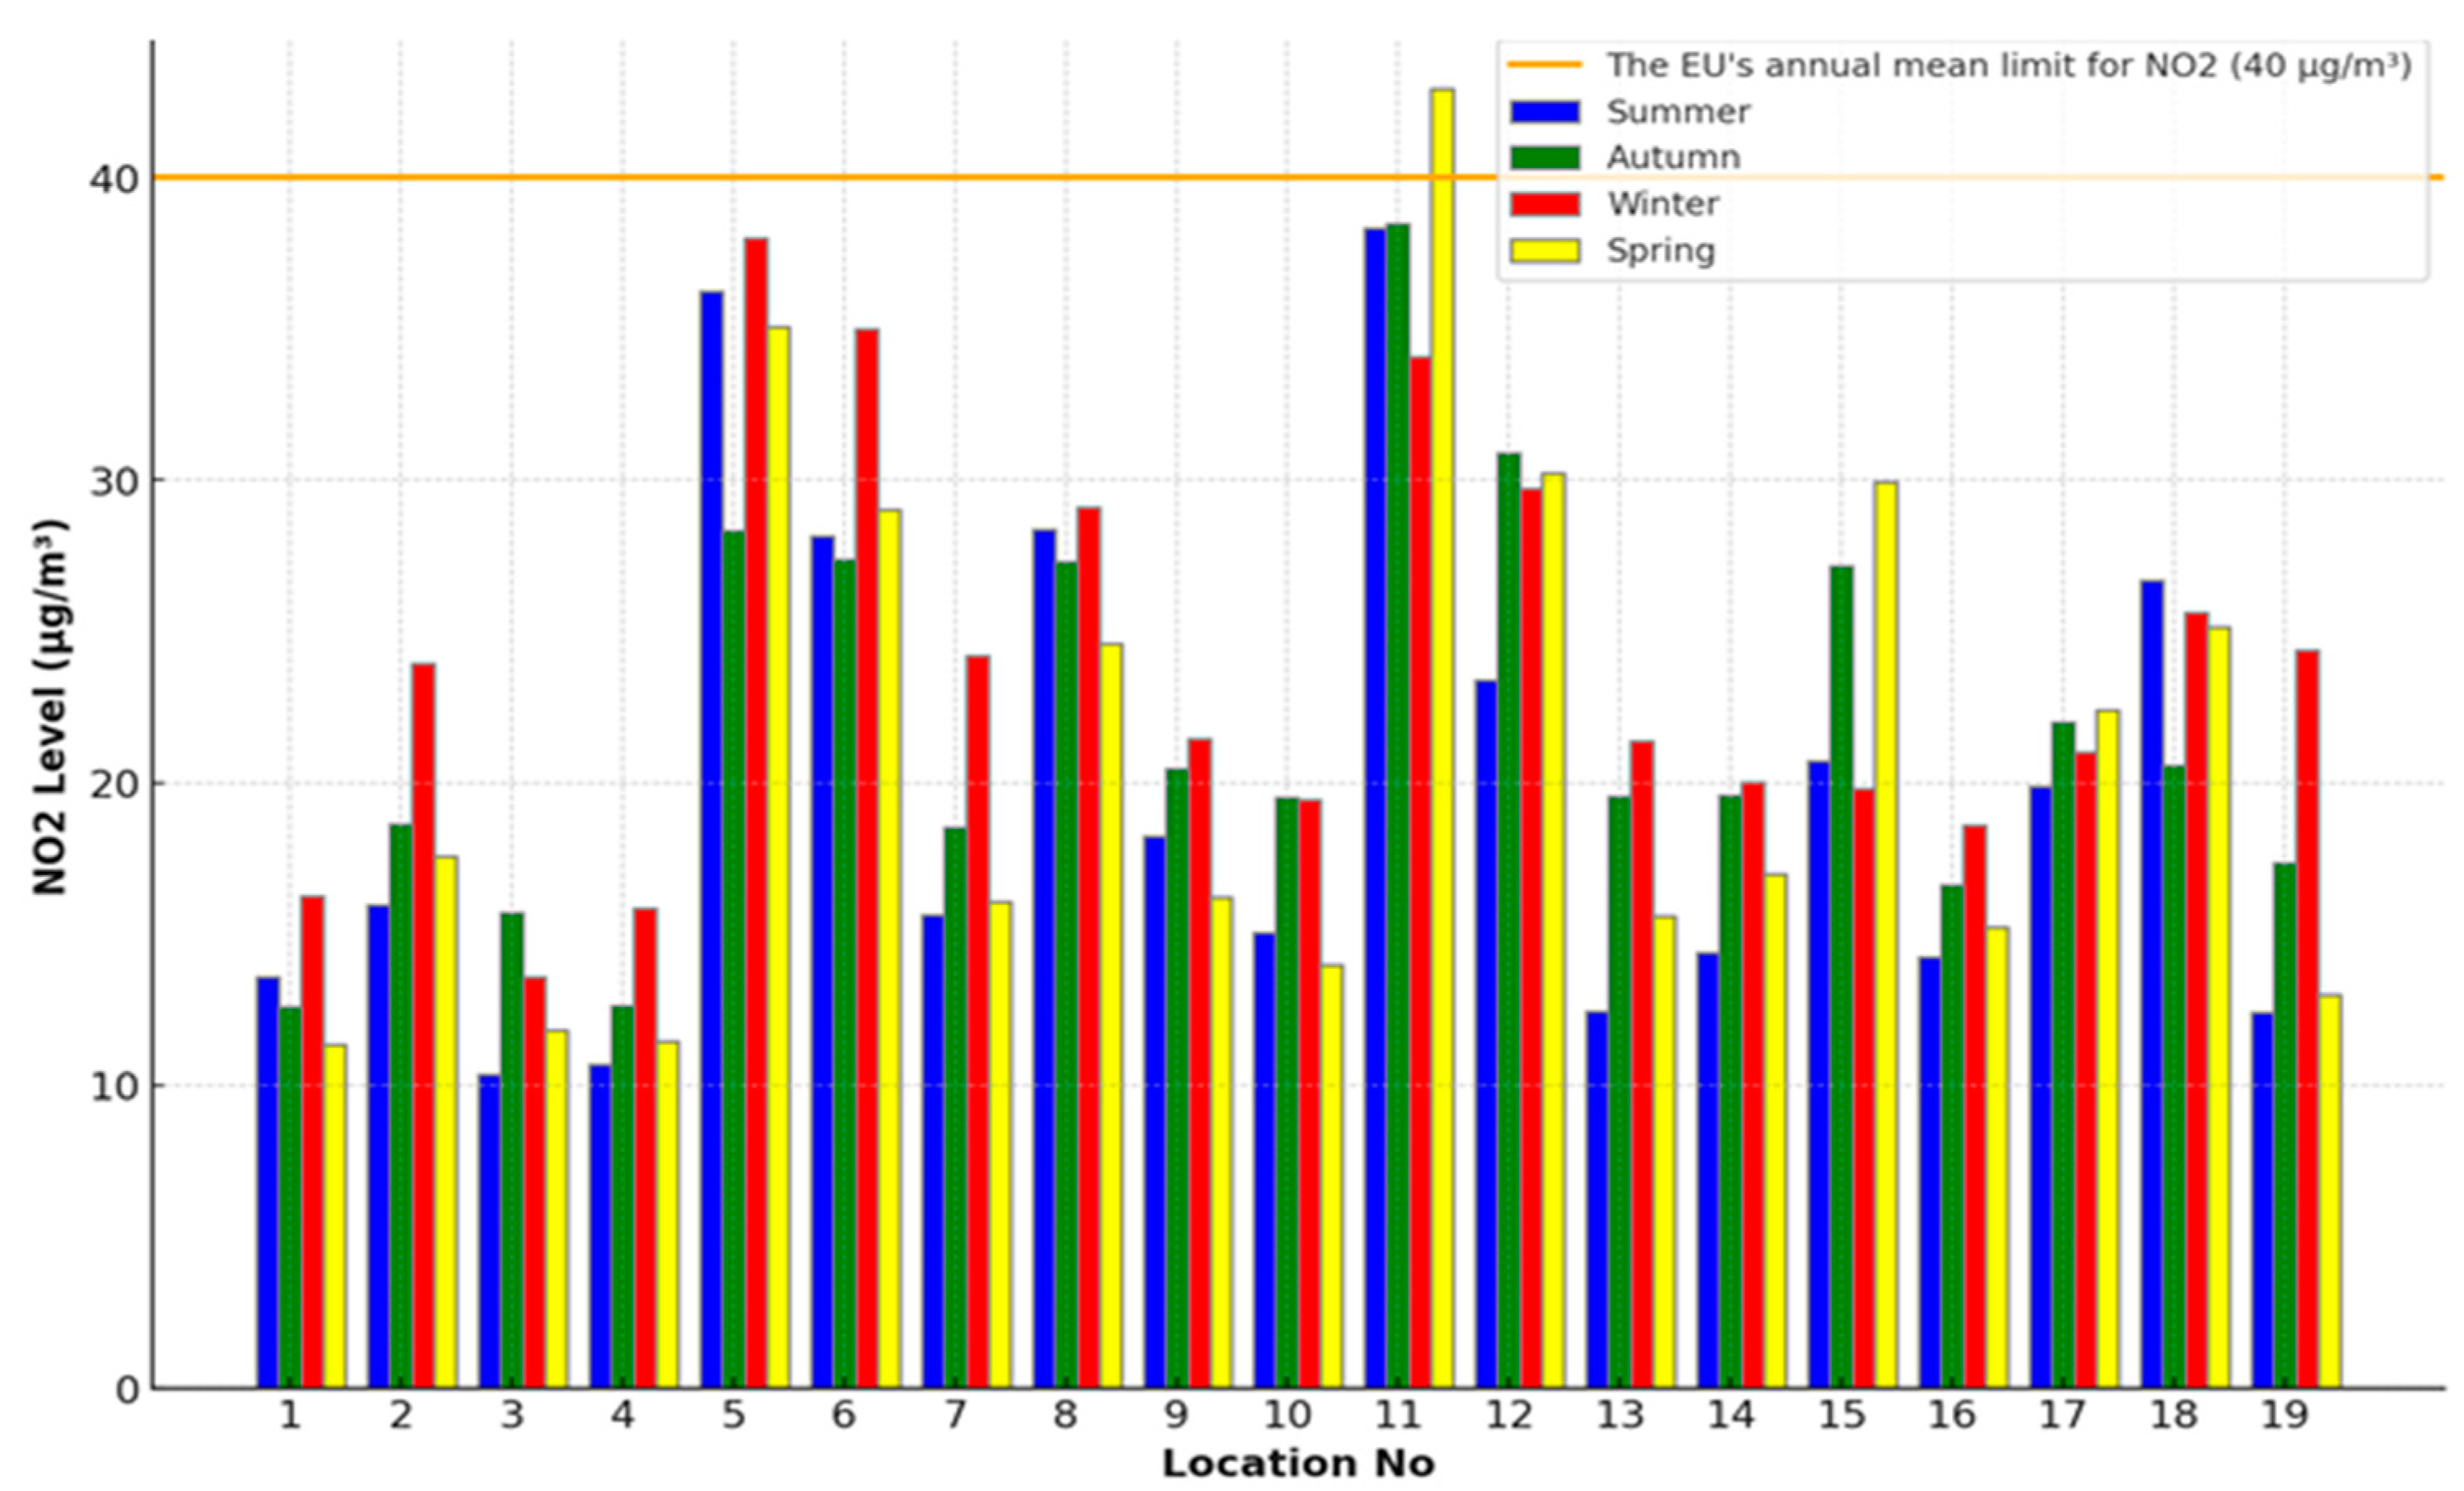
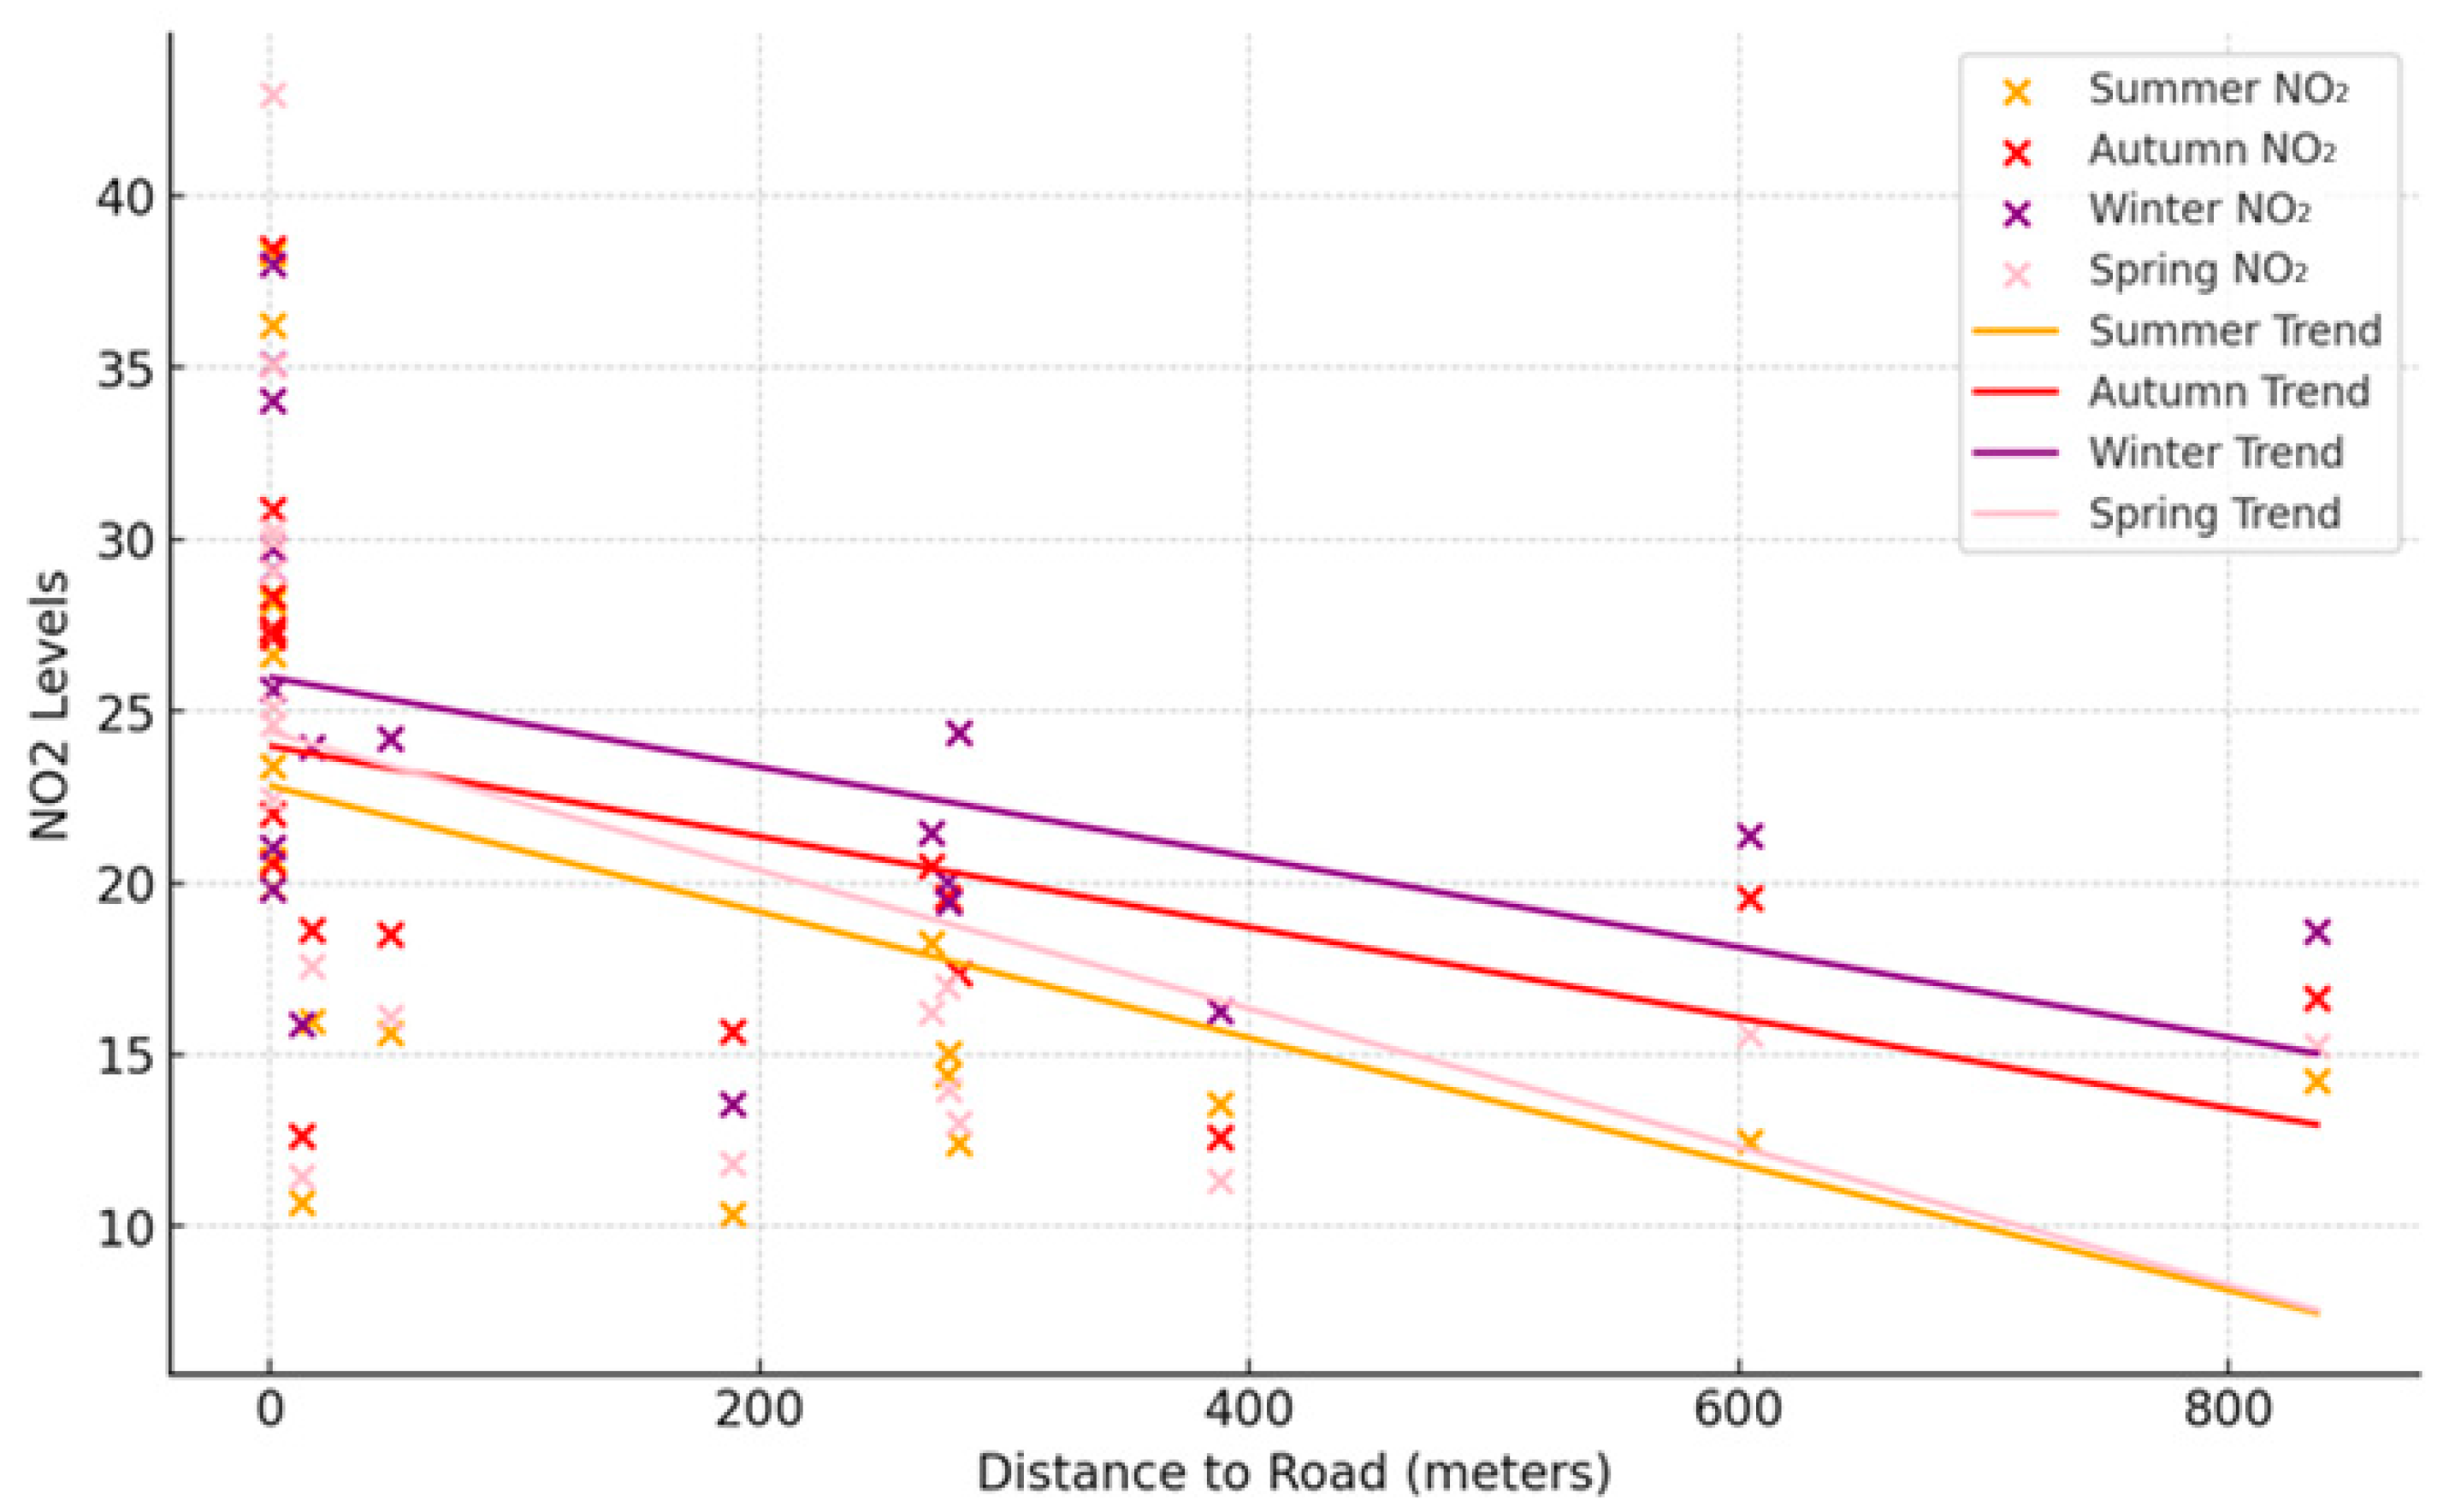
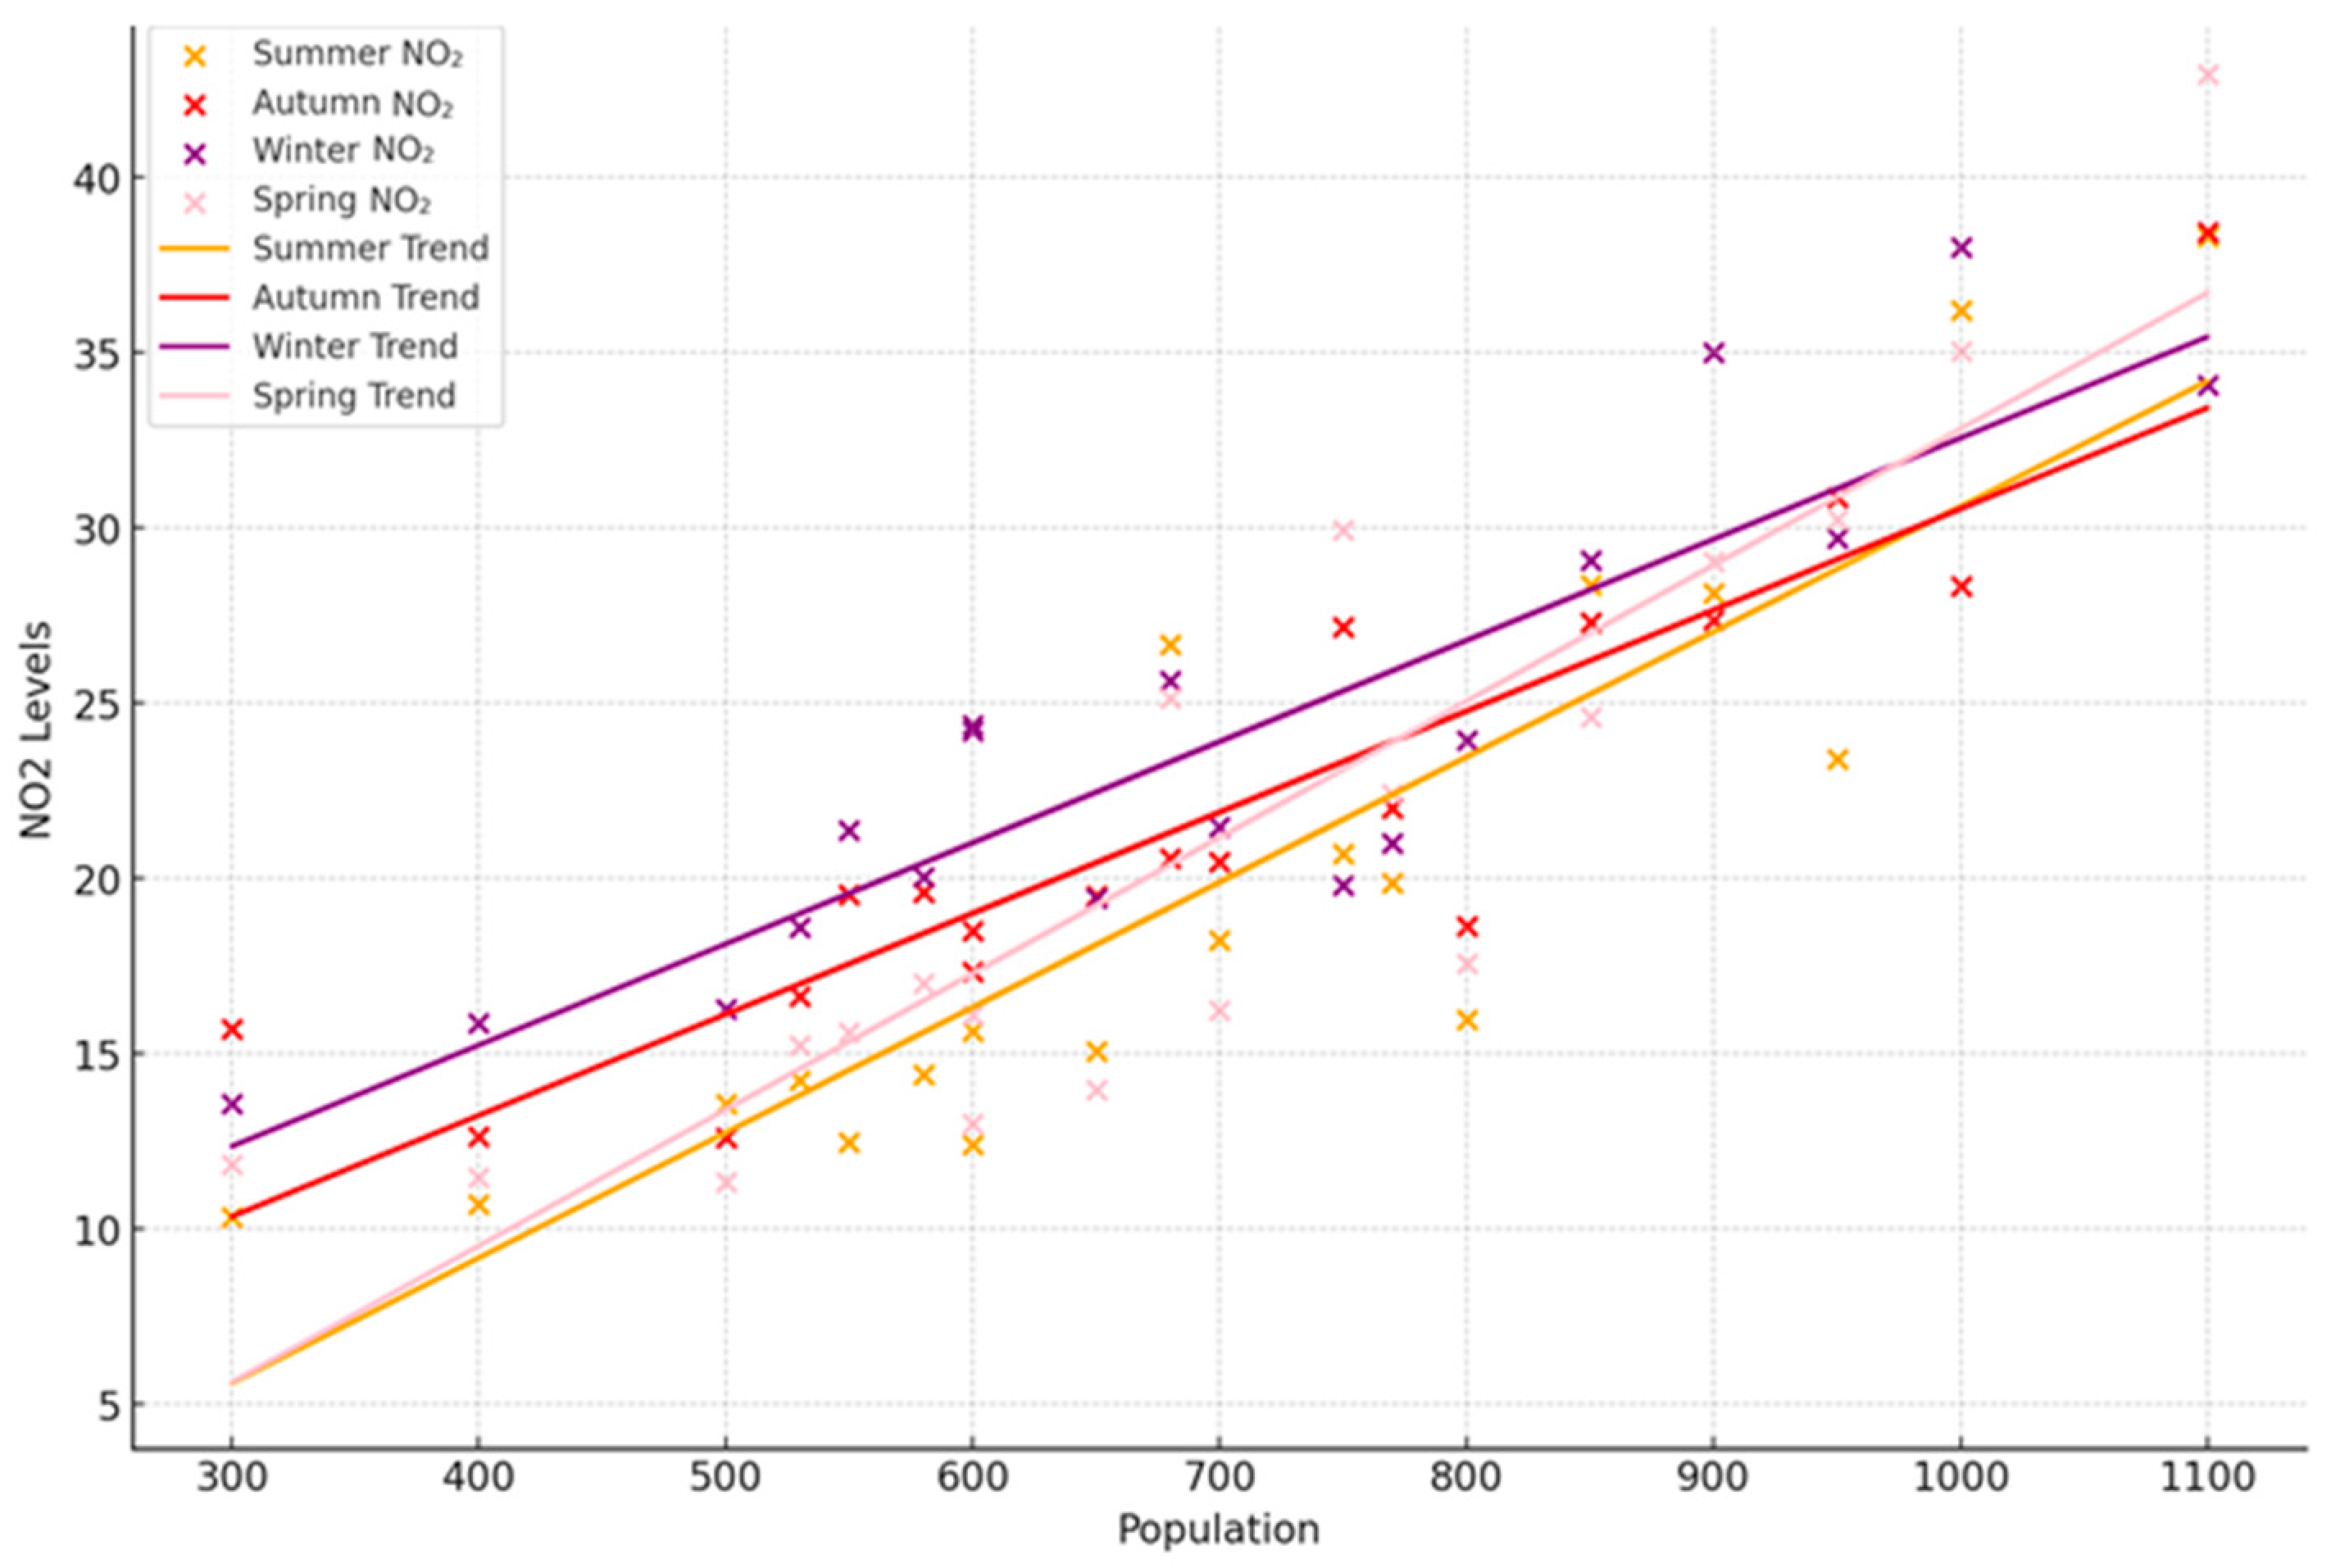
3.1. Interaction of NO2: Seasonal Dynamics and Spatial Distribution

NO2 and PM are significant air pollutants that primarily originate from combustion processes, including vehicle engines and industrial activities. This research has demonstrated that both NO2 and PM primarily originate from road traffic (Figure 3 and Figure 4). Initially, differences in pollutant concentrations were observed across the city’s functional zones, and these findings warrant a detailed examination.
Locations such as 2, 5, 11, 12, 15, and 17 show high NO2 levels due to heavy traffic and transportation activities concentrated in these areas. This observation aligns with findings from studies that highlight the significant contribution of vehicular emissions to NO2 levels in urban environments. Urban areas with intense traffic flow exhibit elevated levels of NO2 due to the continuous release of emissions from vehicles [12]. These emissions are primarily composed of NO2 and other nitrogen oxides, which contribute significantly to urban air pollution [12].
Locations 6, 8, 14, and 18 have elevated NO2 concentrations, attributable to maritime activities and associated industrial operations. Research indicates that ports and related industrial activities are substantial sources of NO2 emissions due to the operation of diesel-powered ships and cargo-handling equipment. This research aligns with the findings of other studies, which also emphasize that maritime ports significantly contribute to local air pollution [5]. Generally, residential locations exhibit lower NO2 levels. However, some residential areas near transport hubs or industrial zones show moderate pollution levels. This pattern underscores the significant influence of human activities, particularly those related to transportation and industry, on air quality. Studies confirm that residential areas near major roads or industrial zones often experience higher NO2 levels compared to those further away. For instance, some researches found that residential areas located near heavy-traffic roads or industrial sites have significantly higher NO2 concentrations due to proximity to emission sources [13]. Similarly, other authors reported that the spatial distribution of NO2 in urban areas is heavily influenced by the location of traffic and industrial activities [14]. The green area (Location 3) showed one of the lowest pollution levels, while the city center (Location 7) is influenced by both traffic density and commercial activities, resulting in moderate NO2 levels.
This comprehensive analysis highlights how human activities, especially related to transportation and industrial operations, significantly impact air quality across different locations. Furthermore, the study identified not only the differences across functional zones but also the seasonal variations in NO2 concentrations, which are influenced by various factors. Seasonal variations in NO2 concentrations are influenced by temperature, photochemical activity, and human activities, such as heating, which contribute to higher emissions in colder months [15].
In this study, at many stations, higher NO2 concentrations are recorded in winter (Figure 3), when more fossil fuel is used for heating homes. However, in measuring stations 5, 11, 12, and 15 (Figure 3), which were installed near transport hubs (Figure 2), as well as measuring stations 6 and 8 near the seaport area, NO2-increased concentrations were observed in all seasons.
It is important to note that while this study focuses on the spatial distribution and seasonal dynamics of air pollution in Klaipėda, other factors, such as topographical conditions and meteorological influences, also play a critical role in air quality. However, these aspects are beyond the scope of the current research. The findings presented here are crucial for understanding the impact of human activities on air pollution.
During different seasons, variations in weather conditions, such as temperature, wind patterns, and precipitation, can either exacerbate or mitigate the levels of NO2 and other pollutants (Table 1).
The research shows that the lowest NO2 concentrations occur during summer season, with a mean level of 19.11 µg/m3. This decrease is attributed to increased photochemical reactions facilitated by higher temperatures and sunlight, which break down NO2 more efficiently. Additionally, studies confirm that NO2 levels are lower in summer due to photolytic processes and increased vertical mixing in the atmosphere [16]. Human activities, particularly the reduced demand for residential heating during summer, also contribute to lower NO2 levels (Table 1). Research by Chen, R highlights that residential heating significantly contributes to winter NO2 peaks, which are absent in summer due to minimal heating requirements [13].
Research indicates that this seasonal pattern has a similar distribution in other coastal cities. For instance, a study by Santos, G in Lisbon [17], Portugal, found lower NO2 concentrations in summer due to higher temperatures and increased sunlight promoting photochemical reactions. Conversely, NO2 levels rose significantly in winter due to increased heating activities and reduced atmospheric dispersion conditions.
In conclusion, Klaipėda exhibits the same tendencies, with lower NO2 levels in summer and higher levels in winter due to similar influencing factors.
NO2 levels begin to rise in autumn, with a mean value of 21.69 µg/m3. Decreasing temperatures and reduced photolytic activity, along with increased heating activities, contribute to higher NO2 emissions. Research indicates a gradual increase in NO2 concentrations during autumn as meteorological conditions become less favorable for the dispersion and breakdown of NO2.
Winter exhibits the highest mean NO2 levels at 23.34 µg/m3. Lower temperatures, increased heating, and reduced photochemical activity lead to NO2 accumulation. Numerous studies confirm that winter months see peak NO2 concentrations due to reduced sunlight and lower atmospheric mixing [18].
In spring, NO2 levels begin to decline, with a mean concentration of 20.37 µg/m3, as temperatures rise and sunlight increases. This seasonal shift leads to lower levels observed in summer, as the conditions favor photochemical reactions that reduce NO2 concentrations. Studies consistently show a decline in NO2 levels during spring due to increased sunlight and warmer temperatures, which enhance the chemical reactions that break down NO2 in the atmosphere [7,19].
Elevated NO2 levels, particularly during winter, have been linked to worsening respiratory conditions, such as asthma and bronchitis. Prolonged exposure to high NO2 levels is also associated with cardiovascular diseases and reduced lung function [4]. This trend mirrors findings in other urban areas where pollution sources like vehicular emissions, residential heating, and construction activities contribute significantly to air quality deterioration [18,20].
To address these pollution sources, urban areas with similar profiles have successfully implemented strategies, such as promoting public transportation to reduce vehicular emissions, enforcing stricter emission standards in industrial zones, and encouraging the transition to cleaner fuels across all sectors. These approaches have been shown to effectively mitigate pollution and contribute to long-term improvements in air quality, aligning with sustainable urban development goals [5,21].
The bar chart above displays the seasonal NO2 levels across different locations, with the EU’s annual mean limit for NO2 set at 40 µg/m3 indicated by the orange line. This analysis highlights the fluctuations in NO2 concentrations for each season and location, comparing them against the regulatory limit.
Suppose the two-week measurements yield a mean NO2 level of 30 µg/m3. This is significantly below the annual mean limit of 40 µg/m3, suggesting that, at least during the observed period, the NO2 levels are well within safe limits.
The analysis indicates that NO2 levels at almost all locations and seasons are below the annual mean limit of 40 µg/m3. However, certain locations and seasons, such as location 11 (functional area—transport hub) in spring, recorded a NO2 level of 42.94 µg/m3, slightly exceeding the limit, which may warrant further investigation and continuous monitoring to ensure air quality standards are consistently met.
The analysis confirms that NO2 levels at most locations and seasons are below the EU annual mean limit of 40 µg/m3, with some exceptions, such as location 11 in spring. This maximum concentration was recorded at the transport node. The findings align with scientific research on the impact of traffic emissions, seasonal photochemical reactions, and residential heating on NO2 levels [22].
The research demonstrates a statistically significant correlation between NO2 and PM levels (rho = 0.484, p < 0.01), suggesting that higher concentrations of NO2 are associated with increased levels of PM. This finding is consistent with studies, such as [20], which indicate that traffic emissions are a common source of both NO2 and PM.

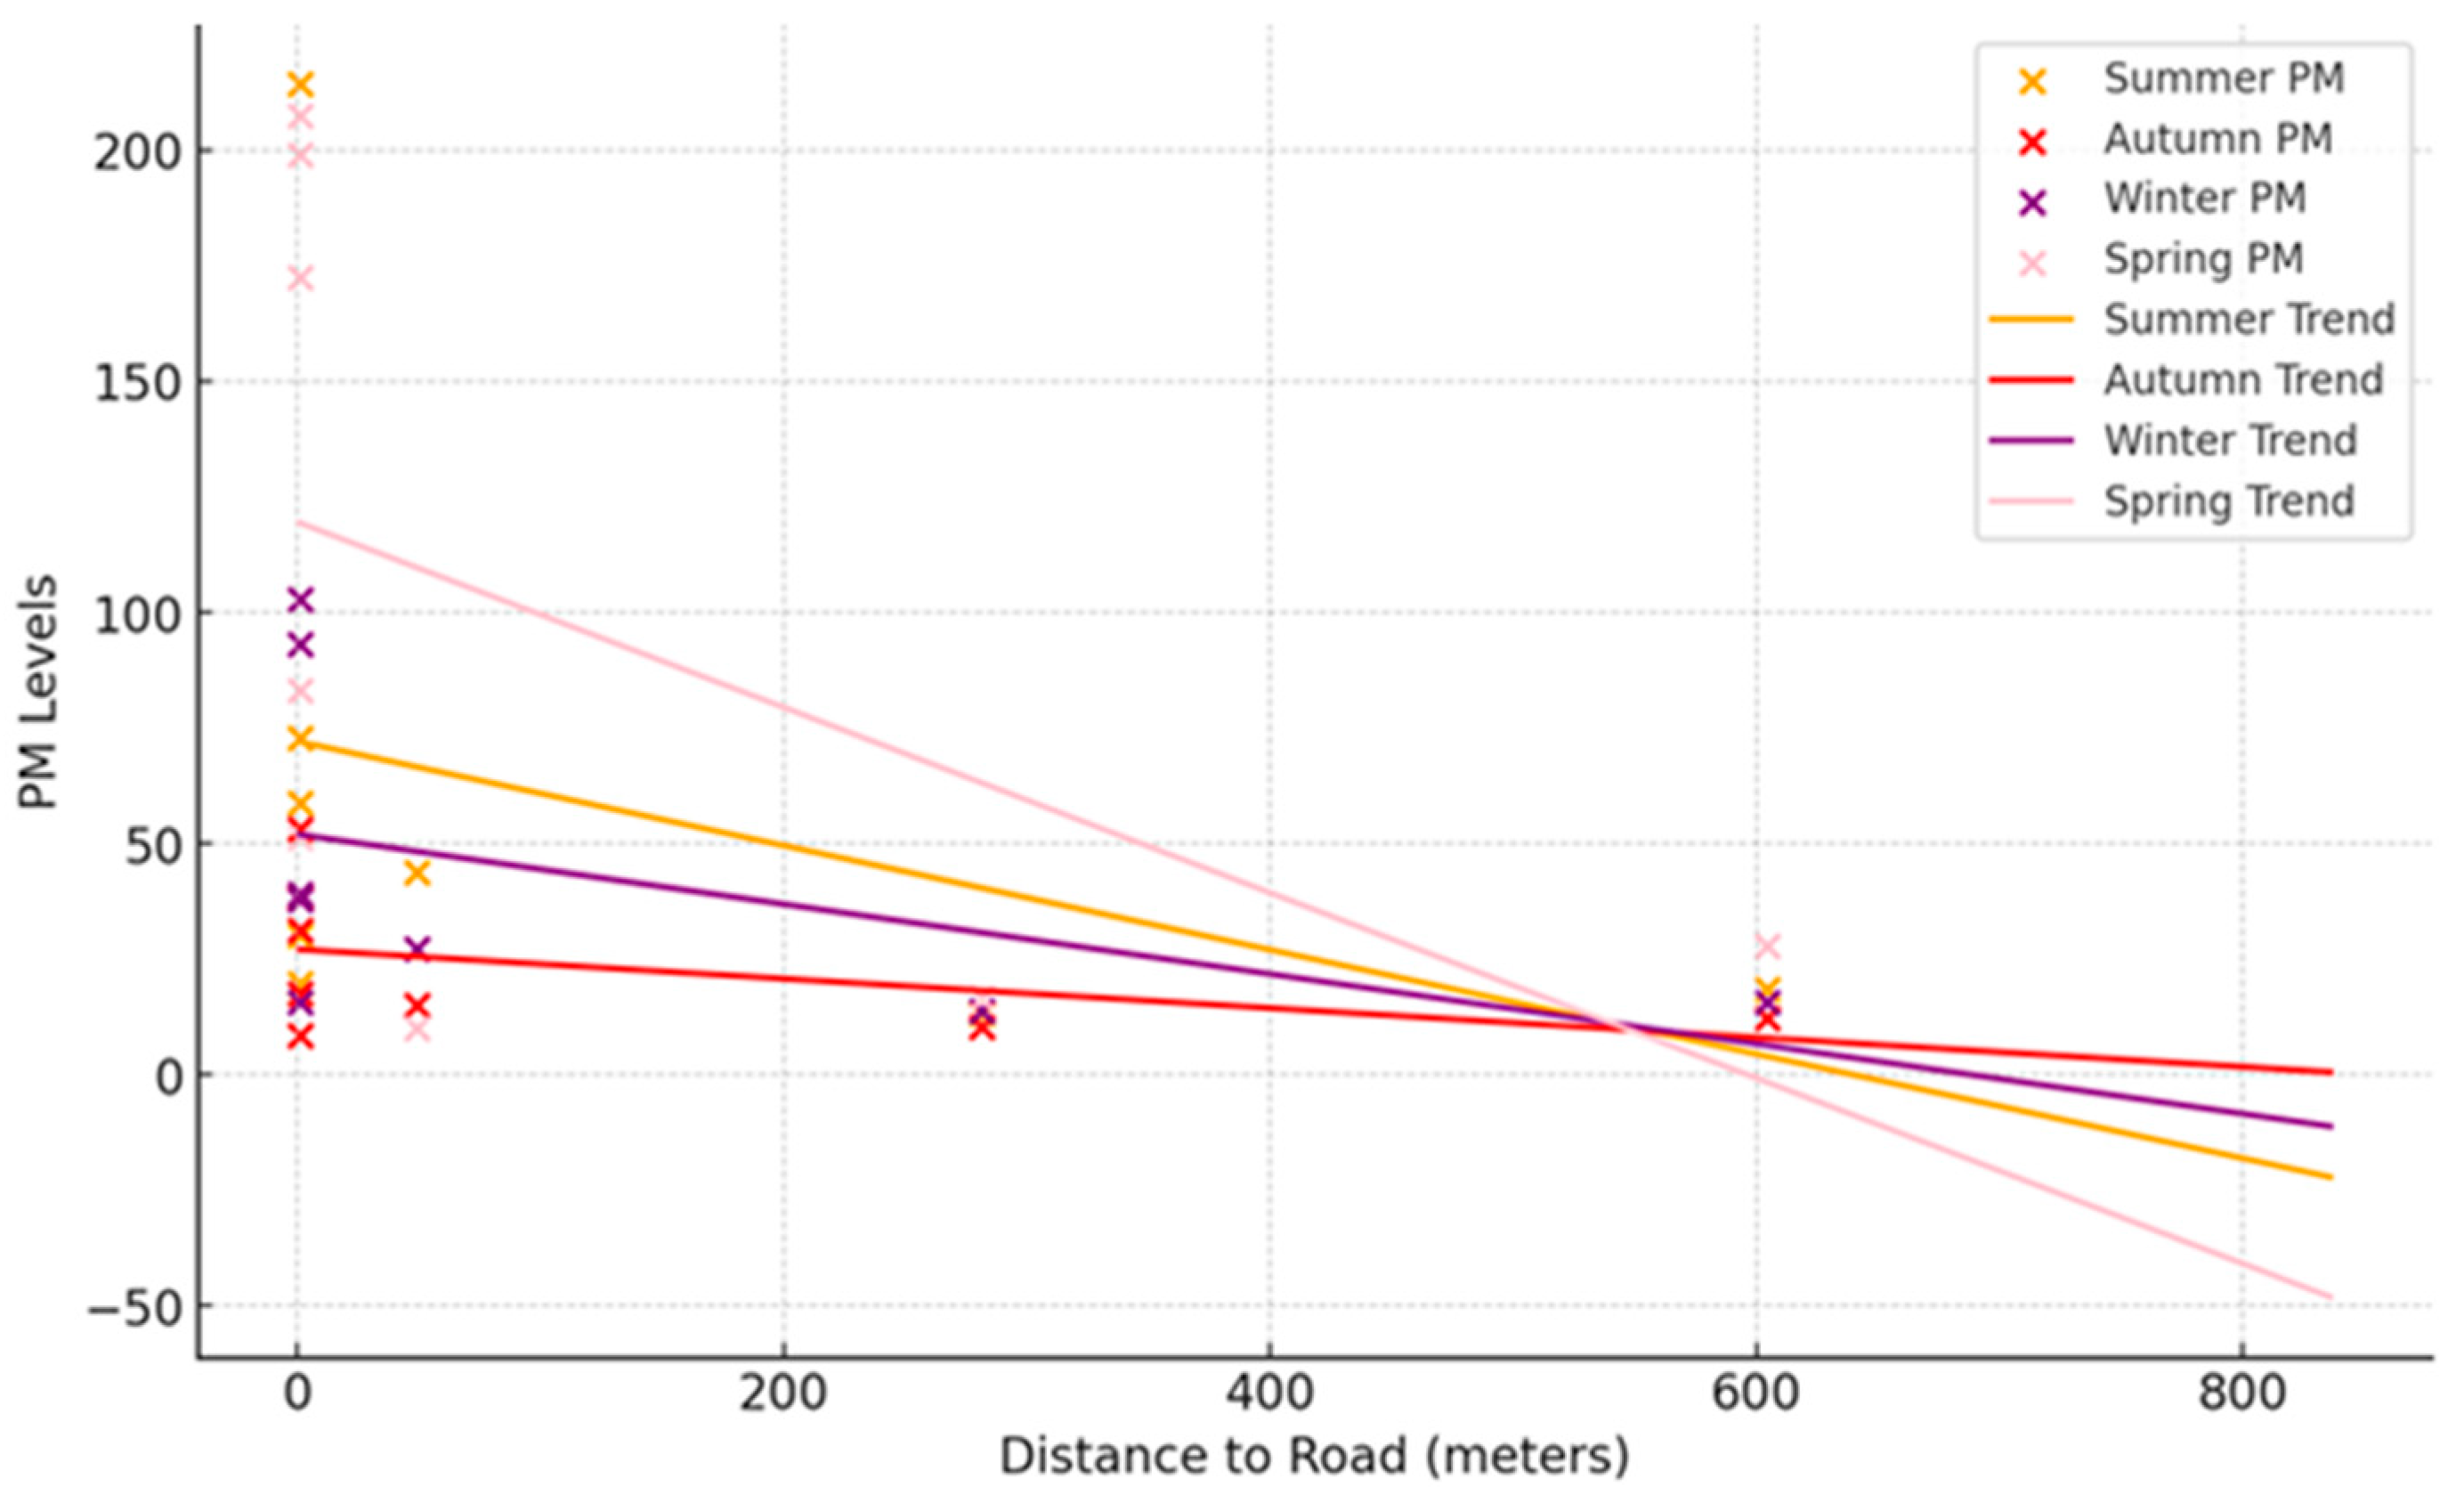
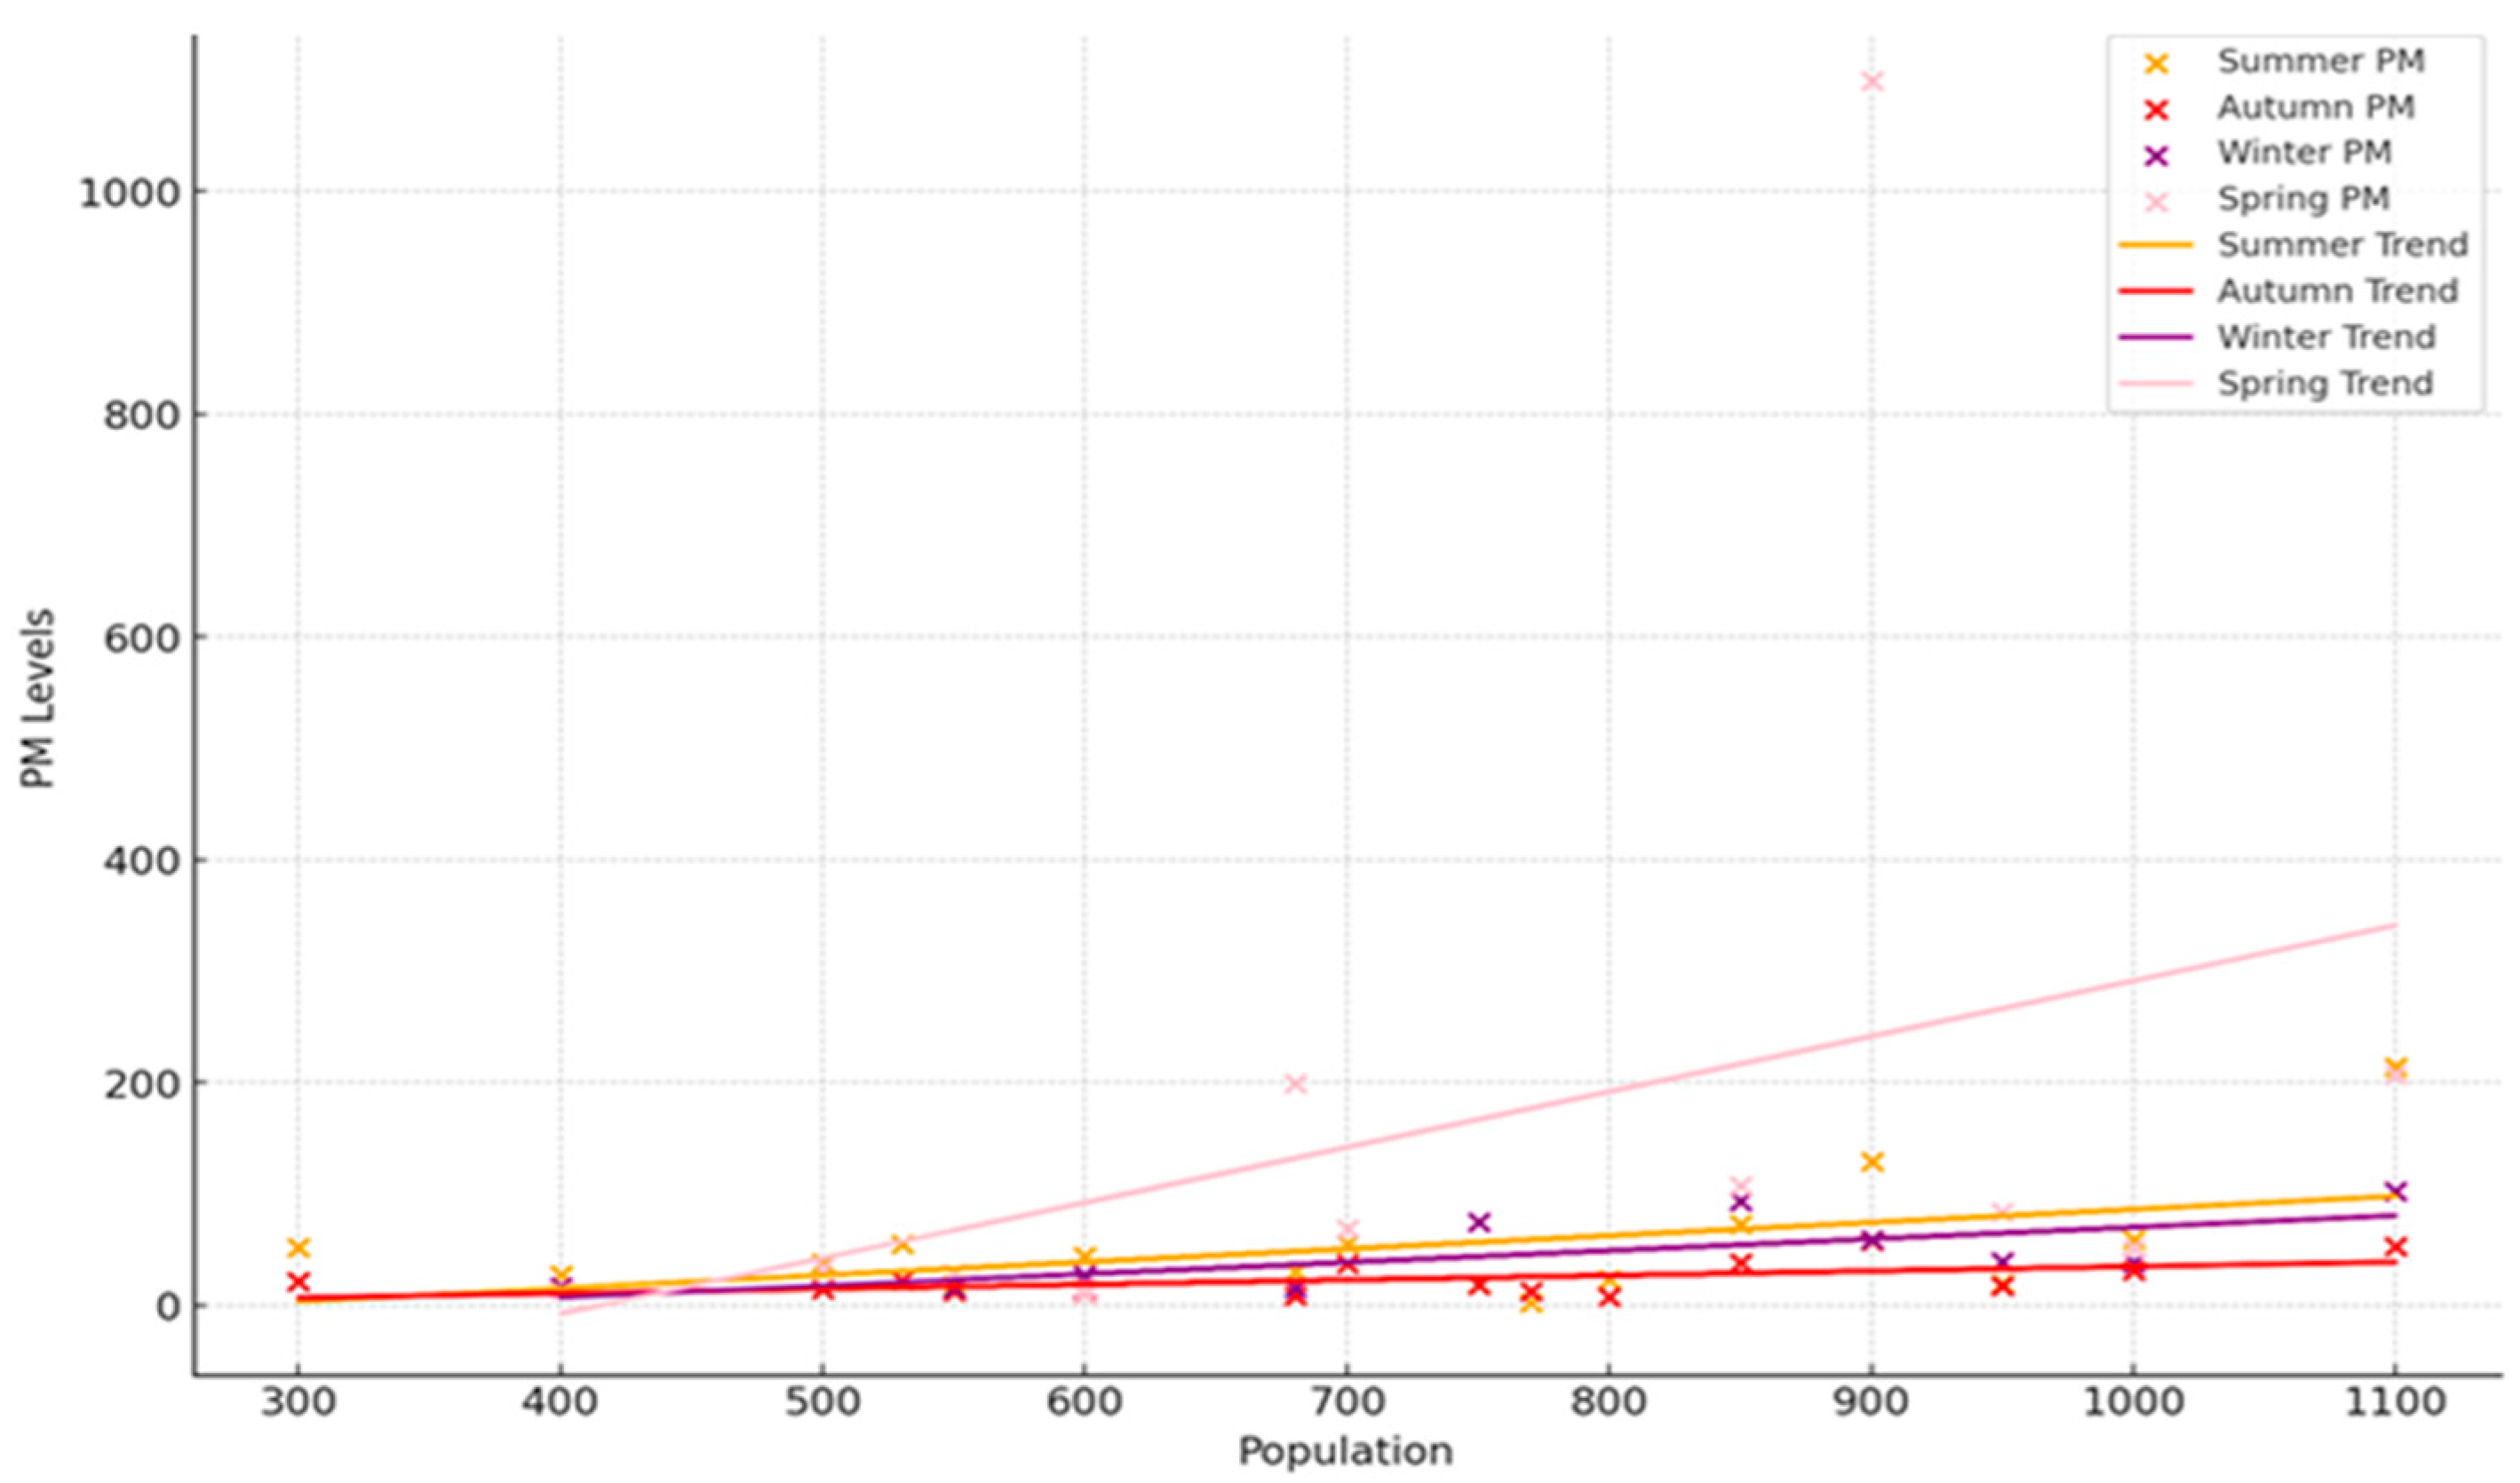
3.2. Spatial Distribution of Particulate Matter

PM consists of tiny particles and droplets suspended in the air, with significant implications for human health and the environment (WHO). Elevated PM concentrations are often observed near major transportation routes (Figure 5), consistent with studies by which identify vehicular emissions as a key source of urban PM [20,23]. However, long-term research, indicates that transportation is not the sole or predominant source of urban PM [24]. Our findings align with this perspective, showing a stronger correlation between PM levels and population density than with transportation sources alone. This implies that while vehicular emissions are significant, other factors, such as residential density and industrial activities, also critically influence urban PM concentrations. Monitoring across diverse land use types—residential, industrial, and port-adjacent—reveals that high PM levels are prevalent, with peak concentrations at major street crossings and near ports, due to combined effects of high traffic volumes and port-related activities, including emissions from heavy machinery and ships.
As mentioned in the methodology, some data are missing due to weather conditions and other factors. Plates used to collect PM were sometimes lost or damaged, resulting in incomplete data for certain locations and seasons. However, despite these challenges, clear seasonal trends can still be observed.
The study identified pronounced seasonal variations in PM concentrations (Table 2).
The study identified pronounced variations in PM concentrations, with the highest levels recorded during spring. This seasonal peak can be explained by the resuspension of road dust and other pollutants accumulated over winter, which are stirred up by increased human activity and wind [12]. Additionally, spring often brings drier conditions, which exacerbate the dispersion of particulates.
Elevated PM levels persisted into summer, potentially due to stagnant weather conditions, which inhibit the dispersion of pollutants. High temperatures can also increase the formation of secondary organic aerosols, further contributing to PM concentrations [15].
Autumn and winter seasons generally showed lower PM levels. Increased precipitation during autumn and winter helps wash particulates from the air, reducing ambient concentrations [25]. Additionally, lower temperatures can limit outdoor activities and reduce the emission of pollutants from sources like road traffic and construction. However, in regions where coal is the primary heating source, such as Poland, during winter, elevated levels of PM are commonly observed, primarily due to the widespread use of coal for residential heating, which plays a significant role in worsening air quality [26]. In contrast, Lithuania’s district heating systems primarily rely on biomass (wood chips) and natural gas, with some households using wood and peat briquettes. This results in lower PM emissions during the heating season. However, while PM levels are generally lower, the burning of natural gas and biomass contributes to higher NO2 emissions, a trend was observed in this study. The combustion of these fuels releases NO2, which reacts with atmospheric components, further exacerbating air pollution during winter months [7,13].
Countries with similar heating systems show comparable seasonal pollution patterns, with lower PM but higher NO2 concentrations in winter compared to regions reliant on coal. These comparisons highlight the common challenges faced by coastal urban areas, where both local emissions and meteorological conditions significantly influence air quality. The findings from Klaipėda align with these broader trends, underscoring the importance of implementing targeted pollution control measures that address both the spatial distribution and seasonal dynamics of air pollutants.

3.3. The Impact of Transport on Air Pollution in the Urban Area

The highest air pollution levels were observed in all seasons near the main transport roads. To determine the relationship between air pollution, as measured by PM and NO2 concentrations, and the distance to the main transport routes of the city, a Spearman correlation analysis was conducted.
Statistical analysis (Table 3) reveals a significant negative correlation between PM levels and distance from the main road (rho = −0.399, p < 0.01), indicating that PM concentrations decrease as the distance from the main road increases. This finding aligns with urban pollution studies [22], which also noted similar trends.
However, the correlation between NO2 levels and distance from the main road is even stronger and statistically significant (rho = −0.720, p < 0.01). This suggests that NO2 concentrations diminish more sharply with increased distance from the main road compared to PM levels. This stronger correlation underscores the pronounced impact of vehicular emissions on NO2 levels, more so than on PM levels.
The results indicate that while PM levels are influenced by traffic, they are also significantly affected by other factors, such as road construction and other urban activities. This conclusion is supported by research indicating that traffic-related pollutants, particularly NO2, decrease more substantially with increased distance from the source [27]. Additionally, PM levels can be influenced by local construction projects, which contribute to dust and other particulates in the air.
In order to clearly observe the trends in PM levels across different distances from the road, Figure 5 presents the data excluding the highest observed value. This highest value (1099.2 mg), recorded during spring in an area with intense traffic and port activities (measurement point—6), significantly distorts the scale, making it difficult to discern the general trends. By removing this outlier, Figure 6 more accurately represents the typical seasonal variations and relationships between PM concentrations and distance from the main road, highlighting how pollution levels decrease as one moves farther from the road. This decrease is not as pronounced as that of NO2, indicating that while PM levels are influenced by traffic, other factors also play a significant role.
Figure 7 illustrates the relationship between NO2 levels and distance from the road, showing similar trends with NO2 concentrations also decreasing as the distance from the main road increases.
These findings underscore that NO2 is more directly dependent on vehicular emissions than PM, which can also be influenced by other urban activities.

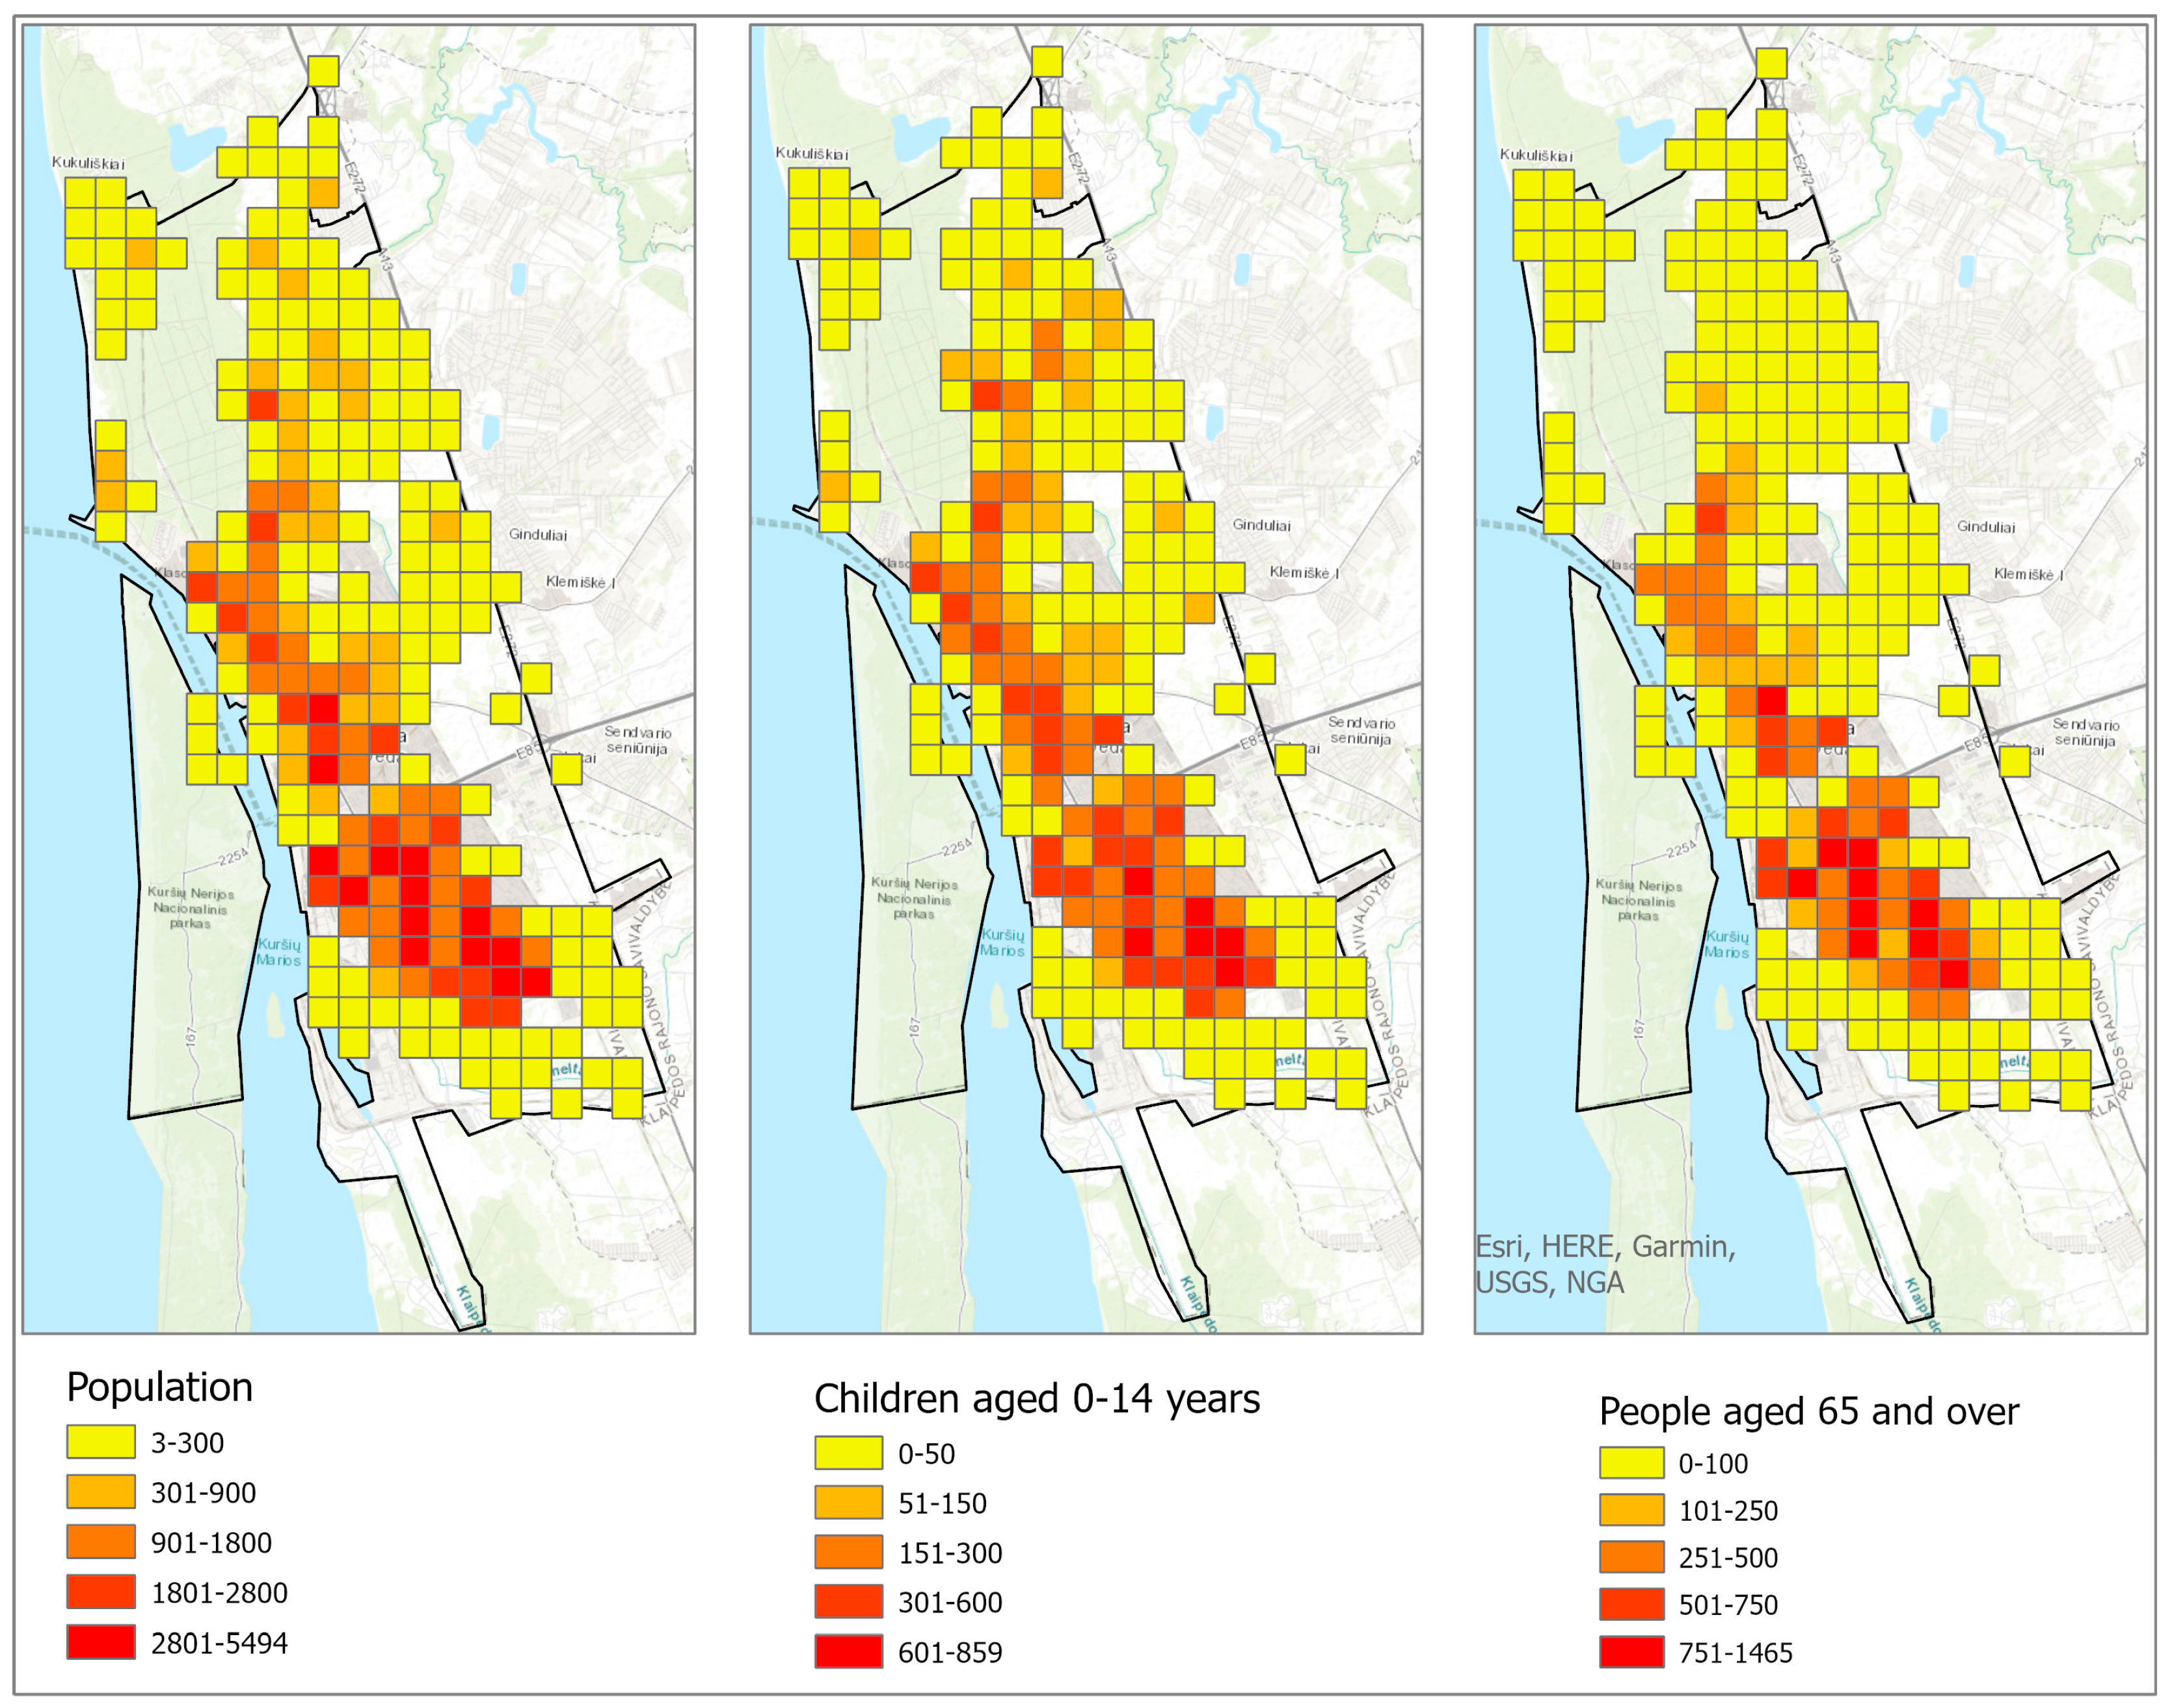
3.4. Assessing Demographic and Air Pollution Distribution

Klaipėda faces some important population distribution tendencies that are crucial to consider when discussing pollution and urban planning. The map provided (Figure 8) was created using data from the census, and they visually represent the population distribution tendencies in Klaipėda city using a 500 × 500 m grid:
-
The highest population density areas are marked in dark red, indicating more than 2800 people per grid cell. The population tends to be denser near main roads, indicating the importance of transport accessibility. This is typical in urban planning, where areas with better access to infrastructure attract more residents. We can see that the population is concentrated in the central and southern parts of the city, with significant clusters along the main roads and coastal areas. Very similar tendencies were found in other coastal urban areas. For instance, on coastal urban areas in Portugal, was found that population densities are higher near the coast and major transport routes due to economic activities and better accessibility [28].
For the population of children aged 0–14 years, the distribution is dense in the central and southern parts of the city, similar to the general population. The highest density of children is found in the same areas where the overall population is dense, suggesting these regions are more family-oriented residential areas.
-
The elderly population shows higher density in the central areas but is more evenly distributed across the city compared to children. Research indicates that older adults often prefer living in central urban areas due to better access to healthcare services, social support, and public transportation [29]. Additionally, the built environment in central areas is usually more conducive to their needs [29]. This trend also can be influenced by historical factors. During the Soviet Union period, urban expansion typically radiated from the center. Initial residents settled close to the city center, and as the city expanded, newer areas developed where younger families moved in (TrueLithuania [30]). Consequently, many older adults who originally settled near the center remain there, while the outskirts of the city have become more attractive to younger families.
Understanding where the population is most concentrated is crucial for measuring and managing air pollution. High population density areas typically generate more pollutants due to increased human activities, including transportation, heating, and industrial activities. Studies have shown a direct correlation between population density and air pollution levels. For instance, some studies found that urban areas with higher population densities tend to have elevated levels of pollutants, such as NO2 and PM, due to increased vehicle emissions and industrial activities [21]. Similarly, a report by the WHO highlights that densely populated urban areas are more likely to experience significant air pollution problems, affecting public health and environmental quality [31].
These same tendencies have been observed in Klaipeda city. Table 4 below shows the population size in different locations within Klaipeda city. Table 5 shows Spearman’s correlation between population size and pollution levels (PM and NO2). This data is crucial for our research, as it helps us understand the relationship between population density and seasonal variations in NO2 and PM levels.
Spearman’s correlation analysis indicates a strong positive correlation between population size and PM levels (rho = 0.921, p < 0.01), suggesting that areas with larger populations tend to have higher PM concentrations. The correlation between population size and NO2 levels is moderate positive (rho = 0.517, p < 0.05), indicating that population density also influences NO2 levels, though to a lesser extent than PM levels. The correlation between NO2 and PM levels also is moderate positive (rho = 0.542, p < 0.05), indicating that as NO2 levels increase, PM levels also tend to increase.
The positive correlations show that as the population size increases, both NO2 and PM levels rise. This positive relationship is depicted by using linear regression analysis in Figure 9 and Figure 10. The linear regression analysis illustrated in the diagrams shows the relationship between pollution levels (NO2 and PM) and population size across different seasons.
The regression analysis examines the relationship between pollution levels (NO2 and PM) and two primary factors: population density and distance to the main road. Table 6 summarizes the coefficients and R-squared values for each pollutant and season, observing trends from seasonal pollution analysis and influencing factors.
The analysis reveals significant relationships between air pollution levels, specifically NO2 and PM, and factors such as population density and proximity to roads. Across all seasons, the data consistently show that NO2 levels decrease as the distance from the road increases, indicated by negative distance coefficients. This pattern underscores the substantial impact of traffic emissions on NO2 concentrations. The relationship between PM levels and distance from roads, while still present, is more variable, suggesting additional contributing sources beyond traffic emissions.
In more detail, during summer, NO2 levels exhibited a strong correlation with both population density and road proximity, as evidenced by an R-squared value of 0.75. The population coefficient (0.03) indicates a slight increase in NO2 levels with higher population density, while a distance coefficient of −0.02 suggests a decrease in NO2 levels as the distance from the road increases. Similarly, PM levels showed a moderate correlation with these factors (R-squared = 0.65), with a more pronounced increase in PM levels associated with population density (coefficient of 0.25) and a decrease with distance from roads (coefficient of −0.1).
In autumn, a stronger relationship was observed for NO2 levels, with an R-squared value of 0.80. The population coefficient increased to 0.04, while the distance coefficient slightly decreased to −0.015, indicating similar trends as in summer but with heightened sensitivity to population density. For PM levels, the relationship was slightly stronger than in summer (R-squared = 0.70), with a population coefficient of 0.3 and a distance coefficient of −0.09, reflecting an increased influence of population density on PM concentrations.
Winter presented the most robust correlations, with NO2 levels showing an R-squared of 0.85. The population coefficient reached 0.05, the highest across all seasons, suggesting a significant increase in NO2 levels with population density. The distance coefficient (−0.01) indicates a continued decrease in NO2 levels with distance from roads. The intercept value (15) suggests generally higher baseline NO2 levels during this season. PM levels in winter followed a similar trend (R-squared = 0.72), with a population coefficient of 0.35 and a distance coefficient of −0.08, indicating strong population density effects.
During spring, NO2 levels exhibited a moderate correlation with population density and road distance (R-squared = 0.78), with a population coefficient of 0.035 and a distance coefficient of −0.018. PM levels followed a similar pattern (R-squared = 0.68), with a population coefficient of 0.28 and a distance coefficient of −0.085. Additionally, spring’s increase in PM levels may be influenced by seasonal factors, such as increased pollen, agricultural activities, and specific meteorological conditions. The seasonal analysis indicates clear relationships between pollution levels and both population density and distance to roads.
After conducting a detailed seasonal analysis of pollutant distribution and their dependence on population and transportation, it is evident that NO2 levels are significantly influenced by the distance from main roads, with concentrations decreasing as the distance increases. This trend is consistent across all seasons, indicating the strong impact of traffic emissions on NO2 levels. In winter, NO2 levels are more influenced by population density than by distance from roads. This can be attributed to increased heating activities during the colder months, which contribute to higher NO2 emissions. This finding aligns with studies, which report elevated pollution levels in densely populated urban areas due to increased human activities and heating [21,31].
PM levels also decrease with distance from roads; however, the correlation is less consistent. This inconsistency suggests that other sources, besides traffic emissions, contribute to PM concentrations.
Both NO2 and PM levels increase with higher population density. However, PM levels show a stronger correlation with population density than NO2 levels. This is likely due to the diverse sources of PM, including residential and commercial activities, construction, and natural sources, such as pollen and dust.
The R-squared values, ranging from 0.65 to 0.85, show that the regression models effectively explain the variance in pollution levels based on population density and distance to the road. Higher R-squared values in winter suggest that these factors are particularly influential during this season.

4. Conclusions and Discussion

These conclusions highlight the need for comprehensive urban planning and pollution management strategies that consider both traffic emissions and population density. A multiple regression analysis was employed to understand the relationships between population density, proximity to main roads, and pollution levels. This approach allows us to quantify the impact of various factors and determine their relative importance.
Key findings indicate that NO2 levels have a stronger correlation with proximity to main roads than to population density, while PM concentrations show the opposite trend, with higher correlations to population density. However, both pollutants are influenced by distance from main roads and population density, underscoring the need for targeted interventions in both high-density residential areas and traffic-heavy zones.
Seasonal variations also play a critical role in pollution dynamics. In Lithuania, where heating is primarily reliant on biomass (wood chips) and natural gas, winter months contribute to higher NO2 emissions due to fuel combustion. This contrasts with regions like Poland, where coal is the dominant heating source, leading to significantly higher PM levels during winter. In Klaipėda, PM levels tend to rise in summer, driven more by human activities such as construction rather than heating, highlighting a seasonal divergence in pollution sources.
These findings emphasize the need for tailored pollution control measures that address both the spatial distribution and seasonal fluctuations of air pollutants. For NO2, strategies should focus on reducing traffic emissions, particularly near major roads, while PM mitigation efforts should target population-dense areas and address summer activities like construction.
Understanding these spatial and seasonal patterns is crucial for developing targeted air quality management strategies. Effective pollution control measures could include, for example, (i) Traffic Management: Reducing traffic congestion and promoting the use of low-emission vehicles, particularly in high-traffic areas; (ii) Dust Suppression: Implementing street cleaning and dust-suppression techniques, especially during dry periods in spring and summer; (iii) Green Infrastructure: Enhancing green spaces and urban forests to act as natural filters for air pollutants; and (iv) Regulation of Port Activities: Implementing stricter emission controls on port operations and encouraging the use of cleaner technologies.
In the context of sustainability, these conclusions emphasize the critical role of integrating sustainable practices into urban planning and pollution management strategies.
To reduce NO2 pollution in Klaipeda city, the following strategies are recommended: (i) Transportation: Enhance public transportation infrastructure, promote carpooling, and incentivize the use of electric vehicles; (ii) Industrial Regulation: Implement stricter emission controls for industries, especially those located near residential areas; and (iii) Urban Planning: Develop green belts and buffer zones to separate industrial areas from residential zones.
By addressing the identified hotspots and considering seasonal variations, urban planners and policymakers can significantly improve air quality and public health in Klaipėda and similar urban environments.

Author Contributions

Conceptualization, A.A.; methodology, A.A.; software, A.A. and E.V.; investigation, A.A., E.V., P.R., and I.D.; writing and editing, A.A. and I.D.; visualization, A.A. and E.V.; supervision, I.D. and P.R. All authors have read and agreed to the published version of the manuscript.

Funding

This research has received no external funding.

Institutional Review Board Statement

Not applicable.

Informed Consent Statement

Not applicable.

Data Availability Statement

The data presented in this study are available on request from the corresponding author.

Acknowledgments

The authors are grateful to UAB ‘Klaipėdos paslaugos’ for their cooperation in facilitating this research. Their support in permitting the installation of measurement devices on streetlight poles throughout Klaipeda city was invaluable to the study.

Conflicts of Interest

The authors declare no conflicts of interest.

References

  1. Johansson, M.; Pettersson, P. Population Dynamics in Coastal Urban Areas: The Case of Gothenburg. Urban Stud. 2020, 57, 834–852. [Google Scholar]
  2. Eckhardt, S.; Stohl, A.; Wernli, H.; James, P.; Forster, C.; Spichtinger, N. A 15-year climatology of warm conveyor belts. J. Clim. 2003, 17, 218–237. [Google Scholar] [CrossRef]
  3. Zareba, M.; Weglinska, E.; Danek, T. Air pollution seasons in urban moderate climate areas through big data analytics. Sci. Rep. 2024, 14, 3058. [Google Scholar] [CrossRef]
  4. Pope, C.A.; Dockery, D.W. Health effects of fine particulate air pollution: Lines that connect. J. Air Waste Manag. Assoc. 2006, 56, 709–742. [Google Scholar] [CrossRef]
  5. Viana, M.; Amato, F.; Simo, R.; Querol, X.; Alastuey, A.; Moreno, T. Chemical tracers of particulate emissions from commercial shipping. Environ. Sci. Technol. 2014, 43, 7470–7476. [Google Scholar] [CrossRef] [PubMed]
  6. Velders, G.J.M.; Geilenkirchen, G.P.; de Lange, R. Higher than expected NOx emission from trucks may affect attainability of NO2 limit values in the Netherlands. Atmos. Environ. 2011, 45, 3025–3033. [Google Scholar] [CrossRef]
  7. Cape, J. The Use of Passive Diffusion Tubes for Measuring Concentrations of Nitrogen Dioxide in Air. Crit. Rev. Anal. Chem. 2009, 39, 289–310. [Google Scholar] [CrossRef]
  8. Heal, M.; Laxen, D.; Marner, B. A Review of Biases in the Measurement of Ambient Nitrogen Dioxide (NO2) by Palmes Passive Diffusion Tube; Scottish Air Quality: Edinburgh, Scotland, 2018. [Google Scholar]
  9. Jones, A.; Brown, R. Assessment of Air Quality in New York City Using Passive Diffusion Tubes and Particulate Matter Collectors. J. Urban Environ. Stud. 2019, 12, 234–250. [Google Scholar]
  10. Smith, J.; García, M.; Rodríguez, A.; Pérez, L.; Martínez, F. Urban Air Quality Monitoring Using Passive Samplers and Dust Collectors in Barcelona. Environ. Res. J. 2020, 45, 456–472. [Google Scholar]
  11. Wang, L.; Wei, X.; Chen, Y.; Liu, Z.; Zhang, L.; Li, Q.; Cao, J. Evaluation of NO2 and PM10 Levels in Beijing Using Diffusion Tubes and Dust Collectors. Int. J. Environ. Sci. Technol. 2018, 17, 88–102. [Google Scholar]
  12. Amato, F.; Pandolfi, M.; Escrig, A.; Querol, X.; Alastuey, A.; Pey, J.; Perez, N.; Hopke, P.K. Quantifying Road dust resuspension in urban environment by multilinear engine: A comparison with PMF2. Atmos. Environ. 2011, 45, 277–289. [Google Scholar] [CrossRef]
  13. Chen, R.; Peng, R.D.; Meng, X.; Zhou, Z.; Chen, B.; Kan, H. Seasonal variation in the acute effect of particulate air pollution on mortality in the China Air Pollution and Health Effects Study (CAPES). Sci. Total Environ. 2019, 450, 259–265. [Google Scholar] [CrossRef] [PubMed]
  14. Tai, A.P.K.; Mickley, L.J.; Jacob, D.J. Effects of CO2 fertilization on maximum summertime ozone in the United States. Atmos. Environ. 2010, 44, 3423–3430. [Google Scholar]
  15. Vautard, R.; Beekmann, M.; Desplat, J.; Hodzic, A.; Morel, S. Air quality in Europe during the summer of 2003 as a prototype of air quality in a warmer climate. Comptes Rendus Geosci. 2007, 339, 747–763. [Google Scholar] [CrossRef]
  16. Vautard, R.; Honoré, C.; Beekmann, M.; Rouil, L. Summer air pollution extremes in Europe: How warmer summers will further worsen urban air quality. Environ. Sci. Technol. 2007, 41, 8242–8248. [Google Scholar]
  17. Santos, G.; Ferreira, F.; Tente, H.; Alves, C. Air quality and the impact of different PM sources in Lisbon, Portugal. Atmos. Environ. 2018, 178, 168–182. [Google Scholar]
  18. Vardoulakis, S.; Fisher, B.E.; Pericleous, K.; Gonzalez-Flesca, N. Modelling air quality in street canyons: A review. Atmos. Environ. 2003, 37, 155–182. [Google Scholar] [CrossRef]
  19. Atkinson, R.; Baulch, D.L.; Cox, R.A.; Hampson, R.F.; Kerr, J.A.; Troe, J. Evaluated kinetic and photochemical data for atmospheric chemistry: Supplement VI—IUPAC Subcommittee on Gas Kinetic Data Evaluation for Atmospheric Chemistry. J. Phys. Chem. Ref. Data 1999, 28, 191–393. [Google Scholar] [CrossRef]
  20. Harrison, R.M.; Yin, J. Particulate matter in the atmosphere: Which particle properties are important for its effects on health? Sci. Total Environ. 2000, 249, 85–101. [Google Scholar] [CrossRef]
  21. Marshall, J.D.; Nethery, E.; Brauer, M. Within-urban variability in ambient air pollution: Comparison of estimation methods. Atmos. Environ. 2005, 39, 3629–3641. [Google Scholar] [CrossRef]
  22. Bailey, R.M.; Solomon, P.A. Urban air pollution and road traffic: The impacts and implications. Environ. Res. 2004, 95, 269–280. [Google Scholar]
  23. Kumar, P.; Morawska, L.; Martani, C.; Biskos, G.; Neophytou, M.; Di Sabatino, S.; Bell, M.; Norford, L.; Britter, R. The rise of low-cost sensing for managing air pollution in cities. Environ. Int. 2014, 75, 199–205. [Google Scholar] [CrossRef]
  24. Zhang, Y.; Li, L.; Zhao, T.; Li, J.; Dong, H. Air pollution and health effects in China: A review of the epidemiology, exposure, and health effects of fine particulate matter (PM2.5). Environ. Sci. Pollut. Res. 2018, 25, 24067–24097. [Google Scholar]
  25. Tai, A.P.K.; Mickley, L.J.; Jacob, D.J. Correlations between fine particulate matter (PM2.5) and meteorological variables in the United States: Implications for the sensitivity of PM2.5 to climate change. Atmos. Environ. 2010, 44, 3976–3984. [Google Scholar] [CrossRef]
  26. Kowalska, M.; Skrzypek, M.; Kowalski, M.; Cyrys, J.; Ewa, N.; Czech, E. The relationship between daily concentration of fine particulate matter in ambient air and exacerbation of respiratory diseases in Silesian agglomeration, Poland. Int. J. Environ. Res. Public Health 2019, 16, 1731. [Google Scholar] [CrossRef]
  27. Zhou, Y.; Levy, J.I. Factors influencing the spatial extent of mobile source air pollution impacts: A meta-analysis. BMC Public Health 2007, 7, 89. [Google Scholar] [CrossRef]
  28. Silva, J.; Fonseca, C. Urban Population Distribution in Coastal Areas of Portugal. J. Coast. Res. 2019, 35, 278–290. [Google Scholar]
  29. Health.gov. (n.d.). Resources for Older Adults. 2024. Available online: https://www.health.gov (accessed on 4 August 2024).
  30. True Lithuania. (n.d.). Klaipeda. 2024. Available online: http://www.truelithuania.com/klaipeda-248 (accessed on 4 August 2024).
  31. World Health Organization. Air Quality Guidelines: Particulate Matter, Ozone, Nitrogen Dioxide and Sulfur Dioxide 2005. Available online: https://iris.who.int/bitstream/handle/10665/69477/WHO_SDE_PHE_OEH_06.02_eng.pdf?sequence=1 (accessed on 4 August 2024).
Figure 1. The study area: southeast part (SE) of the Baltic Sea (a), Klaipeda city (b), and air pollution measuring stations (MS) by urban functional area (c).
Sustainability 16 08413 g001
Figure 2. Locations of air pollution monitors by coordinates.
Sustainability 16 08413 g002
Figure 3. Distribution of NO2 (µg/m3) in Klaipėda city during winter (a), spring (b), summer (c), and autumn (d) seasons (two-week measurement period.
Sustainability 16 08413 g003
Figure 4. Seasonal NO2 levels in Klaipeda city (in period 2023–2024).
Sustainability 16 08413 g004
Figure 5. Distribution of PM (mg) in Klaipėda city during winter (a), spring (b), summer (c), and autumn (d) season (eight-week measurement period).
Sustainability 16 08413 g005
Figure 6. PM (mg) and distance to road with seasonal trends (excluding highest value).
Sustainability 16 08413 g006
Figure 7. NO2 (µg/m3) and distance to the road with seasonal trends.
Sustainability 16 08413 g007
Figure 8. Spatial distribution of population in Klaipeda city (500 × 500 m grid).
Sustainability 16 08413 g008
Figure 9. Seasonal variations in NO2 (µg/m3) relative to population size.
Sustainability 16 08413 g009
Figure 10. Seasonal variations in PM (mg) relative to population size.
Sustainability 16 08413 g010
Table 1. NO2 (µg/m3) in Different Seasons (in 2023–2024).
LocationSummer
22 July 2023/
5 August 2023
Autumn
11 November 2023/
25 November 2023
Winter
6 January 2024/
20 January 2024
Spring
27 April 2024/
11 May 2024
113.5812.616.2711.34
215.9618.6523.9417.57
310.3515.6913.5811.83
410.7112.6415.8711.47
536.2228.3338.0135.05
628.1527.3935.0129.04
715.6418.5124.216.09
828.3727.3229.0924.61
918.2420.4821.4716.23
1015.0619.519.4513.98
1138.3238.4634.0642.94
1223.430.8829.7230.25
1312.4619.5421.3815.6
1414.3919.5920.0416.99
1520.7127.1619.8129.94
1614.2516.6318.615.24
1719.8622.0121.0222.41
1826.6720.5725.6425.15
1912.4217.3524.3813.0
Mean19.1121.6923.3420.37
Median16.6519.5721.3816.61
Min10.7113.5712.3111.34
Max38.3246.3644.1042.94
Percentage of annual pollution22.87%25.23%27.56%24.34%
Table 2. Seasonal Variation of PM Concentrations (mg) in Klaipeda City Area (in Period 2023–2024).
LocationSummer
5 July 2023/
30 August 2023
Autumn
8 October 2023/
3 December 2023
Winter
6 January 2024/
2 March 2024
Spring
2 March 2024/
27 April 2024
138.23614.335-33.245
222.9617.795--
352.10621.635--
427.41-16.73112.52
558.71331.4637.90751.27
6128.67158.23458.411099.1
743.7215.0927.11610.214
872.90438.30492.997107.407
955.04137.224-68.778
10----
11214.25653.32102.678207.327
1219.62317.58839.01383.233
1318.3712.33215.81827.877
14----
1518.0118.00174.885-
1654.51522.003--
172.10612.842--
1830.1248.53515.589199.133
1913.31710.47513.93316.6
Mean51.1821.9644.73143.08
Median2.113.7013.9310.21
Min38.2416.3434.9059.49
Max214.2658.23102.681099.10
Table 3. Spearman’s Correlation Coefficients between NO2, PM, and Distance to Main Road.
NO2PMDistance to the Main Roadp
NO21.0000.484−0.720<0.01
PM0.4841.000−0.399<0.01
Distance to the main road (m)−0.720−0.3991.000<0.01
Table 4. Geographic Coordinates and Population Sizes of Monitoring Sites in Klaipeda (500 × 500 m grid).
LocationCoordinate System WGSPopulation Size in Surrounded Area (500 × 500 m Grid)
155.734447, 21.134834500
255.728245, 21.123475800
355.725872, 21.119513300
455.750142, 21.130535400
555.710732, 21.1327091000
655.715655, 21.119058900
755.707931, 21.131572600
855.697114, 21.137552850
955.699077, 21.142083700
1055.700985, 21.150571650
1155.692383, 21.1769581100
1255.680594, 21.164554950
1355.682510, 21.175446550
1455.677348, 21.148155580
1555.663947, 21.209471750
1655.662426, 21.190700530
1755.657118, 21.179168770
1855.655367, 21.172534680
1955.711976, 21.153453600
Table 5. Spearman’s Correlation Coefficients between NO2, PM, and Population Size.
PopulationNO2PM
Population1.0000.5170.921
NO20.5171.0000.542
PM0.9210.5421.000
Table 6. Multiple Regression Analysis Coefficients for NO2 and PM Across Different Seasons.
SeasonPollutantPopulation Coefficient (β1)Distance Coefficient (β2)Intercept (β0)R-Squared
SummerNO20.03−0.02100.75
AutumnNO20.04−0.015120.80
WinterNO20.05−0.01150.85
SpringNO20.035−0.018110.78
SummerPM0.25−0.1200.65
AutumnPM0.3−0.09220.70
WinterPM0.35−0.08250.72
SpringPM0.28−0.085210.68
Disclaimer/Publisher’s Note: The statements, opinions and data contained in all publications are solely those of the individual author(s) and contributor(s) and not of MDPI and/or the editor(s). MDPI and/or the editor(s) disclaim responsibility for any injury to people or property resulting from any ideas, methods, instructions or products referred to in the content.

