Article

Disaggregated Impact of Non-Renewable Energy Consumption on the Environmental Sustainability of the United States: A Novel Dynamic ARDL Approach

1
Department of Agricultural and Applied Economics, Texas Tech University, 2500 Broadway W, Lubbock, TC 79409, USA
2
Department of Economics, Swedish University of Agricultural Sciences, SE-75007 Uppsala, Sweden
3
Graduate School of Humanities and Social Sciences, Saitama University, 255 Shimo-Okubo, Sakura-ku, Saitama 338-8570, Japan
4
Institute of Agribusiness and Development Studies, Bangladesh Agricultural University, Mymensingh 2202, Bangladesh
5
School of Agriculture, Food and Wine, University of Adelaide, Urrbrae, SA 5064, Australia
6
Department of Agricultural Economics, Bangladesh Agricultural University, Mymensingh 2202, Bangladesh
7
Commonwealth Scientific and Industrial Research Organisation—CSIRO, Waite Campus, Adelaide, SA 5064, Australia
*
Author to whom correspondence should be addressed.
Sustainability 2024, 16(19), 8434; https://doi.org/10.3390/su16198434
Submission received: 11 September 2024 / Revised: 26 September 2024 / Accepted: 26 September 2024 / Published: 27 September 2024
(This article belongs to the Special Issue Energy Transition Amidst Climate Change and Sustainability)

Abstract

:
While there is a vast body of literature on environmental sustainability, the disaggregated impact of major non-renewable energy (NRE) consumption on the environmental sustainability of the United States (U.S.) is understudied, particularly in terms of using a load capacity factor (LCF) perspective. In this study, the above research gap is addressed using a dynamic autoregressive distributed lag (DYNARDL) model to analyze the heterogeneous impact of NRE consumption on the environmental sustainability of the U.S. from 1961 to 2022. Given the U.S.’s heavy reliance on energy consumption from NRE sources, this analysis provides an in-depth examination of the long-term effects of this energy consumption on the environment. Based on the analysis of the DYNARDL model, it is found that an increase of one unit of coal, natural gas, and petroleum energy consumption reduces environmental sustainability by 0.007, 0.006, and 0.008 units in the short run and 0.006, 0.004, and 0.005 units in the long run, respectively. However, one unit of nuclear energy consumption would decrease environmental sustainability by 0.007 units in the long run. The kernel-based regularized system (KRLS) result shows that coal and petroleum energy consumption bears a negative significant causal link with environmental sustainability but no significant causal relationship with natural gas. The research suggests the expansion of the use of nuclear energy by gradually reducing the utilization of coal- and petroleum-based forms of energy, then natural gas, to improve environmental quality in the U.S., while considering the social and economic implications of efforts aimed at shifting away from the use of fossil fuels.

1. Introduction

Global demand for energy resources has significantly grown in the wake of industrialization since the middle of the 19th century [1]. Growing energy consumption has improved economic development and gender as well as social equity [2], but has a substantial environmental impact depending on the energy sources used. Thus, countries around the world pledged in 2015 to keep global warming within 1.5 °C of pre-industrial levels [3], recognizing the urgent need to reduce greenhouse gas (GHG) emissions to safeguard our planet for future generations by transitioning to renewable energy (RE) sources. RE sources, characterized by their clean and environmentally benign nature, offers a promising avenue for mitigating the adverse impacts on the environment [4]. However, the United States (U.S.), the second largest energy consumer and GHG emitter in the world [5,6], faces substantial challenges in achieving this transition. The U.S. government aims to cut GHG emissions by 50% (to 2005 levels) by 2030 and achieve net-zero emissions by 2050 [7]. Despite a gradual increase in renewable energy consumption, the country relies heavily on non-renewable energy (NRE) resources to meet its energy demand [8]. In 2023, NRE sources—coal, natural gas, petroleum, and nuclear energy (nuclear energy is a non-renewable resource because while the energy itself produced by nuclear processes is renewable, the materials used, i.e., uranium, in nuclear power plants are finite [9])—accounted for around 90% of total U.S. energy consumption, whereas renewable energy accounted for only 9% [10]. This excessive energy consumption of NREs significantly contributes to environmental degradation by releasing GHGs, such as CO2, which are primary contributors to global warming and climate change [11]. Therefore, there is an apparent need for clean and modern RE sources for environmental sustainability in the U.S. However, the transition from NRE consumption to RE consumption is undoubtedly a prolonged process as new infrastructures and innovative clean technologies need to be introduced to lessen the historical reliance on fossil fuels. Most non-renewable fossil fuels, such as coal, natural gas, and petroleum oil, are harmful to human health and the environment, but their contributions differ immensely from one another [12,13]. Many studies have evaluated the effects of renewable and non-renewable energy sources on environmental pollution, often using CO2 emissions as a key [14,15].
However, the comprehensive evaluation of a country’s long-term environmental sustainability also requires addressing air, water, and land pollution. Therefore, recent research has introduced the ecological footprint as a proxy for environmental degradation [16,17,18], but the ecological footprint solely accounts for pollution resulting from human consumption and absorption of its waste, and disregards the supply side, biocapacity [19]. Therefore, the load capacity factor (LCF), which represents the ratio of biocapacity to the ecological footprint, can be considered the best proxy for environmental sustainability [20,21]. The LCF indicates whether a country operates within its ecological means, with a ratio value of less than one implying unsustainability [22]. The LCF of the U.S. has remained consistently below 0.5 from 1970 to 2022, indicating poor performance in maintaining environmental sustainability and that the current resource supply is inadequate to support existing consumption as well as production levels [23]. As of 2024, the U.S. has a national biocapacity shortfall of 110%, meaning that its ecological footprint is over twice its national biocapacity [23]. The U.S. relies on high energy consumption for economic development and has a diverse energy mix. Carbon is the major component of the ecological footprint, so the U.S. needs to phase down carbon-intensive energy sources from the energy mix to reduce the biocapacity deficit. In the context of the U.S., no significant studies have determined the disaggregated effects of non-renewable energy source consumption on the LCF. Hossain et al. [21] measured the impact of fossil fuels, nuclear, and renewables on the LCF, but they did not disaggregate the fossil fuels and only used data from 1990 to 2018. Therefore, this study aimed to determine the disaggregated impacts of NRE consumption on environmental sustainability, proxied via the LCF, by using a dynamic autoregressive distributed lag (DYNARDL) approach and provide necessary insights for devising targeted regulations for gradually phasing out the most damaging NRE consumption.

2. Literature Review

Environmental sustainability has received significant attention in empirical research over recent years. This literature review section synthesizes the latest findings on the relationship between various sources of NRE consumption and environmental sustainability. For instance, coal remains a major energy source for economic development in many regions, despite being the largest contributor to CO2 emissions in the energy sector [24,25,26]. Alhassan et al. [27] analyzed coal consumption’s impact on environmental sustainability, using CO2 emissions as an indicator, and applied a generalized method of moments (GMM) model for major coal-consuming developed and developing nations. Their findings revealed that coal consumption is strongly linked to environmental degradation, with developed countries experiencing slightly higher impacts compared to developing ones. Similarly, Adebayo [28], utilizing the wavelet local multiple correlation technique, found that, in China, increased coal consumption significantly worsened environmental quality by raising CO2 emissions in both the short and long runs. On the other hand, the growing reliance on natural gas, particularly for electricity generation, is a result of improvements in gas extraction and global efforts to reduce GHG emissions from carbon-intensive sources, including coal [13]. Etokakpan et al. [16] analyzed the relationship between per capita natural gas consumption and CO2 emissions in China by using the autoregressive distributed lag (ARDL) model, showing a positive relationship between natural gas use and CO2 emissions. Adebayo et al. [29] also applied ARDL and frequency domain causality methods to examine the ecological impact of gas consumption, concluding that rising gas use negatively affects environmental sustainability. Similarly, Alam and Paramati [30], using a vector error correction model (VECM), demonstrated that petroleum oil consumption is a significant driver of CO2 emissions in 18 major oil-consuming developing countries. Saboori et al. [31] echoed this finding in South Korea, noting a direct correlation between oil consumption and CO2 emissions, while Zakari et al. [32] found that in African economies, domestic oil consumption only negatively impacts the environment in the short run.
In contrast, nuclear energy is often considered a potential solution to environmental degradation, and recent studies have investigated its environmental impact. Ullah and Lin [33], using the DYNARDL method, found that nuclear power consumption in Pakistan improved environmental quality by enhancing the LCF. Apergis and Litinas [34] observed a significant negative association between nuclear energy use and CO2 emissions in 19 selected developed and developing countries. Baek and Pride [35] also established that nuclear energy consumption significantly improves environmental quality by reducing CO2 emissions in the six leading nuclear-power-generating countries. Nam et al. [36] further confirmed that the increasing proportion of nuclear power usage in 18 key nuclear-power-generating countries leads to long-term reductions in CO2 emissions. While most studies indicate that nuclear energy has a positive impact on mitigating environmental degradation, a few report contrary findings. For instance, Saidi and Omri [37] observed that rising global investments in nuclear power are associated with increased CO2 emissions in South Korea and the Netherlands. Similarly, Bandyopadhyay et al. [38] found that nuclear energy consumption did not significantly contribute to preserving environmental health in Germany, China, and France across various quantiles.
In summary, most of the literature highlights the benefits of nuclear energy in reducing CO2 emissions, though some studies present conflicting evidence. Furthermore, very few studies have employed the LCF as a measure of environmental sustainability, with limited research examining the heterogeneous effects of NRE sources on the LCF [39,40]. To address this gap, the present study assesses the disaggregated impacts of various NRE sources on ecological sustainability in the U.S.

3. Materials and Methods

3.1. Data and Variables

In this study, the LCF is calculated by dividing biocapacity (global hectares) by the ecological footprint (global hectares), using data from the Global Footprint Network (GFN) website. The consumption data for coal (COAL), natural gas (NG), petroleum (PETRO), and nuclear energy (NUCLEAR) were sourced from the U.S. Energy Information Administration (EIA), with all values measured in quadrillion British thermal units (QBTUs). These variables cover annual data from 1961 to 2022. The average LCF is 0.468, with a range from 0.379 to 0.640 and a low standard deviation of 0.065, indicating minimal variation. Coal consumption averages 16.418, with a standard deviation of 4.245, showing greater variability and values ranging from 9.181 to 22.797. Natural gas consumption has a mean of 22.051, with a moderate standard deviation of 4.512 and values between 12.926 and 33.347 (Table 1).

3.2. Model Specification

The LCF is used as a proxy for U.S. environmental sustainability in this study. Therefore, following the representation function of Adedoyin et al. [41], the environmental sustainability function employed in this study can be expressed as follows:
L C F = f C O A L ,   N G ,   P E T R O ,   N U C
A counterfactual shock of 10 units (quadrillion British thermal units) is applied to the selected independent variables—coal, natural gas, petroleum, and nuclear energy—over 28 years, from 2022 to 2050, to analyze their long-term effects on environmental sustainability, as measured by the LCF.
Two conditions should be fulfilled before running the dynamic ARDL model on a time series dataset. First, the dependent variable should be non-stationary at the level I(0), but must become stationary at the first difference, I(1) [42]. Second, there must be a long-run relationship among the studied variables. To analyze whether the variables are stationary, three statistical tests were used: the augmented Dickey–Fuller (ADF) test by Dickey and Fuller [43], the Phillips–Perron (PP) test suggested by Phillips and Perron [44], and the ZA test introduced by Zivot and Andrews [45]. In comparison, the augmented Dickey and the PP tests were useful in establishing whether the time series contained unit roots; the ZA test was particularly useful in identifying the existence of any structural breaks in the series. These tests are important to reduce false regression effects due to non-stationary characteristics, thereby improving the stability and robustness of the model. After confirming that the dependent variable (LCF) is strictly stationary at the first difference, the optimal lag for the model is estimated using the Akaike information criteria (AIC). The cointegration among the variables is then tested using the Pesaran, Shin, and Smith (PSS) bounds test, incorporating novel Kripfganz and Schneider (KS) critical values and approximate p-values [46,47].
After confirming the stationarity and co-integration conditions, the estimation of the ARDL model is required to be carried out for both the long run and short run. The ARDL model aptly absorbs temporal variations and offers estimates for the long-run coefficient ( α ) and the short-run coefficient ( β ) to foresee the unique effects of the selected variables and the detailed relationships between the variables, enabling a thorough analysis of their impacts. The ARDL bounds test model, employed to assess the long-run relationships among the study variables, is outlined as follows:
L C F t = α 0 + α 1 L C F t 1 + α 2 C O A L t i + α 3 N G t i   + α 4 P E T R O t i + α 5 N U C t i + i = 1 p β 1 L C F t i + i = 1 p β 2 C O A L t i + i = 1 p β 3 N G t i + i = 1 p β 4 P E T R O t i + i = 1 p β 5 N U C t i + u t
Here, all the variables are presented in their base forms. The model incorporates the first-difference operator ( ) to capture changes in the variables over time. The lag length (ti) is determined according to the AIC. The random error term is expressed as u t , which is the residual variation in the model. This analysis indicates that the ARDL model can offer estimates for the long-run coefficient (α) and the short-run coefficient (β) for the variables in order to compare the impacts. The null hypothesis (H0) in the ARDL bounds indicates that there is no cointegration within the variables, while on the other side the alternative hypothesis (H1) suggests that there is cointegration between the variables. Subsequently, the analysis employs the bounds test of Pesaran, Shin, and Smith (PSS) to examine the long-run cointegrating relationship of the ARDL model. Upon realizing the long-run equilibrium relationships of the study variables, the bounds test is used before employing the dynamic ARDL simulation model to determine the short- and long-run coefficients. The error correction form of the ARDL bounds test is the equation used for conducting the dynamic ARDL [42,48], which can be represented as follows:
L C F t = λ 0 + θ 0 L C F t 1 + β 1 C O A L t + θ 1 C O A L t 1   + β 2 N G t + θ 2 N G t 1 + β 3 P E T R O t + θ 3 P E T R O t 1 + β 4 N U C t + θ 4 N U C t 1 + ε E C T t 1 + u t
Here, the error correction term ( E C T ) value informs us about the speed at which a system returns to its long-run equilibrium following short-run disturbances.
A few diagnostic tests were conducted to ensure that the dynamic ARDL model is robust and that the statistical inferences are reliable. Cameron and Trivedi’s decomposition of the IM and Breusch–Godfrey’s LM tests were conducted to check for heteroskedasticity and autocorrelation, respectively. Skewness and Kurtosis tests were used to check for normality, and a standardized normal probability plot as well as Q-Q plot (to compare residuals to a normal distribution) were used to further validate the residual distribution. Possible structural breaks through a cumulative sum test were also conducted, which helped confirm that the estimated coefficients remained stable over time. Finally, the directional relationships among the variables when using the KRLS, a machine-learning approach for causality, were checked and confirmed [49].
KRLS and DYNARDL simulations are expanding into energy, environmental, and health economics time series analyses. The KRLS is a straightforward machine learning algorithm that is especially effective at interpreting data while accounting for heterogeneity, additivity, and nonlinearity [48]. The DYNARDL simulation algorithm can test cointegration and analyze both short- and long-term equilibrium relationships. A notable feature of this DYNARDL approach is its visualization interface, which facilitates examining counterfactual changes in a target variable under ceteris paribus assumptions. DYNARDL simulations and the KRLS can enhance policy formulation through enhanced time series analyses. Hence, the present study considers both models simultaneously.

4. Results

The results establish that the LCF, COAL, NG, and NUC are non-stationary at the level, but are stationary at the first difference because the test statistics at I (1) for ADF, PP, and ZA are significant. While at the level, PETRO fluctuates in a way that conveys mixed signals, but it stabilizes in a highly distinctive manner at the first difference. Therefore, all variables fulfill the conditions necessary for applying the dynamic ARDL model, confirming their integration of order I (1). After that, the optimal lag length criteria for estimating the ARDL model were also identified (Table 2).
On the other hand, Table 3 depicts the outcomes of determining the appropriate lag length for the ARDL model, whereby lag 1 is favored most, as depicted by the lowest AIC values. The p-values of less than 0.05 for all of the LR tests also corroborate the use of lag 1, which became the most appropriate estimation.

4.1. Results of Linear ARDL Model

Table 4 shows that coal, natural gas, and petroleum energy consumption are significant predictors and cause negative impacts on environmental sustainability in both the short run and the long run. Nuclear energy consumption is only significant in the long run and improves environmental sustainability.

4.2. Cointegration Test Result

The F-statistic value for the explanatory variables is 9.159, and the absolute t-statistic value is 5.935. Since both values are above the upper bounds of the I(1) critical values at the 10%, 5%, and 1% levels of significance, the H0 of no cointegration was rejected. Furthermore, the significant p-value of the KS values (<0.01) also confirms the long-run cointegration between the variables (Table 5).

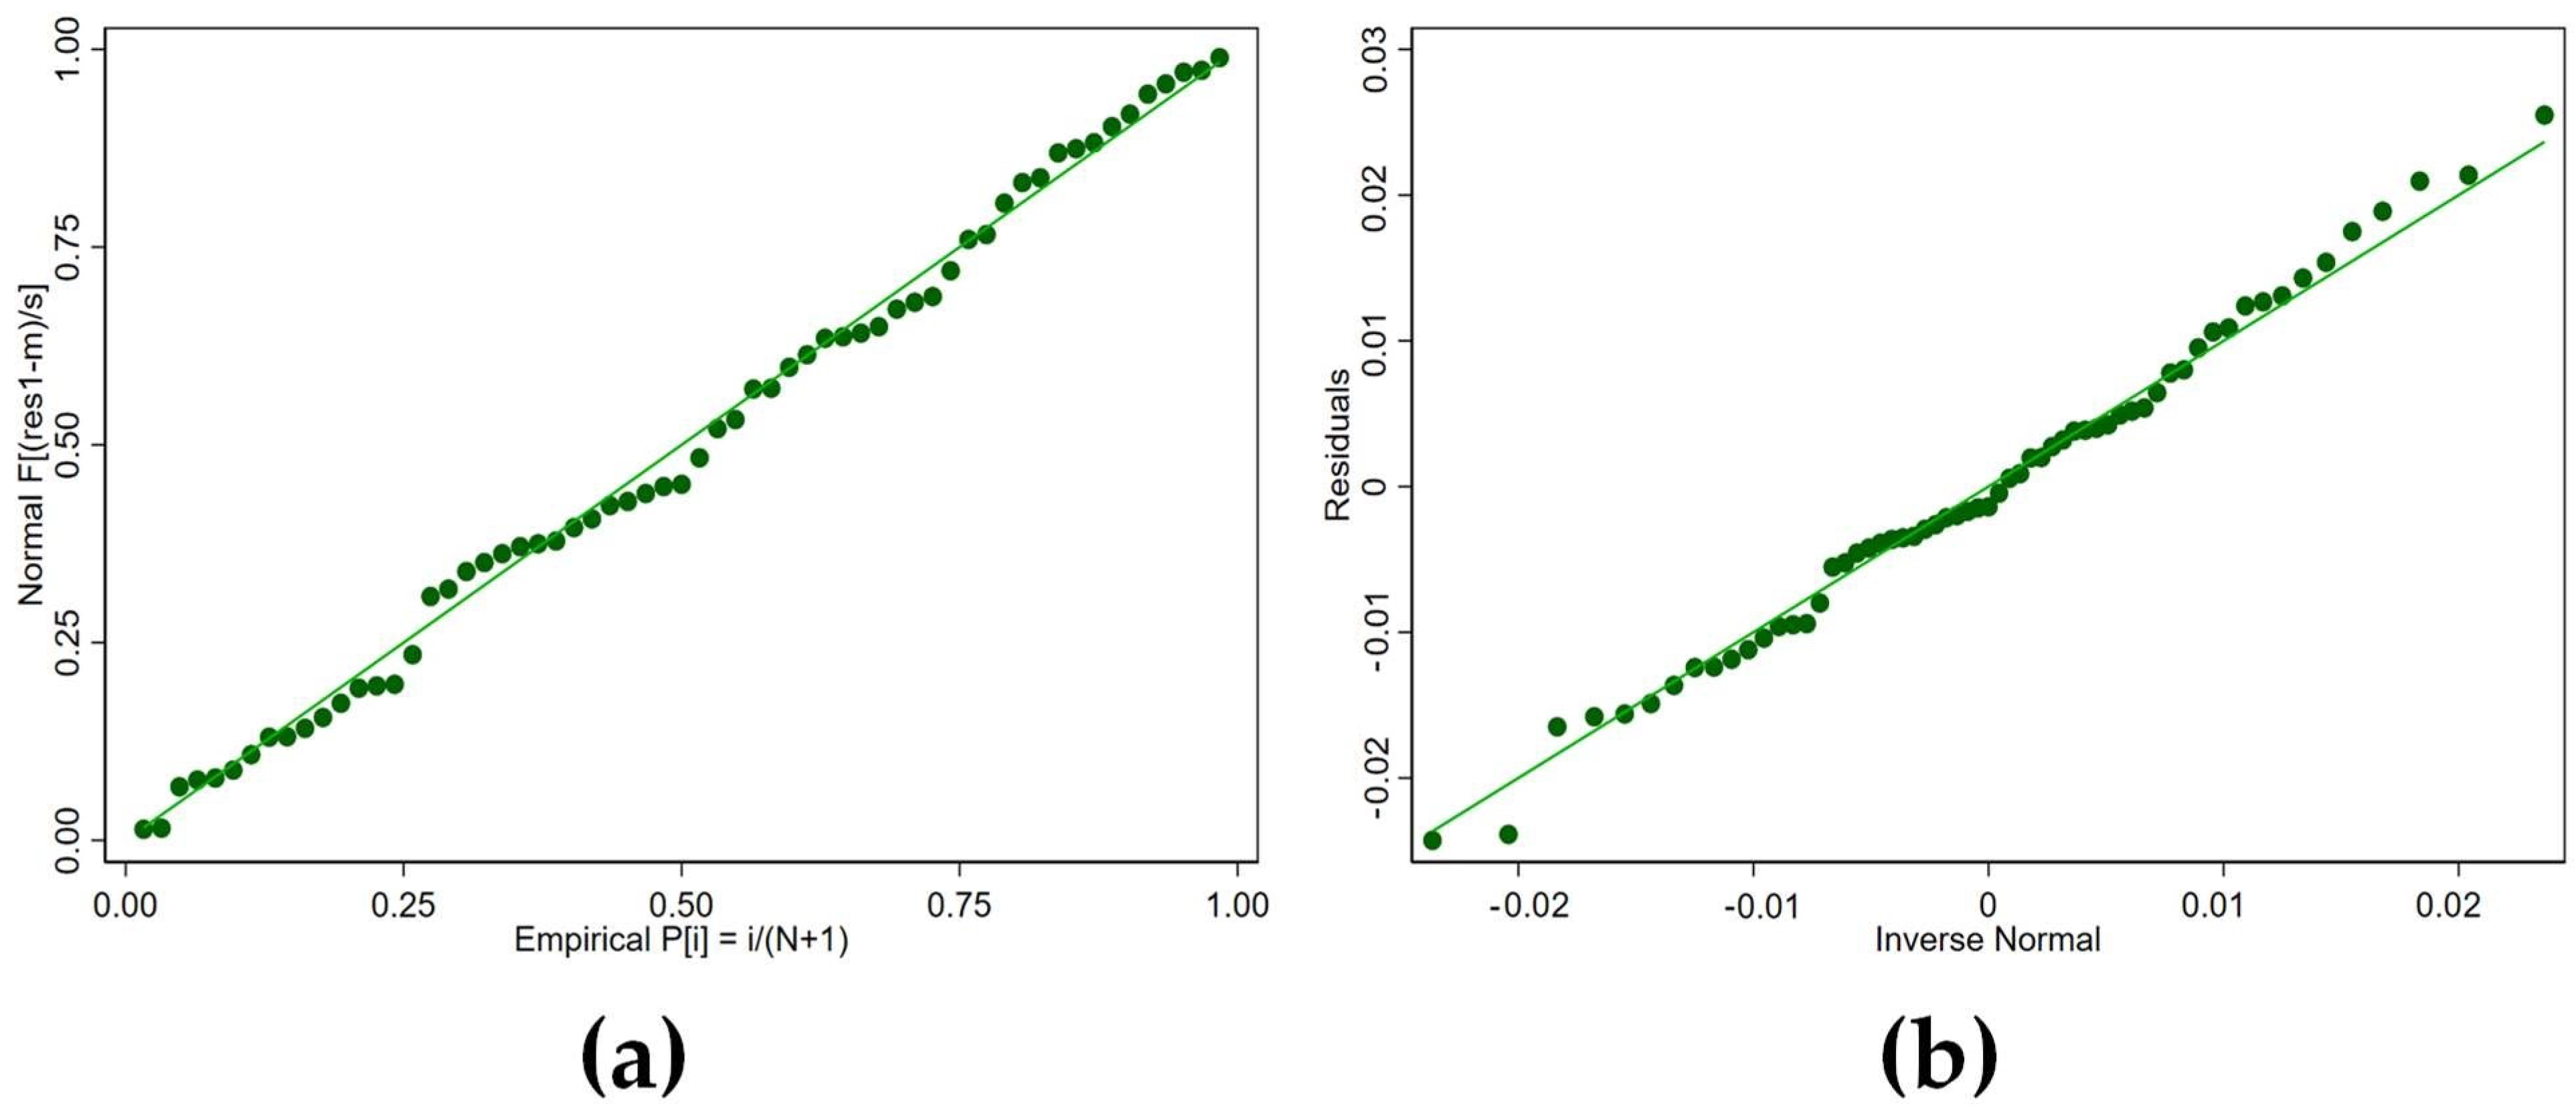
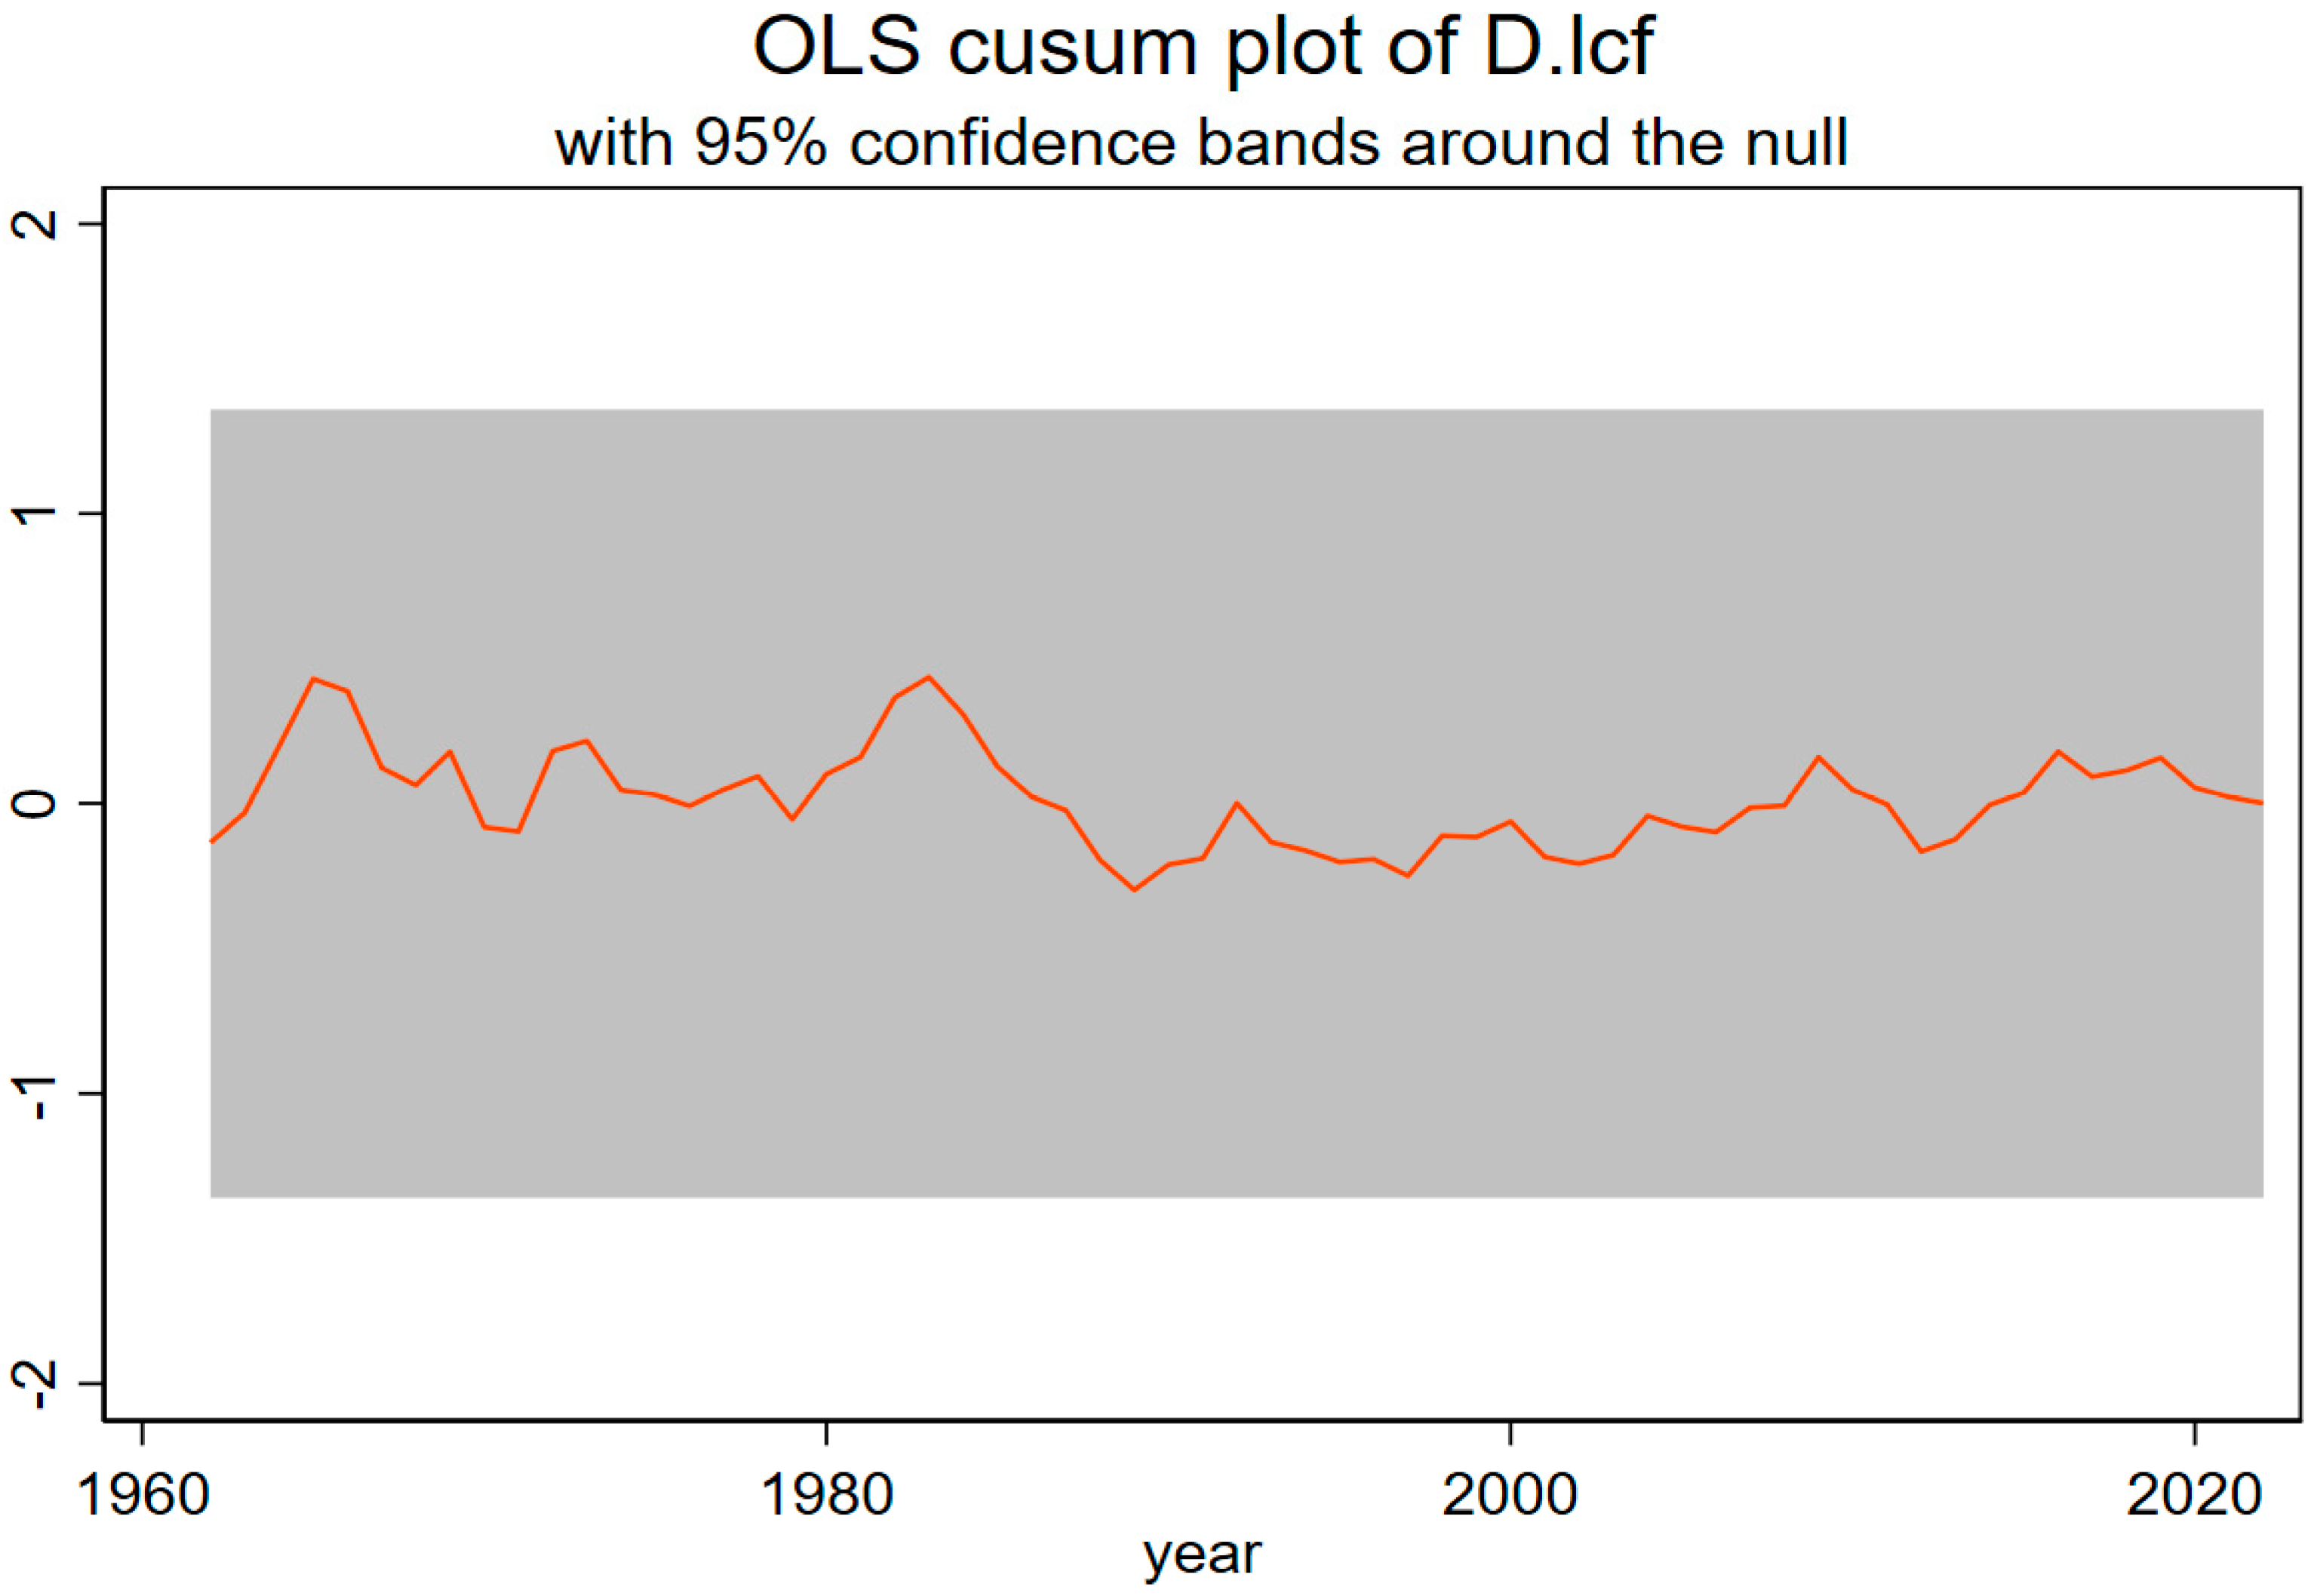
4.3. Residual Diagnostic Test Results

The Breusch-Godfrey LM test results indicate no significant autocorrelation in the model, as all p-values for the lags (1, 2, and 3) are above the common significance levels (with values of 0.3852, 0.2387, and 0.2085, respectively). The subsequent step of the analysis was focused on the residuals for heteroscedasticity using Cameron and Trivedi’s decomposition of the IM test, as shown in Table 6b. The p-values obtained are more than 0.05, and this indicates that heteroscedasticity does not affect the residuals of the model. In addition, skewness and kurtosis tests were conducted to check the normality of residuals of the model, as presented in Table 6c.
These results suggest that the residuals were normally distributed since the null hypothesis of normal distribution cannot be rejected at a 0.05 level of significance. Further confirmation of this conclusion is provided via visual analysis through standardized normal probability plots (Figure 1a) and quantile–quantile plots (Figure 1b), whereby the results indicate that the residuals follow a normal distribution. Finally, the stability of the estimated parameters was checked over time by using the cumulative sum (CUSUM) test, as shown in Figure 2. The value of the test statistic stays less than one, thus confirming the temporal stability of the model coefficients and indicating that the test is within the 95% confidence bounds.

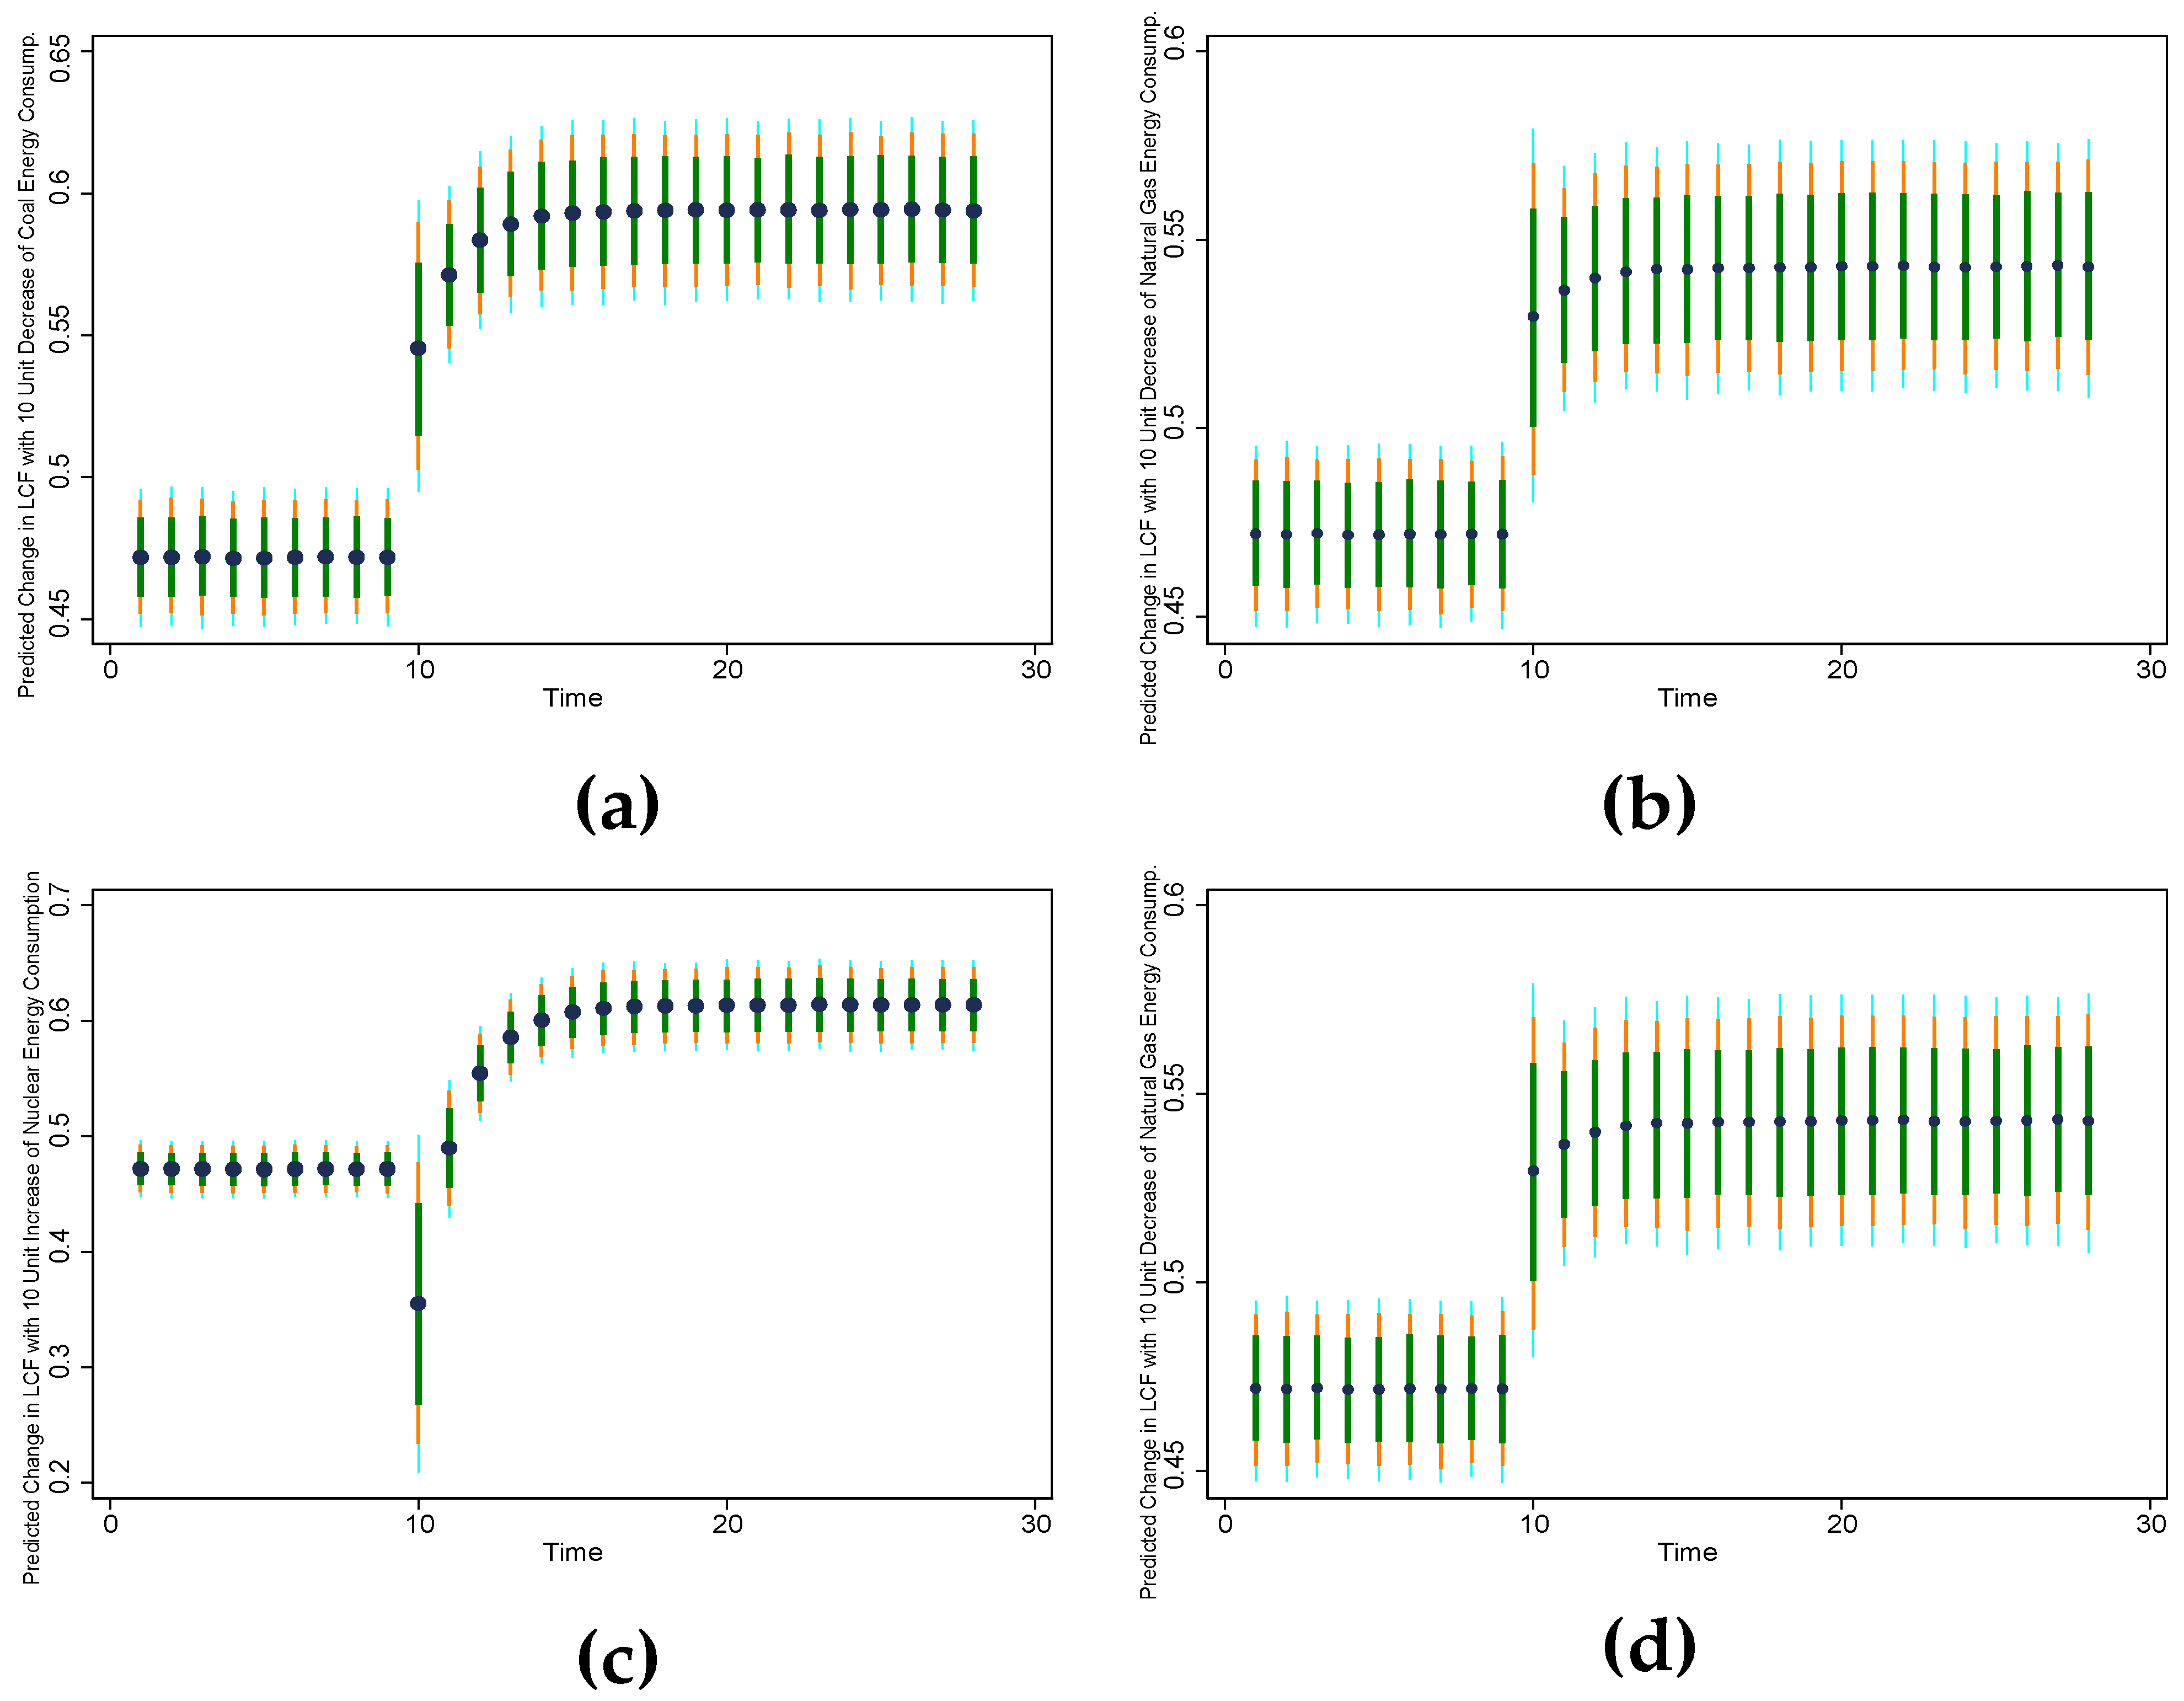
4.4. Dynamic Autoregressive Distributed Lag Results

The DYNARDL simulation results are provided in Table 7. The ECT, which is estimated to be −0.521 and significant at a 5% level, provides evidence supporting the finding of long-run integration between the consumption of coal, natural gas, petroleum, and nuclear energy and the LCF. This means that fluctuations in these parameters are uniquely associated with long-term changes in environmental sustainability. The results of the DYNARDL method reveal that the consumption of coal, natural gas, and petroleum has a significant negative relationship with environmental sustainability, both in the short and long run. While an increase of one unit in coal-based energy consumption decreases the LCF by 0.007 and 0.006 units, an increase of one unit in natural energy consumption leads to a 0.006 and 0.004 unit decrease in the LCF in the short and long run, respectively. Essentially, petroleum oil energy consumption also has negative effects on the LCF, with marginal effects of −0.008 and −0.005 units on the LCF in the short and long run, respectively. On the other hand, nuclear energy consumption positively impacts long-term environmental sustainability. An increase in nuclear energy use by 1 unit also increases the LCF by 0.007 units.
Although the short-run effect of nuclear energy is not significant, its long-run benefits are clear. These findings align with the study of Kanat et al. [50], which confirms that environmental quality degrades with increasing coal, natural gas, and oil consumption, while nuclear energy consumption positively correlates with environmental sustainability. Our findings align well with other studies from different countries’ perspectives. For instance, Aruga et al. [51] estimated an ARDL model and found that energy consumption derived from fossil fuels contributes significantly to CO2 emissions in Japan that exacerbate environmental degradation. Similarly, Bello et al. [52] considered the Association of Southeast Asian Nations (ASEAN) region and found that NRE consumption causes substantial environmental harm, thus requiring urgent policy interventions to reduce pollution and ensure sustainability. Furthermore, Apergis et al. [53] applied an augmented ARDL model to the U.S. and found that even though aggregated NRE sources deteriorate environmental quality, investments in cleaner energy and sustainable alternatives are much needed to compensate for these effects of deterioration and make the environmental quality more sustainable. Kadioglu and Gurbuz [54] showed the role that nuclear energy could play in a green economy, establishing that it has a comparative advantage in long-term sustainability over fossil fuels.
The graphical representations further illustrate these impacts. Figure 3a–d show the effect of reducing coal, natural gas, petroleum, and nuclear energy consumption by 10 units from 2022 to 2050. The dark blue circular dots, representing the predicted LCF under these scenarios, show a steady increase, indicating a positive impact on sustainability. This means that reducing coal, natural gas, petroleum, and nuclear energy consumption significantly enhances the LCF. These findings collectively underscore the importance of transitioning from fossil fuels to nuclear energy to achieve better environmental outcomes, making a strong case for policy changes aimed at reducing fossil fuel dependency and increasing nuclear energy use for a sustainable future. The confidence intervals around these predictions lend credibility to the results, offering policymakers and stakeholders a solid foundation upon which to base their decisions.

4.5. Kernel-Based Regularized Least Squares-Based Causality Test Result

The results show that the higher consumption of both coal and petroleum causally leads to large reductions in environmental sustainability, with average effects of −0.004 and −0.008, respectively. These negative effects are of high significance, thus indicating very strong evidence that higher consumption of these fuels negatively affects the environment. Natural gas exudes a very negligible effect, statistically insignificant, which may mean that it shares a very minimal or not clearly determined relationship with environmental sustainability (Table 8).
Nuclear power reveals a positive causal impact, adding 0.004 units to the LCF, indicating that nuclear energy possibly improves environmental sustainability. This effect is statistically significant as well. The overall model is very robust, accounting for 97.7% of the variation in the LCF and supporting the reliability of these causal inferences.

5. Discussion

In our study, the results of the ARDL and dynamic ARDL models reveal that coal, natural gas, and petroleum consumption significantly negatively impact environmental sustainability in the U.S., both in the short run and the long run. Acheampong [55] identified a similar trend between fossil fuel consumption and environmental degradation in a study of 116 countries.
On the other hand, our findings indicate that nuclear energy consumption has a positive effect on environmental sustainability, as it does not produce CO2 during electricity generation. This aligns with Lin and Ullah [56], who demonstrated that nuclear energy helps reduce CO2 emissions. Similarly, Khan et al. [57] found long-term environmental advantages of nuclear energy compared to fossil fuels, recognizing its potential to significantly enhance environmental sustainability over time. Nevertheless, nuclear energy is not without its challenges. One of the primary concerns is waste management, especially with newer technologies like small modular reactors (SMRs), which generate waste that requires long-term disposal solutions, potentially limiting their environmental benefits [58,59]. The economic viability of SMRs is also in question, given their high construction costs and uncertain financial returns [60]. Additionally, political and institutional barriers across states complicate nuclear energy’s role in pollution reduction, as each state has its own regulatory framework and varying degrees of public acceptance [61,62]. In response, the U.S. government has tried to address these challenges by investing in advanced reactor designs and streamlining regulatory processes to reduce costs and accelerate construction [63]. Furthermore, the Department of Energy (DOE) is working on improving the safety of nuclear technologies, developing better waste management strategies, and ensuring the economic viability of nuclear energy through initiatives such as the Civil Nuclear Credit [63].
Despite these efforts, the transition to cleaner energy in the U.S. faces significant hurdles. While regions that have embraced clean energy—such as those investing in wind and solar—are largely supportive, states heavily reliant on fossil fuels, like West Virginia, are concerned about job losses and the broader economic impact of this shift [64]. There is also a notable political divide, with Democrats generally favoring the transition to clean energy while many Republicans express skepticism about the economic and energy reliability implications [65]. Additionally, local opposition to clean energy projects, such as wind farms, often arises due to concerns about environmental impacts and property values [66]. Carley and Konisky [67] have pointed out that “a just” transition strategy that includes support for affected workers and communities is crucial for ensuring widespread acceptance of the energy transition.
However, nuclear energy remains a critical and scalable low-carbon energy alternative that could play a pivotal role in reducing global reliance on fossil fuels. It offers a reliable solution to the ongoing issues of air pollution and climate change, and it is key to helping the U.S. meet its goals under Sustainable Development Goal (SDG) 7 (Affordable and Clean Energy) and SDG 13 (Climate Action) [57]. Hao et al. [68] also argue that achieving a balanced mix of nuclear and renewable energy sources is the most effective strategy for enhancing environmental quality and achieving decarbonization as well as emission reduction targets.
The graphical representations in our study highlight the significant policy implications of reducing fossil fuel consumption and increasing nuclear energy use to promote environmental sustainability. Scenario-based energy modeling, as emphasized by scholars like Gillingham and Stock [69], is an essential tool for policymakers to assess the long-term impact of various energy policies. In the U.S., these models underscore the urgent need for immediate policy interventions such as carbon pricing, renewable energy subsidies, and greater investments in nuclear infrastructure. These tools are widely recognized as effective in accelerating the transition to clean energy and achieving the U.S.’s decarbonization goals under SDG 7 and SDG 13 [70].
Furthermore, our findings are reinforced by the KRLS causality test, which shows that fossil fuel consumption—particularly of coal and petroleum—has a negative effect on environmental sustainability. Thombs [71] examined the link between fossil fuel dependency and the carbon intensity of well-being at the U.S. state level, revealing that reliance on fossil fuels negatively impacts both social and environmental well-being. In contrast, nuclear energy demonstrates a growing potential to mitigate the environmental degradation caused by fossil fuel use. However, as nuclear energy continues to expand, it is essential that robust regulatory frameworks are put in place to ensure the safety, transparency, and public trust necessary for its broader adoption [72].

6. Conclusions and Policy Recommendations

As one of the world’s largest energy consumers and contributors to greenhouse gas (GHG) emissions, the U.S. faces significant challenges in transitioning from non-renewable energy sources to cleaner, renewable alternatives. Given the ongoing reliance on non-renewable energy (NRE) and its harmful environmental impacts, this study aims to assess the disaggregated effects of NRE consumption on environmental sustainability, using the LCF as a proxy. The findings will help inform targeted policies for phasing out the most damaging energy sources and improving the U.S.’s ecological footprint. Employing a dynamic autoregressive distributed lag (DYNARDL) model, this research explores the heterogeneous effects of coal, natural gas, petroleum, and nuclear energy consumption from 1961 to 2022. The results show that all NRE sources, including coal, natural gas, and petroleum, significantly reduce environmental sustainability in both the short and long run. Additionally, the consumption of nuclear energy negatively impacts environmental sustainability in the long run. The KRLS analysis further confirms the significant adverse effects of coal and petroleum on environmental sustainability, while natural gas shows no significant causal relationship.
Given these findings, this study recommends that U.S. energy policies focus on phasing out coal due to its severe negative environmental impact. This could be achieved by implementing stricter emission regulations, incentivizing the closure of coal-fired power plants, and promoting renewable energy alternatives like solar and wind. Although natural gas is cleaner than coal, it still negatively affects sustainability. Therefore, a gradual reduction in its use is necessary, which can be supported by promoting energy efficiency, increasing renewable energy use, and modernizing the grid to handle renewable sources better. The significant negative effects of petroleum on environmental sustainability also call for policies aimed at reducing its consumption. This could include promoting electric vehicles, improving public transportation infrastructure, and supporting biofuel development.
In contrast, the positive long-run impact of nuclear energy on environmental sustainability suggests that increasing nuclear capacity should be a major policy focus. At the same time, efforts should be intensified to expand the use of RE sources like wind, solar, and hydroelectric power. This study’s key limitations are the lack of analysis of the environmental impacts of nuclear waste management and the omission of economic and social costs, such as job losses and retraining, associated with the transition from fossil fuels. These factors are critical for evaluating the long-term sustainability and feasibility of energy policy changes. A comprehensive disaggregated RE consumption source’s impact on environmental sustainability in the U.S. can be determined by using the same method. In this case, the less focused RE consumption sources, such as geothermal and hydroelectric energy, can be taken into consideration.

Author Contributions

Conceptualization, T.K.G., M.R.I. and M.M.I.; methodology, T.K.G., M.R.I. and M.M.I.; software, T.K.G., M.R.I. and M.M.I.; validation, K.A., M.M.I. and A.J.; formal analysis, T.K.G., M.R.I. and M.M.I.; investigation, T.K.G., M.R.I. and M.M.I.; resources, T.K.G., M.R.I. and M.M.I.; data curation, T.K.G. and M.R.I.; writing—original draft preparation, T.K.G., M.R.I., K.A., A.J. and M.M.I.; writing—review and editing, T.K.G., M.R.I., K.A., A.J. and M.M.I.; visualization, T.K.G., M.R.I. and M.M.I.; supervision, M.M.I. All authors have read and agreed to the published version of the manuscript.

Funding

This research received no external funding.

Institutional Review Board Statement

Not applicable.

Informed Consent Statement

Not applicable.

Data Availability Statement

Available upon request.

Conflicts of Interest

The authors declare no conflicts of interest.

References

  1. Asif, M.; Muneer, T. Energy Supply, Its Demand and Security Issues for Developed and Emerging Economies. Renew. Sustain. Energy Rev. 2007, 11, 1388–1413. [Google Scholar] [CrossRef]
  2. He, J.; Zhuang, T.; Xie, X. Energy Consumption, Economic Development and Environmental Improvement in China. Energy Environ. 2014, 25, 1345–1357. [Google Scholar] [CrossRef]
  3. United Nations Framework Convention on Climate Change (UNFCC). The Paris Agreement. Available online: https://unfccc.int/process-and-meetings/the-paris-agreement (accessed on 8 August 2024).
  4. Panwar, N.L.; Kaushik, S.C.; Kothari, S. Role of Renewable Energy Sources in Environmental Protection: A Review. Renew. Sustain. Energy Rev. 2011, 15, 1513–1524. [Google Scholar] [CrossRef]
  5. Statista. Energy Consumption in the U.S. Available online: https://www.statista.com/topics/833/energy-consumption/#topicOverview (accessed on 17 August 2024).
  6. Statista. GHG Emissions in the U.S. Available online: https://www.statista.com/topics/3185/us-greenhouse-gas-emissions/#topicOverview (accessed on 17 August 2024).
  7. The White House. The Long-Term Strategy of the United States: Pathways to Net-Zero Greenhouse Gas Emissions by 2050. Available online: https://www.whitehouse.gov/wp-content/uploads/2021/10/us-long-term-strategy.pdf (accessed on 11 August 2024).
  8. U.S. Energy Information Administration. Primary Energy Consumption by Energy Source. Available online: https://www.eia.gov/energyexplained/us-energy-facts/ (accessed on 9 August 2024).
  9. U.S. Energy Information Administration. What Is Energy? Sources of Energy. Available online: https://www.eia.gov/energyexplained/what-is-energy/sources-of-energy.php (accessed on 9 August 2024).
  10. U.S. Energy Information Administration. U.S. Energy Facts Explained. 2023. Available online: https://www.eia.gov/energyexplained/us-energy-facts/ (accessed on 9 August 2024).
  11. Chien, F. How Renewable Energy and Non-renewable Energy Affect Environmental Excellence in N-11 Economies? Renew. Energy 2022, 196, 526–534. [Google Scholar] [CrossRef]
  12. Miller, B.G.M.S. Clean Coal Engineering Technology; Butterworth-Heinemann: Burlington, MA, USA, 2011. [Google Scholar] [CrossRef]
  13. MacKinnon, M.A.; Brouwer, J.; Samuelsen, S. The Role of Natural Gas and Its Infrastructure in Mitigating Greenhouse Gas Emissions, Improving Regional Air Quality, and Renewable Resource Integration. Prog. Energy Combust. Sci. 2018, 64, 62–92. [Google Scholar] [CrossRef]
  14. Alola, A.A.; Adebayo, T.S. Are Green Resource Productivity and Environmental Technologies the Face of Environmental Sustainability in the Nordic Region? Sustain. Dev. 2022, 31, 760–772. [Google Scholar] [CrossRef]
  15. Bekun, F.V.; Alola, A.A.; Sarkodie, S.A. Toward a Sustainable Environment: Nexus Between CO2 Emissions, Resource Rent, Renewable and Nonrenewable Energy in 16-EU Countries. Sci. Total Environ. 2019, 657, 1023–1029. [Google Scholar] [CrossRef]
  16. Etokakpan, M.U.; Akadiri, S.S.; Alola, A.A. Natural Gas Consumption-Economic Output and Environmental Sustainability Target in China: An N-Shaped Hypothesis Inference. Environ. Sci. Pollut. Res. 2021, 28, 37741–37753. [Google Scholar] [CrossRef]
  17. Wang, Q.; Sun, Z.; Guo, J.; Li, R. The More Effective Option to Combat Environmental Degradation: Energy Efficiency vs. Renewable Energy vs. Natural Gas? Energy 2023, 283, 128512. [Google Scholar] [CrossRef]
  18. Onifade, S.T. Environmental Impacts of Energy Indicators on Ecological Footprints of Oil-Exporting African Countries: Perspectives on Fossil Resources Abundance Amidst Sustainable Development Quests. Resour. Policy 2023, 82, 103481. [Google Scholar] [CrossRef]
  19. Çamkaya, S.; Karaaslan, A. Do Renewable Energy and Human Capital Facilitate the Improvement of Environmental Quality in the United States? A New Perspective on Environmental Issues with the Load Capacity Factor. Environ. Sci. Pollut. Res. 2024, 31, 17140–17155. [Google Scholar] [CrossRef] [PubMed]
  20. Siche, R.; Pereira, L.; Agostinho, F.; Ortega, E. Convergence of Ecological Footprint and Emergy Analysis as a Sustainability Indicator of Countries: Peru as Case Study. Commun. Nonlinear Sci. Numer. Simul. 2010, 15, 3182–3192. [Google Scholar] [CrossRef]
  21. Hossain, M.R.; Rana, M.J.; Saha, S.M.; Haseeb, M.; Islam, M.S.; Amin, M.R.; Hossain, M.E. Role of Energy Mix and Eco-Innovation in Achieving Environmental Sustainability in the USA Using the Dynamic ARDL Approach: Accounting the Supply Side of the Ecosystem. Renew. Energy 2023, 215, 118925. [Google Scholar] [CrossRef]
  22. Pata, U.K. Do Renewable Energy and Health Expenditures Improve Load Capacity Factor in the USA and Japan? A New Approach to Environmental Issues. Eur. J. Health Econ. 2021, 22, 1427–1439. [Google Scholar] [CrossRef]
  23. Global Footprint Network. Available online: https://data.footprintnetwork.org/#/countryTrends?type=BCtot,EFCtot&cn=231 (accessed on 9 August 2024).
  24. Chen, H.; Liu, K.; Shi, T.; Wang, L. Coal Consumption and Economic Growth: A Chinese City-Level Study. Energy Econ. 2022, 109, 105940. [Google Scholar] [CrossRef]
  25. Jin, T.; Kim, J. Coal Consumption and Economic Growth: Panel Cointegration and Causality Evidence from OECD and Non-OECD Countries. Sustainability 2018, 10, 660. [Google Scholar] [CrossRef]
  26. World Nuclear Association. Carbon Dioxide Emissions From Electricity. Available online: https://world-nuclear.org/information-library/energy-and-the-environment/carbon-dioxide-emissions-from-electricity#:~:text=Worldwide%20emissions%20of%20carbon%20dioxide,and%20about%2020%25%20from%20gas (accessed on 12 August 2024).
  27. Alhassan, A.; Ozturk, I.; Al-Zyoud, M.F.; Bekun, F.V. Coal Consumption-Environmental Sustainability Nexus in Developed and Developing Major Coal-Consuming Economies. Heliyon 2024, 10, e25619. [Google Scholar] [CrossRef]
  28. Adebayo, T.S. Trade-off between Environmental Sustainability and Economic Growth Through Coal Consumption and Natural Resources Exploitation in China: New Policy Insights From Wavelet Local Multiple Correlation. Geol. J. 2022, 58, 1384–1400. [Google Scholar] [CrossRef]
  29. Adebayo, T.S.; Ozturk, I.; Ağa, M.; Uhunamure, S.E.; Kirikkaleli, D.; Shale, K. Role of natural gas and nuclear energy consumption in fostering environmental sustainability in India. Sci. Rep. 2023, 13, 11030. [Google Scholar] [CrossRef]
  30. Alam, M.S.; Paramati, S.R. Do Oil Consumption and Economic Growth Intensify Environmental Degradation? Evidence from Developing Economies. Appl. Econ. 2015, 47, 5186–5203. [Google Scholar] [CrossRef]
  31. Saboori, B.; Rasoulinezhad, E.; Sung, J. The Nexus of Oil Consumption, CO2 Emissions and Economic Growth in China, Japan and South Korea. Environ. Sci. Pollut. Res. 2017, 24, 7436–7455. [Google Scholar] [CrossRef] [PubMed]
  32. Zakari, A.; Khan, I.; Tawiah, V.; Alvarado, R.; Li, G. The Production and Consumption of Oil in Africa: The Environmental Implications. Resour. Policy 2022, 78, 102795. [Google Scholar] [CrossRef]
  33. Ullah, S.; Lin, B. Green Energy Dynamics: Analyzing the Environmental Impacts of Renewable, Hydro, and Nuclear Energy Consumption in Pakistan. Renew. Energy 2024, 232, 121025. [Google Scholar] [CrossRef]
  34. Apergis, N.; Payne, J.E.; Menyah, K.; Wolde-Rufael, Y. On the Causal Dynamics between Emissions, Nuclear Energy, Renewable Energy, and Economic Growth. Ecol. Econ. 2010, 69, 2255–2260. [Google Scholar] [CrossRef]
  35. Baek, J.; Pride, D. On the income–nuclear energy–CO2 emissions nexus revisited. Energy Econ. 2014, 43, 6–10. [Google Scholar] [CrossRef]
  36. Nam, L.P.; Hang, N.T.B.; Song, N.V.; Eluriagac, L.M.T. Examining the Non-linear Impact of Fossil and Renewable Energy Consumption on Vietnam’s Ecological Footprint: Insights from the Asymmetric ARDL Approach. Discov. Energy 2024, 4, 10. [Google Scholar] [CrossRef]
  37. Saidi, K.; Omri, A. Reducing CO2 Emissions in OECD Countries: Do Renewable and Nuclear Energy Matter? Prog. Nucl. Energy 2020, 126, 103425. [Google Scholar] [CrossRef]
  38. Bandyopadhyay, A.; Rej, S.; Villanthenkodath, M.A.; Mahalik, M.K. The Role of Nuclear Energy Consumption in Abatement of Ecological Footprint: Novel Insights from Quantile-on-Quantile Regression. J. Clean. Prod. 2022, 358, 132052. [Google Scholar] [CrossRef]
  39. Pata, U.K.; Caglar, A.E. Investigating the EKC Hypothesis With Renewable Energy Consumption, Human Capital, Globalization and Trade Openness for China: Evidence from Augmented ARDL Approach with a Structural Break. Energy 2021, 216, 119220. [Google Scholar] [CrossRef]
  40. Dam, M.M.; Sarkodie, S.A. Renewable Energy Consumption, Real Income, Trade Openness, and Inverted Load Capacity Factor Nexus in Turkiye: Revisiting the EKC Hypothesis with Environmental Sustainability. Sustain. Horiz. 2023, 8, 100063. [Google Scholar] [CrossRef]
  41. Adedoyin, F.F.; Ozturk, I.; Bekun, F.V.; Agboola, P.O.; Agboola, M.O. Renewable and non-renewable energy policy simulations for abating emissions in a complex economy: Evidence from the novel dynamic ARDL. Renew. Energy 2021, 177, 1408–1420. [Google Scholar] [CrossRef]
  42. Jordan, S.; Philips, A.Q. Cointegration Testing and Dynamic Simulations of Autoregressive Distributed Lag Models. Stata J. 2018, 18, 902–923. [Google Scholar] [CrossRef]
  43. Dickey, D.A.; Fuller, W.A. Distribution of the Estimators for Autoregressive Time Series with a Unit Root. J. Am. Stat. Assoc. 1979, 74, 427–431. [Google Scholar] [CrossRef]
  44. Phillips, P.C.B.; Perron, P. Testing for a Unit Root in Time Series Regression. Biometrika 1988, 75, 335–346. [Google Scholar] [CrossRef]
  45. Zivot, E.; Andrews, D.W.K. Further Evidence on the Great Crash, the Oil-Price Shock, and the Unit-Root Hypothesis. J. Bus. Econ. Stat. 2002, 20, 25–44. [Google Scholar] [CrossRef]
  46. Kripfganz, S.; Schneider, D.C. Response Surface Regressions for Critical Value Bounds and Approximate p-Values in Equilibrium Correction Models. Oxf. Bull. Econ. Stat. 2020, 82, 1456–1481. [Google Scholar] [CrossRef]
  47. Pesaran, M.H.; Shin, Y.; Smith, R.J. Bounds Testing Approaches to the Analysis of Level Relationships. J. Appl. Econom. 2001, 16, 289–326. [Google Scholar] [CrossRef]
  48. Sarkodie, S.A.; Owusu, P.A. How to Apply the Novel Dynamic ARDL Simulations (DynARDL) and Kernel-Based Regularized Least Squares (KRLS). MethodsX 2020, 7, 101160. [Google Scholar] [CrossRef]
  49. Hainmueller, J.; Hazlett, C. Kernel Regularized Least Squares: Reducing Misspecification Bias with a Flexible and Interpretable Machine Learning Approach. Polit. Anal. 2014, 22, 143–168. [Google Scholar] [CrossRef]
  50. Kanat, O.; Yan, Z.; Asghar, M.M.; Ahmed, Z.; Mahmood, H.; Kirikkaleli, D.; Murshed, M. Do Natural Gas, Oil, and Coal Consumption Ameliorate Environmental Quality? Empirical Evidence from Russia. Environ. Sci. Pollut. Res. 2021, 29, 4540–4556. [Google Scholar] [CrossRef]
  51. Aruga, K.; Islam, M.M.; Jannat, A. Assessing the CO2 Emissions and Energy Source Consumption Nexus in Japan. Sustainability 2024, 16, 5742. [Google Scholar] [CrossRef]
  52. Bello, M.O.; Jimoh, S.O.; Ch’ng, K.S.; Oyerinola, D.S. Environmental Sustainability in ASEAN: What Roles Do Energy Consumption, Economic Growth, and Foreign Direct Investment Play? Environ. Dev. Sustain. 2024. [Google Scholar] [CrossRef]
  53. Apergis, N.; Degirmenci, T.; Aydin, M. Renewable and Non-renewable Energy Consumption, Energy Technology Investment, Green Technological Innovation, and Environmental Sustainability in the United States: Testing the EKC and LCC Hypotheses with Novel Fourier Estimation. Environ. Sci. Pollut. Res. 2023, 30, 125570–125584. [Google Scholar] [CrossRef]
  54. Kadioglu, I.; Gurbuz, I.B. Formulating Eco-Friendly Strategies: Transition to Green Economy. Sustainability 2024, 16, 4492. [Google Scholar] [CrossRef]
  55. Acheampong, A.O. Economic growth, CO2 emissions and energy consumption: What causes what and where? Energy Econ. 2018, 74, 677–692. [Google Scholar] [CrossRef]
  56. Lin, B.; Ullah, S. Modeling the Impacts of Changes in Nuclear Energy, Natural Gas, and Coal in the Environment through the Novel DARDL Approach. Energy 2024, 287, 129572. [Google Scholar] [CrossRef]
  57. Khan, I.; Tan, D.; Hassan, S.T.; Bilal, N. Role of Alternative and Nuclear Energy in Stimulating Environmental Sustainability: Impact of Government Expenditures. Environ. Sci. Pollut. Res. 2022, 29, 37894–37905. [Google Scholar] [CrossRef]
  58. Sovacool, B.K. Valuing the Greenhouse Gas Emissions from Nuclear Power: A Critical Survey. Energy Policy 2008, 36, 2950–2963. [Google Scholar] [CrossRef]
  59. Krall, L.M.; Macfarlane, A.M.; Ewing, R.C. Nuclear Waste from Small Modular Reactors. Proc. Natl. Acad. Sci. USA 2022, 119, 1. [Google Scholar] [CrossRef]
  60. Böse, F.; Wimmers, A.; Steigerwald, B.; Von Hirschhausen, C. Questioning Nuclear Scale-Up Propositions: Availability and Economic Prospects of Light Water, Small Modular and Advanced Reactor Technologies. Energy Res. Soc. Sci. 2024, 110, 103448. [Google Scholar] [CrossRef]
  61. Sarkodie, S.A.; Adams, S. Renewable energy, nuclear energy, and environmental pollution: Accounting for political institutional quality in South Africa. Sci. Total Environ. 2018, 643, 1590–1601. [Google Scholar] [CrossRef] [PubMed]
  62. Mahmood, H.; Alkhateeb, T.T.Y.; Furqan, M. Oil and Water Consumption Nexus in Saudi Arabia: New Evidence From a Wavelet Coherence Approach. Water 2020, 12, 2349. [Google Scholar] [CrossRef]
  63. The White House. Fact Sheet: Biden-Harris Administration Announces New Steps to Bolster Domestic Nuclear Industry and Advance America’s Clean Energy Future. Available online: https://www.whitehouse.gov/briefing-room/statements-releases/2024/05/29/fact-sheet-biden-harris-administration-announces-new-steps-to-bolster-domestic-nuclear-industry-and-advance-americas-clean-energy-future/ (accessed on 24 August 2024).
  64. Harvard Magazine. Preparing for the Energy Transition. Available online: https://www.harvardmagazine.com/2023/10/right-now-energy-job-transition (accessed on 26 August 2024).
  65. Pew Research Center. What Americans Think About an Energy Transition From Fossil Fuels to Renewables. Available online: https://www.pewresearch.org/science/2023/06/28/what-americans-think-about-an-energy-transition-from-fossil-fuels-to-renewables/ (accessed on 26 August 2024).
  66. Lennon, B.; Dunphy, N.P.; Sanvicente, E. Community Acceptability and the Energy Transition: A Citizens’ Perspective. Energy Sustain. Soc. 2019, 9, 35. [Google Scholar] [CrossRef]
  67. Carley, S.; Konisky, D.M. The Justice and Equity Implications of the Clean Energy Transition. Nat. Energy 2020, 5, 569–577. [Google Scholar] [CrossRef]
  68. Hao, Y.; Chen, P.; Li, X. Testing the Environmental Kuznets Curve Hypothesis: The Dynamic Impact of Nuclear Energy on Environmental Sustainability in the Context of Economic Globalization. Energy Strategy Rev. 2022, 44, 100970. [Google Scholar] [CrossRef]
  69. Gillingham, K.; Stock, J.H. The Cost of Reducing Greenhouse Gas Emissions. J. Econ. Perspect. 2018, 32, 53–72. [Google Scholar] [CrossRef]
  70. Burke, A.; Fishel, S. A Coal Elimination Treaty 2030: Fast Tracking Climate Change Mitigation, Global Health and Security. Earth Syst. Gov. 2020, 3, 100046. [Google Scholar] [CrossRef]
  71. Thombs, R.P. The Asymmetric Effects of Fossil Fuel Dependency on the Carbon Intensity of Well-Being: A U.S. State-Level Analysis, 1999–2017. Glob. Environ. Change 2022, 77, 102605. [Google Scholar] [CrossRef]
  72. Heffron, R.J.; McCauley, D. The Concept of Energy Justice across the Disciplines. Energy Policy 2017, 105, 658–667. [Google Scholar] [CrossRef]
Figure 1. (a) Standardized normal probability plot and (b) residuals vs. normal distribution quantiles.
Sustainability 16 08434 g001
Figure 2. CUSUSM test plot for parameter stability.
Sustainability 16 08434 g002
Figure 3. Predicted change in the LCF by a 10-unit shock in (a) coal, (b) natural gas, (c) petroleum, and (d) nuclear energy consumption. The circular dark blue dot (.) represents the predicted value of the LCF. Green, orange, and cyan spikes denote 75, 90, and 95% confidence intervals. On the x-axis, time 0 corresponds to the year 2022, and time 30 represents the year 2052, with intervals of 10 years.
Sustainability 16 08434 g003
Table 1. Summary statistics.
StatisticLCFCOALNGPETRONUCLEAR
Mean0.46816.41822.05133.2995.062
Median0.46116.4922.01734.376.416
Maximum0.6422.79733.34740.2178.459
Minimum0.3799.18112.92620.1690.02
Std. Dev.0.0654.2454.5124.7973.24
Skewness1.083−0.0160.521−1.146−0.423
Kurtosis3.9591.6433.2163.8381.568
Jarque–Bera14.4984.7612.92315.3917.152
Probability0.0010.0920.23200.028
Sum29.0381017.891367.172064.55313.823
Sum Sq. Dev.0.25810991241.931403.94640.348
Observations6262626262
Table 2. Stationarity test.
Variable(s)ADFPPZA
I(0)I(1)I(0)I(1)I(0)Break PointI(1)Break Point
LCF−2.154−6.556 ***−2.511−6.557 ***−2.7921968−7.13 ***1967
COAL−0.885−6.713 ***−1.046−6.801 ***−4.772 **2006−5.412 ***1998
NG−0.021−6.163 ***−0.275−6.219 ***−2.7082007−4.428 ***1976
PETRO−2.97 **−5.878 ***−2.859 *−5.880 ***−3.2031972−6.298 ***1981
NUC−1.701−5.577 ***−1.478−5.615 ***−3.8572000−4.187 *1976
Note: All the unit root tests include both a constant and a linear trend. ***, **, and * denote significance at the 1%, 5%, and 10% levels, respectively. ADF, PP, and ZA represent the augmented Dickey–Fuller, Phillips–Perron, and Zivot–Andrews test statistics.
Table 3. Selection of the optimal lag length criteria.
LagLLLRDfp-ValueFPEAICHQICSBIC
0−397.589NANANA0.46313513.419613.487913.5942
1−23.2904748.6250.0004.1 × 10−6 *1.77635 *2.18595 *2.82352 *
2−0.1705846.24 *250.0064.4 × 10−61.839022.589963.75884
Note: * represents a 10% level of significance. LL, LR, Df, FPE, AIC, HQIC, and SBIC represent the log-likelihood, likelihood ratio, degrees of freedom, final prediction error, Akaike information criterion, Hannan–Quinn information criterion, and Schwarz Bayesian information criterion.
Table 4. ARDL short-run and long-run results.
VariableCoefficientStd. Err.
ECT−0.559 ***0.094
Long  Run
COAL−0.012 ***0.002
NG−0.007 ***0.002
PETRO−0.008 ***0.001
NUC0.014 ***0.002
Short  Run
PETRO−0.004 ***0.001
NG−0.019 **0.008
Constant0.5840.095
R-squared0.722
Observation61
Note: *** and ** indicate 1% and 5% levels of significance, respectively.
Table 5. Pesaran, Shin, and Smith bounds testing results.
K10%5%1%p-Value
I(0)I(1)I(0)I(1)I(0)I(1)I(0)I(1)
F9.1592.5623.7113.0574.3234.1855.6920.0000.000
t−5.935−2.552−3.658−2.88−4.029−3.531−4.7530.0000.000
Table 6. Diagnostic test results.
a. Breusch–Godfrey LM Test for Autocorrelation
lags(p)FdfProb > F
10.767520.3852
21.474510.2387
31.569500.2085
b. Cameron and Trivedi’s Decomposition of IM Test
Sourcechi2dfP
Heteroskedasticity37.42350.3584
Skewness3.1470.8715
Kurtosis0.7310.3938
Total41.29430.5455
c. Skewness and Kurtosis Tests for Normality
VariableObsPr(skewness)Pr(kurtosis)Adj chi2(2)Prob > chi2
res1610.73110.77510.20.905
Table 7. Result of the DYNARDL model.
Variable(s)CoefficientStd. Err.
COAL−0.007 ***0.0024
COAL−0.006 ***0.0013
NG−0.006 ***0.0021
NG−0.004 ***0.0011
PETRO−0.008 ***0.0016
PETRO−0.005 ***0.0014
NUC−0.0110.0075
NUC0.007 ***0.0018
ECT(−1)−0.521 ***0.1101
Constant0.5460.1122
R-squared0.7275
Note: *** represents a 1% level of significance.
Table 8. Results of the causality test.
VariableAvg.SEtP > |t|P25P50P75
COAL−0.0040.001−3.9920.000−0.008−0.004−0.001
NATURAL GAS−0.0010.001−1.3340.187−0.0020.0000.001
PETROLEUM−0.0080.001−13.0710.000−0.012−0.009−0.006
NUCLEAR0.0040.0012.5880.0120.0020.0040.005
Lamda0.086Sigma4R-square0.977Tolerance0.062
Eff. df.4Looloss0.17
Disclaimer/Publisher’s Note: The statements, opinions and data contained in all publications are solely those of the individual author(s) and contributor(s) and not of MDPI and/or the editor(s). MDPI and/or the editor(s) disclaim responsibility for any injury to people or property resulting from any ideas, methods, instructions or products referred to in the content.

