Article

A Study on Carbon Emission Reduction in the Entire Process of Retrofitting High-Rise Office Buildings Based on the Extraction of Typical Models

1
School of Architecture, Tulane University, New Orleans, Louisiana, LA 70118-5698, USA
2
Building Energy Research Group, Department of Building and Construction, City University of Hong Kong, Tat Chee Avenue, Kowloon M5014, Hong Kong SAR, China
3
School of Architecture and Urban Planning, Qingdao University of Technology, Qingdao 266033, China
*
Authors to whom correspondence should be addressed.
Sustainability 2024, 16(19), 8506; https://doi.org/10.3390/su16198506
Submission received: 29 August 2024 / Revised: 24 September 2024 / Accepted: 26 September 2024 / Published: 29 September 2024

Abstract

:
The building sector is one of the largest contributors to carbon emissions globally, with high-rise office buildings being a major source due to their energy-intensive operations. This study aims to address the critical issue of carbon emission reductions through the retrofitting of existing high-rise office buildings, focusing on the entire life cycle of these buildings, including the embodied, operational, and demolition phases. Existing research has primarily concentrated on energy consumption and carbon emissions during the operational phase, neglecting the carbon impact of the retrofitting process itself. This research seeks to fill that gap by quantifying the carbon reduction benefits of retrofitting across all life-cycle stages. Using data from 100 high-rise office buildings in Hangzhou’s Gongshu District, five typical models were extracted based on their construction eras and architectural features. Retrofitting strategies tailored to these models were developed, and the carbon reduction benefits were calculated using the carbon emission factor method. The primary findings indicated that the shape and orientation of buildings are crucial factors influencing the carbon reduction benefits of retrofitting. Buildings oriented east–west tend to exhibit greater carbon reductions after retrofitting. During the embodied and demolition phases, retrofitting emissions remain similar for models constructed in the same era due to consistent material inputs. However, emissions vary for models from different eras, primarily due to differences in envelope materials and subsequent material consumption. High-rise office buildings constructed between 2007 and 2021 demonstrate higher overall retrofit carbon reduction rates compared to those built before 2007, despite the latter achieving greater reductions during the operational phase. The shorter remaining lifespans of pre-2007 buildings diminish their life-cycle carbon reduction advantages. Notably, complex-shaped buildings from the same era do not necessarily exhibit lower overall retrofit carbon reduction rates compared with rectangular or L-shaped buildings, with comparable reductions per unit area. This suggests that complex-shaped buildings should not be disregarded for retrofitting based solely on shape considerations. Furthermore, the remaining lifespan of a building significantly impacts its post-retrofitting carbon reduction benefits; longer lifespans result in greater benefits, and vice versa. In practical engineering applications, structural reinforcement measures can be implemented prior to retrofitting to extend a building’s structural lifespan, ultimately enhancing its carbon reduction benefits.

1. Introduction

In recent years, the pace of urban development has continued to accelerate with the expansion of construction scales and increasing complexity of building types. While this has fueled urban economic growth, it has also been accompanied by issues such as excessive energy consumption and environmental pollution [1]. In 2020, China announced its “dual-carbon” goals of striving to peak carbon dioxide emissions by 2030 and achieving carbon neutrality by 2060. The construction industry constitutes a significant portion of carbon emissions, and compared to developed economies, China’s construction sector accounts for a relatively higher proportion of carbon emissions due to structural differences in its industry. According to the “2022 China Building Energy Consumption and Carbon Emissions Research Report”, China’s total energy consumption related to buildings amounted to 2.27 billion tons of coal equivalent (tce) in 2020, representing 45.5% of the country’s total energy consumption; correspondingly, building-related carbon emissions totaled 5.08 billion tce, accounting for 50.9% of the country’s total carbon emissions [2]. These energy consumption and carbon emissions primarily stem from the coal and oil consumed during building cooling and heating [3]. Therefore, carbon emission reduction in the construction sector will have a substantial impact on China’s sustainable development [4].
To evaluate the environmental impact of buildings, Life Cycle Assessment (LCA) has been widely applied to study carbon emissions throughout a building’s entire life cycle, from inception to demolition [5,6]. This life cycle is divided into the embodied phase (material production, transportation, and construction), the use phase, and the demolition phase. The majority of greenhouse gas emissions from buildings occur during the use phase, accounting for 50% of total building emissions; the embodied phase contributes 30% of total carbon emissions, while the construction and demolition phases contribute 15% and 5%, respectively [7,8]. Currently, researchers tend to focus more on carbon emissions during the operation phase, but under the principle of sustainable development, this focus alone is inadequate. With the emergence of new materials, technologies, and processes, the proportion of carbon emissions during the embodied and demolition phases is also expected to increase relatively [9]. To expedite the achievement of the “dual-carbon” goals, it is imperative to evaluate building carbon emissions from a full life-cycle perspective.
In recent years, China’s rapid urbanization and continuous improvement in people’s living standards have led to a swift increase in the construction area of buildings, accompanied by a yearly uptrend in total building-related carbon emissions [10]. According to the “2022 China Building Energy Consumption and Carbon Emissions Research Report”, energy consumption and carbon emissions during the use phase of public buildings account for 40% and 42%, respectively, of the country’s total building energy consumption and carbon emissions [2]. Generally, public buildings refer to structures designed for various public activities, encompassing office buildings, commercial complexes, and tourist attractions, among others. Due to their high occupancy density, diverse equipment types, and frequent usage, public buildings have always been a focal point of building energy conservation efforts. In China, as of 2020, the stock of public buildings accounted for 21.3% of the total building stock area, yet their energy consumption during the use phase comprised 33.2% of the total [2].
The influencing factors of carbon emissions in public buildings are determined by variables that affect energy consumption, which tend to be more diverse compared to other building types [11]. Currently, the primary factors influencing energy consumption in public buildings include the building envelope, window-to-wall ratio, shape factor, orientation, and building energy-consuming equipment. Among these factors, the building envelope is generally considered the most significant contributor. Existing research indicates that the heat transfer area of exterior walls in public buildings accounts for approximately 66% of the total exterior envelope area, and the energy loss caused by heat transfer through exterior walls comprises roughly 48% of the total energy consumption of the entire envelope [12,13]. Consequently, modifications to the building envelope of public buildings can effectively reduce energy consumption for heating and cooling [14,15]. The window-to-wall ratio, a crucial parameter in the facade design of public buildings, significantly impacts building energy consumption. Since energy loss through exterior windows is typically 3–4 times higher than that through exterior walls of the same area, windows, which occupy a minority of the total exterior wall area, consume 40–50% of the heat or cooling energy [16,17]. Therefore, it is essential to maintain the window-to-wall ratio within a reasonable range. Furthermore, the building shape factor directly influences energy consumption. A larger shape factor indicates a larger exterior surface area per unit building volume, resulting in increased heat loss. Research data suggest that for every 0.01 increase in the building shape factor, the heat consumption index rises by approximately 2.5% [18]. Hence, controlling the building shape factor at a lower level is advisable. Building orientation primarily refers to the direction faced by the front facade or the main facade of a building. The orientation significantly impacts building energy efficiency. The principle in choosing orientation is to maximize solar exposure in winter while avoiding the dominant wind direction for primary rooms and minimizing solar gain in summer. Building equipment, including heating, ventilation, air-conditioning, and electrical systems, are significant contributors to building energy consumption. Among them, HVAC systems typically account for a substantial portion of building energy use, offering considerable potential for energy savings [19,20].
In recent years, research on energy-saving retrofits for public buildings in China has primarily focused on the modification of building envelopes [21,22,23]. For instance, some studies have specifically targeted solid envelope components such as exterior walls and roofs [24,25,26], while others have concentrated on transparent envelope structures like windows and curtain walls [27,28,29]. Many more investigations have encompassed the entire envelope system of public buildings within their scope [30,31]. In contrast, research on energy-saving retrofits for public buildings in other countries has placed greater emphasis on the development and application of novel materials [32,33,34]. These studies have confirmed the energy-saving effectiveness of envelope modifications. However, most of them focus on specific case studies, making it difficult to generalize their findings and provide insights for energy-saving retrofits in a particular category of public buildings [35,36]. Additionally, existing research primarily considers the carbon emission reduction benefits during the building’s usage phase before and after the retrofit, neglecting the changes in carbon emissions throughout the entire retrofit process.
In China, office buildings constitute the most prevalent type of public buildings. In 2021, the total area of public buildings reached 14.7 billion square meters, with office buildings accounting for approximately 21% of this figure [2]. As one of the most common types of public buildings, office buildings have a large and growing stock area, accompanied by high energy consumption, particularly in high-rise office buildings. These buildings rely heavily on active equipment like central air-conditioning systems for indoor environmental control, making envelope structures and heating/cooling equipment key targets for energy conservation [36]. Addressing the gaps in current research, this study selects high-rise office buildings located in China’s hot-summer and cold-winter climate zone as the research subjects. In summary, this study aims to address the pressing need for comprehensive carbon emission assessments in the retrofitting of high-rise office buildings. Existing research primarily concentrates on the operational phase, leaving a notable gap in evaluating carbon emissions during the embodied and demolition phases. Furthermore, these studies often focus on individual buildings, limiting the generalizability of their findings to a broader class of buildings. Therefore, this research fills this void by conducting a full life-cycle analysis of carbon emissions for retrofitted high-rise office buildings in China, using extracted typical models as case studies. The objective was to quantify the carbon reduction benefits of retrofitting strategies, thereby offering insights that contribute to the achievement of China’s dual-carbon goals and informing future sustainable development practices within the construction sector.

2. Research Methods

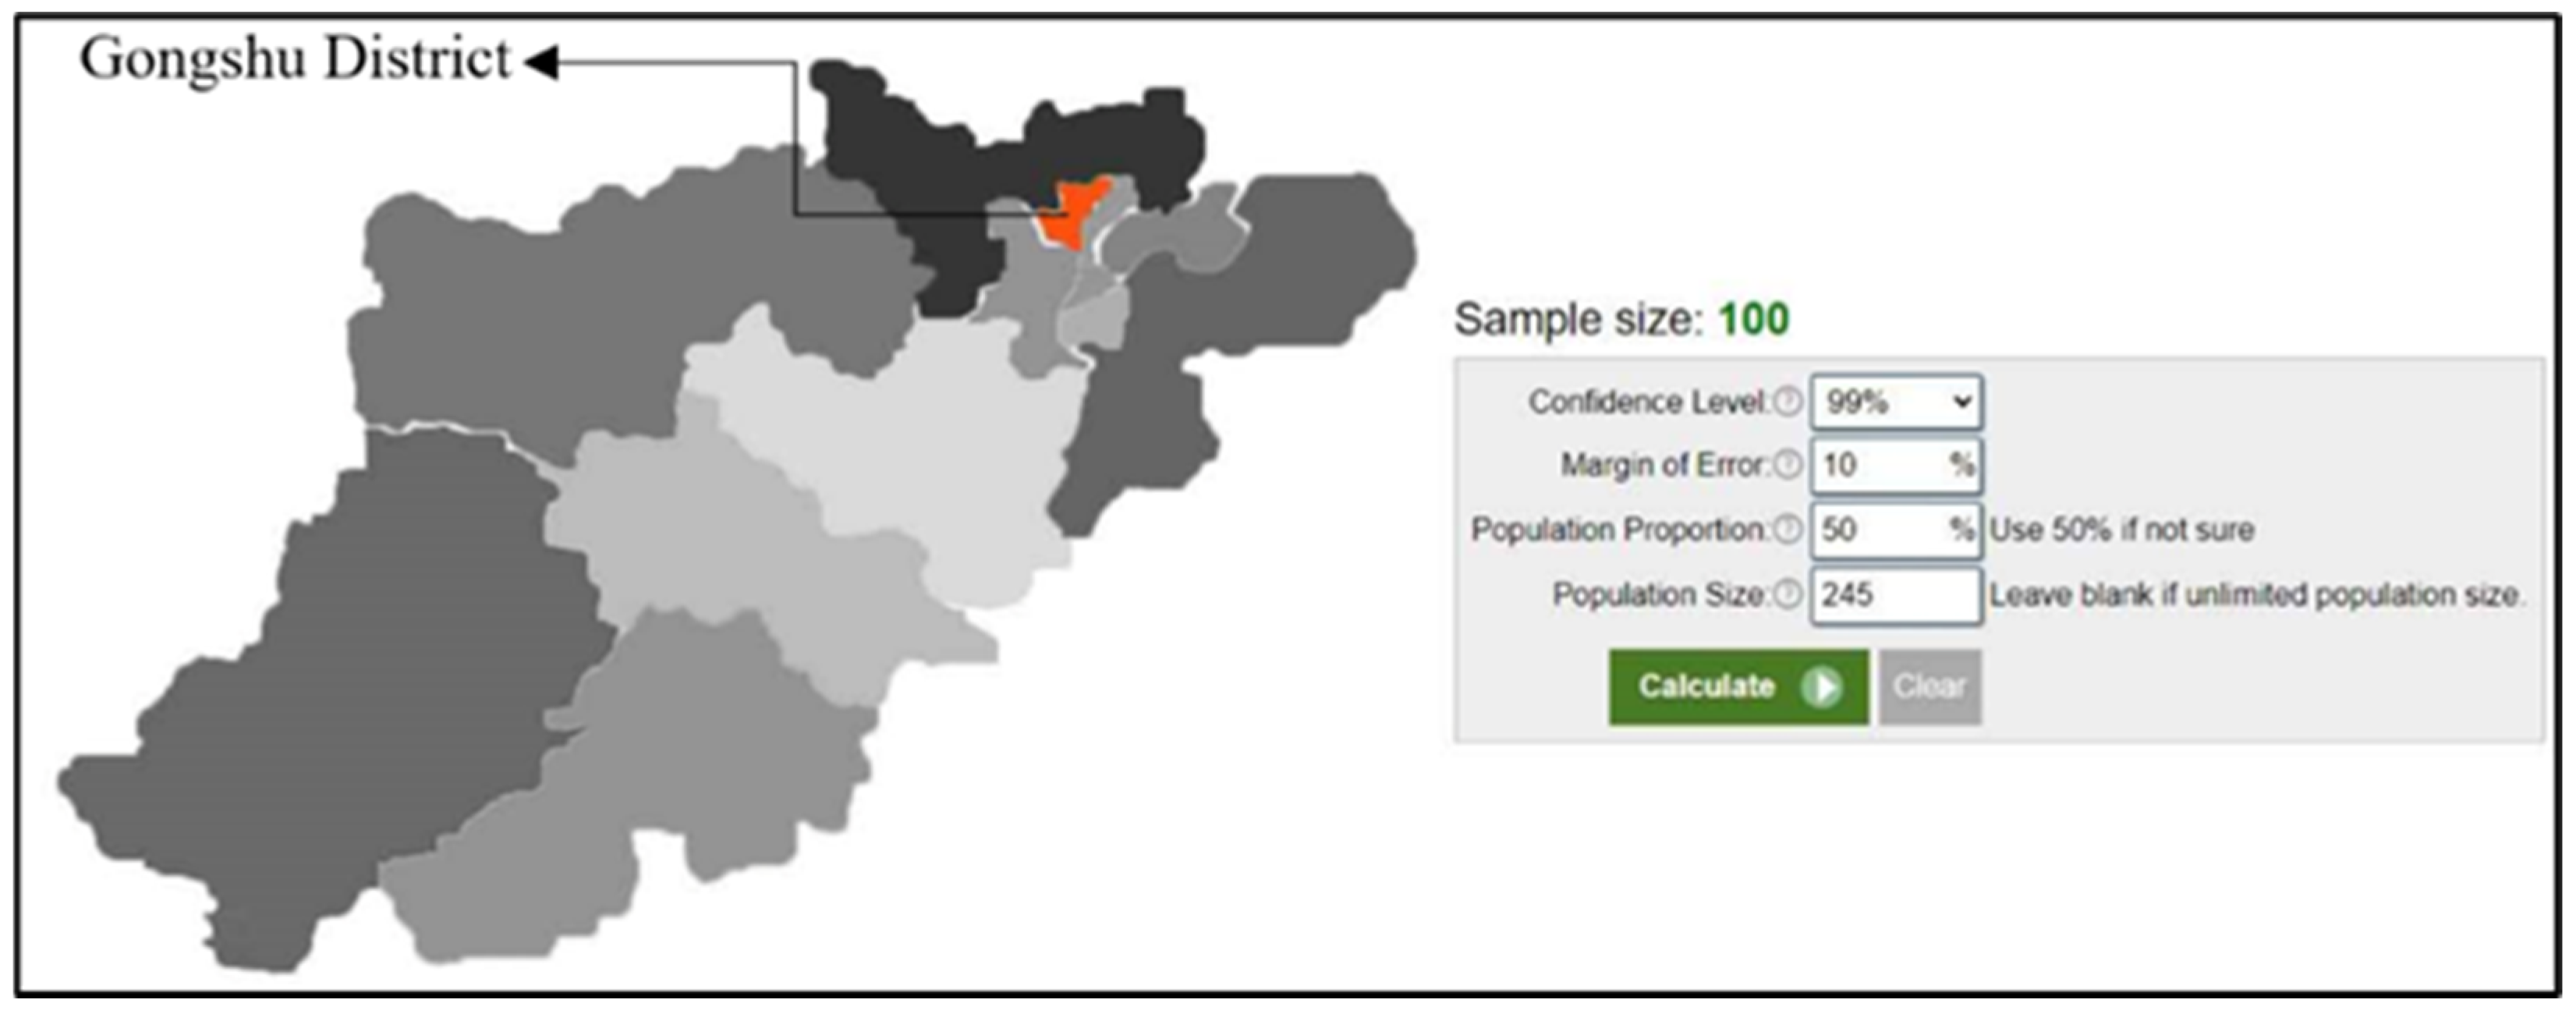
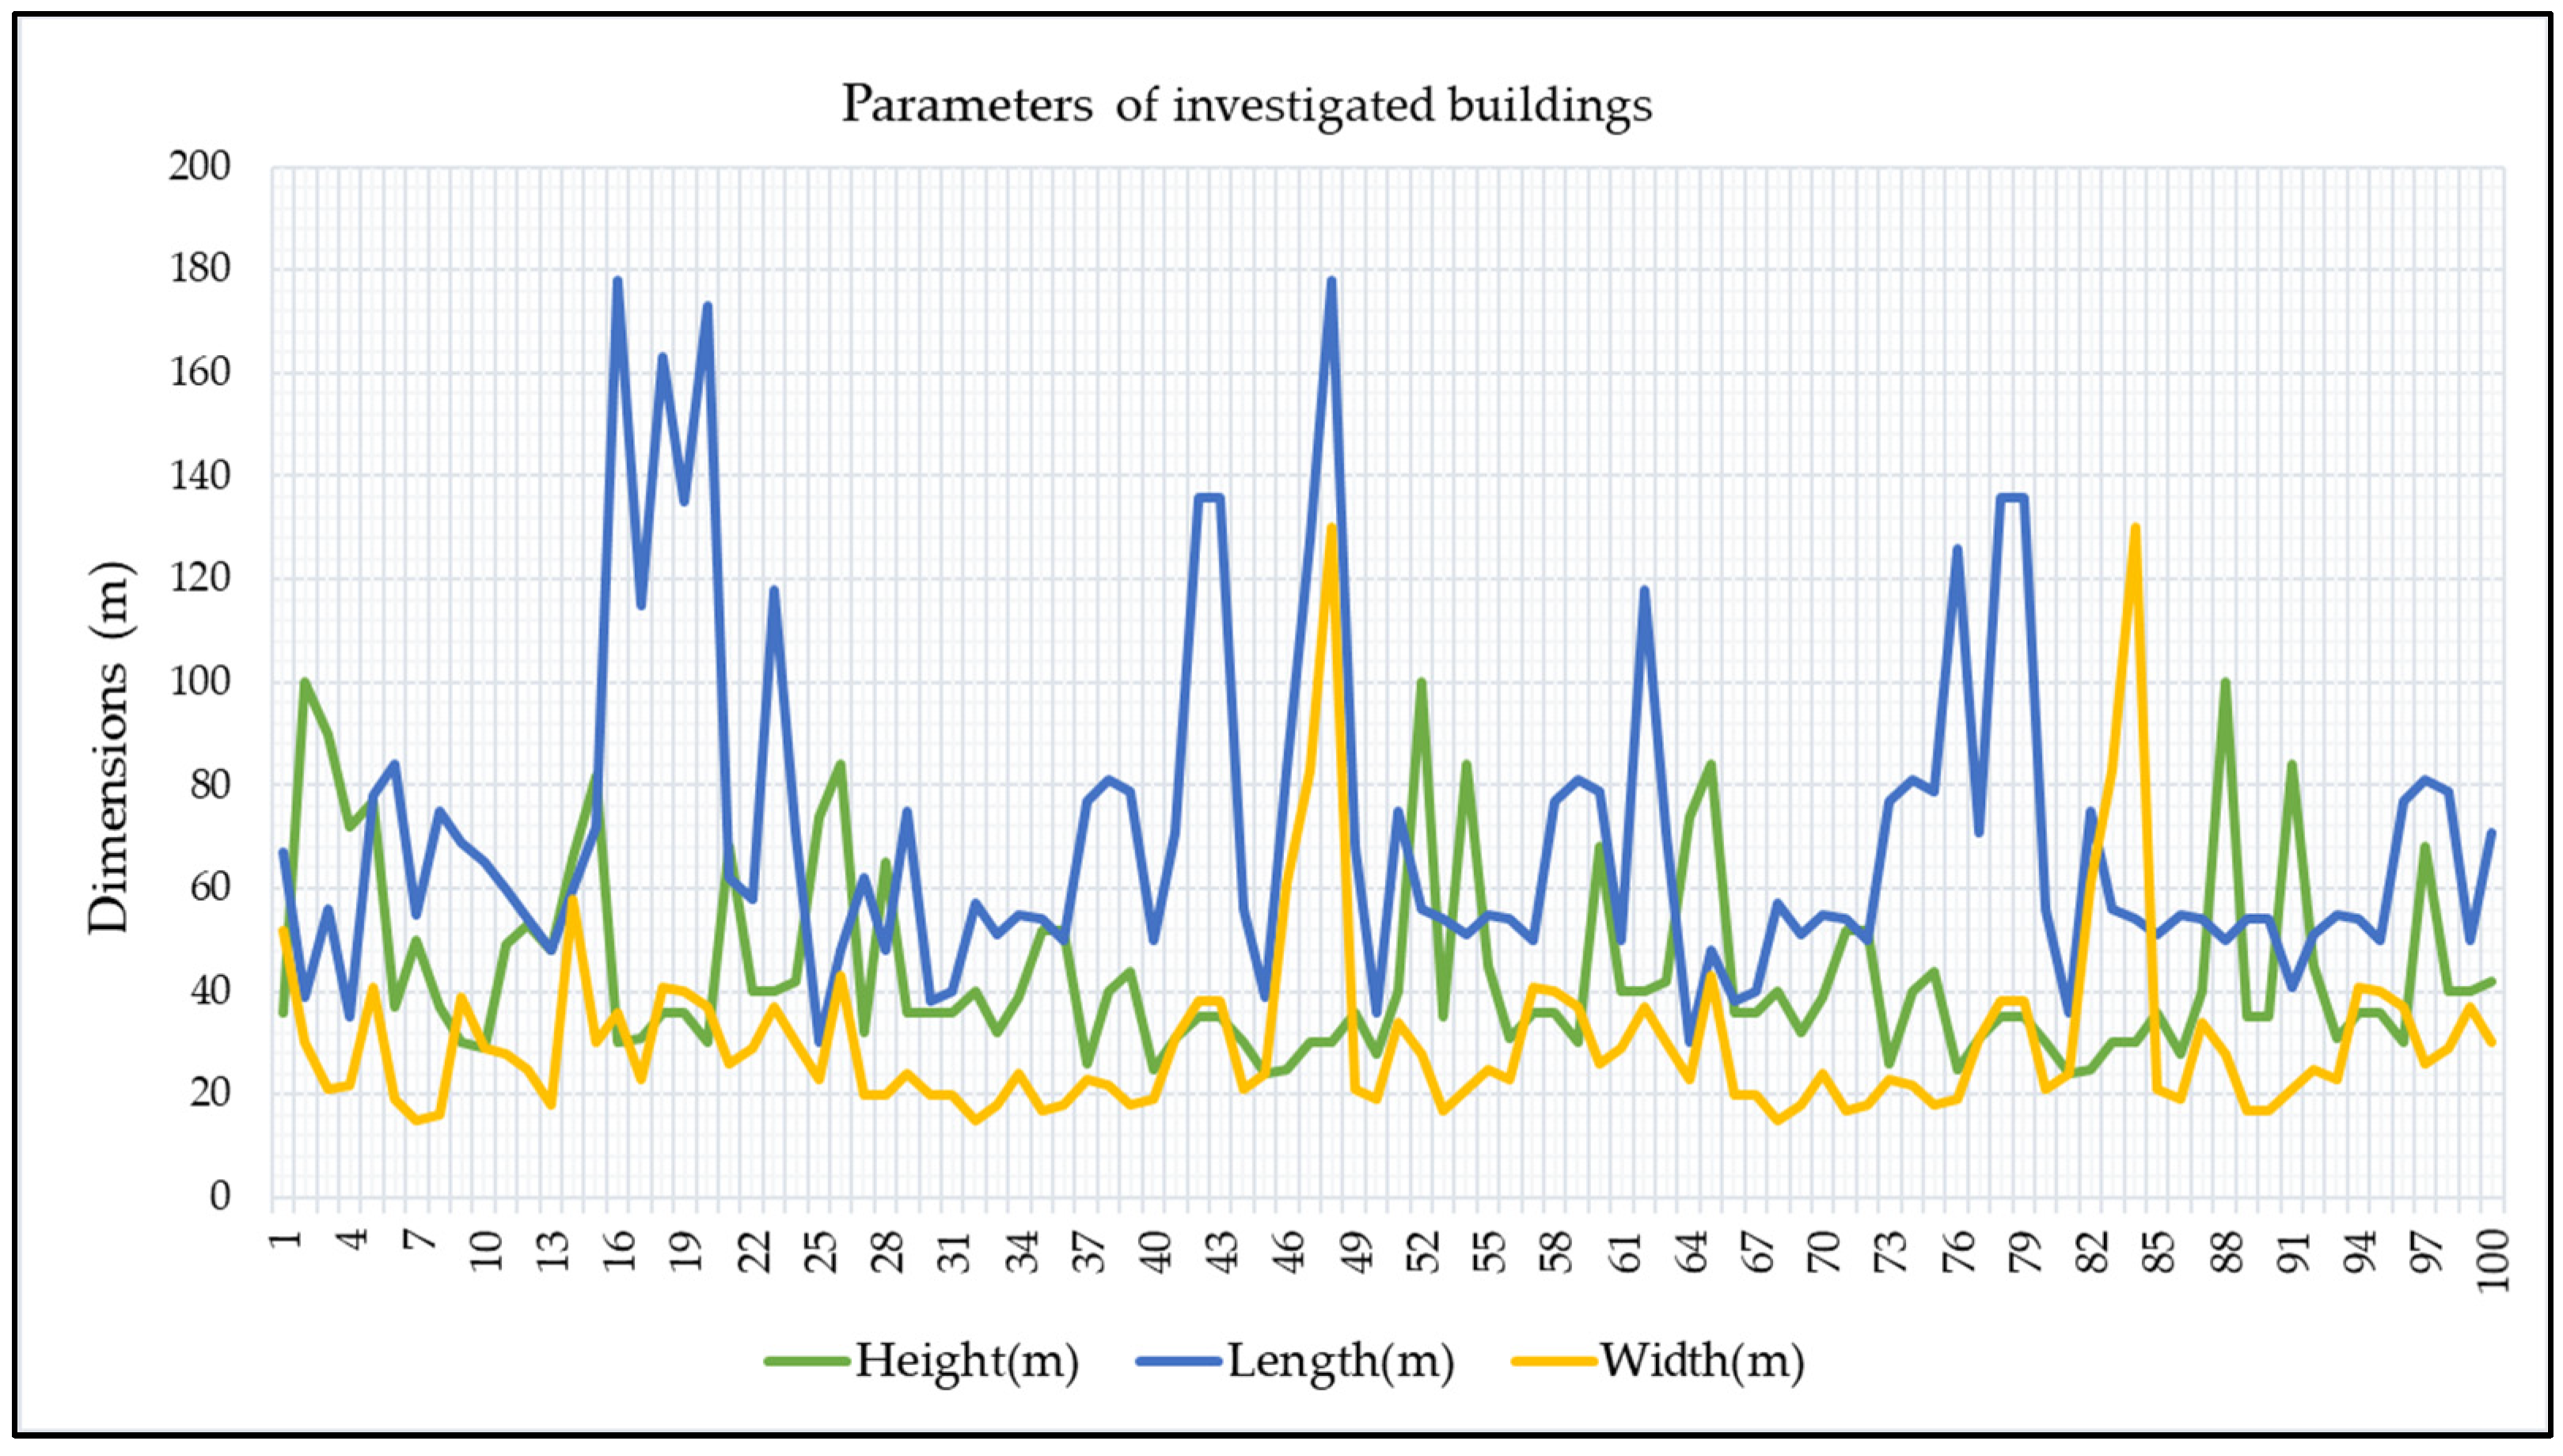
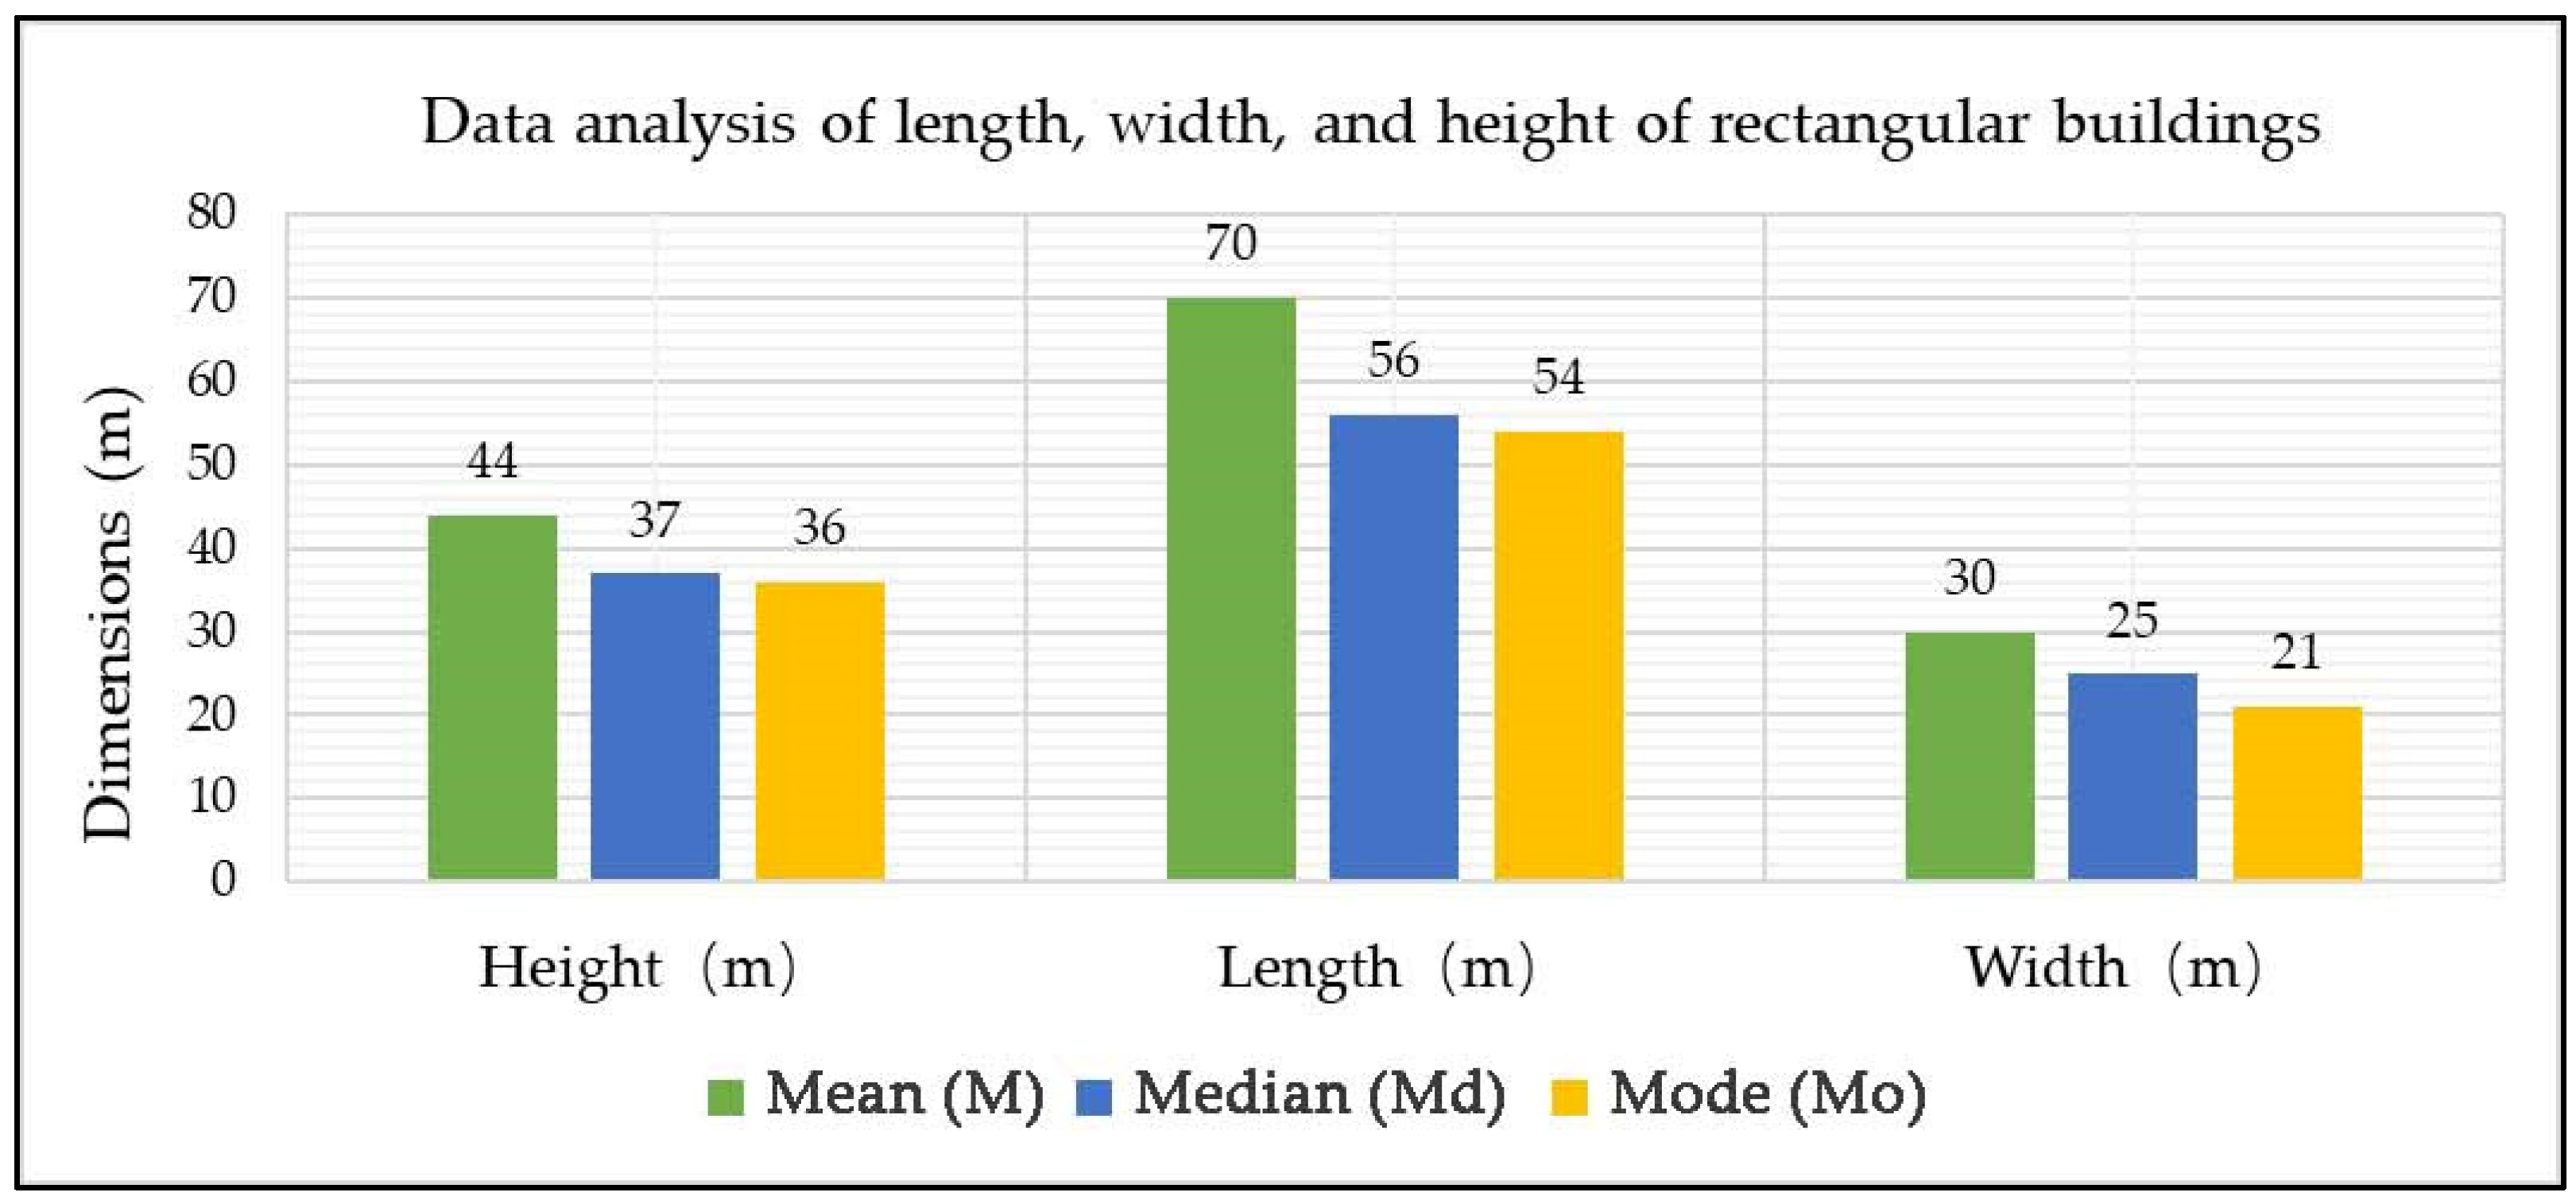
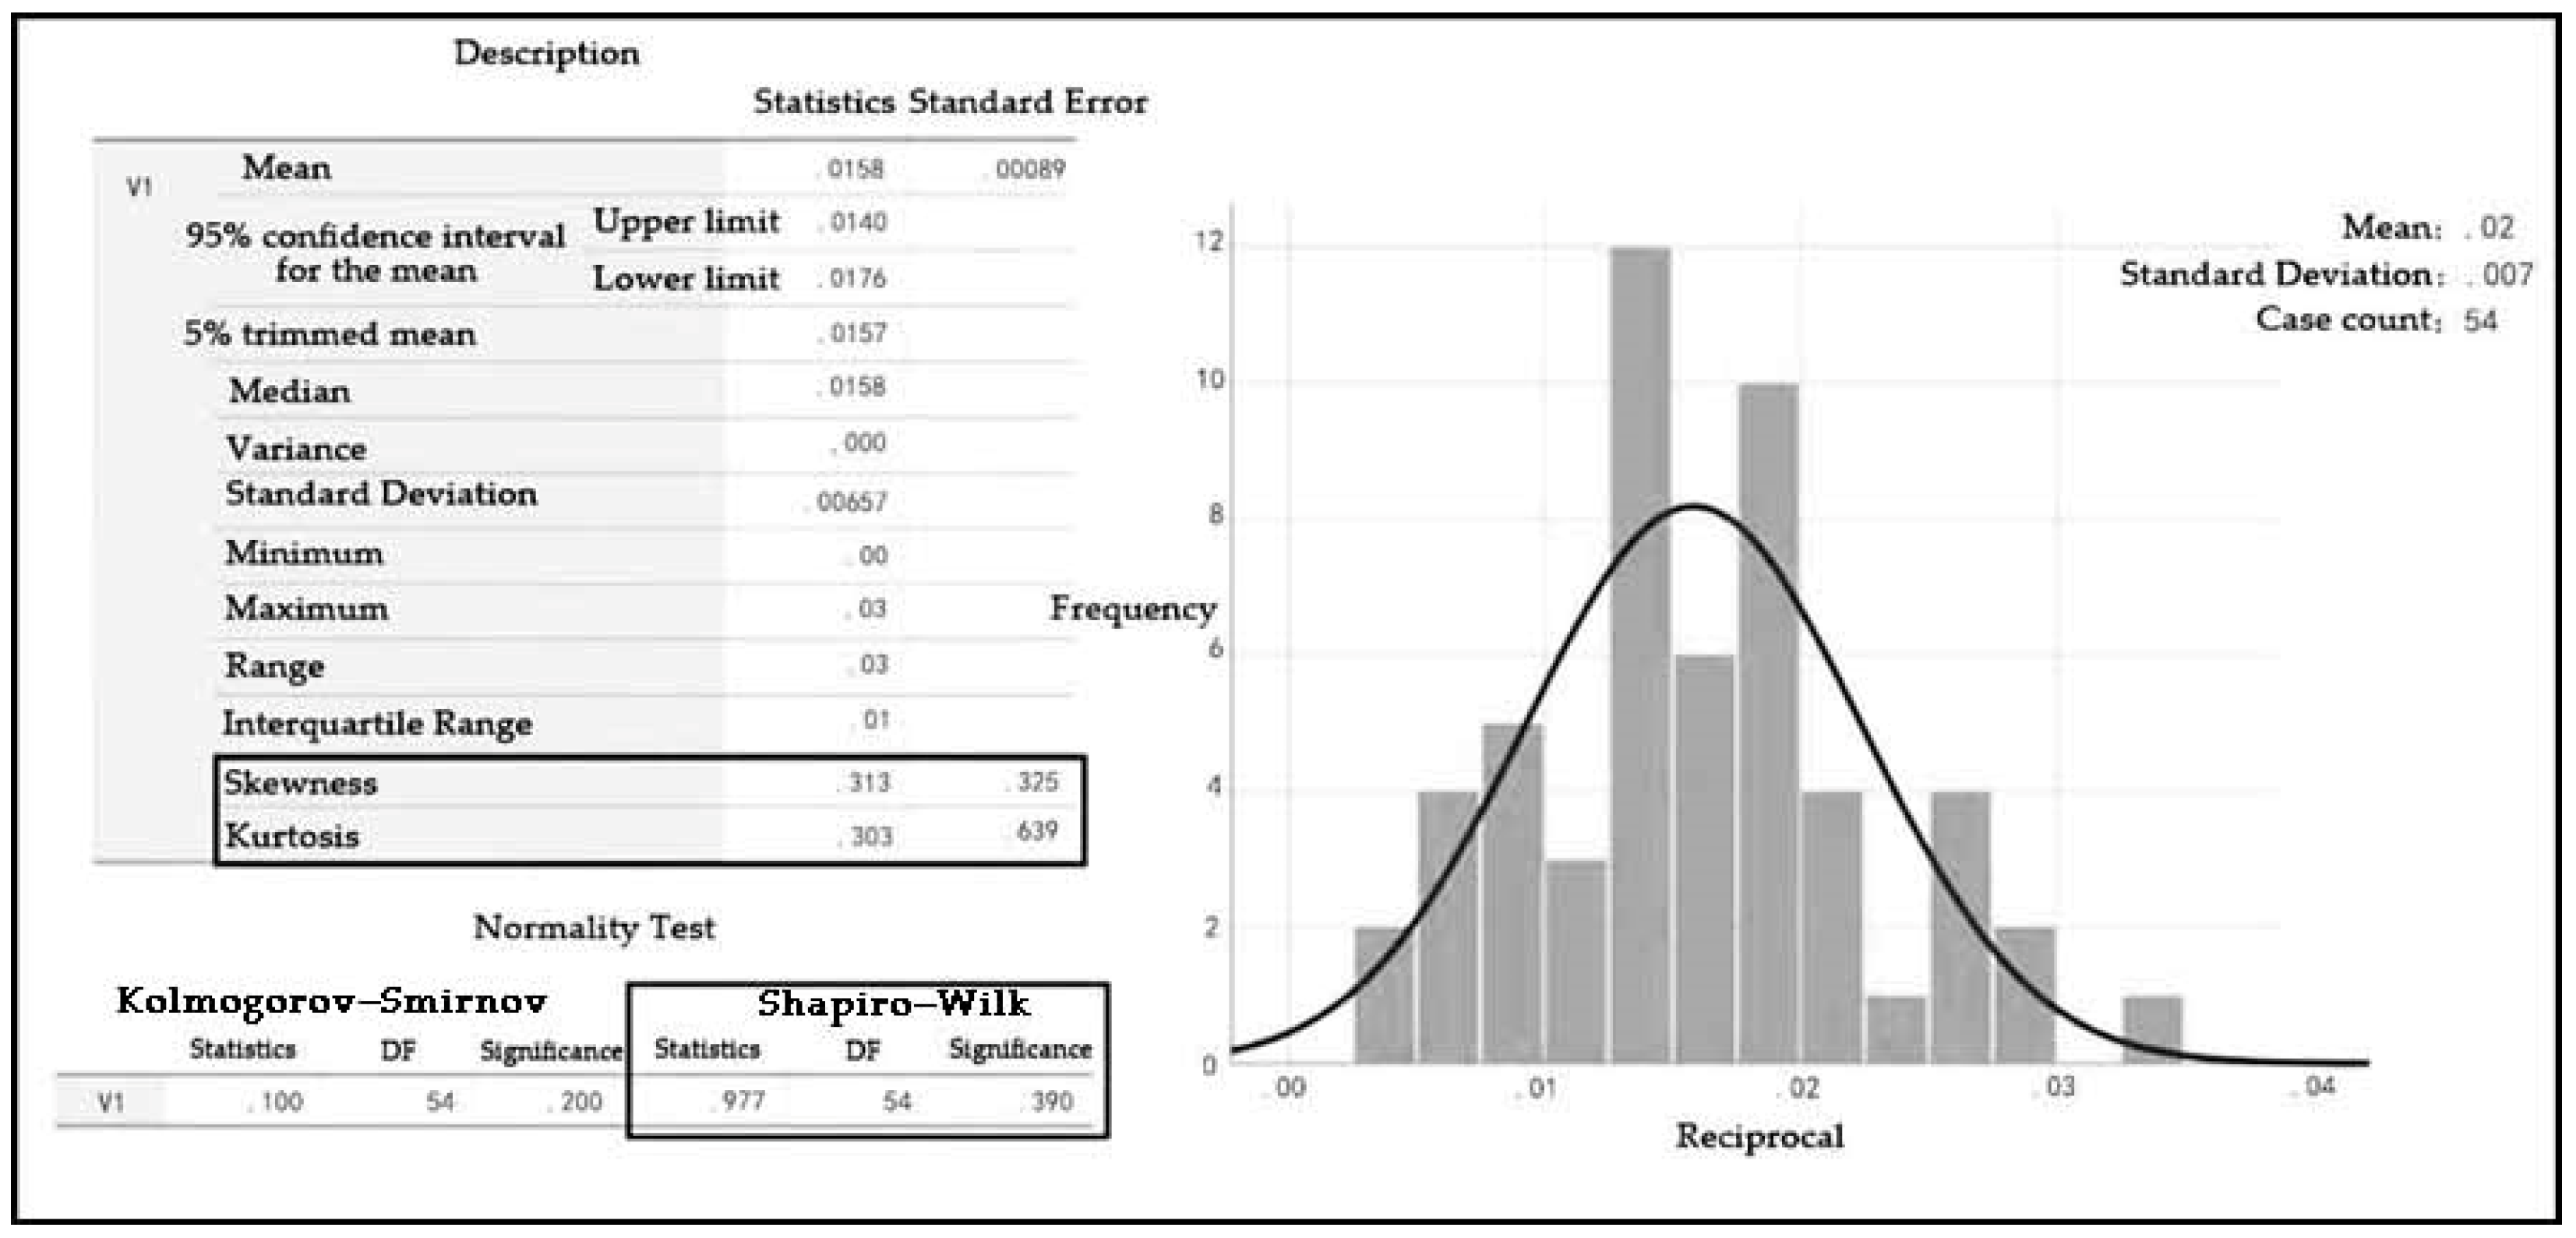
2.1. Case Study and Generation of Typical Models

Given the sheer number of existing buildings, it is generally impractical to conduct an analysis on each individual building. Consequently, it is essential to establish typical prototypes that can represent a particular type of building [37]. Therefore, this study aims to develop a typical model for existing high-rise office buildings by investigating the factors influencing their carbon emissions. The research area chosen was Gongshu District, Hangzhou City (left in Figure 1). According to relevant statistical data, there are 245 high-rise office buildings within the surveyed area. Following the principles of the sampling survey, and under the premises of a 99% confidence level and a 10% margin of error, the sample size for this study was set at 100 buildings (right in Figure 1).
The varying construction eras of the surveyed buildings have led to differences in the design standards and construction practices adhered to during their design, resulting in varying levels of energy consumption. Based on the “Energy Efficiency Design Standard for Public Buildings in Zhejiang Province” (DB33/1036-2007) and its updated version (DB33/1036-2021), the 100 surveyed high-rise office buildings were classified into two categories: those completed before 2007 and those completed between 2007 and 2021. Among them, buildings completed before 2007 accounted for 65% of the total surveyed samples, while those completed between 2007 and 2021 constituted 35% of the total. The surveyed high-rise office buildings primarily face south or north, with 62% having a height ranging from 24 to 50 m. The building plans are predominantly rectangular, accounting for over 50% of the surveyed buildings.
To establish a representative typical model that encapsulated the characteristics of all surveyed buildings, this study employed the method of measures of central tendency. This approach involved constructing a typical model by analyzing the planar forms, shape coefficients, orientations, and facade window-to-wall ratios of the surveyed buildings. Measures of central tendency describe the concentration of a large proportion of data points around a specific value or range, reflecting the central or predominant trend within a data set [39]. These measures encompass arithmetic mean, median, mode, weighted mean, geometric mean, and harmonic mean, among others.
In this paper, a comprehensive analysis of the mean (M), median (Md), and mode (Mo) of each data set is conducted. Furthermore, the distribution curves of these measures are integrated to determine the relevant data required for ultimately establishing the typical model. The specific steps are as follows:
(1) Calculate the values of M, Md and Mo for each data set and compare their magnitudes.
(2) When M = Md = Mo, the data follow a normal distribution, and thus, the M value is taken as the typical value for that data set. When M > Md > Mo or M < Md < Mo, the data exhibit skewness, and either the Md or Mo value should be selected as the typical value. Consequently, further comparison between Md and Mo is necessary. ① If the difference between Md and Mo is negligible, the average of the two can be taken as the typical value for the data set. ② If there is a significant difference between Md and Mo, or if Mo is not unique, the corresponding distribution curve should be plotted and a normality test performed before determining the final typical value. Common normality tests include the Kolmogorov-Smirnov (K-S) test and the Shapiro-Wilk (S-W) test. The K-S test is suitable for large sample sizes, while the S-W test is appropriate for small samples. When the p-value (significance) of the test result is less than 0.05, the data are considered not to follow a normal distribution. When M, Md, and Mo are unequal, but the p-value is greater than 0.05, the data set can be deemed to exhibit an approximate normal distribution.
If the normality analysis indicates an approximate normal distribution for the data set, the M value is directly taken as the typical data. Conversely, if the data set exhibits skewness, the skewed data can be transformed into a normal distribution, and then the M value of the transformed data is taken as the typical value for that data set.
The plan forms of the high-rise office buildings surveyed in this study can be primarily categorized into three types: rectangular, L-shaped, and U-shaped. Among them, there were 64 rectangular samples, 27 L-shaped samples, and 9 U-shaped samples. This subsection exemplifies the extraction process of a typical model using the aforementioned algorithm, with a focus on rectangular buildings oriented south–north (abbreviated as R-NS). Figure 2 presents the distribution of relevant data for the surveyed rectangular buildings.
After calculation, the M, Md and Mo values of the relevant data for R-NS high-rise office buildings are presented in Figure 3 (the results are rounded to integers for easier comparison and analysis). It can be observed that for the R-NS buildings, the data for length, width, and height all exhibit a skewed distribution, with M > Md > Mo. Notably, the Md and Mo values for height and width are relatively close. Therefore, the average of these two values can be taken as the typical height (37) and width (24) for the model.
The substantial difference between the Md and Mo values of the length data for R-NS office buildings necessitated a normality analysis for this data set. The preliminary normality analysis revealed a skewness of 2.550, a kurtosis value of 7.151, and p-values from both the Kolmogorov-Smirnov (K-S) and Shapiro-Wilk (S-W) tests that were less than 0.05, indicating a skewed distribution for this data set. Due to the high skewness Z-score and high dispersion at both ends, the data set was transformed into its reciprocals before conducting another normality analysis. The results of this analysis are presented in Figure 4. After the reciprocal transformation, the S-W test yielded a p-value of 0.400, which is greater than 0.05. Additionally, the histogram visually demonstrates a normal distribution, allowing the transformed M value to be taken as the typical value for the length of R-NS buildings. Converting the M value back to its original scale by inverting the reciprocal, the resulting M value represents the typical value for the original data set. The same steps were repeated to obtain the typical data for the window-to-wall ratios of various building facades. The final data for the typical R-NS model are summarized in Table 1.
Using the same methodology, typical models were extracted for rectangular buildings oriented east–west(R-WE), L-shaped buildings, and U-shaped buildings. Ultimately, a total of five typical models were derived in this study. The data for these models are presented in Table 2. Since L-shaped and U-shaped buildings do not have strict definitions of length and width, the shape factor analysis approach was adopted for their analysis. Additionally, L-shaped buildings were further classified into those oriented south–north (L-NS) and east–west (L-WE) based on the orientation of their primary facade. For U-shaped buildings, as they do not have a dominant orientation, no such distinction was made.
It should be emphasized that the generation of these five typical models is based on sample data from 100 office buildings. The sample size of 100 buildings was determined based on a 99% confidence level and a 10% margin of error. This sample was randomly selected from the 245 high-rise office buildings in Hangzhou’s Gongshu District, representing a significant portion of the region’s high-rise office building stock. The selection criteria ensured that the buildings met the high-rise definition (24 to 100 m in height) and were primarily used for office purposes. While specific to Hangzhou, the characteristics of these buildings are comparable to those in other urban regions within China’s hot-summer and cold-winter climate zones, making the sample sufficiently representative of broader building stocks.

2.2. Envelope Construction Practices of Existing High-Rise Office Buildings

In order to ultimately derive research findings on the carbon emission benefits of high-rise office building retrofits with universal applicability, this paper, from an architectural perspective, focuses solely on the impact of envelope retrofit on building carbon emissions without validating materials or emerging technologies. Table 3 categorizes the typical models by era. All typical models have a shape factor of less than 0.4. Furthermore, despite variations in plan forms among the typical models, the construction practices for roofs, exterior walls, windows, and floors are consistent within models of the same construction period.
Prior to 2007, there were no established energy-efficiency design standards for public buildings, resulting in a general lack of energy-saving measures in the envelopes of most public buildings. Based on comprehensive survey results and literary review, the primary envelope construction practices for typical models during this period are presented in Table 4 [40,41]. In 2007, Zhejiang Province implemented the first edition of the “Design Standard for Energy Efficiency of Public Buildings” (DB33/1036-2007) [42], requiring that the energy consumption of public buildings be reduced by 50% compared to the 1980s’ baseline. Since then, insulation measures have been introduced for the envelopes of public buildings. Concurrently, during this period, the government gradually banned the use of clay bricks, and autoclaved aerated concrete blocks began to replace them as the primary material for exterior walls of buildings [43]. The specific construction practices are shown in Table 5.

2.3. Retrofitting Strategies for Existing High-Rise Office Buildings

In 2021, Zhejiang Province promulgated a new edition of the “Design Standard for Energy Efficiency of Public Buildings” (DB33/1036-2021) [44], raising the energy-saving rate requirement to 75%. The thickness of insulation layers in building envelopes has since increased, and the energy-saving performance requirements for exterior windows, exterior doors, and other components have also gradually been enhanced. The thermal transmittance value requirements and practices for various components are presented in Table 6.

2.4. Carbon Emission Calculation

Currently, the life-cycle theory has been extensively employed in evaluating the carbon reduction benefits of retrofitting existing buildings. The scope of carbon emission calculation in this study encompasses all stages of the retrofitting process for existing high-rise office buildings, namely, material production, material transportation, construction, building operation, and demolition.

2.4.1. Carbon Emission Calculation for Embodied Phase and Demolition Phase

In this study, the emission factor method was adopted to calculate carbon emissions. The emission factor method provided by the Intergovernmental Panel on Climate Change (IPCC) is the most widely used method for accounting greenhouse gas emissions [45]. This method calculates the carbon emissions of an activity or process by obtaining the activity data related to construction activities and applying the corresponding emission factors [46]. The accounting formula is as follows:
E = A D i × E F i
wherein E represents the carbon dioxide emissions (kgCO2); i denotes the type of activity; AD stands for activity data, which includes the output, consumption, or usage of a specific activity or process, such as building energy consumption and transportation mileage; and EF represents the emission factor, indicating the carbon emissions generated per unit of activity, such as kgCO2/kWh or kgCO2/m2. Table 7 provides detailed calculation methods for carbon emission at different phases, and Table 8 provides the carbon emission factors for the production of various building materials. During the embodied phase, carbon emissions from material production were obtained by multiplying the material consumption by the carbon emission factor of that material. Materials consumption can be obtained by using the model-establishment software. For carbon emissions related to material transportation, construction, and installation in the embodied phase, as well as emissions from construction activities and waste transportation during the demolition phase, the standard SCCEB-GB/T51366-2019 recommends the use of the proportional estimation method [47]. This method is considered more feasible for research projects due to the lack of detailed data on the mechanical vehicles required for actual construction and transportation. Additionally, the recommended values in the proportional estimation method are derived from extensive engineering practices, ensuring the accuracy of the calculation results. It is important to note that this study focused solely on the changes in carbon emissions resulting from the retrofitting process. Therefore, during the demolition phase, only the emissions from materials added due to the retrofit were calculated, excluding emissions from demolishing the building itself. This approach ensured fairness when comparing the carbon reduction benefits of retrofitting different buildings.

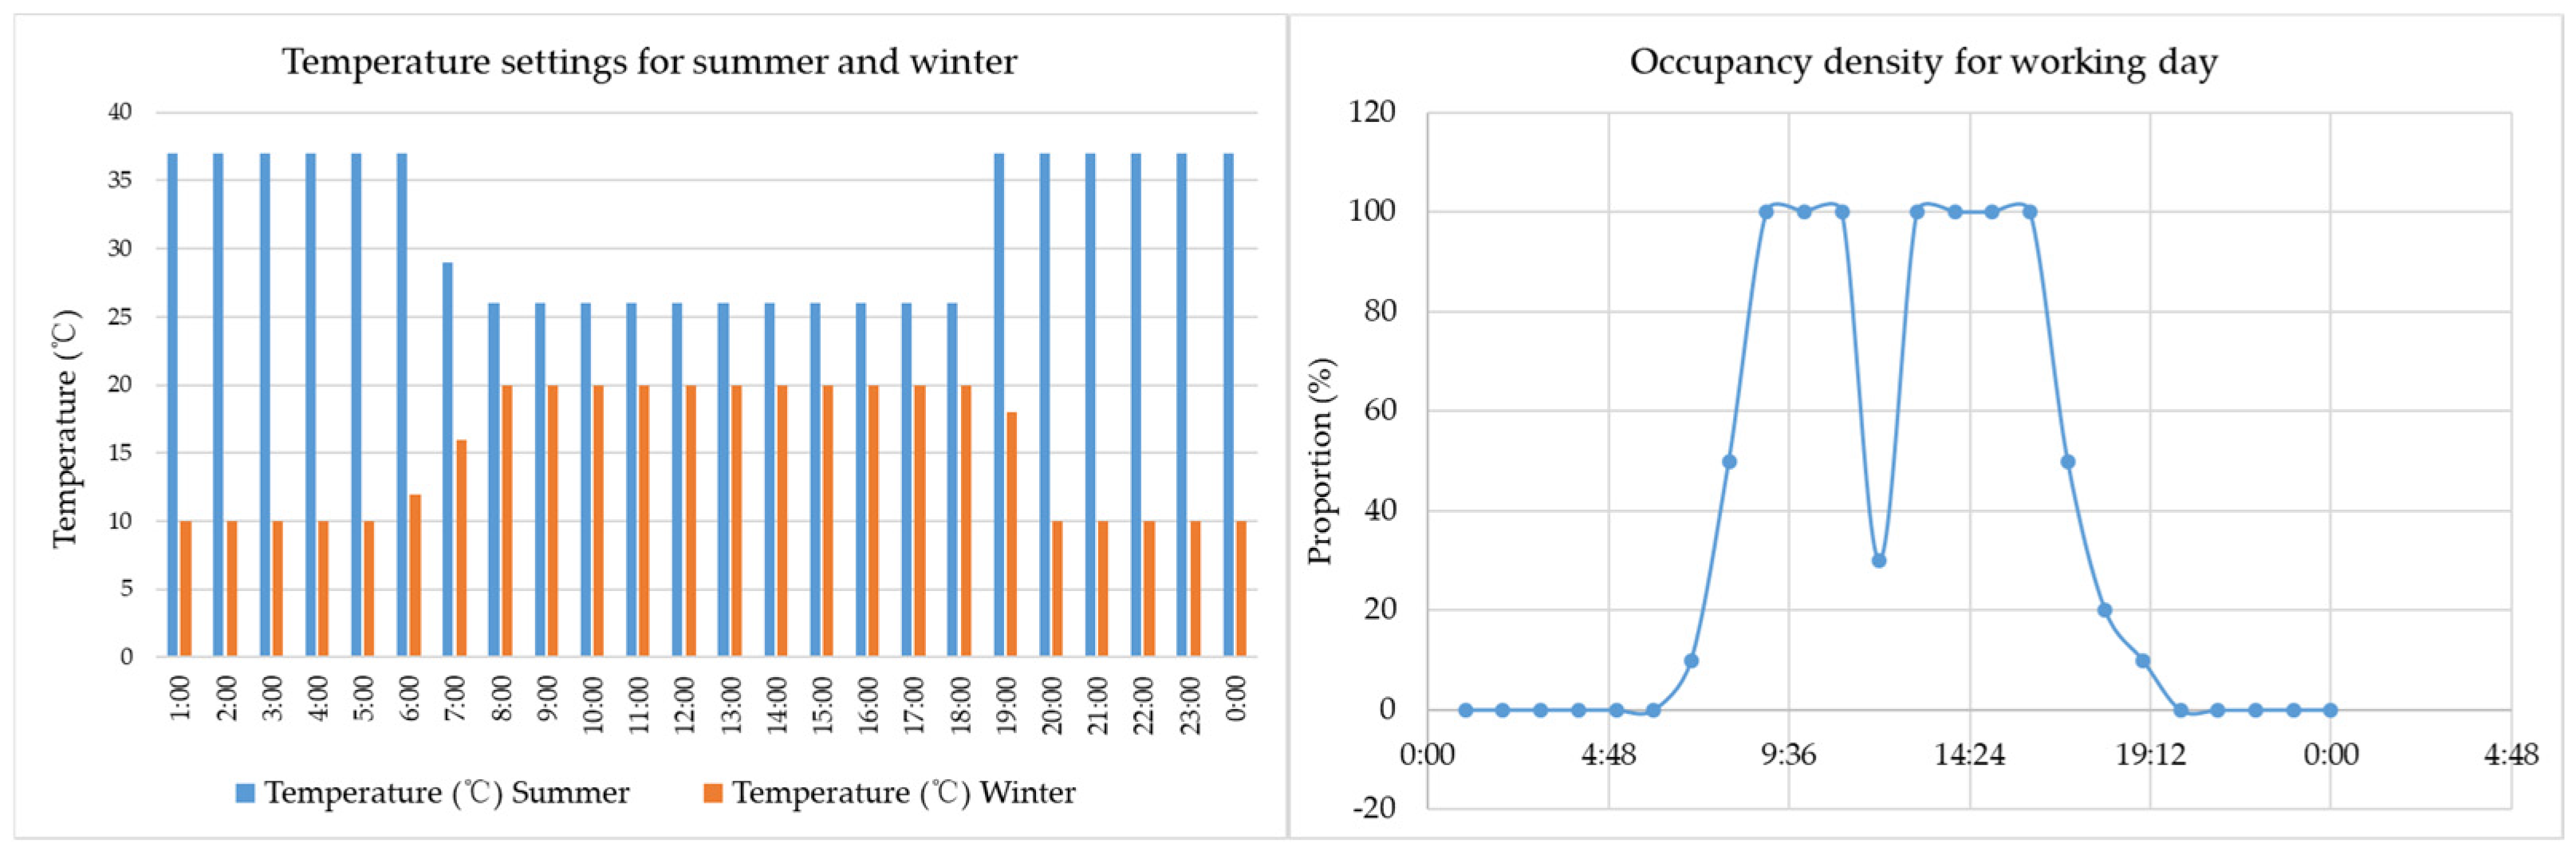
2.4.2. Carbon Emission Calculation for the Operation Phase

The carbon emissions during the operation phase were primarily obtained through software simulation, utilizing the CEEB2024 carbon emission calculation software. This software incorporates China’s SCCEB-GB/T51366-2019 and a carbon emission database [47], enabling direct access to carbon emission factors of Chinese building materials upon model completion, significantly enhancing calculation efficiency. The carbon emission simulation process primarily comprises three parts: model establishment, input of envelope structure practices and configuration of heating and cooling systems, and exportation of calculation results. The envelope structure can be set according to the practices introduced in Section 2.2 and Section 2.3. Indoor environmental parameters can be set based on relevant building standards. Table 9 presents some of the thermal design parameters. It is noteworthy that in the simulations before and after retrofitting, these thermal parameters remained consistent to ensure that the envelope structure retrofitting served as the sole variable influencing carbon emissions.
Through research, it was found that most high-rise office buildings employ multi-split air-conditioning units to provide cooling and heating services. The simulated settings for the multi-split air-conditioning units had a rated energy efficiency ratio (EER) of 2.8 for cooling and 2.74 for heating. Both the fresh air supply fan and exhaust fan had a power consumption per unit air volume of 0.24 W/m3·h. The operating time of the air-conditioning units was synchronized with the occupancy rate. The settings for other energy-consuming equipment remained defaulted and consistent across all simulated conditions (Figure 5).

3. Results of Carbon Emission Calculations

3.1. Carbon Emissions during the Embodied Phase of the Retrofitting Process

During the embodied phase, the orientation of the building does not affect the retrofit strategy for the envelope structure, thus the carbon emissions associated with the production of materials required for retrofit are identical for buildings of the same model regardless of their orientation. Consequently, variations in the embodied carbon emissions primarily stemmed from differences in the construction year, which dictate the quantity of materials needed for retrofit, leading to varying levels of carbon emissions related to material production. Figure 6 illustrates the material usage and associated production-related carbon emissions during retrofit for each typical model. Within the same model, variations in carbon emissions during the production phase are mainly due to the use of clay bricks, prevalent in pre-2007 high-rise office buildings, which exhibited poor thermal insulation properties, necessitating greater inputs of insulation materials during retrofit. In contrast, high-rise office buildings constructed between 2007 and 2021 began to utilize aerated concrete blocks for exterior walls, offering significantly better thermal insulation, thereby reducing the amount of insulation materials required to achieve the same energy-saving performance. Additionally, the 2021 version of the “Design Standard for Energy Efficiency of Public Buildings” in Zhejiang Province did not impose stricter requirements on partition walls and slabs separating heated and unheated spaces compared to the 2007 version [44], hence no additional insulation materials were required for such partitions during retrofit for buildings constructed between 2007 and 2021. In summary, differences in embodied carbon emissions during retrofit for the same model were primarily attributed to variations in insulation material usage.
Variations in carbon emissions from material production also led to differences in carbon emissions from material transportation and construction. Assuming that retrofit materials were sourced locally, the carbon emissions from transportation were calculated as 2% of the material production emissions, while those from construction were estimated as 10% of the material production emissions. Figure 6 reveals that for pre-2007 high-rise office buildings, the embodied carbon emissions during retrofit were lowest for R-NS and R-WE buildings, averaging 23.9 kgCO2/m2, while L-NS and L-WE buildings exhibited the highest emissions, averaging 27.7 kgCO2/m2, with U-shaped buildings falling in the middle at 25.3 kgCO2/m2. For buildings constructed between 2007 and 2021, R-NS and R-WE buildings continued to have the lowest average embodied carbon emissions during retrofit at 14 kgCO2/m2, whereas U-shaped buildings had the highest emissions at 19 kgCO2/m2, and L-NS and L-WE buildings had intermediate emissions of 18.2 kgCO2/m2. These differences were primarily attributed to varying inputs of insulation materials, exterior windows, and doors. For instance, pre-2007 L-NS and L-WE buildings required the most insulation materials per square meter during retrofit, contributing to their higher embodied carbon emissions per square meter compared to rectangular and U-shaped buildings.

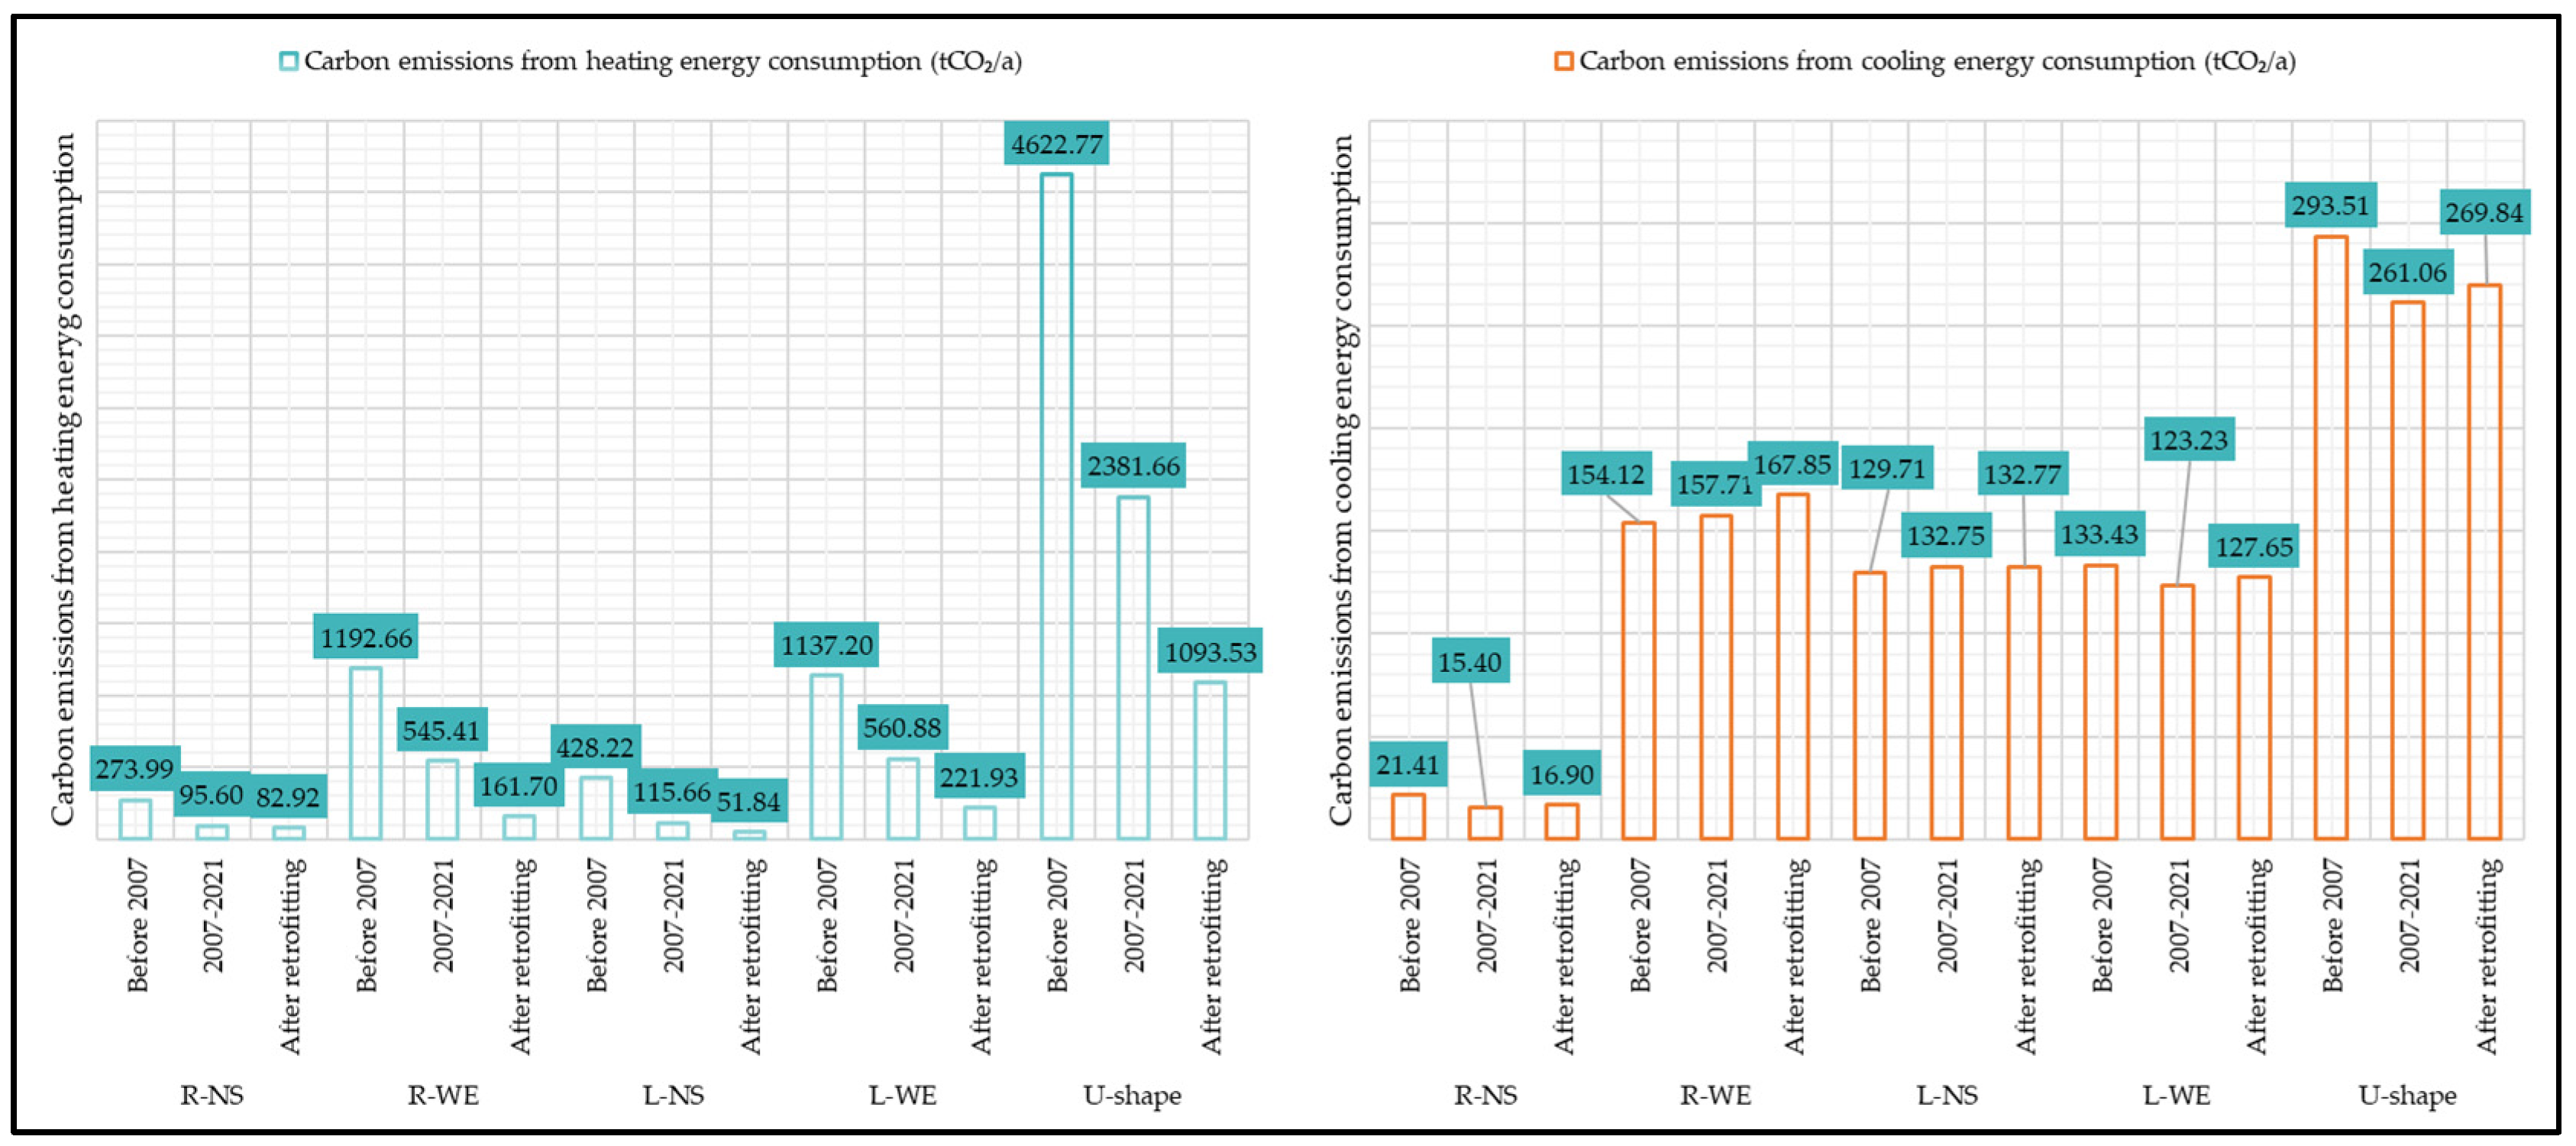
3.2. Carbon Emissions during the Operational Phase before and after Retrofit

Figure 7 illustrates the simulated results of carbon emissions during the operational phase. It is evident that the heating-related carbon emissions of all models have significantly decreased after retrofitting. The reduction is more pronounced in buildings constructed before 2007. Specifically, the retrofitting of U-shaped high-rise office buildings built before 2007 reduced annual carbon emissions by 3529.2 tons of CO2, while rectangular and L-shaped buildings exhibited annual reductions ranging from 191.07 to 1031 tons of CO2. Similarly, high-rise office buildings constructed between 2007 and 2021 also experienced a decrease in heating-related carbon emissions post-retrofit, albeit at a lower magnitude compared with those built before 2007. Among these, U-shaped buildings constructed between 2007 and 2021 still contributed the highest annual carbon reduction of 1288.1 tons of CO2, while rectangular and L-shaped buildings in this period saw reductions within the range of 12.7 to 338.96 tons of CO2 annually.
Overall, the heating-related carbon emission reductions achieved through retrofitting high-rise office buildings constructed between 2007 and 2021 only accounted for 3% of those achieved in buildings built before 2007. Thus, from a heating-related carbon mitigation perspective, retrofitting high-rise office buildings constructed before 2007 offers greater potential benefits. Ranking the carbon reduction potential of these older buildings, U-shaped buildings emerged as the top priority, followed by R-WE, L-WE, L-NS, and R-NS buildings. This ranking highlights the significant influence of orientation on heating-related carbon reductions within the same typological model. For instance, the R-NS model built before 2007 achieved an 18% reduction in heating-related carbon emissions compared to the R-WE model, primarily due to the latter’s limited solar gain during winter, leading to inherently higher carbon emissions (1192.66 tons CO2/a > 273.99 tons CO2/a). After retrofitting, although the rectangular model with an east–west orientation still emitted more carbon than its south–north counterpart (161.7 tons CO2/a > 82.92 tons CO2/a), the magnitude of the reduction was greater for the former.
Regarding cooling-related carbon emissions, for buildings constructed before 2007, the R-NS model, L-WE typical model, and U-shaped typical model experienced reductions ranging from 0.413 tons CO2/a to 236.72 tons CO2/a annually. Conversely, the R-WE and L-NS models of the same era showed increases in refrigeration-related carbon emissions, with respective increments of 137.32 tons CO2/a and 306 tons CO2/a. Notably, all typical models constructed between 2007 and 2021 experienced increased refrigeration-related carbon emissions post-retrofit, with increases ranging from 0.016 tons CO2/a to 10.15 tons CO2/a annually. These trends can be explained by two primary factors. Firstly, enhancing the thermal insulation of the building envelope can effectively prevent outdoor solar heat gain, thereby reducing cooling energy consumption and associated carbon emissions. However, when insulation reaches a certain level, the influence of solar heat gain on the indoor cooling load diminishes, while the impact of heat generated by other indoor sources intensifies. Additionally, excessive insulation may hinder heat dissipation from indoor sources, leading to increased cooling energy consumption and carbon emissions. Based on simulation results for the operational phase, adhering to Zhejiang’s 2021 edition of the “Design Standard for Energy Efficiency of Public Buildings” for retrofitting reveals that only the L-WE and U-shaped buildings built before 2007 possess significant potential for reducing cooling-related carbon emissions, followed by the R-NS model. For other typical models, cooling-related carbon emissions increase.
In a comprehensive assessment, the operational phase carbon emission reduction benefits of typical models constructed before 2007 were significantly higher than those constructed between 2007 and 2021 (Figure 8). Specifically, the L-WE model built before 2007 exhibited the highest carbon emission reduction benefit per unit area, at 73.2 kgCO2/a·m2. This was followed by the U-shaped and R-WE models of the same era, with respective benefits of 68.3 kgCO2/a·m2 and 63.8 kgCO2/a·m2. The R-NS and L-NS models built before 2007 showed benefits of 12.3 kgCO2/a·m2 and 30 kgCO2/a·m2, respectively. In contrast, the carbon emission reduction benefits of typical high-rise office buildings constructed between 2007 and 2021 ranged from 0.7 to 27 kgCO2/a·m2, with the R-NS model exhibiting the lowest benefit (0.7 kgCO2/a·m2) and the L-WE model the highest (27 kgCO2/a·m2).

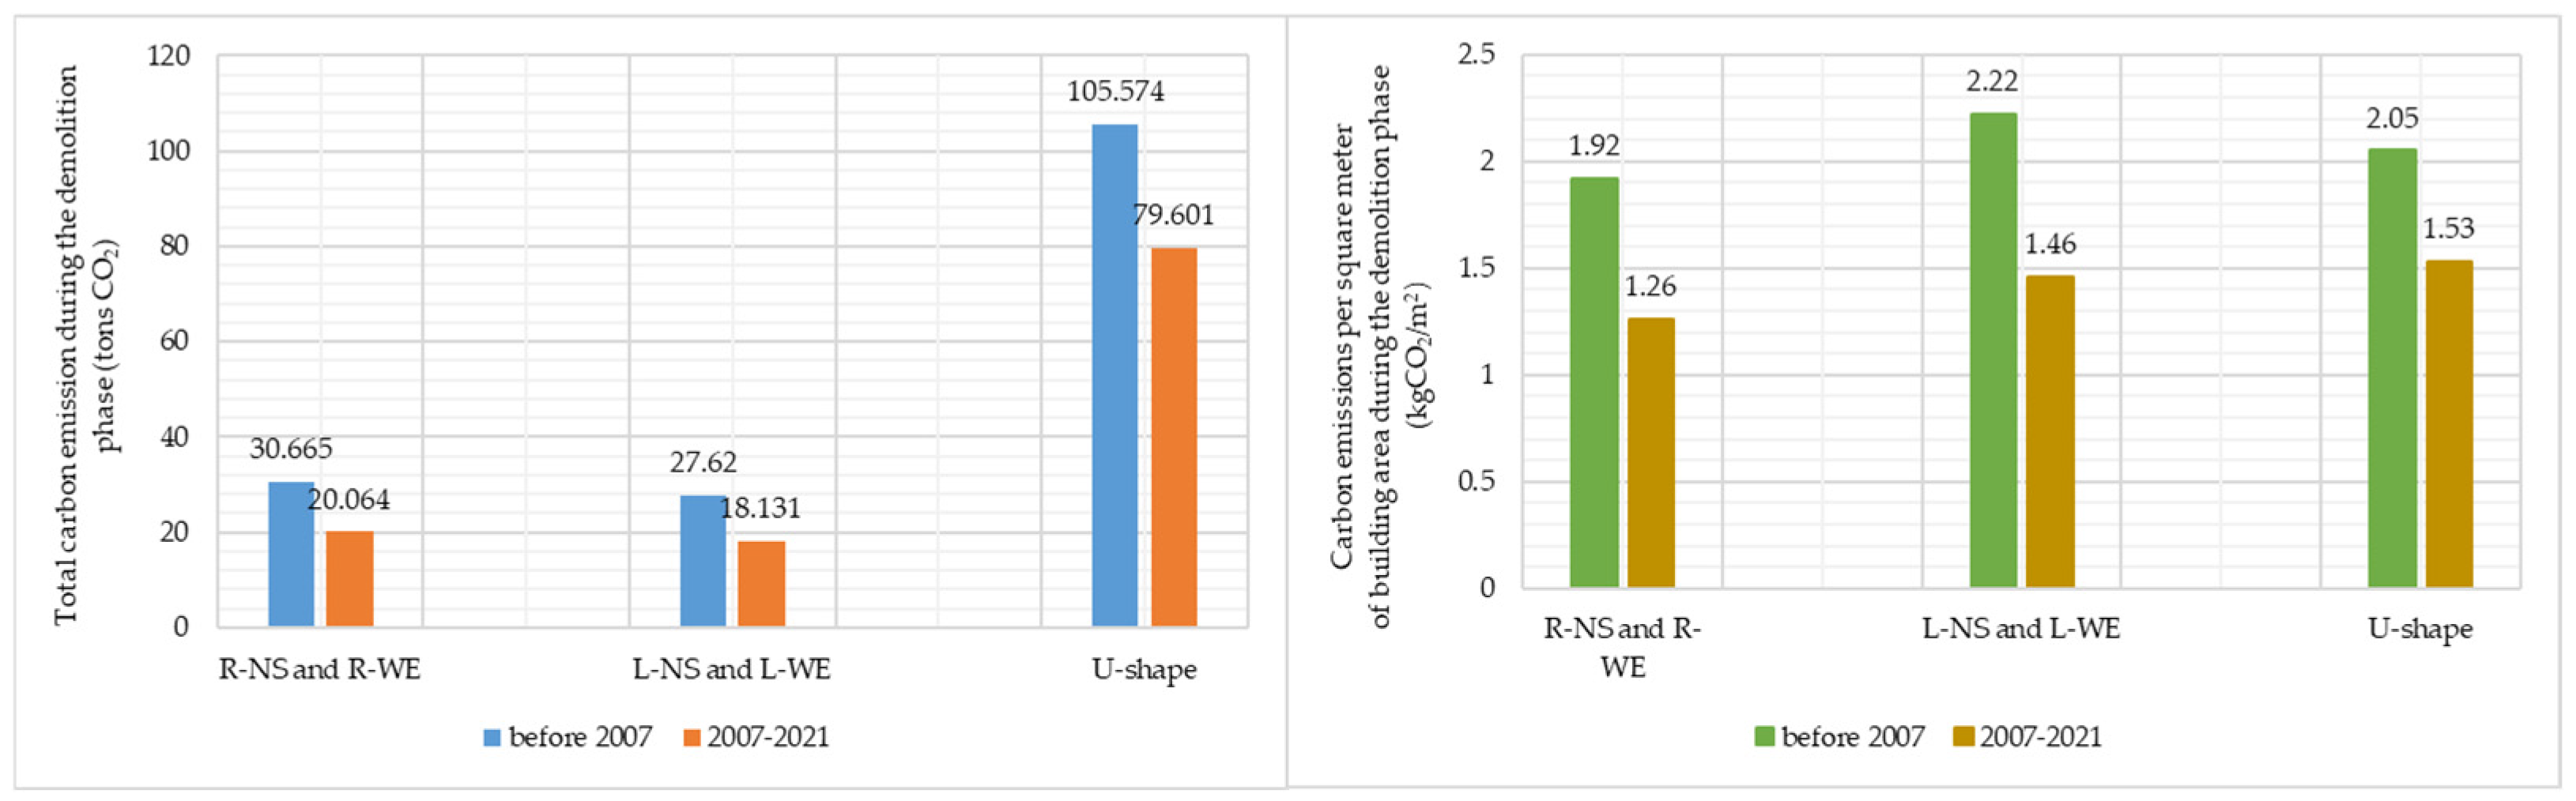
3.3. Carbon Emissions during Demolition Phase

The carbon emissions during the demolition phase refer to those associated with the materials used in the retrofit process, which are calculated using the proportional estimation method outlined in Table 7. The results are presented in Figure 9. It is evident that, due to the identical retrofit objectives, the total carbon emissions during the demolition phase remained constant for the same model, regardless of its orientation, leading to a uniform carbon emission per unit area. Among the five typical models, the L-NS and L-WE models built before 2007 exhibited the highest carbon emissions during the demolition phase, at 2.22 kgCO2/m2. In contrast, the rectangular high-rise office building typical model constructed between 2007 and 2021 had the lowest carbon emissions during this phase.

4. Discussion

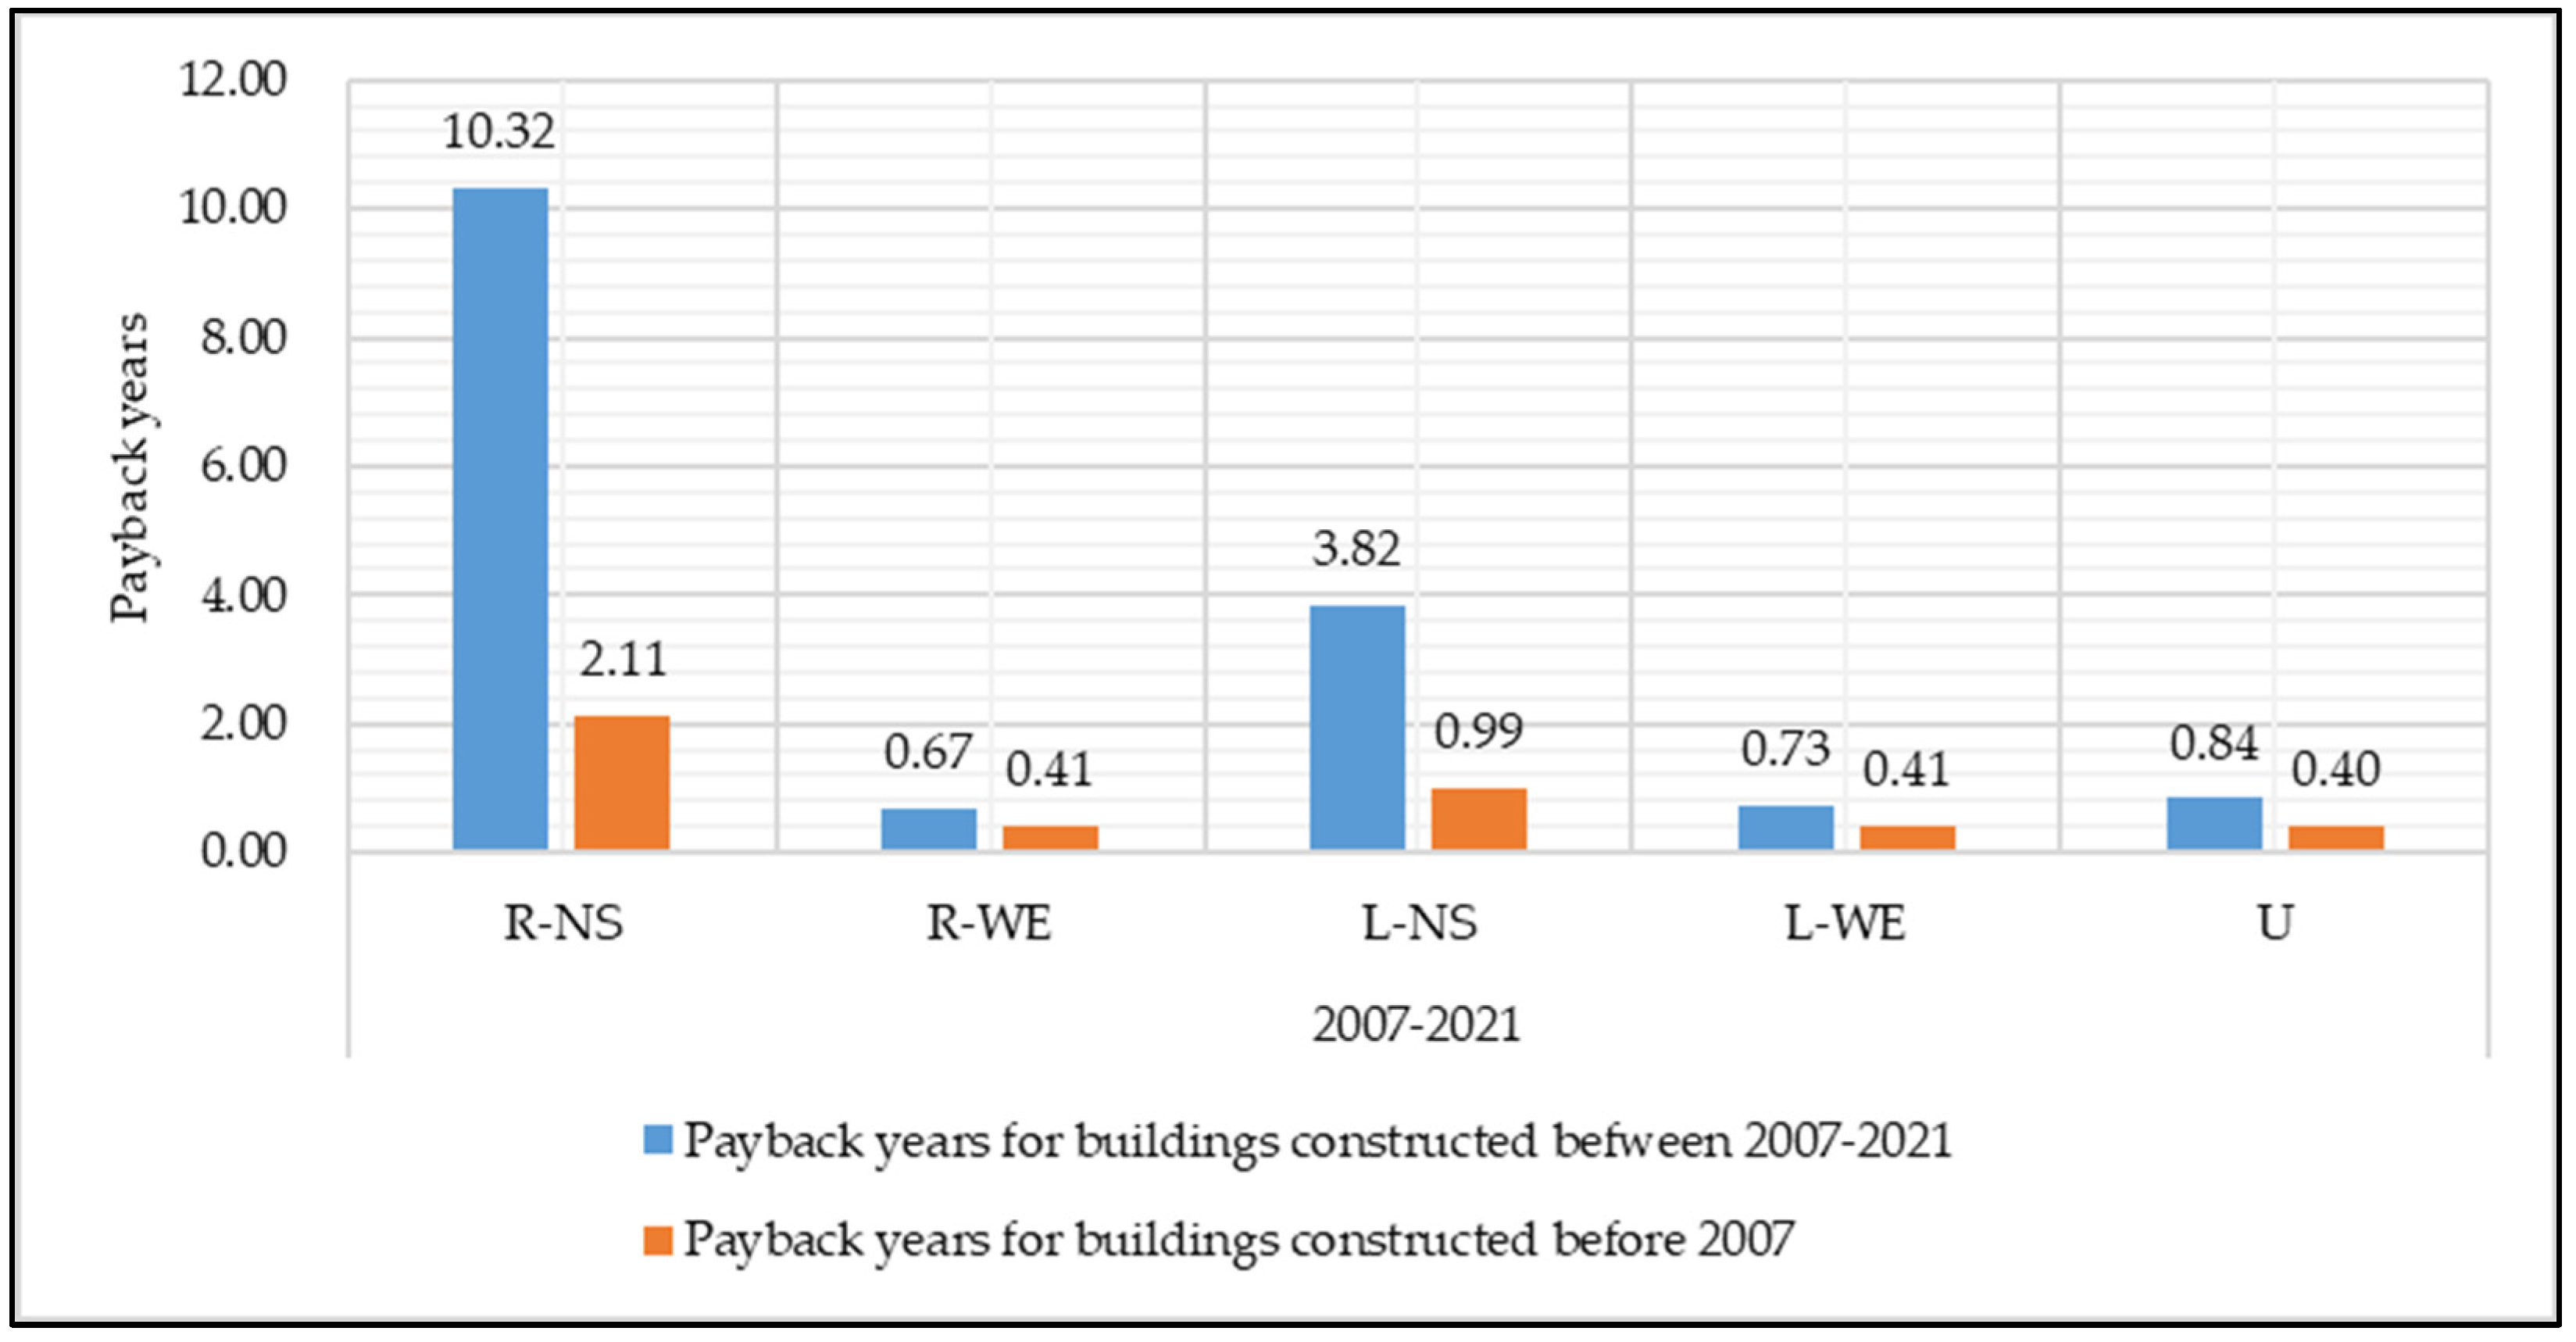
4.1. Carbon Emission Payback Years for the Whole Retrofitting Process

Figure 10 illustrates the calculated carbon emission payback periods for the retrofit of various typical models. Among the models constructed before 2007, the R-NS model had the longest carbon emission payback period at 2.11 years, while the payback periods for other typical models were less than one year. The U-shaped building had the shortest payback period at 0.40 years.
For high-rise office buildings constructed between 2007 and 2021, the R-WE typical model exhibited the shortest carbon emission payback period for retrofit at 0.67 years, whereas the R-NS typical model has the longest payback period at 10.32 years. This significant difference stemmed from the operational phase, where the carbon emission reduction achieved by retrofitting the R-NS model was far less than that achieved by retrofitting the R-WE model.
Overall, for high-rise office buildings constructed before 2007, retrofitting is generally beneficial in terms of carbon reduction as long as the building’s remaining lifespan exceeds 2.11 years. For those constructed between 2007 and 2021, retrofitting will result in carbon emission reductions if the remaining lifespan is longer than 10.32 years.

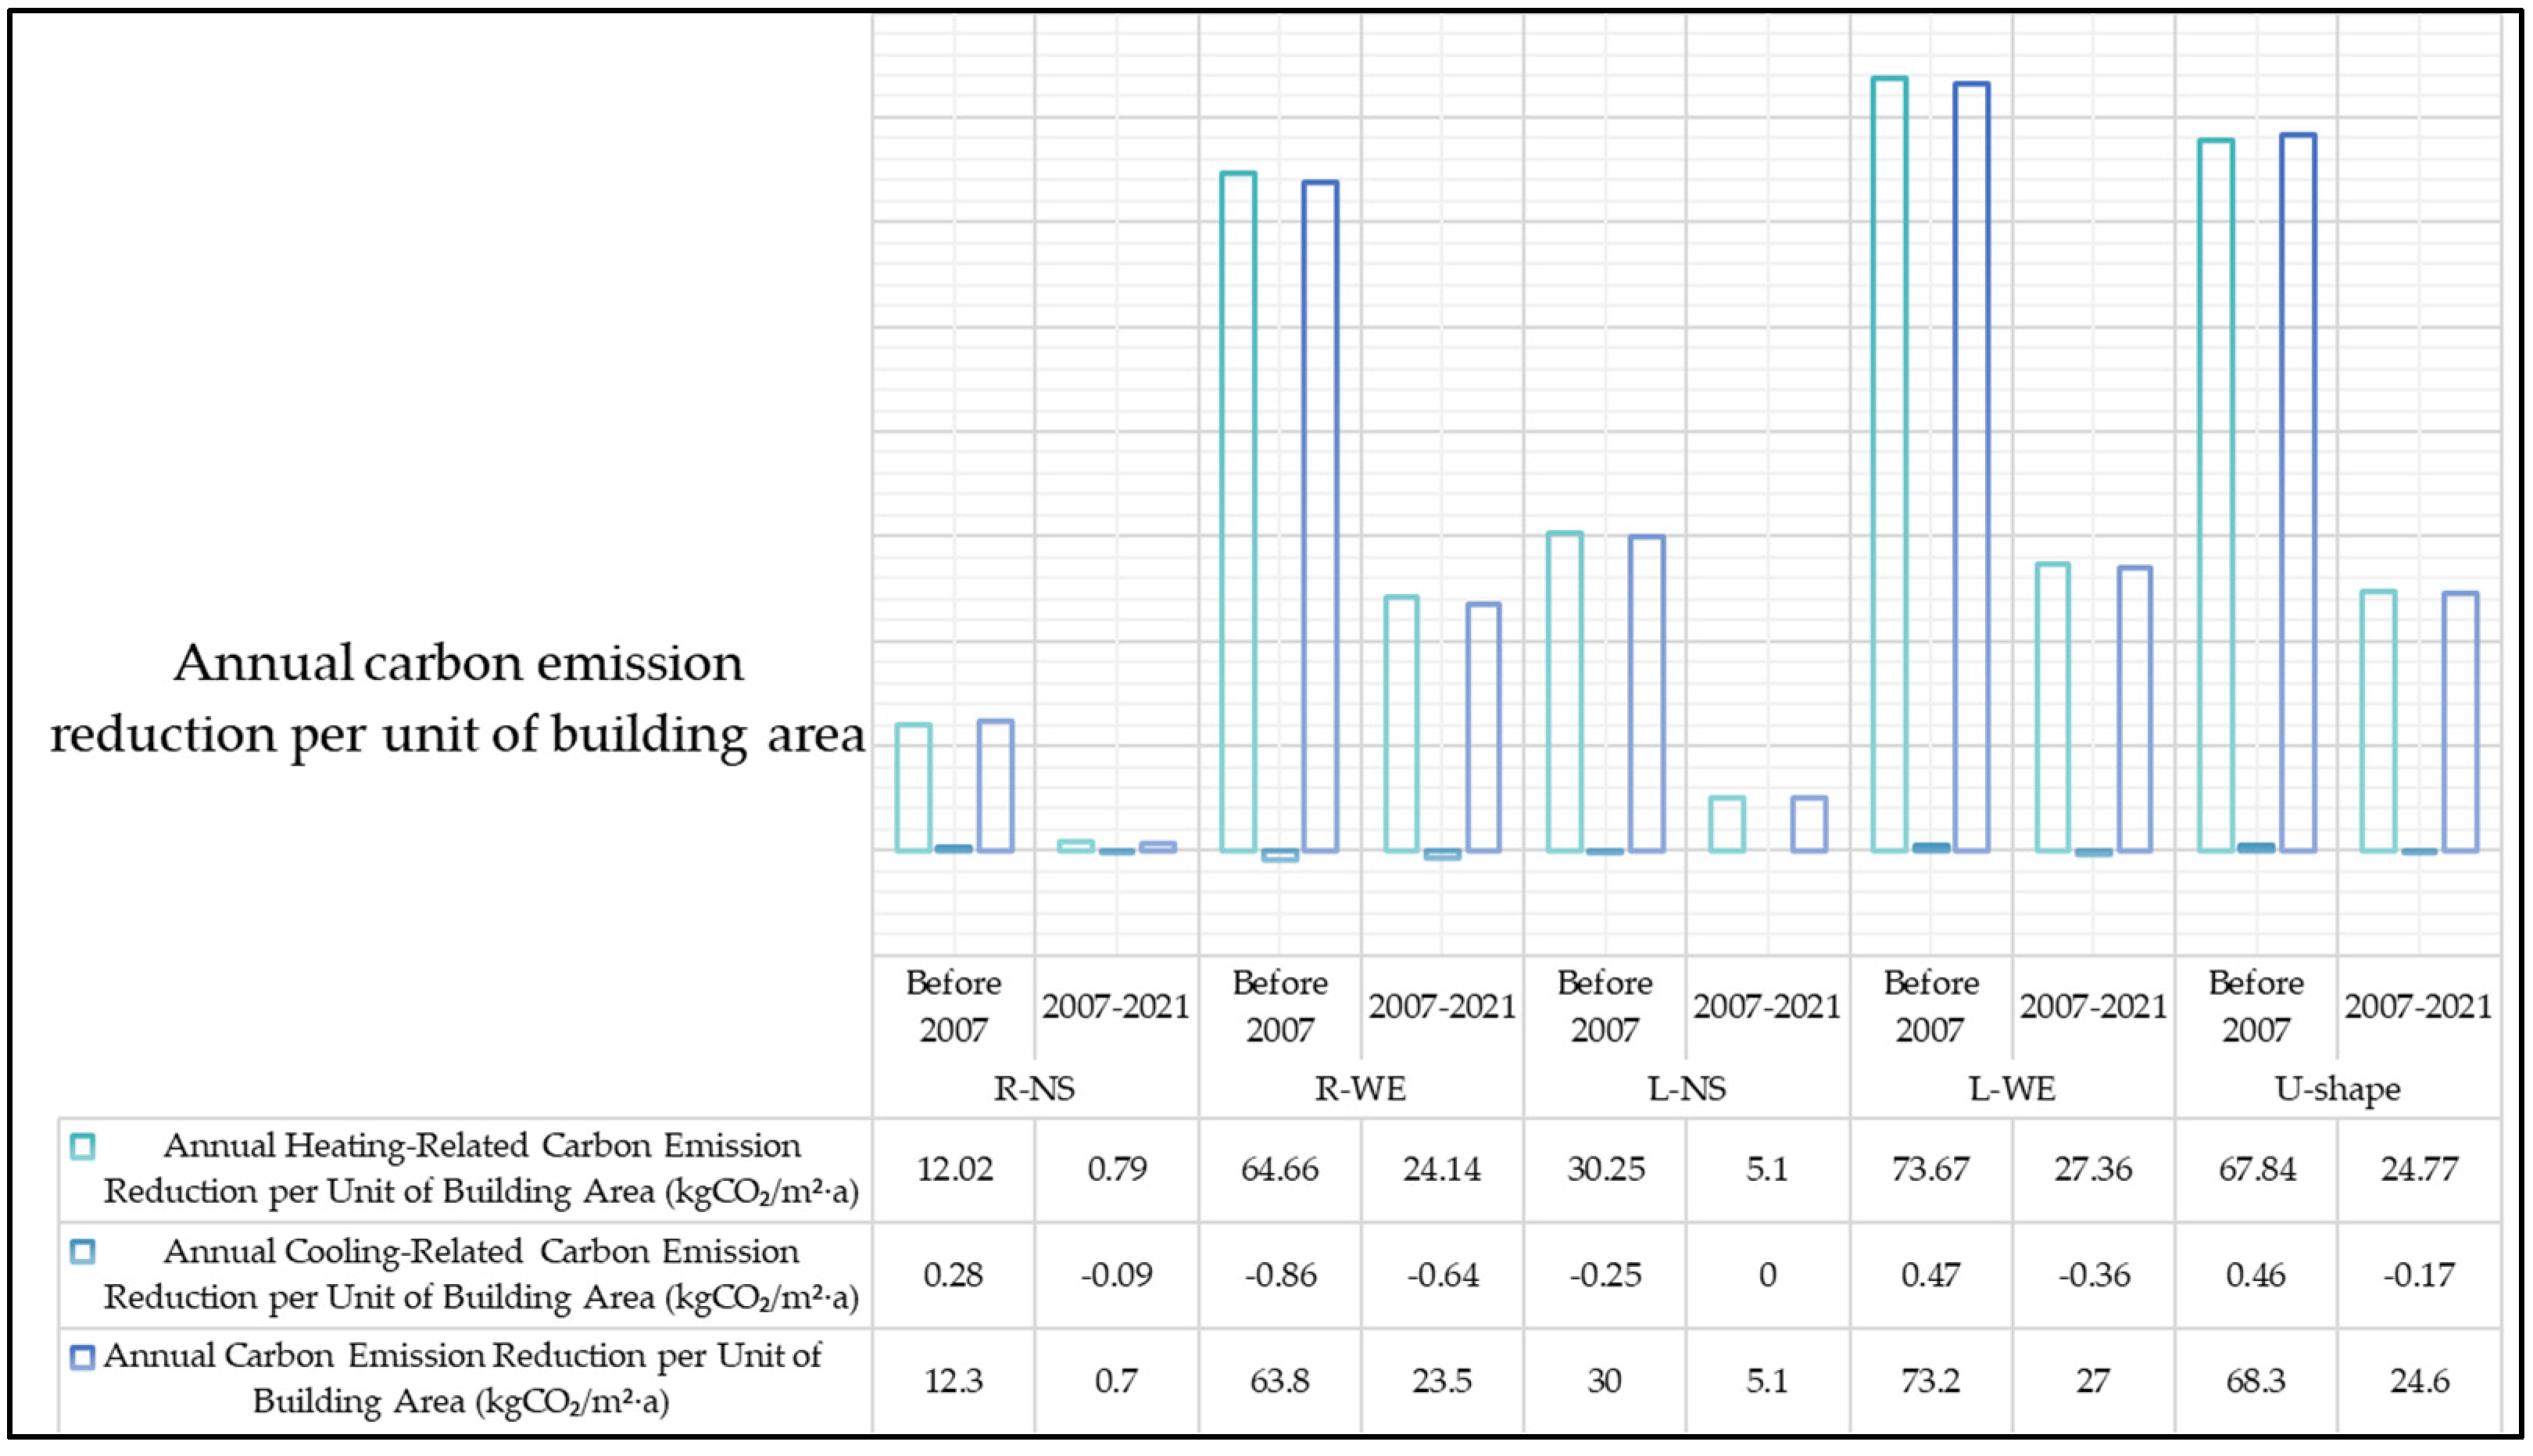
4.2. Overall Carbon Reduction Benefits Resulting from Retrofitting

Merely relying on the carbon emission payback period is insufficient to determine the carbon emission impact of retrofitting various typical models. A further analysis is necessary by integrating the carbon emission reduction benefits throughout the entire life cycle, from the initiation of retrofitting to the demolition of the building. Assuming that the retrofitting commences in 2024, and considering a design service life of 50 years, the remaining lifespan of buildings constructed before 2007 ranges from 1 to 32 years, while that of high-rise office buildings constructed between 2007 and 2021 is 33 to 47 years. Calculating the overall carbon reduction rate from a life-cycle perspective, the results are presented in Table 10 and Table 11.
For buildings constructed between 2007 and 2021, the R-WE model demonstrates the highest potential for carbon emission reduction, with a minimum reduction rate of 0.35 and a maximum of 0.50. The L-WE and U-shaped buildings exhibit similar minimum and maximum reduction rates, ranging approximately from 0.32 to 0.46. In contrast, the L-NS model’s reduction rates lie between 0.17 and 0.24. The R-NS model has the lowest reduction rates, ranging from 0.06 to 0.09.
For high-rise office buildings constructed before 2007, the carbon reduction rates of various typical models were relatively similar. The minimum carbon reduction rate was 0.01, while the maximum was 0.48. The R-WE model exhibited the highest potential for carbon reduction, followed by the L-WE model and U-shaped buildings. The maximum carbon reduction rates of the R-NS and L-NS models were very close, at 0.41 and 0.42, respectively.
It can be observed that retrofitting high-rise office buildings constructed between 2007 and 2021 offers higher potential for carbon reduction, with a maximum reduction rate of up to 0.50 and a minimum of 0.06. In contrast, the maximum carbon reduction rate for high-rise office buildings constructed before 2007 was approximately 0.48, with a minimum of only 0.01.
In summary, it can be concluded that retrofitting high-rise office buildings constructed between 2007 and 2021 holds greater potential for carbon reduction. For high-rise office buildings constructed before 2007, the carbon reduction rate of retrofitting depends on their remaining lifespan: the longer the lifespan, the higher the potential for carbon reduction, and vice versa. In practical engineering applications, it is advisable to monitor the structural lifespan of buildings in advance and set carbon reduction targets. Subsequently, buildings can be screened based on these targets to better harness the carbon emission reduction benefits of retrofitting.

4.3. Integration with Existing Research and Policy Implications for Carbon Reduction in High-Rise Office Buildings

The findings of this study contribute to the growing body of literature that emphasizes the importance of a life-cycle approach in reducing carbon emissions from buildings. While many studies focus primarily on the operational phase of buildings, this research extends the analysis to include the embodied and demolition phases, thereby addressing a gap identified in prior studies. The results align with existing research on the impact of building envelopes, window-to-wall ratios, and orientation on energy consumption and carbon reduction, as discussed in works by Chernousov et al. [13] and Zhang et al. [18]. However, this study uniquely highlights the significance of building orientation and shape on carbon reduction across all life-cycle stages, providing insights that are particularly relevant to high-rise office buildings in China’s hot-summer/cold-winter climate zone. Moreover, while international research, particularly in developed economies, has focused on advanced materials and novel technologies for retrofitting, this study demonstrates the critical role of retrofitting strategies tailored to local climate conditions and construction practices, contributing to the global discourse on sustainable retrofitting practices.
The findings of this study have significant practical and policy implications for advancing China’s carbon neutrality goals and guiding urban planning strategies. By demonstrating that retrofitting high-rise office buildings, particularly those constructed before 2007, can lead to substantial carbon reductions, this research supports the development of policies that incentivize the retrofitting of older buildings. Specifically, pre-2007 buildings exhibit a shorter carbon payback period and greater heating-related carbon reduction potential, making them ideal candidates for government subsidies or financial incentives. Additionally, the study’s findings on the influence of building orientation and shape suggest that east–west-oriented buildings and complex-shaped buildings should not be overlooked in urban retrofitting plans. Policymakers could prioritize the retrofitting of these buildings in cities within China’s hot-summer/cold-winter climate zones, like Hangzhou, to maximize carbon reduction outcomes. Furthermore, the results can inform the revision of energy-efficiency standards, such as the DB33/1036-2021 Design Standard, by incorporating stricter regulations on insulation materials and window-to-wall ratios to further reduce carbon emissions in both retrofitted and newly constructed buildings.

5. Conclusions

This paper focuses on studying the carbon reduction benefits of retrofitting existing high-rise office buildings. Hangzhou’s Gongshu District, Zhejiang Province, was selected as the research area, where data from nearly 100 high-rise office buildings were collected. Five typical models were extracted through the method of central tendency. Based on the construction years of the surveyed samples, retrofitting strategies were proposed. The carbon emission benefits throughout the retrofitting process were calculated and analyzed using the carbon emission factor method, leading to the following key conclusions:
(1) The shape and orientation of buildings significantly impact the carbon reduction benefits of retrofitting. East–west-oriented buildings demonstrated greater operational phase carbon reductions, with reductions for east–west-oriented buildings constructed before 2007 reaching up to 1227.81 tons of CO2 annually, whereas north–south-oriented buildings achieved reductions of up to 273.99 tons of CO2 annually.
(2) During the embodied phase and the demolition phase, the retrofitting carbon emissions of the same model constructed in the same era were identical, primarily due to the uniform material inputs. For buildings constructed before 2007, the emissions during the retrofit process averaged between 23.9 kgCO2/m2 for rectangular buildings and 27.7 kgCO2/m2 for L-shaped buildings. For buildings constructed between 2007 and 2021, rectangular models had the lowest emissions, averaging 14 kgCO2/m2.
(3) In the embodied and demolition phases, the retrofitting carbon emissions of the same model constructed in different eras varied. This was mainly because the materials used in the envelope structures of buildings from different eras differed, leading to different material consumption for achieving the same retrofitting goals. Buildings built before 2007 required more insulation materials, leading to higher embodied carbon emissions during retrofit (averaging 27.7 kgCO2/m2 for L-shaped models). In contrast, post-2007 buildings exhibited lower embodied emissions due to improved insulation technologies.
(4) It was evident that high-rise office buildings constructed between 2007 and 2021 had higher carbon reduction potential from retrofitting, with reduction rates ranging from 0.06 to 0.50, particularly for east–west-oriented buildings. In contrast, buildings constructed before 2007 showed lower carbon reduction rates, ranging from 0.01 to 0.48. This difference was primarily due to the shorter remaining lifespans of pre-2007 buildings, which diminished their overall carbon reduction benefits despite their greater reductions during the operational phase.
(5) For high-rise office buildings constructed in the same era, the overall carbon reduction rate of retrofitting complex-shaped buildings does not necessarily lag behind that of rectangular or L-shaped buildings. In terms of carbon reduction per unit area, they are on par. Therefore, in practical engineering, complex-shaped office buildings should not be overlooked for retrofitting solely based on their shapes.
In summary, in actual retrofitting projects, east–west-oriented high-rise office buildings generally exhibit superior carbon reduction benefits compared with north–south-oriented ones. Additionally, the remaining lifespan of a building significantly influences its post-retrofitting carbon reduction benefits; longer lifespans lead to greater benefits, and vice versa. In practical engineering, structural reinforcement measures can be employed before retrofitting to extend a building’s structural lifespan, thereby enhancing its carbon reduction benefits.

6. Limitations and Future Work

This study acknowledges several limitations, primarily due to its focus on a single district in Hangzhou and the limited sample size, which may affect the generalizability of the findings to other regions or building types. Additionally, the assumptions made in carbon simulations, such as material inputs and building life cycles, and the use of proportional estimation for carbon emissions, may impact result accuracy. Future research should expand the geographic scope, incorporate more representative samples, and refine simulation models with real-time data and detailed engineering inputs to enhance precision in carbon reduction estimates.

Author Contributions

Conceptualization, Y.C., Z.W. and Z.P.; Data curation, Y.C.; Formal analysis, Y.C.; Funding acquisition, Z.W.; Investigation, Y.C. and Z.W.; Methodology, Y.C.; Project administration, Y.C.; Resources, Z.W.; Software, Y.C.; Supervision, Z.W. and Z.P.; Validation, Y.C.; Visualization, Y.C.; Writing—original draft, Y.C.; Writing—review and editing, Z.W. All authors have read and agreed to the published version of the manuscript.

Funding

Zhenyu Wang was supported by a City University of Hong Kong Postgraduate Studentship.

Institutional Review Board Statement

Not applicable.

Informed Consent Statement

Not applicable.

Data Availability Statement

The data presented in this study are available on request from the corresponding author. The data are not publicly available due to privacy protection.

Acknowledgments

We would like to give special thanks for the support of Zhejiang University.

Conflicts of Interest

The authors declare no conflicts of interest.

References

  1. Basiago, A.D. Economic, social, and environmental sustainability in development theory and urban planning practice. Environmentalist 1998, 19, 145–161. [Google Scholar] [CrossRef]
  2. China Association of Building Energy Efficiency. 2022 Research Report of China Building Energy Consumption and Carbon Emissions; China Association of Building Energy Efficiency: Chongqing, China, 2023. [Google Scholar]
  3. Xu, G.; Schwarz, P.; Yang, H. Adjusting energy consumption structure to achieve China’s CO2 emissions peak. Renew. Sustain. Energy Rev. 2020, 122, 109737. [Google Scholar] [CrossRef]
  4. Huang, R.; Zhang, S.; Wang, P. Key areas and pathways for carbon emissions reduction in Beijing for the “Dual Carbon” targets. Energy Policy 2022, 164, 112873. [Google Scholar] [CrossRef]
  5. ISO 14044; Environmental Management-Life Cycle Assessment-Requirements and Guidelines. ISO: Geneva, Switzerland, 2006.
  6. Means, P.; Guggemos, A. Framework for life cycle assessment (LCA) based environmental decision making during the conceptual design phase for commercial buildings. Procedia Eng. 2015, 118, 802–812. [Google Scholar] [CrossRef]
  7. RICS (Royal Institution of Chartered Surveyors). Whole Life Carbon Assessment for the Built Environment; RICS: London, UK, 2017. [Google Scholar]
  8. Robati, M.; Oldfield, P.; Nezhad, A.A.; Carmichael, D.G.; Kuru, A. Carbon value engineering: A framework for integrating embodied carbon and cost reduction strategies in building design. Build. Environ. 2021, 192, 107620. [Google Scholar] [CrossRef]
  9. Schmidt, M.; Crawford, R.H.; Warren-Myers, G. Quantifying Australia’s life cycle greenhouse gas emissions for new homes. Energy Build. 2020, 224, 110287. [Google Scholar] [CrossRef]
  10. Hu, S.; Jiang, Y.; Yan, D. China Building Energy Use and Carbon Emission Yearbook 2021: A Roadmap to Carbon Neutrality by 2060; Springer Nature: Berlin/Heidelberg, Germany, 2022. [Google Scholar]
  11. Gu, J.L. Analysis of Energy Consumption Levels in Large-scale Public Buildings with Multiple Functions. Refrigeration 2017, 36, 60–65. [Google Scholar]
  12. Chan, K.T.; Chow, W.K. Energy impact of commercial-building envelopes in the sub-tropical climate. Appl. Energy 1998, 60, 21–39. [Google Scholar] [CrossRef]
  13. Chernousov, A.A.; Chan, B.Y.B. Numerical simulation of thermal mass enhanced envelopes for office buildings in subtropical climate zones. Energy Build. 2016, 118, 214–225. [Google Scholar] [CrossRef]
  14. Yu, J.; Tian, L.; Xu, X.; Wang, J. Evaluation on energy and thermal performance for office building envelope in different climate zones of China. Energy Build. 2015, 86, 626–639. [Google Scholar] [CrossRef]
  15. Chowdhury, A.A.; Rasul, M.G.; Khan, M.M. Parametric analysis of thermal comfort and energy efficiency in building in subtropical climate. In Thermofluid Modeling for Energy Efficiency Applications; Academic Press: Cambridge, MA, USA, 2016; pp. 149–168. [Google Scholar]
  16. Troup, L.; Phillips, R.; Eckelman, M.J.; Fannon, D. Effect of window-to-wall ratio on measured energy consumption in US office buildings. Energy Build. 2019, 203, 109434. [Google Scholar] [CrossRef]
  17. Rana, J.; Hasan, R.; Sobuz, H.R.; Tam, V.W. Impact assessment of window to wall ratio on energy consumption of an office building of subtropical monsoon climatic country Bangladesh. Int. J. Constr. Manag. 2022, 22, 2528–2553. [Google Scholar] [CrossRef]
  18. Zhang, X.; Li, P. Research Progress on the Influence of Built Environment on Carbon Emissions from Urban Construction Land. Sci. Technol. Rev. 2021, 39, 65–74. [Google Scholar]
  19. Kang, Y. Review and Prospect of Key Technologies for Building Energy Conservation. China Energy 2003, 25, 18–25. [Google Scholar]
  20. Xu, Z.; Liu, S.; Hu, G.; Spanos, C.J. Optimal coordination of air conditioning system and personal fans for building energy efficiency improvement. Energy Build. 2017, 141, 308–320. [Google Scholar] [CrossRef]
  21. Wan, S.; Ding, G.; Runeson, G.; Liu, Y. Sustainable buildings’ energy-efficient retrofitting: A study of large office buildings in Beijing. Sustainability 2022, 14, 1021. [Google Scholar] [CrossRef]
  22. Liu, G.; Li, X.; Tan, Y.; Zhang, G. Building green retrofit in China: Policies, barriers and recommendations. Energy Policy 2020, 139, 111356. [Google Scholar] [CrossRef]
  23. Zhuang, C.; Gao, Y.; Zhao, Y.; Levinson, R.; Heiselberg, P.; Wang, Z.; Guo, R. Potential benefits and optimization of cool-coated office buildings: A case study in Chongqing, China. Energy 2021, 226, 120373. [Google Scholar] [CrossRef]
  24. Song, X.; Ye, C.; Li, H.; Wang, X.; Ma, W. Field study on energy economic assessment of office buildings envelope retrofitting in southern China. Sustain. Cities Soc. 2017, 28, 154–161. [Google Scholar] [CrossRef]
  25. Liu, Q.; Ren, J. Research on technology clusters and the energy efficiency of energy-saving retrofits of existing office buildings in different climatic regions. Energy Sustain. Soc. 2018, 8, 1–11. [Google Scholar] [CrossRef]
  26. Zhou, Z.; Zhang, S.; Wang, C.; Zuo, J.; He, Q.; Rameezdeen, R. Achieving energy efficient buildings via retrofitting of existing buildings: A case study. J. Clean. Prod. 2016, 112, 3605–3615. [Google Scholar] [CrossRef]
  27. Liu, M.; Liu, C.; Xie, H.; Zhao, Z.; Zhu, C.; Lu, Y.; Bu, C. Analysis of the Impact of Photovoltaic Curtain Walls Replacing Glass Curtain Walls on the Whole Life Cycle Carbon Emission of Public Buildings Based on BIM Modeling Study. Energies 2023, 16, 7030. [Google Scholar] [CrossRef]
  28. Zheng, X.; Liang, Y.; Yang, H.; Zeng, Y.; Cui, H. Collaborative Optimized Design of Glazing Parameters and PCM Utilization for Energy-Efficient Glass Curtain Wall Buildings. Buildings 2024, 14, 256. [Google Scholar] [CrossRef]
  29. Guo, R.; Min, Y.; Gao, Y.; Chen, X.; Shi, H.; Liu, C.; Zhuang, C. Unlocking energy and economic benefits of integrated green envelopes in office building retrofits. Build. Environ. 2024, 261, 111747. [Google Scholar] [CrossRef]
  30. Peng, C.; Wang, L.; Zhang, X. DeST-based dynamic simulation and energy efficiency retrofit analysis of commercial buildings in the hot summer/cold winter zone of China: A case in Nanjing. Energy Build. 2014, 78, 123–131. [Google Scholar] [CrossRef]
  31. Wang, S.-Y.; Lee, K.-T.; Kim, J.-H. Green retrofitting simulation for sustainable commercial buildings in China using a proposed multi-agent evolutionary game. Sustainability 2022, 14, 7671. [Google Scholar] [CrossRef]
  32. Nussbaumer, T.; Wakili, K.G.; Tanner, C. Experimental and numerical investigation of the thermal performance of a protected vacuum-insulation system applied to a concrete wall. Appl. Energy 2006, 83, 841–855. [Google Scholar] [CrossRef]
  33. Nematchoua, M.K.; Noelson, J.C.V.; Saadi, I.; Kenfack, H.; Andrianaharinjaka, A.-Z.F.; Ngoumdoum, D.F.; Sela, J.B.; Reiter, S. Application of phase change materials, thermal insulation, and external shading for thermal comfort improvement and cooling energy demand reduction in an office building under different coastal tropical climates. Sol. Energy 2020, 207, 458–470. [Google Scholar] [CrossRef]
  34. Dalapati, G.K.; Kushwaha, A.K.; Sharma, M.; Suresh, V.; Shannigrahi, S.; Zhuk, S.; Masudy-Panah, S. Transparent heat regulating (THR) materials and coatings for energy saving window applications: Impact of materials design, micro-structural, and interface quality on the THR performance. Prog. Mater. Sci. 2018, 95, 42–131. [Google Scholar] [CrossRef]
  35. Hong, Y.; Ezeh, C.I.; Deng, W.; Hong, S.H.; Ma, Y.; Tang, Y.; Jin, Y. Coordinated energy-environmental-economic optimisation of building retrofits for optimal energy performance on a macro-scale: A life-cycle cost-based evaluation. Energy Convers. Manag. 2021, 243, 114327. [Google Scholar] [CrossRef]
  36. Peng, Z.; Yu, Y.; Guan, R. Demand-Oriented Review of a Dynamic Energy-Loss Monitoring System for Primary School Buildings through Micro-Environmental Data Monitoring and Occupant Behavior Analysis. Buildings 2023, 13, 2694. [Google Scholar] [CrossRef]
  37. Ma, Y.; Deng, W.; Xie, J.; Heath, T.; Xiang, Y.; Hong, Y. Generating prototypical residential building geometry models using a new hybrid approach. Build. Simul. 2022, 15, 17–28. [Google Scholar] [CrossRef]
  38. Calculator.Net: Free Online Calculators—Math, Fitness, Finance, Science. Available online: https://www.calculator.net/ (accessed on 7 July 2024.).
  39. McCluskey, A.; Lalkhen, A.G. Statistics II: Central tendency and spread of data. Contin. Educ. Anaesth. Crit. Care Pain 2007, 7, 127–130. [Google Scholar] [CrossRef]
  40. Lin, B. Case study and evaluation of energy-saving renovation of existing public buildings. Zhejiang Archit. 2014, 31, 59–61. [Google Scholar]
  41. Shen, T.; Min, G.; Jian, G. Preliminary Exploration of Energy Conservation Renovation of Existing Public Buildings. Huazhong Archit. 2008, 26, 63–66. [Google Scholar]
  42. DB33/1036-2007; Design Standard for Energy Efficiency of Public Buildings-2007. Zhejiang Provincial Standards Authority: Hangzhou, China, 2007.
  43. Peng, Z.; Deng, W.; Hong, Y. Materials consumption, indoor thermal comfort and associated energy flows of urban residential buildings: Case studies from the cold climate zone of China. Int. J. Build. Pathol. Adapt. 2019, 37, 579–596. [Google Scholar] [CrossRef]
  44. DB33/1036-2021; Design Standard for Energy Efficiency of Public Buildings-2021. Zhejiang Provincial Standards Authority: Hangzhou, China, 2021.
  45. Intergovernmental Panel on Climate Change. 2006 IPCC Guidelines for National Greenhouse Gas Inventories; Institute for Global Environmental Strategies: Hayama, Japan, 2006. [Google Scholar]
  46. Levermore, G.J. A review of the IPCC assessment report four, part 1: The IPCC process and greenhouse gas emission trends from buildings worldwide. Build. Serv. Eng. Res. Technol. 2008, 29, 349–361. [Google Scholar] [CrossRef]
  47. GB/T 51366-2019; Standard for Calculation of Carbon Emissions from Buildings. China Construction Industry Press: Beijing, China, 2019.
Figure 1. Sample size of the field investigation [38].
Sustainability 16 08506 g001
Figure 2. Distribution of surveyed data for rectangular buildings.
Sustainability 16 08506 g002
Figure 3. Data analysis of length, width, and height of rectangular buildings.
Sustainability 16 08506 g003
Figure 4. Normality test for the transformed length of R-NS buildings (left) and histogram of the transformed length showing normal distribution (right).
Sustainability 16 08506 g004
Figure 5. Temperature settings for air-conditioning units in winter and summer (left) and occupancy rate settings (right).
Sustainability 16 08506 g005
Figure 6. Carbon emissions during the embodied phase of typical models.
Sustainability 16 08506 g006
Figure 7. Comparison of carbon emissions during the operational phase before and after retrofitting.
Sustainability 16 08506 g007
Figure 8. Comparison of carbon emission reduction during the operational phase before and after retrofitting.
Sustainability 16 08506 g008
Figure 9. Comparison of carbon emissions during the demolition phase.
Sustainability 16 08506 g009
Figure 10. Payback years for the whole retrofitting process.
Sustainability 16 08506 g010
Table 1. Typical model data for R-NS high-rise office buildings.
R-NSSustainability 16 08506 i001
ParametersTypical Values
Length of the typical model63
Width of the typical model24
Height of the typical model37
Building shape coefficient0.20
Window-to-wall ratiosSouthern0.43
Western0.21
Eastern0.15
Northern0.35
Table 2. Results of typical model extraction.
Typical Models
R-WEL-NSL-WEU-Shape
Height (m)37313142
Length (m)63
Width (m)23
Building shape coefficient0.180.160.160.13
Window-to-wall ratiosNorthern0.240.240.320.46
Southern0.250.350.340.55
Western0.240.20.340.39
Eastern0.320.210.260.46
Table 3. Classification of typical models by era.
Typical ModelsYears of Construction
R-NSBefore 2007
2007–2021
R-WEBefore 2007
2007–2021
L-NSBefore 2007
2007–2021
L-WEBefore 2007
2007–2021
U-shapeBefore 2007
2007–2021
Table 4. Envelope construction practices and thermal transmittance values of high-rise office buildings constructed prior to 2007.
Building FabricsConstruction PracticesThermal Transmittance Values W/(m2·K)
Roof
(from top to bottom)
Waterproof layer (4 mm) → Cement mortar (20 mm) → Expanded perlite cement (120 mm) → Reinforced concrete (120 mm) → Lime mortar (20 mm)1.33
External walls
(from outside to inside)
Plastering layer (3 mm) → Cement mortar (20 mm) → Clay hollow brick masonry (200 mm) → Lime mortar (20 mm)2.06
Floor between air-conditioned and un-air-conditioned spacesCement mortar (20 mm) → Reinforced concrete (120 mm) → Lime mortar (20 mm)1.4
External windowsSingle glazed wooden frame external window4.70
External doorsFrameless—single glazed door6.50
Table 5. Envelope construction practices and thermal transmittance values of high-rise office buildings constructed between 2007 and 2021.
Building FabricsConstruction PracticesThermal Transmittance Values
W/(m2·K)
Roof
(from top to bottom)
Waterproof layer (4 mm) → Cement mortar (20 mm) → Extruded polystyrene board (50 mm) → Reinforced concrete (120 mm) → Lime mortar (20 mm)0.49
External walls
(from outside to inside)
Plastering layer (3 mm) → Cement mortar (20 mm) → Rockwool board (50 mm) → Autoclaved aerated concrete blocks (200 mm) → Lime mortar (20 mm)0.64
Floor between air-conditioned and un-air-conditioned spacesCement mortar (20 mm) → Extruded polystyrene board (20 mm) → Reinforced concrete (120 mm) → Lime mortar (20 mm)0.70
External windowsLow-E double glazed insulating window (broken bridge aluminum alloy frame, 12 mm air-filled)2.1
External doorsDouble glazed insulating door (broken bridge aluminum alloy, 12 mm air-filling2.8
Table 6. Envelope construction practices and Thermal transmittance values of high-rise office buildings since 2021.
Building FabricsConstruction PracticesThermal Transmittance Values W/(m2·K)
Roof
(from top to bottom)
Waterproof layer (4 mm) → Cement mortar (20 mm) → Extruded polystyrene board (120 mm) → Reinforced concrete (120 mm) → Lime mortar (20 mm)0.20
External walls
(from outside to inside)
Plastering layer (3 mm) → Cement mortar (20 mm) → Rockwool board (60–80 mm) → Clay hollow brick masonry (200 mm) → Lime mortar (20 mm)0.50
Floor between air-conditioned and un-air-conditioned spacesCement mortar (20 mm) → Extruded polystyrene board (40 mm) → Reinforced concrete (120 mm) → Lime mortar (20 mm)0.50
External windowsLow-E double glazed insulating window with broken bridge aluminum alloy frame and 12 mm argon gas filling1.6
External doorsDouble glazed insulating external door with broken bridge aluminum alloy arame and 12 mm air filling2.0
Table 7. Methods for calculating carbon emissions across different phases.
Carbon emissions resulting from the production of building materials in the embodied phase E S C = M i × C F i M—main consumption of building materials (in tons or cubic meters); i—main material type involved in a particular retrofitting measure; CF—carbon emission factor of the material.
Carbon emissions resulting from the transportation of building materials in the embodied phase E y s = P × E S C For research projects, P can be set at 2% as recommended by China’s “Standard for Calculation of Carbon Emissions from Buildings” (SCCEB-GB/T51366-2019) [47].
Carbon emissions resulting from construction and installation in the embodied phase E s g = P × E S C For research projects, P can be set at 5% as recommended by the SCCEB-GB/T51366-2019 [47].
Carbon emissions resulting from the removal of materials installed due to retrofitting strategies in the demolition phase E d = E d c + E d t Edc refers to the carbon emissions from construction activities during the demolition phase, while Edt represents the carbon emissions from the transportation of waste materials during the demolition phase. For this research project, based on the recommendations of the SCCEB-GB/T51366-2019 [47], Edc can be calculated as 10% of the carbon emissions from construction and installation in the embodied phase, and Edt can be calculated as 80% of the carbon emissions from material transportation in the embodied phase.
Table 8. Emission factors for the production of certain building materials [47].
MaterialsEmission FactorUnit
Cement735kgCO2/t
C30 Concrete295kgCO2/m3
Concrete Block336
Cast Pig Iron2280kgCO2/t
Common Carbon Steel2050
Cement Mortar792
Electrolytic Aluminum20,300
Thermal Break Aluminum Window200kgCO2/m2
Polyethylene Pipe3600kgCO2/t
Rockwool Board1980
Glass1130
Paint3600
Table 9. Indoor design parameters for carbon emission simulation of high-rise office buildings.
Designed Indoor Temperature in Summer26 °C
Designed indoor temperature in winter20 °C
Designed relative humidity in summer60%
Designed relative humidity in winter40%
Fresh air volume30 m3/person·h
Occupants’ density8 m2/person
Lighting power density (LPD)9 W/m2
Equipment power density15 W/m2
Table 10. Carbon reduction rates throughout the retrofitting process for typical models constructed between 2007 and 2021.
Typical ModelsCarbon Emission Reductions during the Operational Phase after Retrofitting (kgCO2/a)Remaining Lifespan (Year)Carbon Emissions during Different PhasesCarbon Reduction Rates
MinMaxDuring the Operational Phase before Retrofitting (kgCO2/a)During the Embodied Phase of the Retrofitting
(kgCO2)
During the Demolition Phase
(kgCO2)
MinMax
R-NS11,1853347111,005229,620.720,0640.060.09
R-WE373,5663347703,1200.350.50
L-NS63,8013347248,413225,626.518,1310.170.24
L-WE334,5363347684,1070.320.46
U-shape1,279,35733472,642,718990,587.379,6010.320.45
Table 11. Carbon reduction rates throughout the retrofitting process for typical models constructed before 2007.
Typical ModelsCarbon Emission Reductions during the Operational Phase after Retrofitting (kgCO2/a)Remaining Lifespan
(Year)
Carbon Emissions during Different PhasesCarbon Reduction Rates
MinMaxDuring the Operational Phase before Retrofitting
(kgCO2/a)
During the Embodied Phase of the Retrofitting
(kgCO2)
During the Demolition Phase
(kgCO2)
MinMax
R-NS195,587132295,407381,601.530,6650.010.41
R-WE1,017,2271321,346,7800.020.48
L-NS373,321132557,932343,716.727,6200.010.42
L-WE909,4851321,270,6280.010.46
U-shape3,552,9131324,916,2741,313,817105,5740.010.46
Disclaimer/Publisher’s Note: The statements, opinions and data contained in all publications are solely those of the individual author(s) and contributor(s) and not of MDPI and/or the editor(s). MDPI and/or the editor(s) disclaim responsibility for any injury to people or property resulting from any ideas, methods, instructions or products referred to in the content.

