Article

Numerical Simulation Study of Gas–Liquid–Solid Triphase Coupling in Fully Mechanized Excavation Faces with Variation in Dust Source Points

College of Safety Science and Engineering, Xi’an University of Science and Technology, Xi’an 710054, China
*
Author to whom correspondence should be addressed.
Sustainability 2024, 16(19), 8523; https://doi.org/10.3390/su16198523
Submission received: 4 September 2024 / Revised: 26 September 2024 / Accepted: 27 September 2024 / Published: 30 September 2024

Abstract

:
In view of the current situation where research on the dust diffusion laws of different dust source points is limited and the gap with the actual field situation is too large; this study employs an innovative gas–liquid–solid triphase coupling method to investigate how dust moves and spreads in the fully mechanized excavation face 431305 at the Liangshuijing Mine; focusing on both the dust field and the dust–fog coupled field. The results indicate that using the long-pressure short-suction ventilation method; dust movement in the roadway is primarily influenced by the airflow; which can be classified into vortex; jet; and return flow regions. The analysis reveals that different dust source points affect dust distribution patterns. Dust source 1 generates the highest dust concentration; primarily accumulating on the duct side and return air side of the roadway. By contrast; dust source 2’s dust mainly gathers at the heading and the front of the cutting head. Dust sources 3 and 4 show lower dust concentrations near the top of the roadway. Dust source 5 achieves the most effective dust removal; aided by airflow and a suction fan; showcasing superior dust performance. A comprehensive comparison indicates that dust source 1 has the highest overall dust concentration. Therefore; further simulation of the distribution law of dust generated at dust source 1 under the action of water mist reveals that the dust concentration near the heading face is reduced from 2000 mg/m3 under the action of single air flow to about 1100 mg/m3. At t = 5 s; the spray droplets almost cover the entire tunneling face; leading to a significant decrease in dust concentration within 10–25 m from the tunneling face. Within 40 s; both coal dust and spray droplets are significantly reduced. The field measurement results verify the accuracy of the simulation results and provide certain guidance for promoting the sustainable development of the coal industry.

1. Introduction

With the widespread application of machinery in coal mines and faster tunneling speeds, dust concentration has significantly risen, especially at fully mechanized excavation sites, which are becoming major dust sources [1,2]. The main source of dust in the roadway of a fully mechanized excavation face is the heading face. In this area, both the ventilation volume and the amount of dust raised are relatively large, and the distribution laws of air flow and dust movement are complex. Studies indicate that without dust control measures, dust levels can reach 3000–5000 mg/m3 at these sites [3,4]. Recent studies have used experiments and simulations to explore dust diffusion patterns. Zhou [5] used Fluent software to simulate how different ventilation methods affect dust distribution, concluding that a long-pressure short-suction ventilation method with a blast pipe outlet 5 m from the working face provided the best dust reduction. Hu et al. [6] examined gas–solid two-phase flow near mine drivers, discovering that reverse airflow could bring dust closer to them. Yin et al. [7] combined numerical simulations with spray experiments, suggesting a multi-stage spray strategy to effectively reduce dust. Zhang [8] used Fluent simulations at the Yuhua Mine to discover that with a single pressure-inlet ventilation mode, dust concentration was higher on the intake side than on the return side, with the return airflow flowing as the main path for dust diffusion. Li et al. [5] analyzed airflow and dust concentration changes when cutting at different points with a tunneling machine, using numerical simulations. Yang et al. [9] conducted a coupled numerical simulation of the airflow, coal dust, and spray droplets in a mining face, finding that coal dust and spray droplets mainly accumulated between the tunneling machine and the cutting face before spreading down the roadway. Nie et al. [10], using a mesoscopic method to study dust–spray interactions, developed an experimental system, and determined 7 μm as the optimal droplet size for reducing dust in mining operations. Wang et al. [11] investigated common nozzle types using experiments and simulations, finding that a water pressure of about 8 MPa and a nozzle distance between 700 mm and 1100 mm were the most effective on the prevalent dust particle size (30–120 μm), effectively controlling dust from the nozzle. Bo et al. [12] analyzed a large-scale dust–spray model using LES–VOF and a dust–droplet probability collision algorithm, revealing that as spray pressure increased, the coverage distance of the spray droplets presented a bimodal distribution while dust diffusion distance first increased and then decreased. Hao et al. [13] analyzed dust concentration patterns in the breathing zone of a mining face, identifying that dust sizes mainly ranged from 1 to 40 μm, with settling velocities classified into three regions: rapid, medium, and slow. Gong Xiaoyan et al. [14] carried out a study with an orthogonal experimental design to simulate the dust field under the control of air flow. They analyzed the influence of air flow control parameters on the dust concentration distribution under the dynamic change in dust sources, and determined the air flow control scheme for the optimal dust field distribution. Zhang Yanjiao et al. [15] conducted a simulation study on the airflow field and dust field of the ventilation system and dust removal system of the fully mechanized road header at different dust sources. The results show that the dust diffusion range of the ventilation system on the fully mechanized tunneling face is within 1–2 m from the working face. The airflow characteristics of dust removal holes are optimal for dust removal at a distance of 1 m from the working face.
In summary, domestic scholars have conducted a large number of studies on the law of dust diffusion and migration during coal mine production based on fixed dust sources, and have achieved certain research results, while few studies have been conducted on the law of dust distribution and the law of dust fog coupling under the change in dust source points. Therefore, we proposed that the 431305 integrated excavation face of Liangshuijing Coal Mine was selected as the research object in this paper, and a three-phase coupling model of “gas-liquid-solid” was constructed. Based on the study of gas-solid two-phase flow, the influence of water mist is included to study the diffusion and migration law of dust on the integrated excavation face under the change in dust source points and the diffusion and migration law of dust-fog coupling. It can accurately prevent and control dust and provide guidance for field applications, which has important practical significance for reducing the dust content in the mining operation area, improving the working environment of miners, ensuring the physical and mental safety and health of miners, and further promoting the sustainable development of the coal mining industry.

2. Mathematical Model

The study focuses on three-phase flows involving gas, liquid, and solid. Given that airflow primarily affects dust diffusion, and despite high dust concentration accumulation in the roadway, the overall volume fraction remains under 10%. Therefore, the Eulerian–Lagrangian method is used for the simulations. The turbulence is modeled using the Standard Realizable k ε equation under the Reynolds-averaged Navier–Stokes (RANS) framework [16,17,18,19,20,21,22,23,24], while the discrete phase model (DPM) handles the discrete phases. This approach facilitates the detailed analysis of the motion patterns of dust and droplets by treating them as discrete entities.
k equation [25]:
t ( ρ k ) + x i ( ρ k μ i ) = x j [ ( μ + μ t σ k ) k x j ] + G k + G b ρ ε Y M + S k
ε equation:
t ( ρ ε ) + x i ( ρ ε μ i ) = x j [ ( μ + μ t σ ε ) ε x j ] + C 1 ε ε k ( G k + C 3 ε G b ) C 2 ε ρ ε 2 k + S ε
In the equations, x i and x j represent coordinates in the x , y , and z directions (where i j ), measured in meters. Similarly, u i and u j are the velocities in the x , y , and z directions (where i j ), expressed in m/s. ρ denotes the gas density, in kg/m3, while k stands for turbulent kinetic energy, in m2/s2. Meanwhile, μ indicates the laminar viscosity coefficient, measured in Pa·s, while μ t is the turbulent kinetic energy viscosity coefficient. σ k refers to the turbulent Prandtl number for the k equation, which is 1.0. G k signifies the turbulent kinetic energy generated by the change in laminar velocity, and G b is the turbulent kinetic energy generated by buoyancy. ε is the turbulent dissipation rate in m2/s3. Y M represents the fluctuation produced by turbulent transition diffusion, but since the gas simulated in this study is incompressible, this term is set to 0. Ultimately, S k is the source term of the equation, kg/(m·s3). σ ε represents the turbulent Prandtl number for the ε equation, which is 1.3. Constants C ε 1 , C ε 2 , and C μ within the k ε model are specified as 1.44, 1.92, and 0.09, respectively. S ε is the source term in m2/s4.
The DPM is utilized to compute data interactions between discrete phases or between discrete and continuous phases. Subsequently, a stochastic tracking model is employed to trace the particle trajectories of discrete phases across the workspace. As dust particles travel with the airflow, they are influenced by several forces, including gravity, buoyancy, drag, Hoffman force, and Magnus force. According to Newton’s Second Law, the motion of these discrete phase particles is as follows:
m p d v p d t = F f p
I p d w p d t = M f p
In the equation, m p  represents the mass of the discrete phase particle, measured in kg. I p denotes the inertial term of the discrete phase particle, while F f p is the fluid force exerted by the continuous phase gas on the dust particle, measured in N. M f p stands for the torque acting on the discrete phase particle, expressed in N·m. Additionally, d is the diameter of the particle in the discrete phase, m, and v p is the velocity of the particle in m/s.

3. Geometric Model

3.1. Model Construction
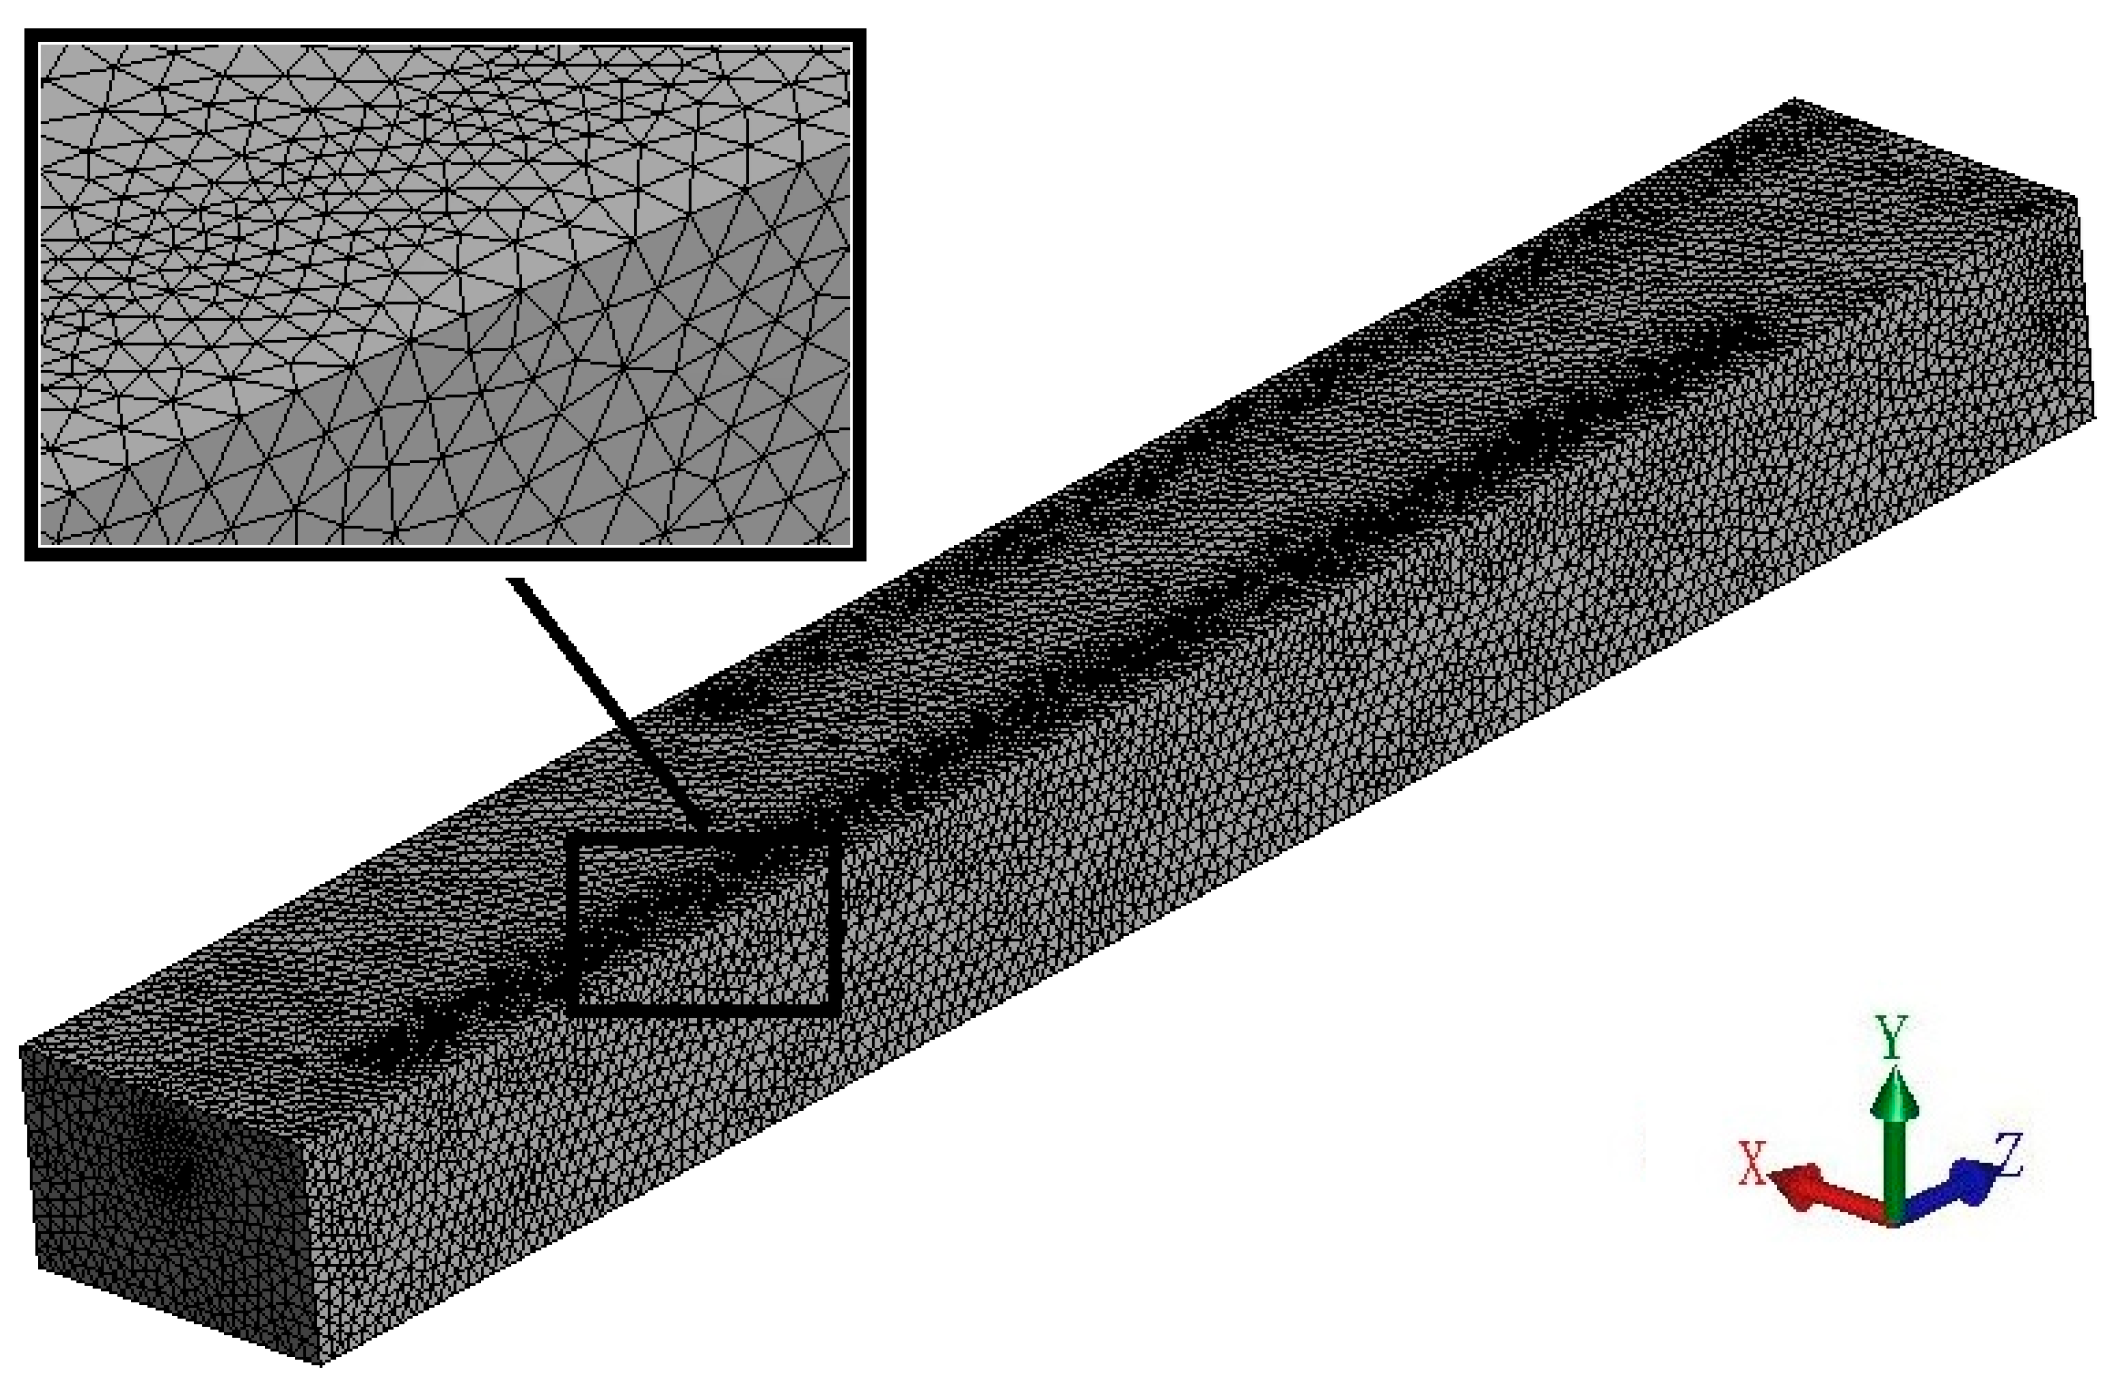
The model was designed using real parameters from the 431305 fully mechanized excavation face at Liangshuijing Mine. A proportional model of the mining face roadway was developed using SolidWorks (version 2024), with some equipment simplified for easier modeling. The roadway is 40 m long, with a rectangular cross-section measuring 3.8 m in height and 6 m in width. The mining machine model is an EBZ-318H, which is 13.1 m long, with its main body shaped like a cuboid measuring 7.9 m × 5.2 m × 2.6 m. The cutting head of the mining machine is simplified and represented by a conical frustum that is 1.5 m long. The intake side of the roadway features a compressed air duct, represented by a cylinder with a 1 m diameter. This duct’s outlet is positioned 15 m from the mining face, with its center axis 0.6 m below the roadway ceiling and 1 m from the roadway wall. The airflow rate through this duct is 600 m3/min. On the left side above the mining machine is the exhaust duct, represented by a cylinder with a diameter of 0.8 m, installed 3 m from the mining face, featuring a dust collection airflow rate of 520 m3/min. Attached to this exhaust duct is a wet dust collector, modeled as a cuboid measuring 4.5 m × 1.4 m × 1.2 m, with an airflow rate of 450 m3/min. The scraper conveyor and belt conveyor are both represented by cuboids with cross-sections of 1.4 m × 1.2 m, using models SGB-620/40T and DSJ 80/40/90, respectively.
Based on the fully mechanized tunneling face model, the position of the dust source point will also change according to the characteristics of the excavation head contacting different positions of the coal wall during the excavation process. Five positions on the left lower side, right lower side, left upper side, right upper side and center position of the tunneling face are selected as dust source points, which are represented by circles with a radius of 0.5 m and are named dust source point 1, dust source point 2, dust source point 3, dust source point 4 and dust source point 5, respectively. The layout of roadway equipment and the location of dust source points on the fully mechanized tunneling face are shown in Figure 1.

3.2. Grid Division

The geometric model was imported into Design Modeler, where it underwent a tetrahedral meshing process. Expansion layers and mesh refinement were applied specifically at the outlet of the compressed air duct, the exhaust duct, and the dust collector’s outlet. After ensuring mesh independence, a total of 682,836 meshes were generated, with an average quality score of 0.83, which meets the requirements for computational convergence. The meshing details of the fully mechanized excavation face are illustrated in Figure 2.

4. Boundary Conditions and Model Parameter Setting

Based on the actual conditions of the fully mechanized excavation face, the simulation integrates both continuous and discrete phases. The air duct outlet is set as a velocity inlet, with the roadway exit defined as a free outflow featuring a discharge rate of 1. The compressed air duct has an inlet velocity of 12.74 m/s, a hydraulic diameter of 1 m, and a turbulence intensity of 2.9%. The exhaust duct features a flow velocity of −17.25 m/s, a hydraulic diameter of 0.8 m, and a turbulence intensity of 2.87%. Meanwhile, the dust collector’s outlet operates with a flow velocity of 5.59 m/s, a hydraulic diameter of 1.29 m, and a turbulence intensity of 3.09%. The roadway walls are assumed to be no-slip uniform walls.
With the geometric model parameters and boundary conditions remaining unchanged, the DPM is activated, designating the excavation face as the dust source. The injection method is chosen as surface (surface), with particle size distribution following the Rosin–Rammler distribution. The roadway walls, floor, and tunneling machine equipment are set as trap types, while the exhaust duct outlet is categorized as escape type. Detailed parameters for the dust source are listed in Table 1.
After setting the dust as a discrete phase, the droplets are set to reflect their fragmented state after being sprayed out from the nozzle. To manage this, the breakup model within the discrete phase is activated, offsetting the initial breakup length, y0, to 0.001. Each breakup event is configured to produce two daughter droplets. Additional parameters for the discrete phase concerning the droplets are detailed in Table 2.

5. Results and Analysis of Gas–Liquid–Solid Three-Phase Coupling at Fully Mechanized Excavation Face

5.1. Analysis of Simulation Results of Roadway Air Flow Field

The movement of dust particles is primarily influenced by the airflow. By analyzing this airflow within the roadway at the fully mechanized excavation face, we can better understand how dust particles move and how turbulence accumulates in the working area. Using Fluent, the simulation models airflow characteristics under the long-pressure and short-suction ventilation method at the comprehensive mining face. To visualize how the airflow moves, we use airflow trace diagrams shown in Figure 3, along with XY cross-sectional velocity vector diagrams of the roadway in Figure 4 for detailed analysis.
Figure 3 clearly illustrates the movements and patterns of airflow within the tunnel, highlighting regions such as the jet, recirculation, and vortices. When high-speed airflow is discharged from the compressed air duct, it initially travels in a straight line toward the tunnel face. As it approaches the tunnel face, it collides and reflects, causing the flow to spread toward the return air side. Upon reaching the face, the airflow direction changes owing to the negative pressure effect of the exhaust duct, resulting in different motion patterns. Some of the airflow is absorbed by the exhaust duct and is directly extracted from the tunnel, while another portion forms eddies and moves irregularly after reaching the face owing to backflow. Additionally, some airflow, after being redirected, moves along the tunnel walls to the return air side, influenced by the negative pressure effect from the exhaust duct. In the area behind the tunnel face, the airflow is more stable thanks to a dust collector that provides additional air, maintaining a steady flow. Overall observations reveal that the wind speed on the tunnel floor is higher than that on the ceiling, with peak speeds of approximately 7 m/s. As the distance from the floor increases, wind speed gradually decreases, with speeds near the ceiling ranging from about 2 to 3 m/s.
Figure 4 highlights the dynamics of airflow emitted from the compressed air duct. Initially, the air moves rapidly near the outlet, but as it approaches the tunnel face, its speed decreases, and it spreads out. When the fresh airflow reaches the tunnel face, it forms a wall-attached jet that hits the tunneling machine and diffuses above it, forming a vortex region. Meanwhile, the large mining machine and the higher exhaust rate compared to intake create a strong vortex region above, sustained by cyclonic action, prolonging its presence. Some airflow escapes the vortex region and moves backward along the roadway, losing speed. However, after passing through the dust collector, the purified airflow produced by the dust collector supplies the roadway, effectively increasing the wind speed and improving the working conditions. The fresh airflow velocity at the mine’s breathing zone and the driver’s position is between 4 and 5 m/s, maintaining at 2 to 5 m/s after exiting the compressed air duct. The cutting area experiences wind speeds of about 3 to 7 m/s, while both the middle section of the roadway and the turbulent area exhibit lower speeds. The long-pressure and short-suction ventilation method significantly influences airflow patterns, dust suppression, and vortex formation in the tunnel. Dust trapped in small vortices is harder to remove, reducing dust control effectiveness owing to high wind speeds and dust suspension. Therefore, precise strategies are necessary for accurately preventing and controlling dust.

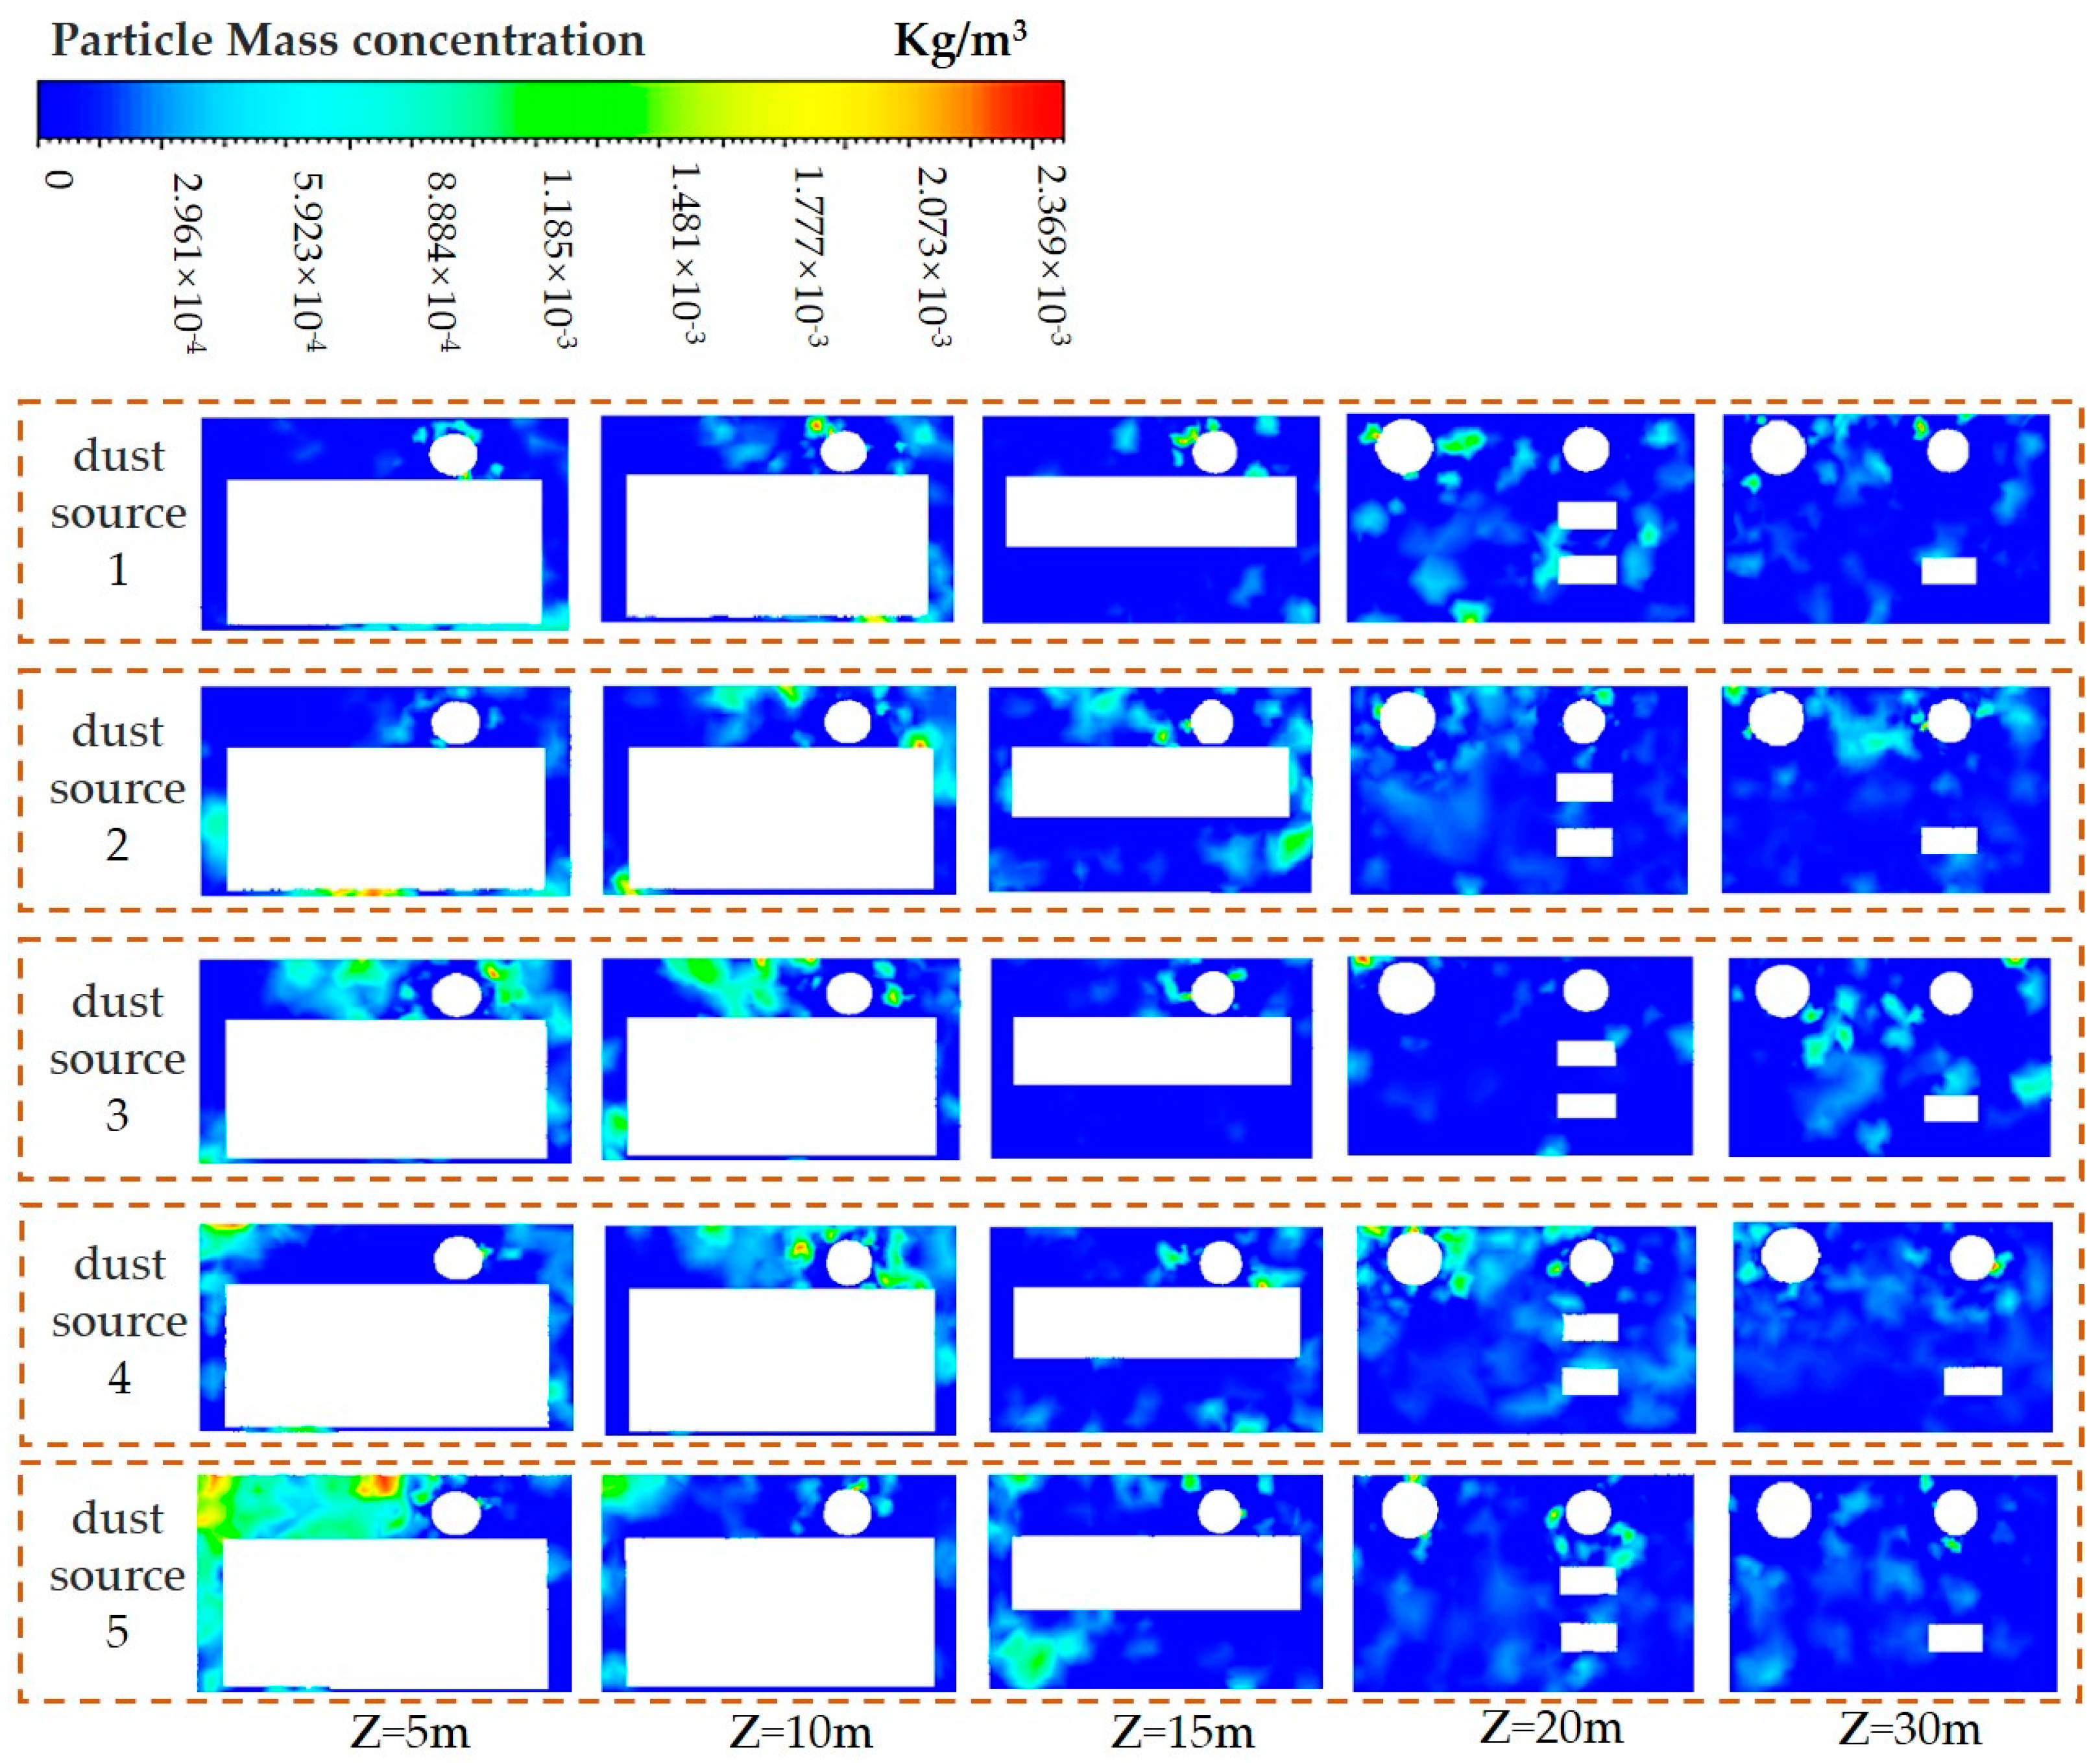
5.2. Analysis of Simulation Results of Airflow and Dust Field

In the fully mechanized excavation face, the roadway conditions are complex, affecting dust distribution as the cutting head interacts with the coal wall at different locations. To fully understand dust movement within the roadway, dust concentration distribution cloud diagrams at five source points along the excavation direction were analyzed, as shown in Figure 5.
As illustrated in Figure 5, at dust source point 1, high dust concentration is concentrated near the roadway floor, primarily because it is far from the exhaust duct. Most dust is carried backward by airflow, with some collected by the exhaust duct. Larger dust particles settle owing to gravity, while smaller ones continue to diffuse backward along the roadway. At dust source point 2, located on the return air side, high-concentration dust is mostly found within the first 15 m of the roadway, driven by the airflow from the compressed air duct. Beyond 15 m, dust moves toward the exhaust duct outlet and is collected, with a significant drop in dust concentration rapidly observed after 30 m from the face. At dust source point 3, the dust is affected by airflow from the compressed air duct, which effectively carries it out of the roadway and into the exhaust duct. The dust concentration decreases rapidly after 15 m from the face, resulting in an overall lower dust concentration compared to dust source points 1 and 2. Dust source point 4 is located in the upper half of the entire heading face and close to the inlet of the exhaust duct. Most of the dust is directly captured by the exhaust duct, and a small portion of the dust continues to diffuse into the roadway with the air flow. Dust source point 5 is located on the return air side of the upper half of the tunneling face. The relatively high dust concentration is mainly concentrated in the area 15 m in front of the heading face. The air flow and exhaust duct have the most obvious absorption and purification effects on dust. The overall dust concentration of the fully mechanized tunneling face is low.
To further study the dust distribution patterns on different sides of the roadway, we analyzed dust concentration cloud diagrams at different dust source points near the comprehensive mining driver and the return air side, as shown in Figure 6.
Figure 6 illustrates that high dust concentrations primarily accumulate at the return air side and around the comprehensive mining driver’s position. At dust source point 2, near the mining driver, dust tends to accumulate owing to the irregular distribution of dust caused by the airflow jet and its dispersion near the tunnel face, causing high concentrations. Dust source point 3, which is close to the jet area, exhibits a significantly lower dust concentration, resulting in a more uniform dust distribution at the front of the tunnel. On the return air side, dust source point 1 experiences high dust levels owing to its position below the compressed air duct and away from the jet area, resulting in a blind zone vortex that leads to dust deposition on the return air side of the tunnel. Dust source points 4 and 5, located near the exhaust duct outlet, show relatively low dust concentrations. Overall, dust source point 1 has the highest dust concentration and presents significant dust accumulation on the floor, making it a critical focus for dust prevention and control.

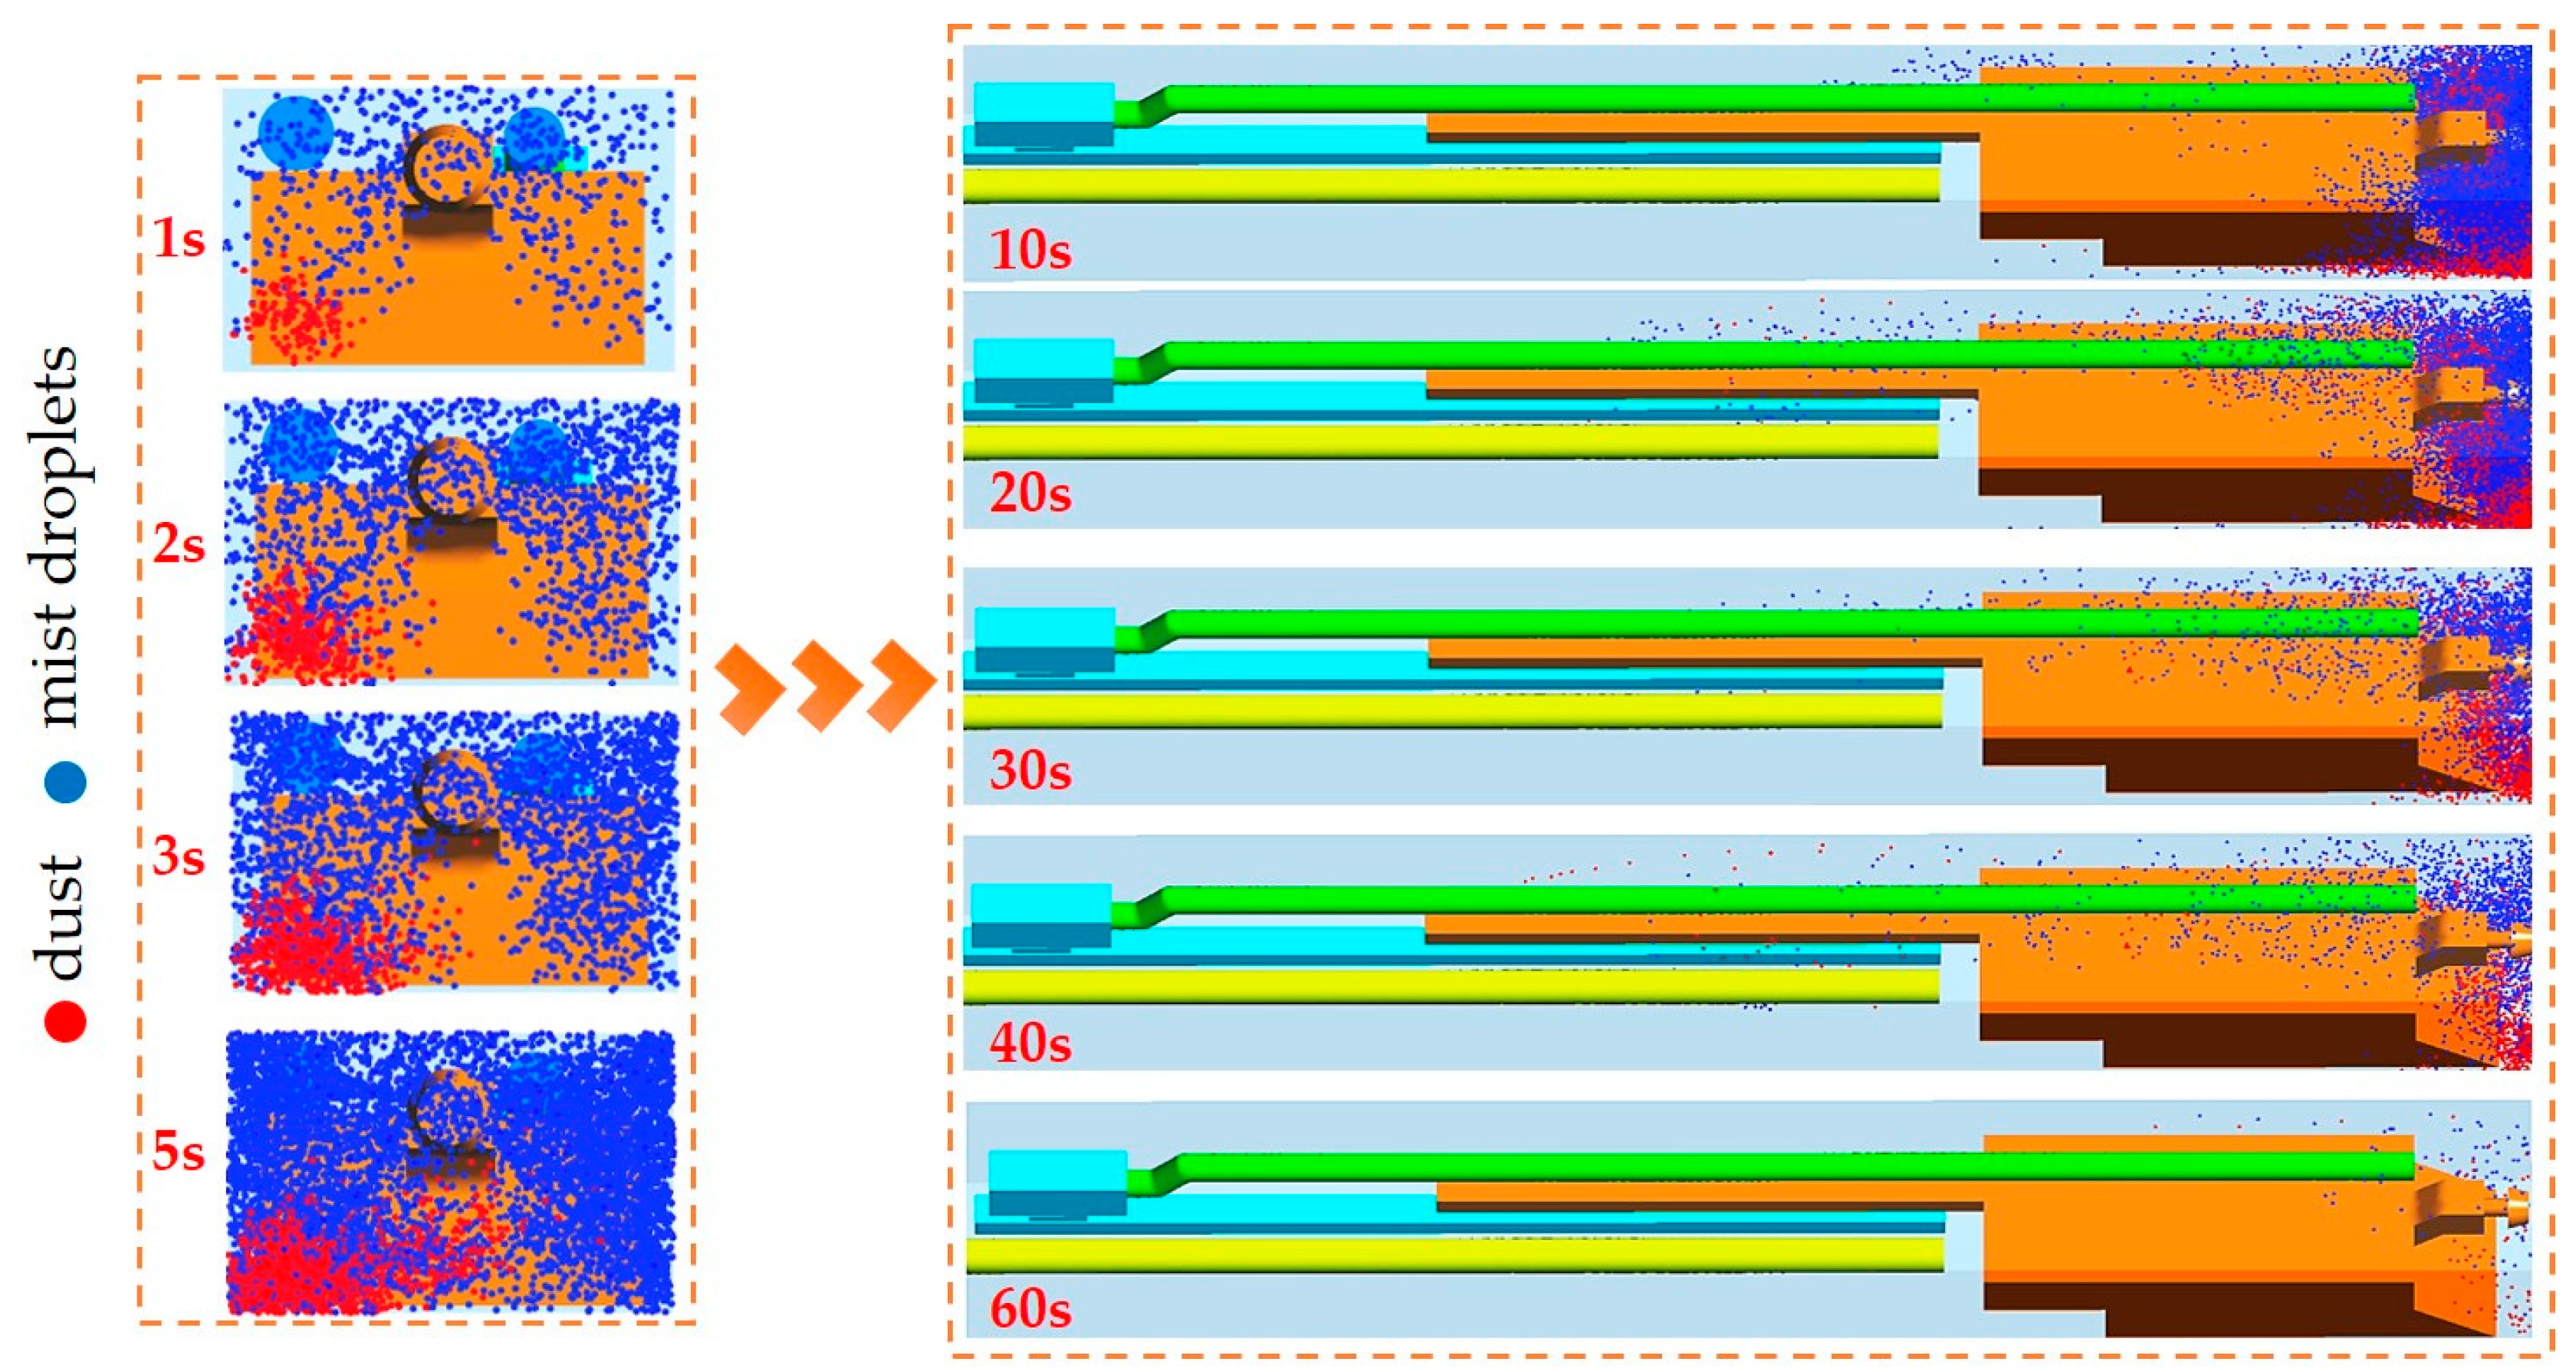
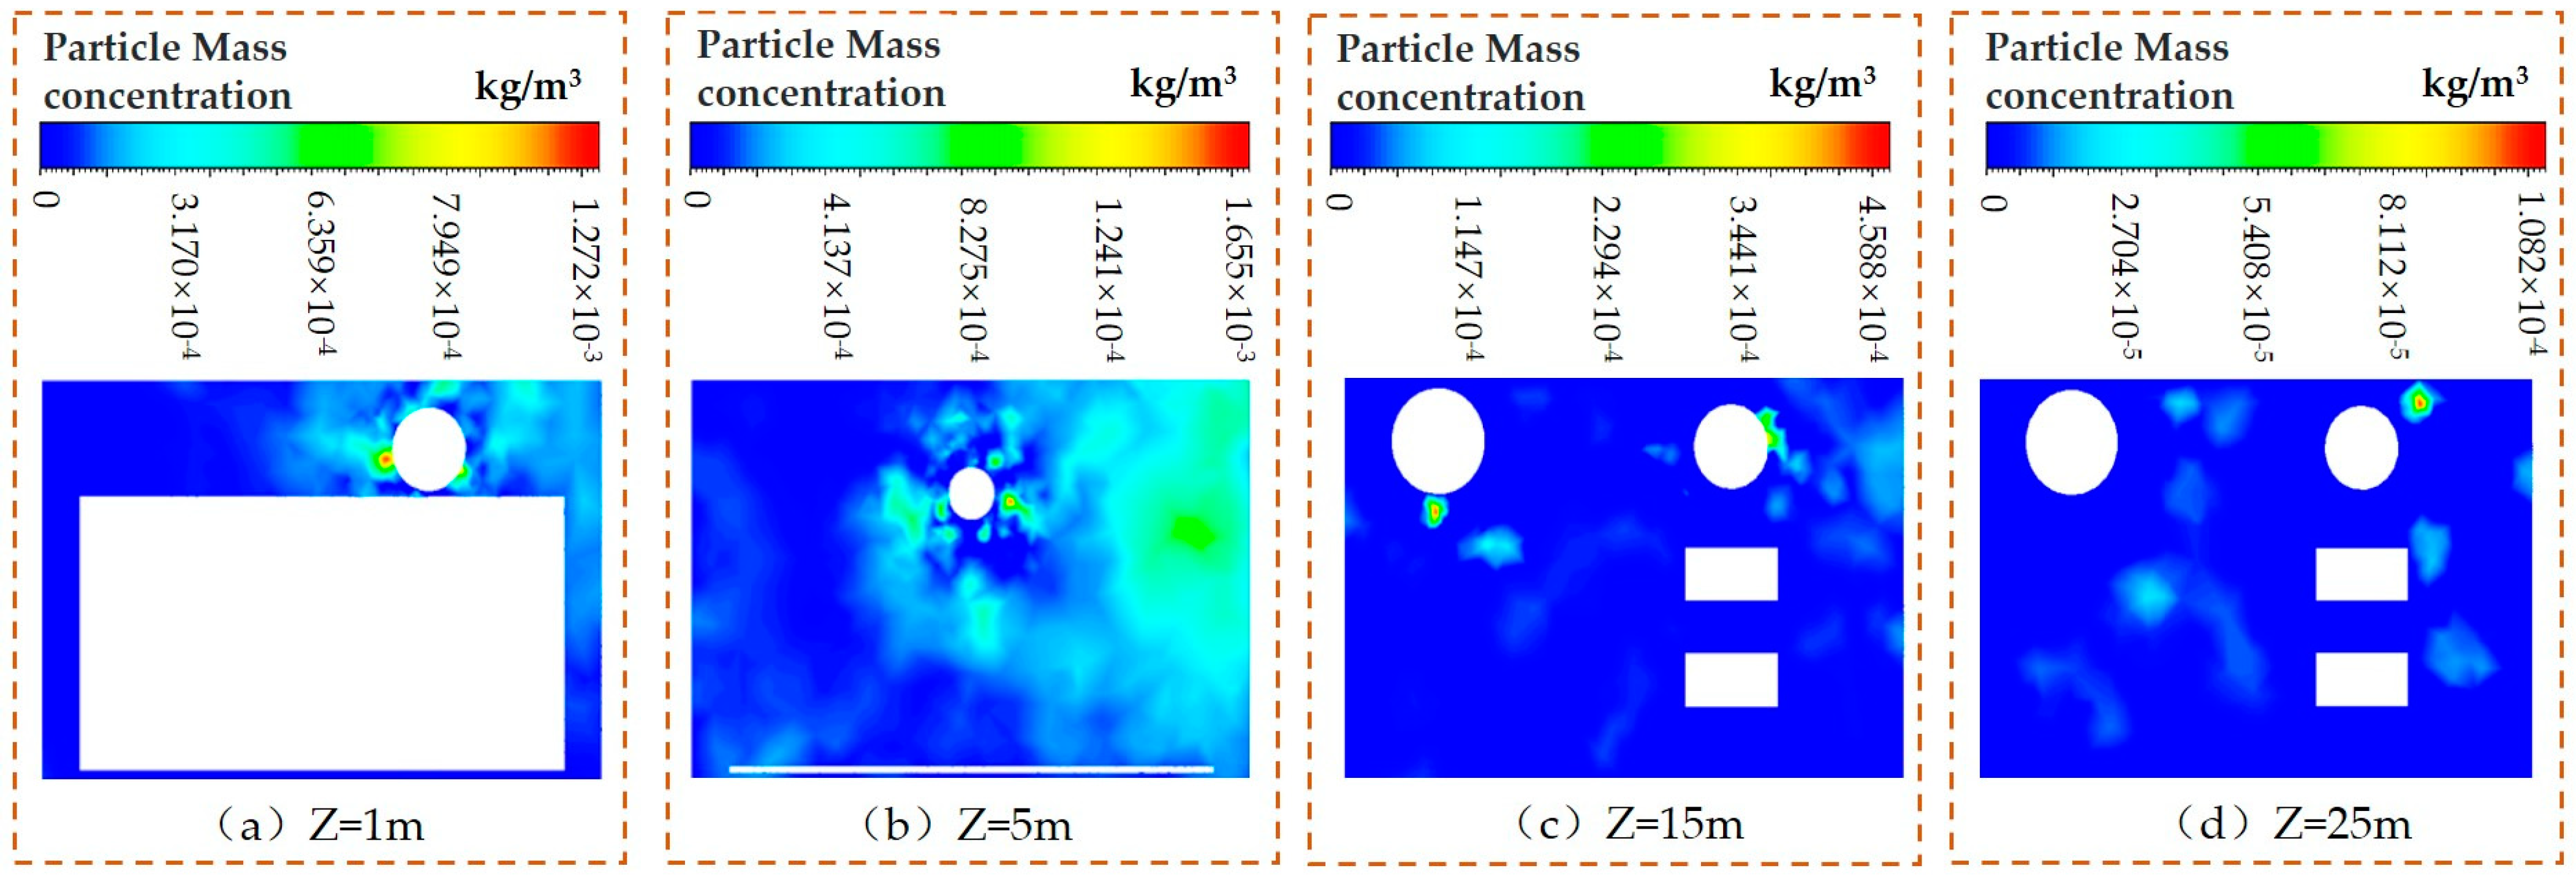
5.3. Analysis of Simulation Results of Dust–Fog Coupling Field

According to the dust migration laws at different dust source points, it is known that dust is mainly generated at dust source point 1 where the ventilation effect in the roadway is poor, resulting in the high-concentration distribution of dust in the overall fully mechanized tunneling face. Therefore, dust source point 1 is the main research object. Considering the effect of water mist, the spatial distribution characteristics and laws of dust at dust source point 1 under the action of water mist are comprehensively studied. As dust particles and water mist droplets are small, CFD-POST (2024) is used to visualize them as particles for easier analysis. In these visualizations, red particles represent dust, and blue particles represent mist droplets. This allows us to observe how dust and mist particles move over time, as shown in Figure 7.
Figure 7 reveals that initially, the water mist spreads out in a cone shape near the cutting head, gradually covering the tunnel face. Dust particles start to emerge from dust source point 1 in a concentrated manner. Over time, both mist and dust particles continue to be ejected from the cutting head and dust source point 1, slowly moving and dispersing owing to airflow from the pressure and exhaust ducts. At time t = 5 s, mist particles have almost covered the entire working area, and dust concentration has increased from the initial state. This stage shows dust particles beginning to move toward the exhaust duct and the return air side, driven by airflow from the pressure duct and turbulence entrainment. The mist particles, combined with the airflow, help the dust particles to spread and start settling down, indicating an interaction that aids in dust control.
To better visualize the movement of dust and mist particles in three dimensions, we examined their transient states at intervals of 10, 20, 30, and 40 s. Between 10 s and 20 s, a large amount of dust and mist particles cover the cutting head of the mining machine. Airflow and mist cause some dust to be absorbed by the air duct, while others are wrapped by mist and settle on the tunnel floor. A few particles continue moving backward along the tunnel with the airflow. By 20 s, dust concentration visibly decreases, indicating the effectiveness of the mist. Between 30 s and 40 s, the overall dust concentration in the tunnel further decreases, especially at the front section of the tunnel. Residual dust-mist particles are dispersed on the return air side and at the front end of the overlapping part of the air duct owing to turbulence. By 60 s, most dust and mist particles are captured, with only a few remaining in a vortex until they settle and are eventually captured by the exhaust duct.
Figure 8 illustrates that at z = 1 m from the tunnel face, the dust concentration peaks at about 1045 mg/m3. The application of water mist significantly reduces the overall dust levels in the mining face roadway compared to using just airflow. This indicates that a significant amount of high-concentration dust near the tunnel face and the mining machine’s front is effectively absorbed and removed by the exhaust duct. The tendency for dust to spread with airflow is notably reduced compared to using only ventilation. Beyond a distance of z = 15 m from the tunnel face, most dust quickly settles on the roadway floor, with only a small portion continuing to diffuse along the tunnel toward the rear, eventually exiting the tunnel space.

6. Field Measurement and Application of Dust Concentration in Excavating Face

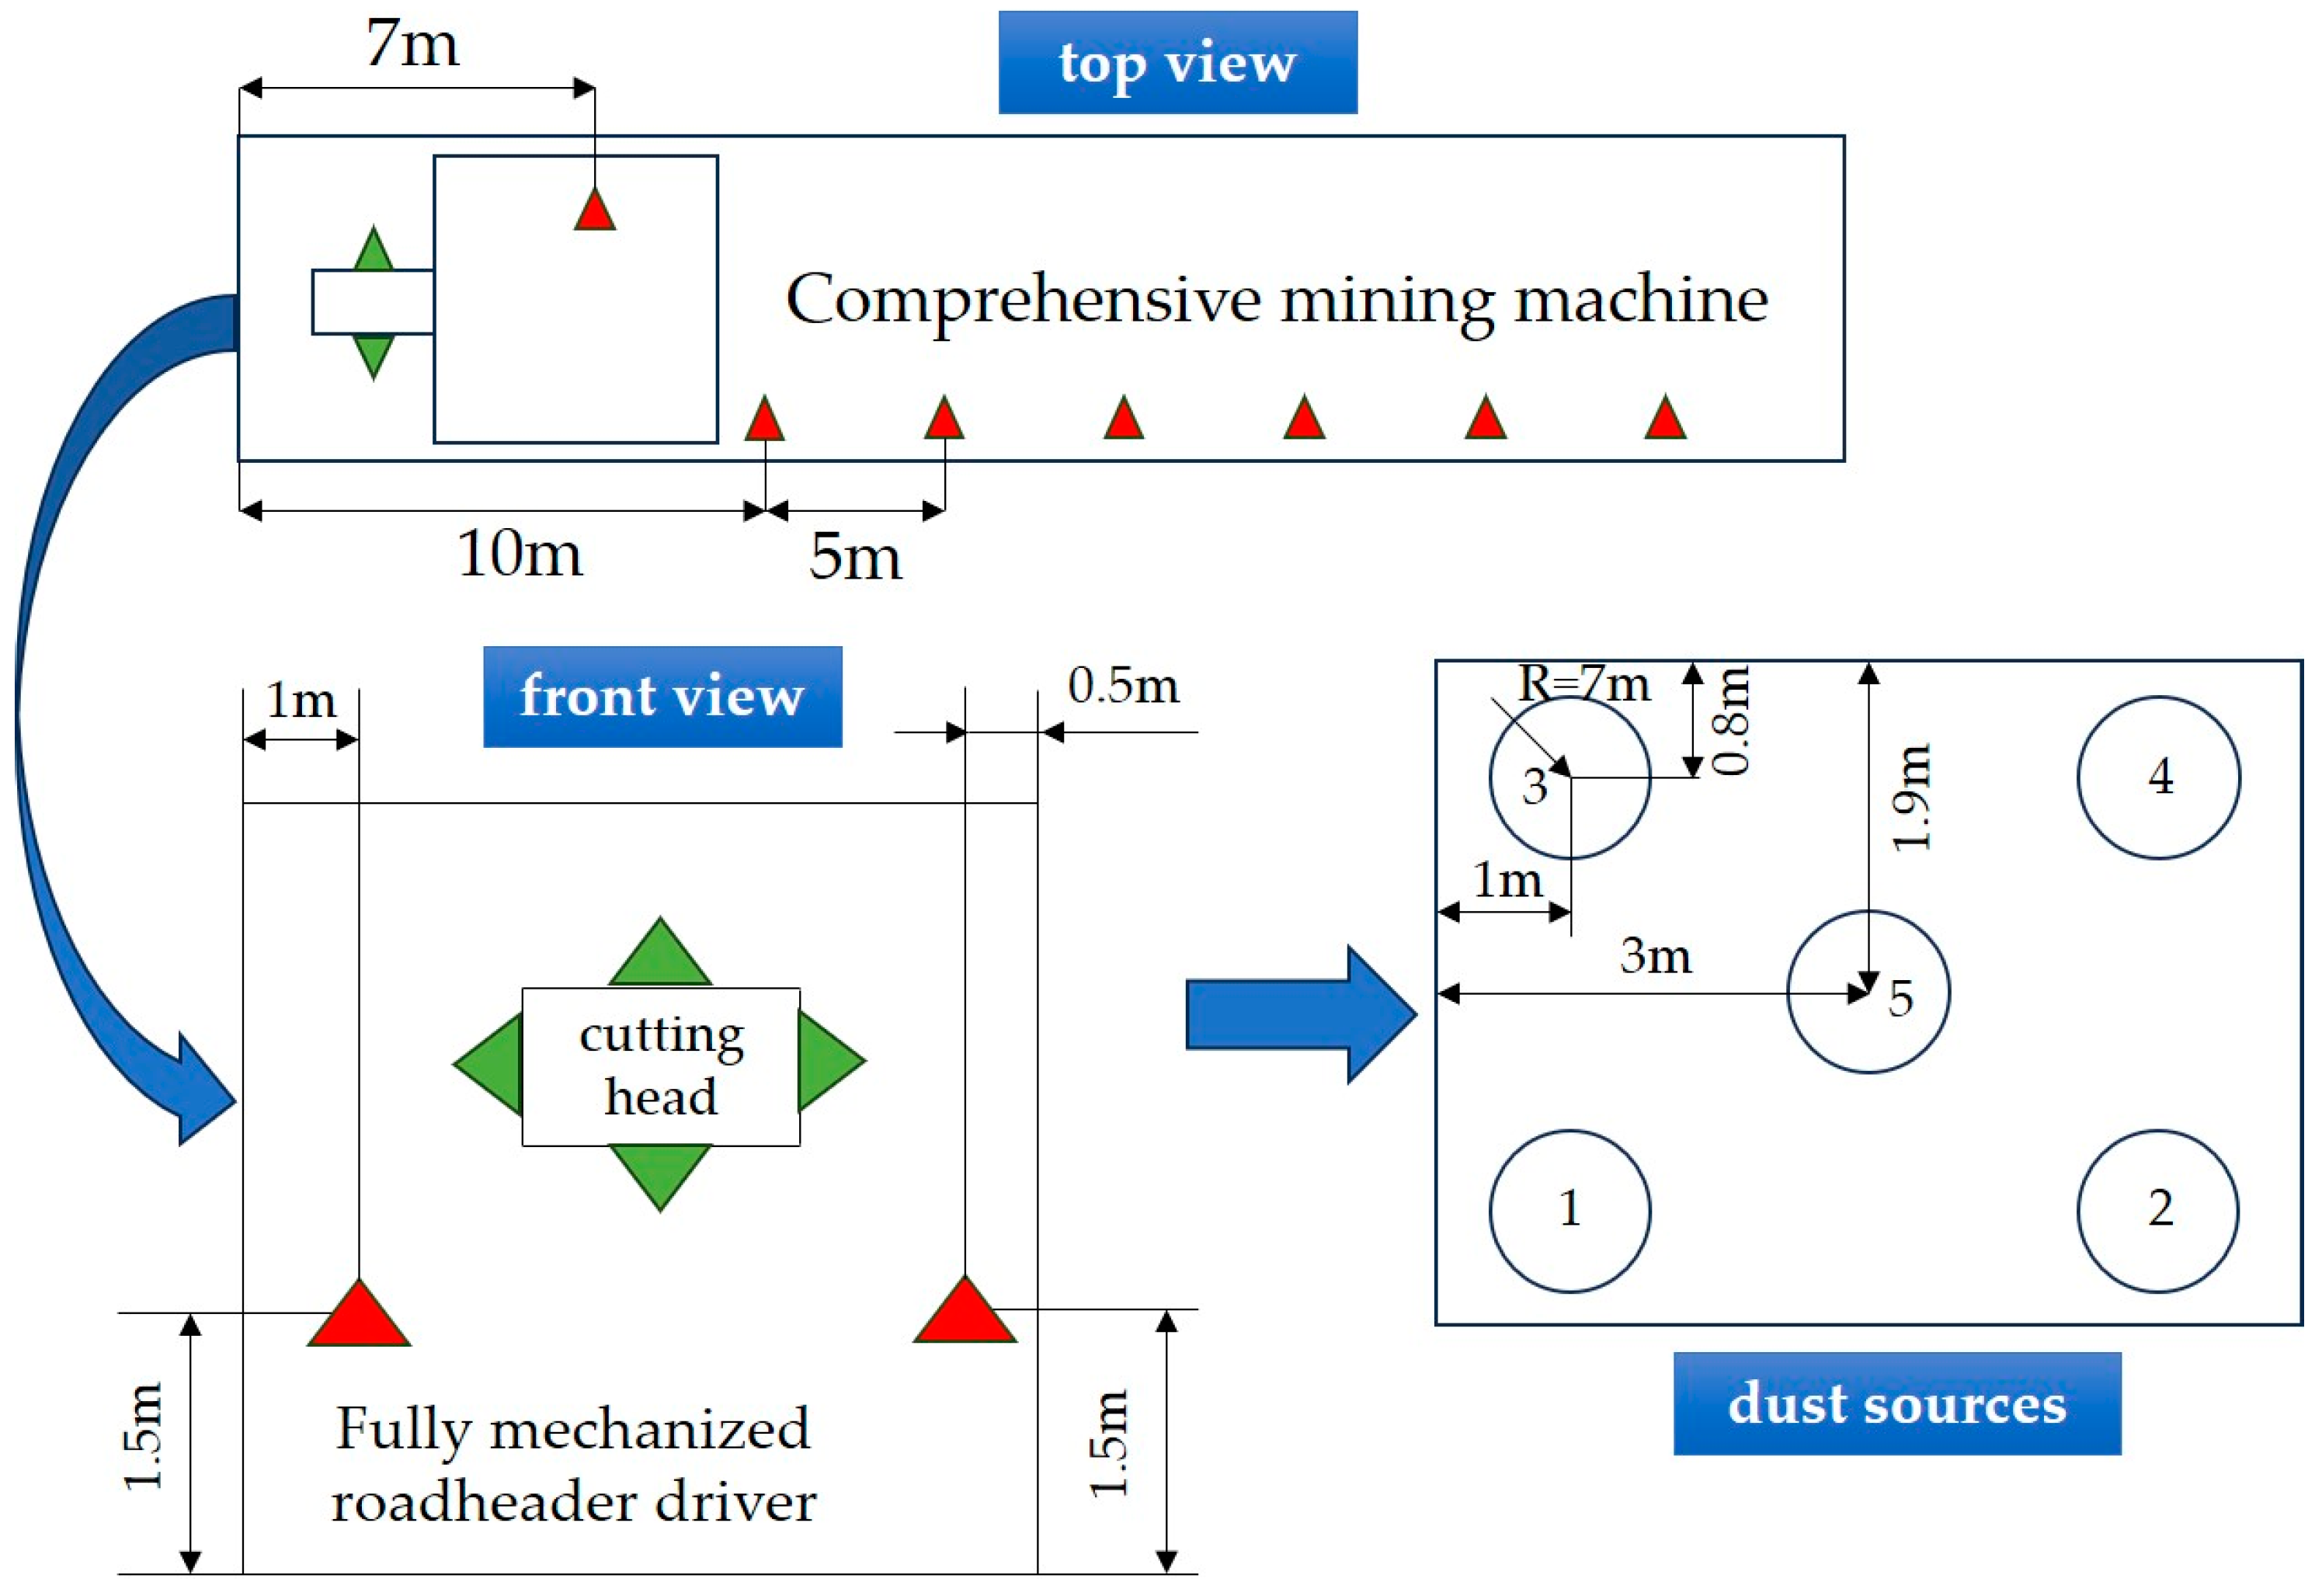
6.1. Measuring Method and Measuring Point Arrangement

In the Liangshuijing Coal Mine, sampling and measurement locations were determined to be at the mining driver’s position and along the return air side. Measuring points were set at a height of 1.5 m from the ground. Spray nozzles, indicated by green triangles, were evenly distributed around a 0.5 m radius on the boom frame of the tunneling machine. There were seven measuring points, marked by red triangles arranged in the roadway: one at the driver’s position (X = 1 m, Y = 1.5 m, Z = 7 m) and six others spaced at 5 m intervals along the return air side, 0.5 m from the tunnel sidewall behind the tunneling machine. For dust sampling, the filter membrane gravimetric dust sampling method was used. The AKFC-92A dust sampler collected respirable dust, with each sampling point undergoing at least three measurements to calculate an average value. The layout of these roadway measuring points and the distribution of different dust sources are shown in Figure 9.

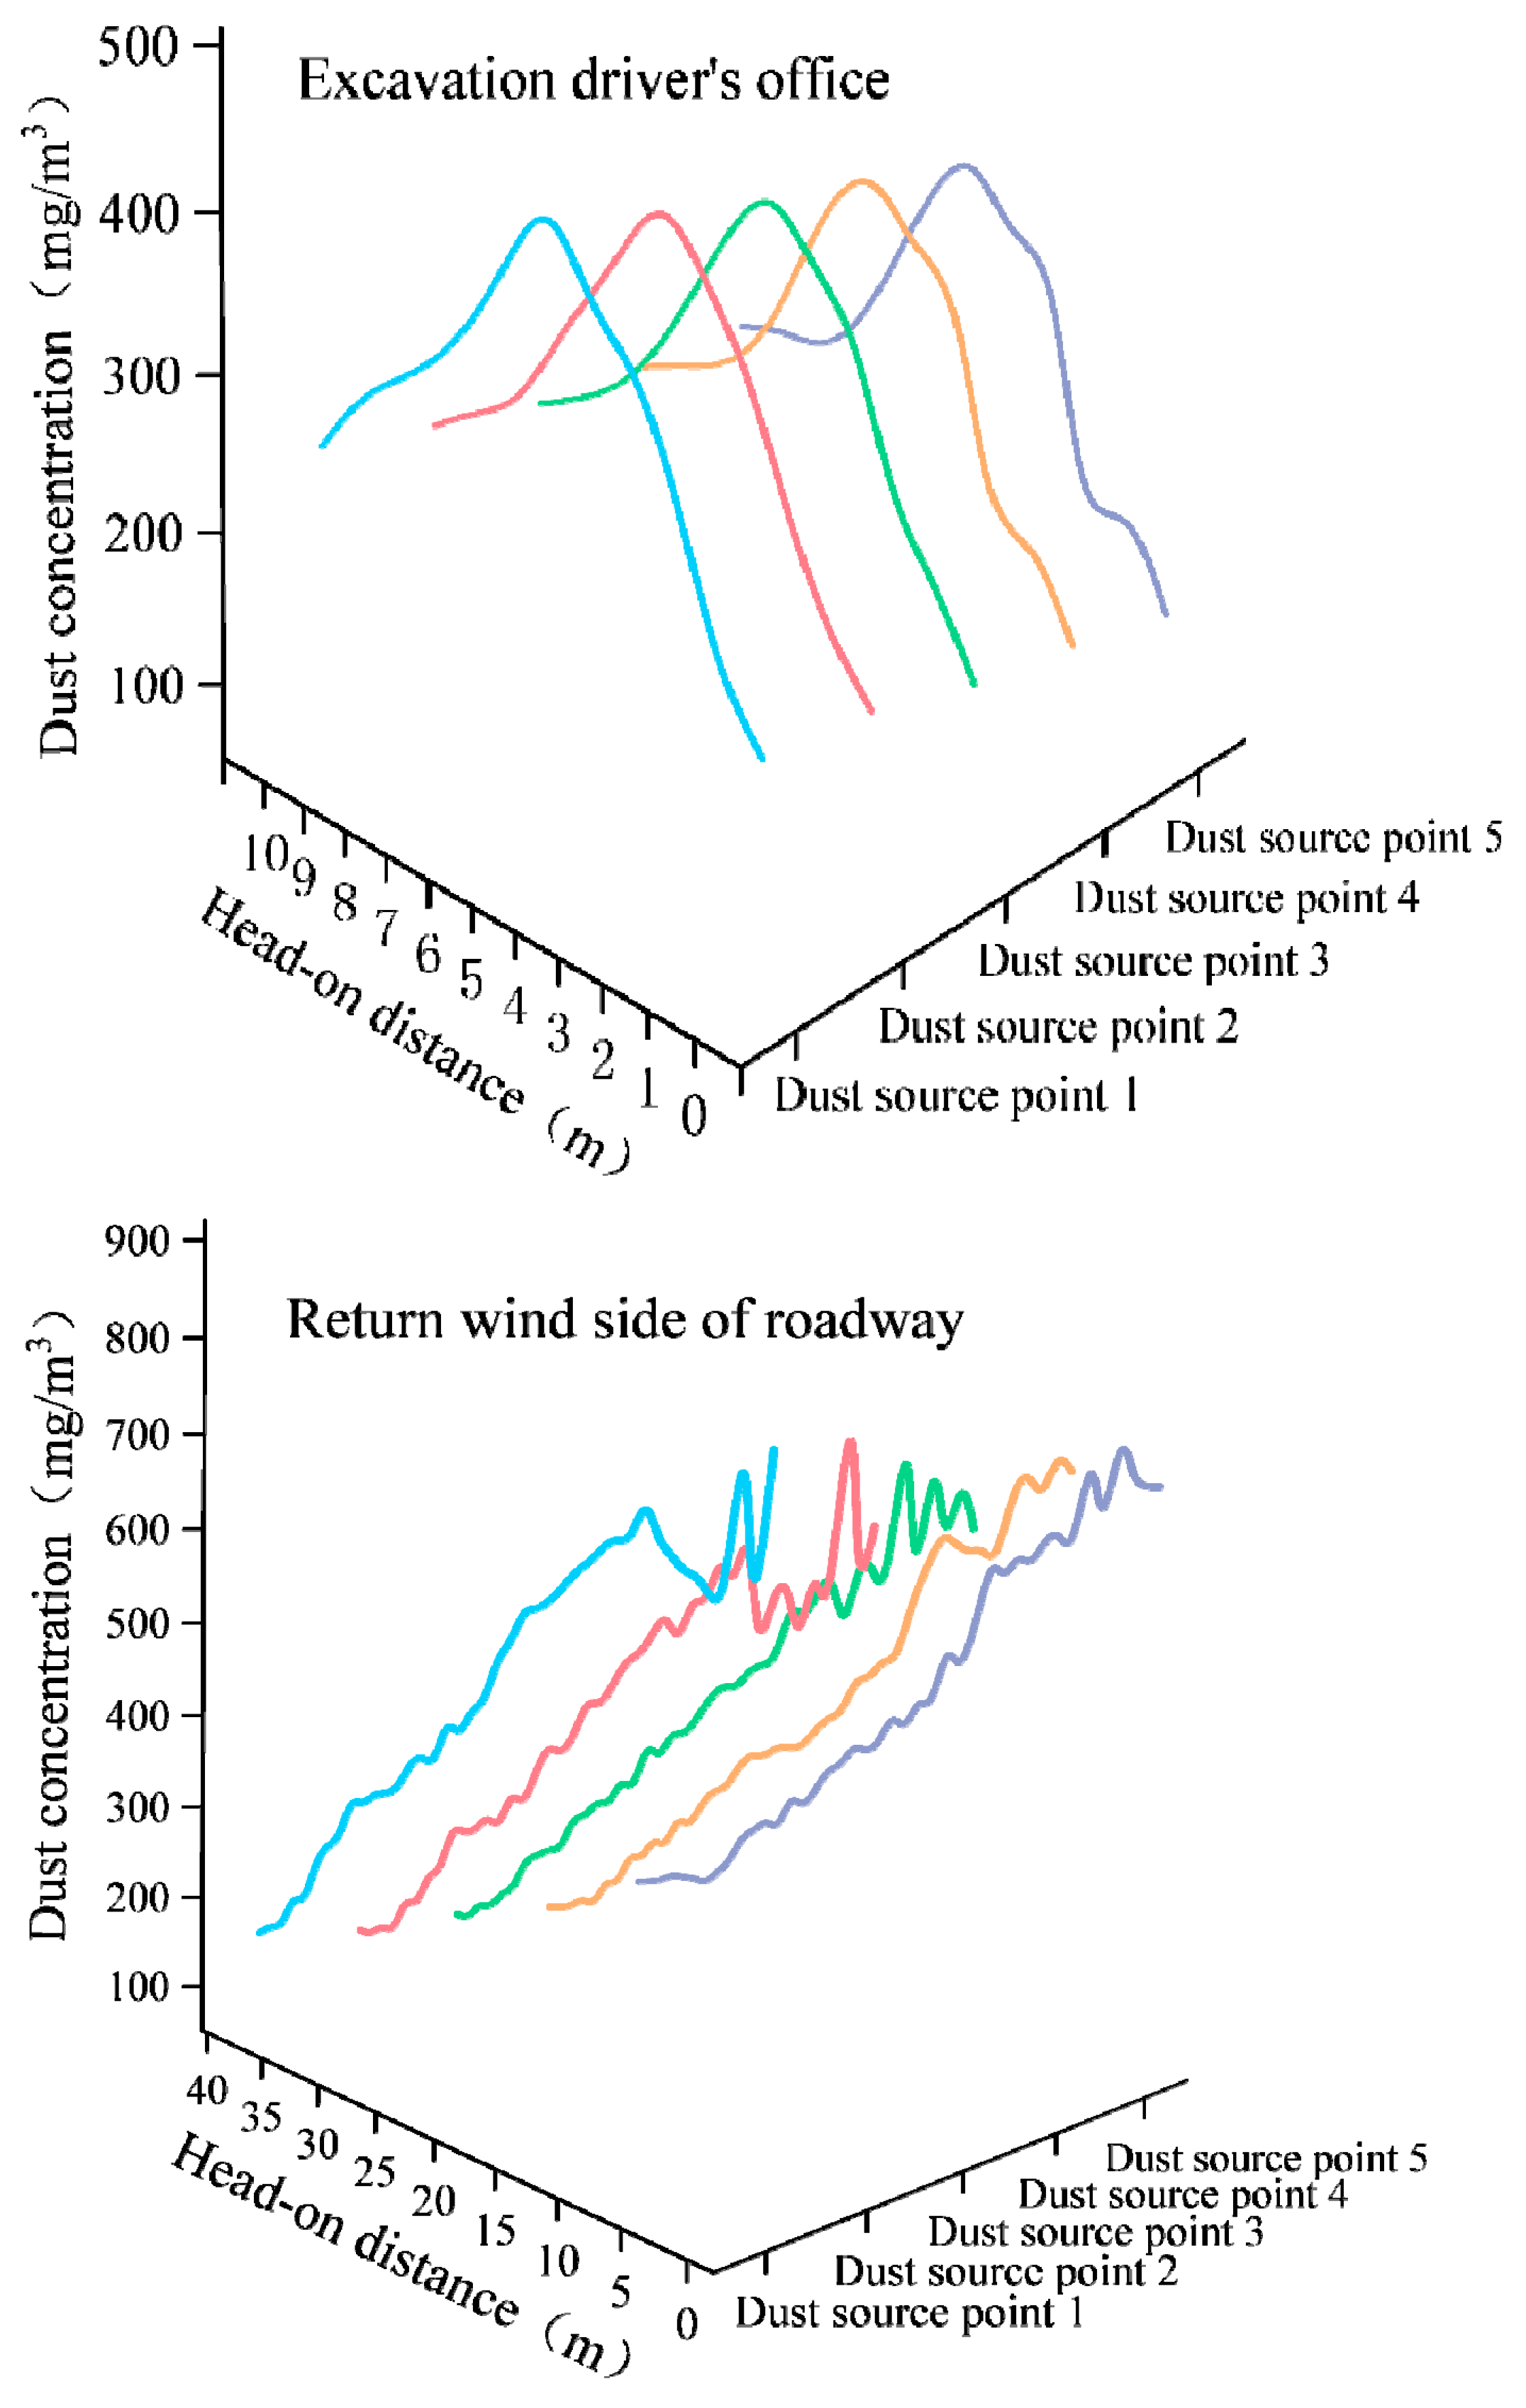
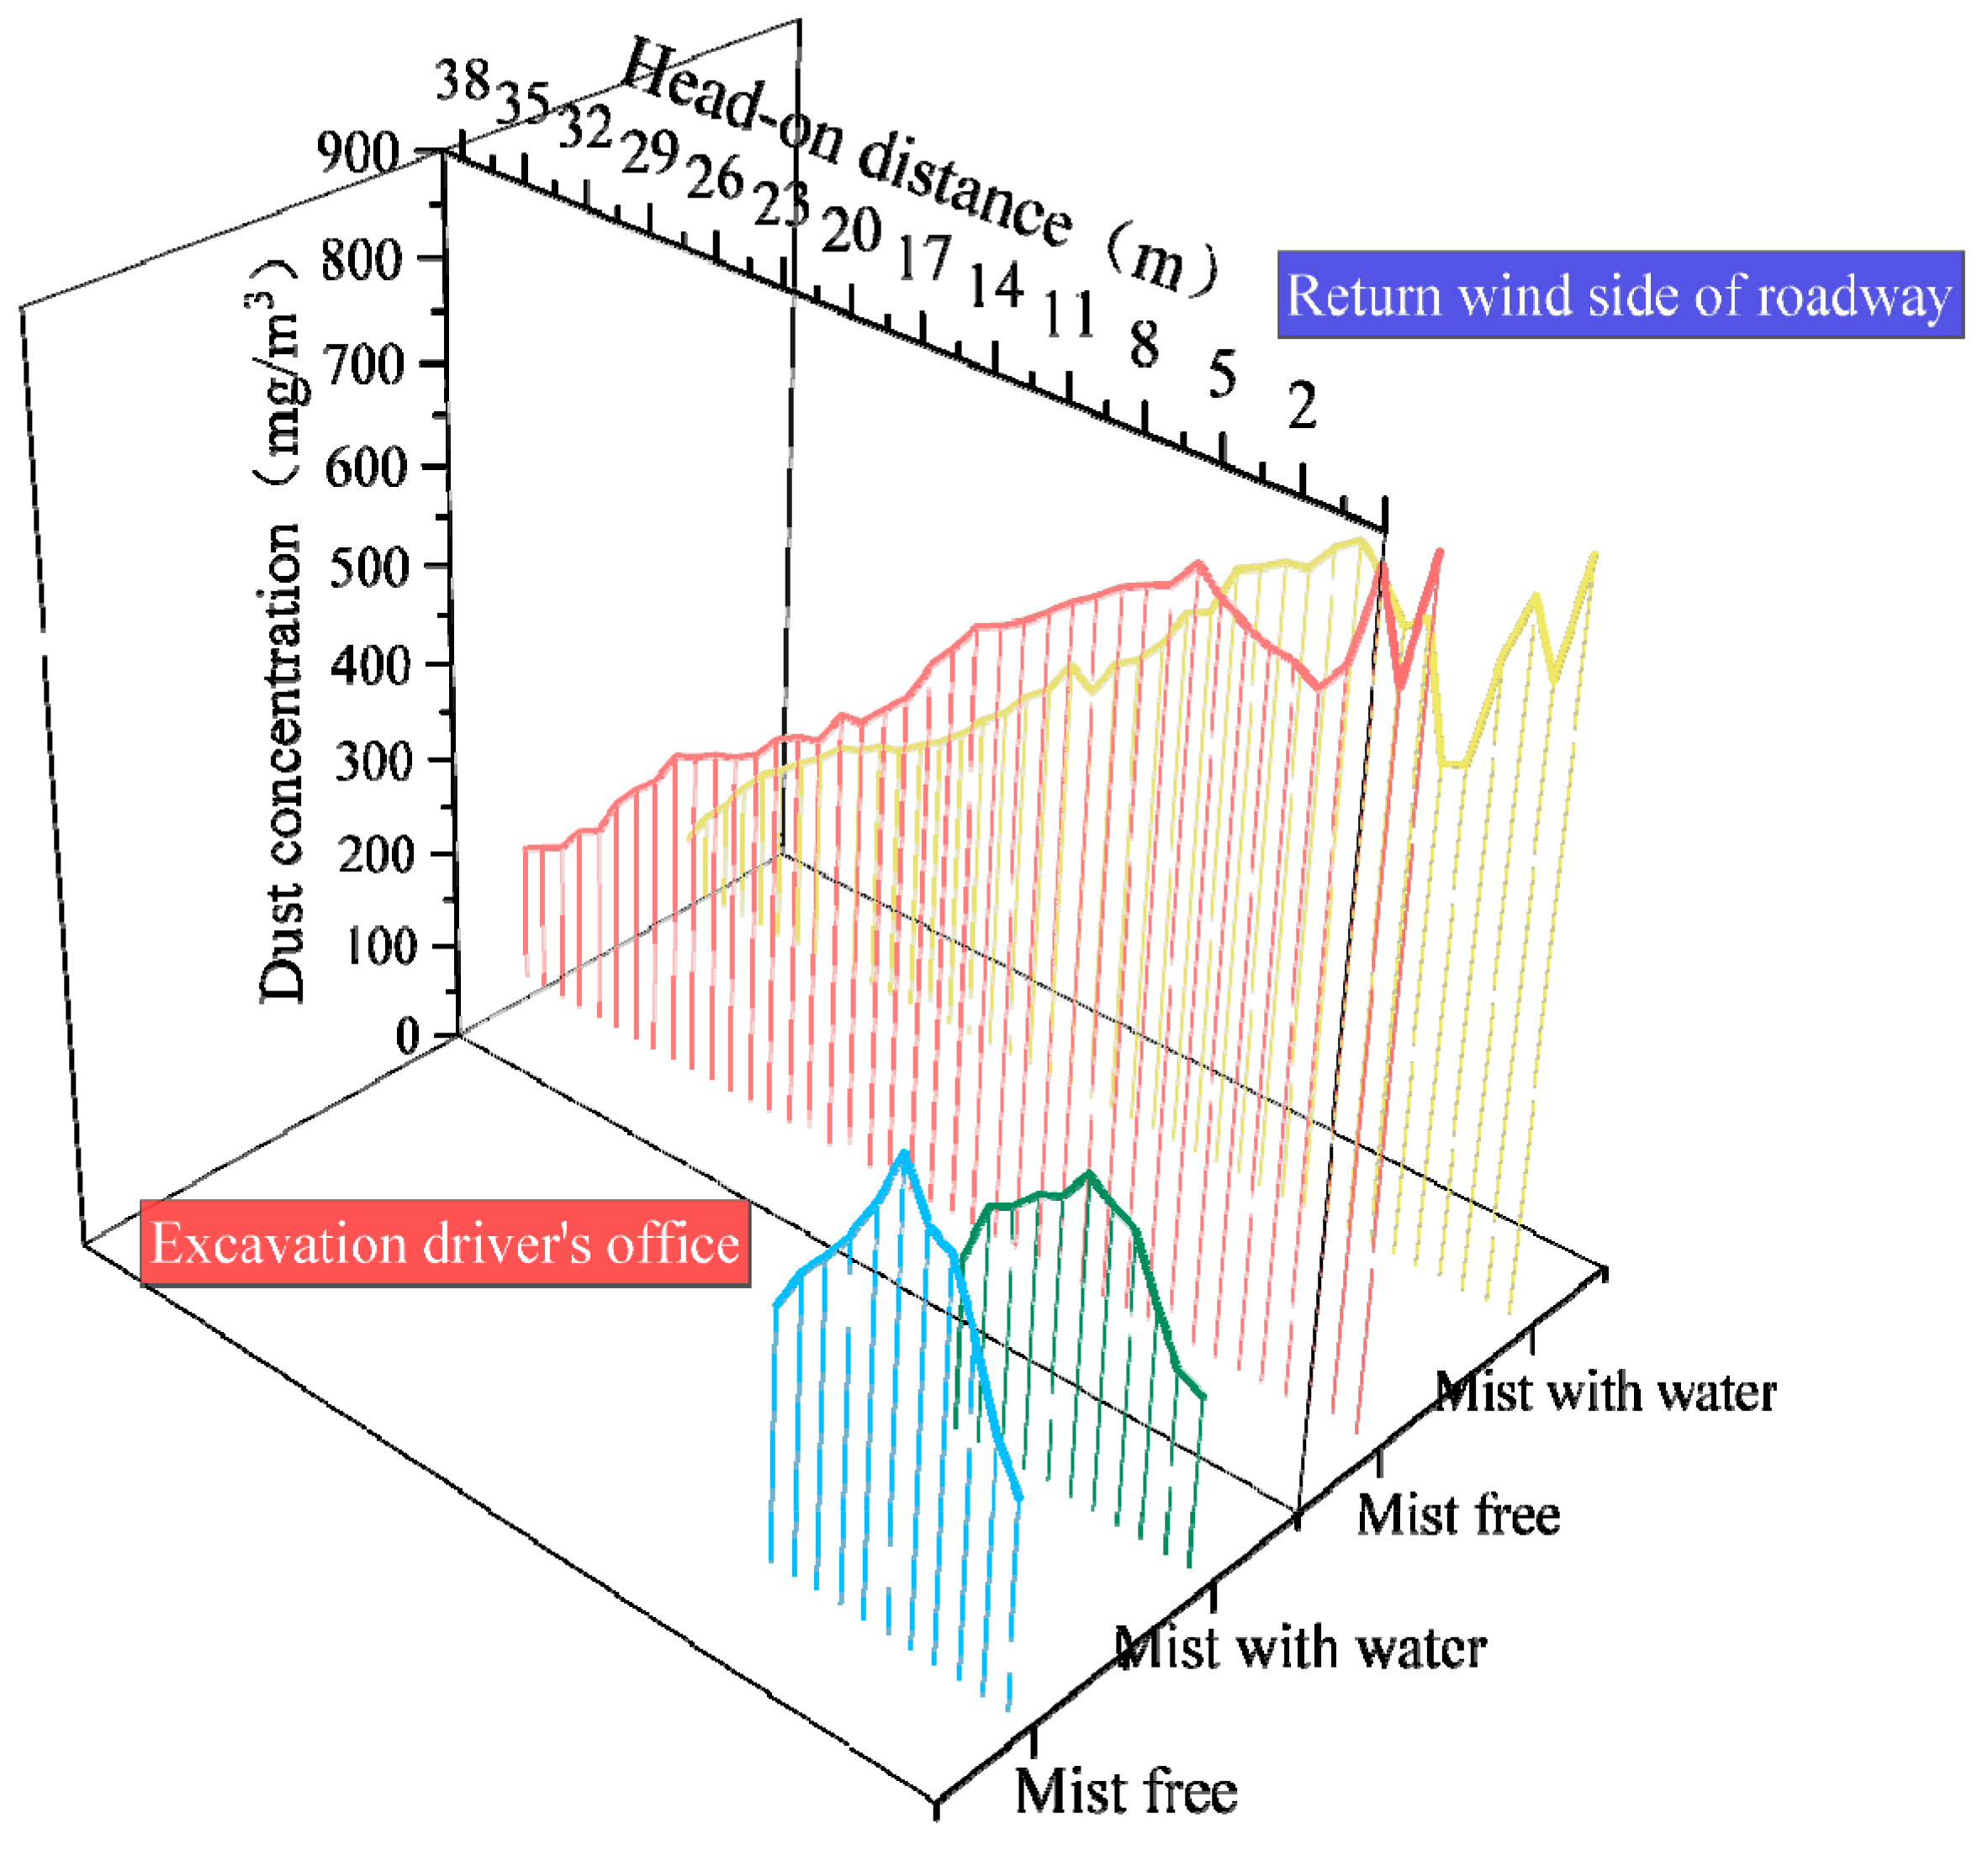
6.2. Dust Concentration Measured on Site

The field-measured data on dust concentration data were used to draw concentration distribution curves showing how dust spreads to the mining driver’s position and the return air side at different dust source points in the absence of water mist, as shown in Figure 10.
As Figure 10 shows, the overall trend in dust concentration at the mining driver’s position is consistent, although it varies with different dust sources. At a distance of 0 m from the face, dust source point 1 exhibits the highest dust concentration at 206 mg/m3, while dust source point 5 records the lowest at 141 mg/m3. As the distance from the face increases, dust concentration gradually rises, peaking at 5 m owing to dust accumulation from airflow backwash and eddies. At this point, dust source point 1 reaches a concentration of 457 mg/m3, and dust source point 5 hits 366 mg/m3. Starting from 5 m, the dust concentration begins to decrease, reaching a low at 10 m. At this distance, dust source point 1 registers 252 mg/m3, while dust source point 5 measures 195 mg/m3.
The dust concentration at the return air side of the comprehensive mining face roadway consistently decreases across various dust source points. At a distance of 0 m from the face, dust source point 1 reaches its highest concentration at 837 mg/m3. As the distance from the face increases, dust concentrations differ owing to airflow and turbulence, especially within 1 to 10 m from the face. Dust source point 1 peaks at 837 mg/m3 at 0 m from the face, while dust source point 2 reaches a maximum of 810 mg/m3 around 2 m from the face. Dust source point 3 hits its maximum concentration of 752 mg/m3 around 5 m from the face, while that produced at dust source point 4 peaks at 745 mg/m3 around 1 m from the face. Dust source point 5 reaches the maximum concentration at 724 mg/m3 at 3 m from the face. Beyond 10 m from the face, the dust concentration begins to decrease similarly across all points, reaching a minimum of 40 m from the face.
In summary, in the actual field dust measurements, dust source point 1 showed higher dust concentrations compared to other points, whether at the mining driver’s position or the return air side. To further explore how the location of dust sources affects dust spread and movement in the mining face roadway, we examined dust distribution when water mist was added. After organizing the collected dust data, the comparison curve of dust concentration at dust source point 1 was obtained, as shown in Figure 11.
Figure 11 demonstrates that the overall average dust concentration at the fully mechanized tunneling driver is reduced by 94.2 mg/m3 compared to using only airflow. At a distance of 2 m from the face, the dust concentration is reduced from the original 328 mg/m3 to 231 mg/m3, a decrease of 97 mg/m3. At a distance of 5 m from the face, the dust concentration is reduced from 457 mg/m3 to 320 mg/m3, a decrease of 136 mg/m3. After adding water mist, the dust concentration is significantly reduced. Using water mist significantly reduces dust concentration at the return air side of the mining roadway compared to using only airflow. From 10 m to 25 m away from the face, dust levels notably drop from 659 mg/m3 at 10 m to 342 mg/m3, marking a reduction of 317 mg/m3. Between 30 m and 40 m from the face, the reduction continues but at a slower pace, decreasing from 264 mg/m3 to 57 mg/m3, a reduction of 207 mg/m3. This slower reduction in later sections is attributed to most dust particles being absorbed earlier by the exhaust duct and water mist. Only a small portion of the lighter dust particles continues to diffuse backward along the tunnel airflow, eventually being absorbed and settling.

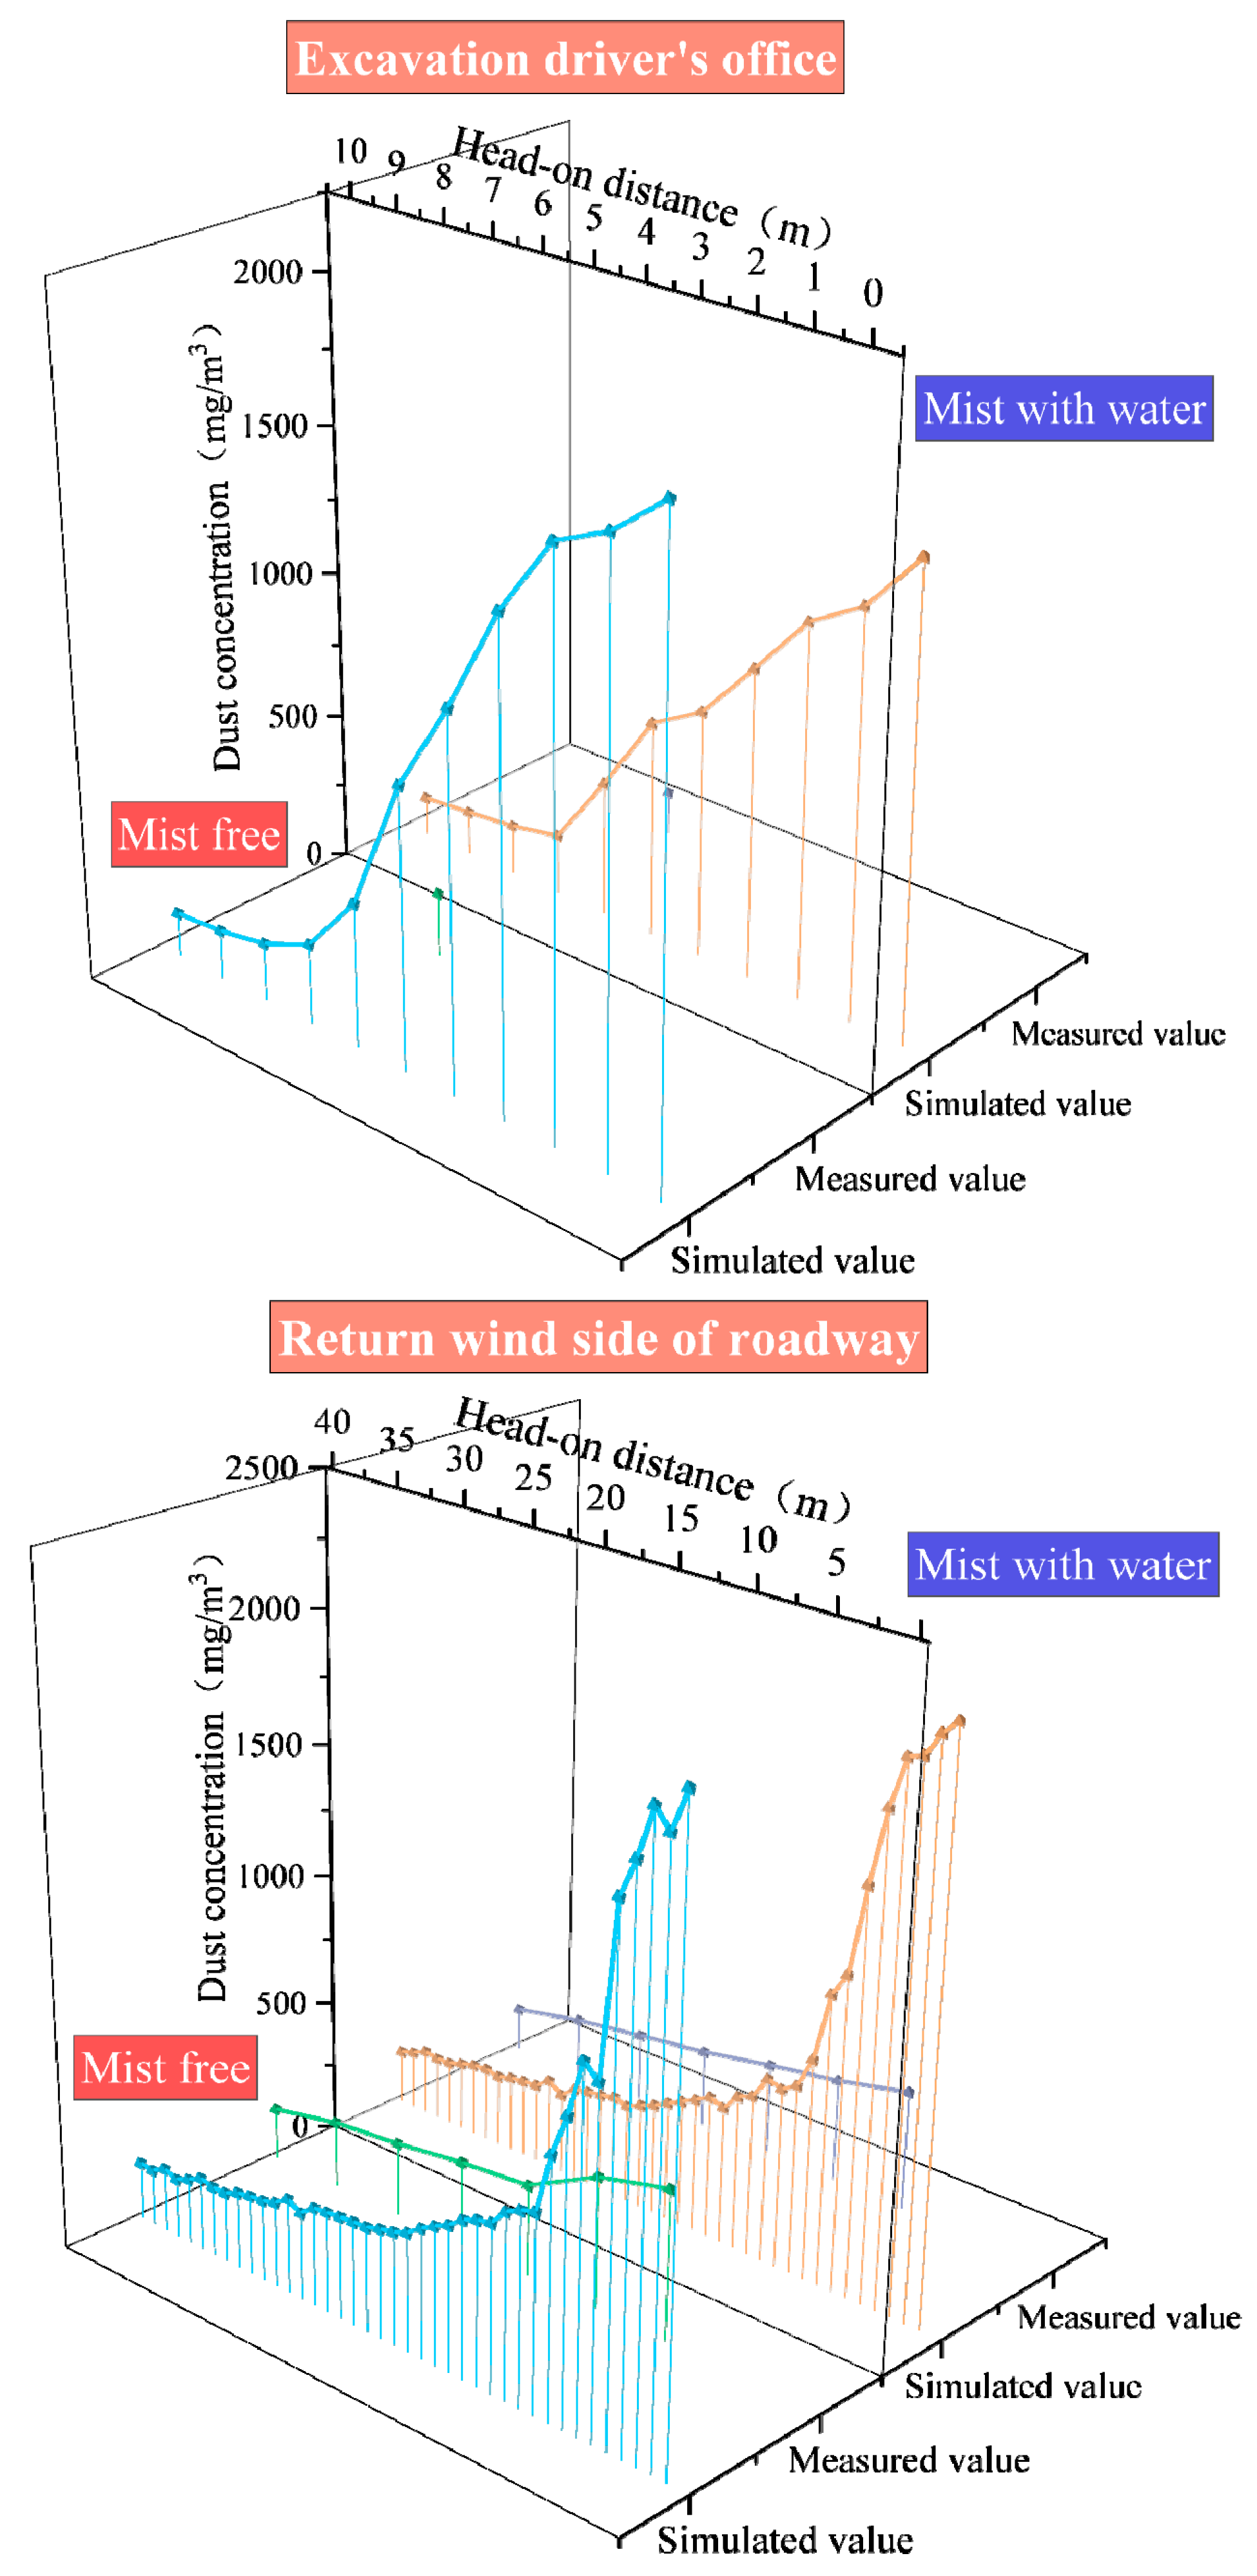
6.3. Comparison between Numerical Simulation Results and Measured Data

Comparing field-measured dust concentration distribution characteristics with simulation results helps verify the accuracy of the simulation method. Figure 12 illustrates the differences in dust concentration at the mining driver’s position and the return air side, both with and without the use of water mist.
From Figure 12, the dust concentration measured at the position of the mining driver reached 217 mg/m3, while the simulated dust concentration is 270 mg/m3. After introducing water mist, the concentration is significantly reduced to 151 mg/m3. The change trend of the simulated value and the measured value on the return air side of the roadway is basically the same before and after adding water mist. In general, the trend of the simulated value is close to the field measured value, but there are reasonable errors in some areas. There are two reasons for this phenomenon: first, the dense personnel and equipment on site hinder the movement of dust, resulting in errors. Second, the calculation model is partially simplified, resulting in some differences from the actual situation. Within the allowable error range, the simulated value is in good agreement with the measured data, confirming the accuracy of the established model and the feasibility of the selection of the simulation method.

7. Conclusions

(1)
Using the long-pressure and short-suction ventilation method significantly influences dust suppression and collection. The movement characteristics of the air flow can be divided into three areas, namely vortex area, jet area and backflow area. The distribution pattern of the dust field is significantly influenced by changes in dust source points under the action of airflow. Dust source points 1 and 2 are located lower on the cutting face, where the airflow velocity is lower, and the excavator body hinders dust diffusion. This results in higher dust concentrations at the mining driver’s position and the return air side. The dust concentration at dust source point 2 is lower than that at dust source point 1. Conversely, dust source points 3 and 4 are located higher on the cutting face, where increased airflow velocity is higher, and the excavator body hinders dust diffusion, resulting in relatively lower dust concentrations. Dust source point 5 is most affected by airflow and the exhaust duct, benefiting from dust removal of the long-pressure and short-suction ventilation method. Simulations show that when water mist is applied to dust source point 1, dust and mist droplet concentrations decrease with distance. By t = 60 s, most of the dust and mist droplets are captured. Only a small portion of dust remains, moving irregularly in a vortex owing to the absence of airflow, before eventually settling down and being captured by the exhaust duct.
(2)
By comparing the field data and numerical simulation results, the variation trends in the on-site measurement and simulation results of dust concentration along the fully mechanized tunneling roadway are similar and correlated. This further verifies the accuracy of the simulation results and provides certain guidance for the practical application of water mist on site, thus effectively improving the underground working environment of coal mines, ensuring the health of workers, and further promoting the sustainable development of the coal industry.
(3)
This paper focuses on two factors affecting dust diffusion: water mist and dust source points, but does not analyze factors such as air leakage from air ducts. Therefore, the factors affecting dust distribution should be comprehensively considered and further studied in future research.

Author Contributions

Methodology, J.W.; numerical simulation, B.W.; resources, J.W. and B.W.; writing—review and editing, J.G. All authors have read and agreed to the published version of the manuscript.

Funding

This research was funded by The National Natural Science Foundation of China (No. 51904231).

Institutional Review Board Statement

Not applicable.

Informed Consent Statement

Not applicable.

Data Availability Statement

Date are contained within the article.

Conflicts of Interest

The authors declare no conflicts of interest.

References

  1. Zhou, G.; Duan, J.; Sun, B.; Jing, B.; Kong, Y.; Zhang, Y.; Ni, G.; Sun, L. Numerical Simulation of Dust Migration Law at Fully Mechanized Excavation Face of Rock Roadway with Forced Ventilation Based on DPM. Saf. Coal Mines 2016, 47, 190–193. [Google Scholar]
  2. Zheng, L.; Li, D.; Song, S.; Wang, H.; Sui, J. Study on the regional atomized dust suppression technological system based on the measured law of dust concentration distribution in longwall fully mechanized mining faces. Environ. Dev. Sustain. 2021, 24, 3110–3125. [Google Scholar] [CrossRef]
  3. Wu, B.; Yu, Z.; Zhou, Y.; Guo, Z.; Jiang, Z. Reasonable Selection of Dusting Method and Its Application in Changcun Comprehensive Drivaging Face. Saf. Environ. Eng. 2014, 21, 98–103. [Google Scholar]
  4. Huang, L. Study on dust control technology of fully mechanized driving face in hard-to-wet and outburst. J. Appl. Sci. Eng. Innov. 2020, 7, 201–205. [Google Scholar]
  5. Li, Z.; Ma, S.; Zhang, H. Study on Dust Distribution Rule Affected by Dust Source in Fully Mechanized Heading Face. Coal Sci. Technol. 2020, 39, 136–139. [Google Scholar]
  6. Hu, S.; Liao, Q.; Feng, G.; Huang, Y.; Shao, H.; Fan, Y.; Ye, Y. Numerical study of gas-solid two-phase flow around road-header drivers in a fully mechanized excavation face. Powder Technol. 2018, 344, 959–969. [Google Scholar]
  7. Yin, W.; Zhou, G.; Gao, D. Simulation analysis and engineering application of distribution characteristics about multi-stage atomization field for cutting dust in fully mechanized mining face. Adv. Powder Technol. 2019, 30, 2600–2615. [Google Scholar]
  8. Heng, Z. Study on Dust Distribution Rule Affected by Dust Source and Dust Reduction Measures in Fully Mechanized Heading Face. Bachelor’s Thesis, Xi’an University of Science and Technology, Xi’an, China, 2019. [Google Scholar]
  9. Yang, Z.; Wang, Y. Numerical simulation of dust and spray coupling under wet dust removal condition in fully mechanized excavation face. Saf. Coal Mines 2021, 52, 170–175. [Google Scholar]
  10. Nie, W.; Liu, F.; Xu, C.; Peng, H.; Zhang, H.; Mwabaima, F.I. Study on the optimal parameter range of droplet-wrapped respirable dust in spray dust fall by mesoscopic method. Environ. Res. 2022, 214, 114035. [Google Scholar] [CrossRef]
  11. Wang, X. Study on Characteristics and Numerical Simulation of Spray Atomization in Underground Coal Mines. Bachelor’s Thesis, Anhui University of Science and Technology, Chuzhou, China, 2020. [Google Scholar]
  12. Zhao, B.; Xiao, P.; Li, S.; Liu, X.; Lin, H.; Yan, D.; Chen, Z.; Chen, L. Study on the influence pattern and efficiency enhanced mechanism of acoustic-chemical spray dust reduction. Sci. Total Environ. 2023, 900, 165913. [Google Scholar] [CrossRef]
  13. Hao, T.; Wang, L.; Wang, Z.; Li, F.; Jiang, W.; Jiang, S. Research on Dust Migration and Dust Deposition Rules of Breathing Zone in Fully Mechanized Mining Face. ACS Omega 2023, 8, 39143–39153. [Google Scholar] [CrossRef]
  14. Gong, X.; Zhao, X.; Yang, F.; Liu, H.; Feng, X.; Song, T.; Chen, F. Wind flow control for optimization of dust field distribution under. Coal Eng. 2021, 53, 122–126. [Google Scholar]
  15. Zhang, Y.; Xu, X.; Jiang, W.; Yao, L. Wan Influence of dust source location in fully-mechanized excavation face on location of negative pressure suction opening. J. China Saf. Sci. 2021, 31, 147–155. [Google Scholar]
  16. Chang, P.; Xu, G.; Zhou, F.; Mullins, B.; Abishek, S.; Chalmers, D. Minimizing DPM pollution in an underground mine by optimizing auxiliary ventilation systems using CFD. Tunn. Undergr. Space Technol. Inc. Trenchless Technol. Res. 2019, 87, 112–121. [Google Scholar] [CrossRef]
  17. Chen, L.; Liu, G. Airflow-Dust Migration Law and Control Technology Under the Simultaneous Operations of Shotcreting and Drilling in Roadways. Arab. J. Sci. Eng. 2019, 44, 4961–4969. [Google Scholar] [CrossRef]
  18. Jiang, W.; Xu, X.; Wen, Z.; Wei, L. Applying the similarity theory to model dust dispersion during coal-mine tunneling. Process Saf. Environ. Prot. 2021, 148, 415–427. [Google Scholar] [CrossRef]
  19. Jing, D.; Jia, X.; Ge, S.; Zhang, T.; Ma, M. Numerical simulation and experimental study of vortex blowing suction dust control in a coal yard with multiple dust production points. Powder Technol. 2021, 388, 554–565. [Google Scholar] [CrossRef]
  20. Ren, T.; Wang, Z.; Cooper, G. CFD modelling of ventilation and dust flow behaviour above an underground bin and the design of an innovative dust mitigation system. Tunn. Undergr. Space Technol. Inc. Trenchless Technol. Res. 2014, 41, 241–254. [Google Scholar] [CrossRef]
  21. Xia, Y.; Yang, D.; Hu, C.; Wu, C.; Han, J. Numerical simulation of ventilation and dust suppression system for open-type TBM tunneling work area. Tunn. Undergr. Space Technol. Inc. Trenchless Technol. Res. 2016, 56, 70–78. [Google Scholar] [CrossRef]
  22. Xiu, Z.; Nie, W.; Chen, D.; Yan, J.; Cai, P.; Liu, Q.; Wei, C. Numerical simulation study on the coupling mechanism of composite-source airflow–dust field in a fully mechanized caving face. Powder Technol. 2019, 356, 443–457. [Google Scholar] [CrossRef]
  23. Zhou, G.; Feng, B.; Yin, W.; Wang, J. Numerical simulations on airflow-dust diffusion rules with the use of coal cutter dust removal fans and related engineering applications in a fully-mechanized coal mining face. Powder Technol. 2018, 339, 354–367. [Google Scholar] [CrossRef]
  24. Zhou, G.; Zhang, Q.; Hu, Y.; Gao, D.; Wang, S.; Sun, B. Dust removal effect of negatively-pressured spraying collector for advancing support in fully mechanized coal mining face: Numerical simulation and engineering application. Tunn. Undergr. Space Technol. Inc. Trenchless Technol. Res. 2020, 95, 103149. [Google Scholar] [CrossRef]
  25. Zhang, Q.; Zhou, G.; Qian, X.; Yuan, M.; Sun, Y.; Wang, D. Diffuse pollution characteristics of respirable dust in fully-mechanized mining face under various velocities based on CFD investigation. J. Clean. Prod. 2018, 184, 239–250. [Google Scholar] [CrossRef]
Figure 1. Roadway equipment layout and dust source location diagram of the excavation face.
Sustainability 16 08523 g001
Figure 2. Grid division diagram.
Sustainability 16 08523 g002
Figure 3. Air flow diagram of roadway.
Sustainability 16 08523 g003
Figure 4. Wind velocity vector diagram of the XY section of roadway.
Sustainability 16 08523 g004
Figure 5. Dust concentration distribution of different dust source points in the driving roadway of the fully mechanized excavation face.
Sustainability 16 08523 g005
Figure 6. Dust concentration distribution of different YZ sections on the fully mechanized excavation face.
Sustainability 16 08523 g006
Figure 7. Migration trajectory of dust–mist over time.
Sustainability 16 08523 g007
Figure 8. Dust concentration distribution of the XY section of the roadway.
Sustainability 16 08523 g008
Figure 9. Layout of roadway measuring points and distribution map of dust source points.
Sustainability 16 08523 g009
Figure 10. Dust concentration distribution curves at different dust source points influenced by ventilation.
Sustainability 16 08523 g010
Figure 11. Comparison curve of dust concentration at source point 1 influenced by water mist.
Sustainability 16 08523 g011
Figure 12. Comparison curve of dust concentration in integrated excavation roadway.
Sustainability 16 08523 g012
Table 1. Parameter settings of the discrete phase model.
Discrete Phase ModelDefine
Drag lawSpherical
Injection typeSurface
MaterialCoal-hv
Diameter distributionRosin–Rammler
Min. diameter1 × 10−6 m
Max. diameter1 × 10−4 m
Mean diameter1 × 10−5 m
Velocity10 m/s
Spread parameter1.46
Total flow rate0.01 kg/s
Turbulent dispersionDiscrete random walk model
Table 2. Spray parameter settings.
InjectionDefine
Injection typePressure-swirl-atomizer
Density998.2 kg/m3
Flow rate0.268 kg/s
Injector inner diameter0.002 m
Spray angle30°
Upstream pressure1 MPa
Number of streams100
Disclaimer/Publisher’s Note: The statements, opinions and data contained in all publications are solely those of the individual author(s) and contributor(s) and not of MDPI and/or the editor(s). MDPI and/or the editor(s) disclaim responsibility for any injury to people or property resulting from any ideas, methods, instructions or products referred to in the content.

