Article

Lego-like Bricks Manufacturing Using Recycled Polyethylene (PE) and Polyethylene Terephthalate (PET) Waste in Egypt

Construction and Building Department, College of Engineering, Arab Academy for Science and Technology, Cairo 12577, Egypt
*
Author to whom correspondence should be addressed.
Sustainability 2024, 16(19), 8567; https://doi.org/10.3390/su16198567
Submission received: 28 August 2024 / Revised: 23 September 2024 / Accepted: 30 September 2024 / Published: 2 October 2024

Abstract

:
Plastics are essential in modern civilization due to their affordability, simple manufacturing, and properties. However, plastics impact the environment as they decompose over a long period and degrade into microplastics. The construction sector has been exploring substituting conventional bricks with plastic bricks, as concrete and clay bricks consume natural resources and pollute the environment. The introduction of recycling plastic, and using plastic waste and sand mixtures to create Lego-like bricks has become a new trend. The bricks have superior properties to conventional bricks, such as a smoother surface, finer edges, easy application, crack-free, higher compression strength, almost zero water absorption, and reduced energy consumption. The study: compares the results of PE with sand and PET with sand samples to previous studies, confirms alignment, works as a control sample for PET and PE novel research, and validates the concept. Three plastic mixtures using two types of plastic waste (PE and PET) and sand were used. The plastic waste with sand was heated up to 200 °C. Plastic acts as a binder, while sand acts as a filler material. Optimized durability and cohesiveness were achieved at 30–40% plastic weight ratios. A mixture of PE and sand showed a maximum compressive strength of 38.65 MPa, while the PET and sand mixture showed 76.85 MPa, and the mix of PE and PET in equal proportions with sand resulted in 26.64 MPa. The plastic samples showed ductile behavior, with elongation between 20 and 30%, water absorption between 0 and 0.35%, and thermal conductivity from 0.8 to 1.05 W/(m/K). Carbon dioxide emissions are significantly reduced as compared to standard bricks. The CO2 per brick (kg) was 0.008 and 0.0085 in the PE; 0.0085 and 0.009 in the PET; and 0.0065 and 0.007 in the PE mixed with PET.

1. Introduction

Egypt’s population has recently increased significantly, resulting in an increasing consumption and waste generation rate. The problem is exacerbated by inadequate waste collection and the lack of proper recycling technology. Plastic waste is a major environmental problem that can harm human health and represents approximately 13% of the total solid waste generated in Egypt [1]. Most waste is not recyclable and cannot be used or decomposed. The issue is an increase in waste and the excessive use of natural resources and their impact on the environment, such as clay, cement, gravel, and fresh water, because they are the dominant raw materials in brick manufacturing.
Most plastic waste is not recyclable, and the remaining plastic cannot be used or consumed because it takes 20–300 years to degrade [2]. The large amount of waste generated by plastic use and disposal is a major environmental concern that affects both human populations and biological systems. Polymers or plastics are non-biodegradable hydrocarbons that consist of thermoplastics such as polyethylene (PE), polyethylene terephthalate (PET), and thermosets, which are non-recyclable resins like tires. PE and PET have several uses, such as packaging food, bottles, and beverages [3]. It is a major environmental problem because it ends up in waterways and oceans. Some estimates suggest that by 2050, there will be more plastic debris than fish [4].
Egypt produces 28 million tons of municipal solid waste (MSW) per year, with per capita production ranging from 0.75 to 1.25 kg/day, and the annual rate of waste generation increases by nearly 4% [5]. As the population grows, the amount of MSW produced will more than double unless action is taken. The collection and transportation efficiencies are 62% [6], resulting in daily waste accumulation and exposure to citizens. Unsafe recycling operations threaten both citizens and employees.
According to the Egyptian Environmental Affairs Agency (EEAA) 2020 report [6], MSW accounted for 23.5% of the total waste generated. In addition to the most recent governmental statistics, open dumps account for 81% of MSW management methods in Egypt, compared to a low percentage of 12% for recycling and only 7% for landfills.
Non-degradable plastic bags harm the Nile River, marine life [7], and surrounding areas, affecting tourism, diving activities, and animal and human health [8]. There are also toxic emissions resulting from the burning of certain types of materials, which in turn contribute negatively to climate change. Scientific evidence has proven that plastics generate greenhouse gases (GHGs) at every stage of their life cycle [9].
According to the EEAA emissions report, the cement industry emits many dangerous pollutants that significantly impact human health and the environment. The cement sector contributes approximately 7% of carbon dioxide (CO2) emissions [10], in addition to the emission of several dangerous gases, such as sulfur dioxide (SO2), nitrogen oxide (NO), and total suspended particles. Because most of these emissions are above the allowable limit for the environment, the situation will worsen if not well addressed [11].
Gravel is a natural, non-renewable resource for the environment, and an alternative solution for brick manufacturing is available that produces equal results and should be investigated. In addition, clay is a natural resource in the environment and must be preserved because it is suitable for agriculture and directly affects agriculture over the long term. Clearing agricultural land for brick manufacturing destroys soil balance, threatening plants, animals, and human life. According to the United Nations International Children’s Emergency Fund (UNICEF), Egypt suffers from an annual water shortage of approximately 700 million cubic meters and may run out of water by 2025 [12]. Water use in industries must be reduced, and water conservation initiatives must be implemented.
Today’s trend is to focus on recycling because Egypt is a third-world country and the economic crises that are facing the country are due to population incensement. The EEAA is working on initiatives to encourage people to recycle plastics. The use of plastic as a construction material has proven its efficiency; it has been used by Mohamed Abohelal et al. [13] by adding plastic waste of Low-Density Polyethylene (LDPE) with broken red brick with a percentage of 50% at a manufacturing temperature of 200 °C each to produce recycled bricks with higher efficiency in compression strength by 5.5 times compared to red brick, which was 15.58 MPa and zero water absorption, while the thermal conductivity was 0.7129 W/(m/K). Wahid et al. [14] used waste plastic bottles as fillers, crushed them into small pieces, placed them with cement blocks with plastic ratios of 0%, 5%, 10%, and 15%, and found that the compressive strength decreased as the plastic ratio increased. It was observed that the water absorption rate improved, but the strength rate decreased when compared to standard cement bricks because of the weak cement-plastic bond, as the plastic bottles were the filler material. Kameshwar Sahani et al. [15] used PE as a binder with sand in different ratios of 1:3, 1:4, and 1:5 to get a brick and found that the ratio 1:4 is the optimized strength with zero water absorption and an increase in tensile strength. J.O. Akinyele et al. [16] applied crushed PET in various ratios (0, 5, and 10%) and then compressed the bricks and put them in kilns at 900 °C for 48 h, and it was found that increasing the quantity of plastic in the bricks negatively affected the strength with recorded values of 5.15, 2.30, and 0.85 N/mm2 and reduced water absorption with 10.29, 9.43, and 6.57%, respectively.
Ali et al. [17] produced plastic-reinforced bricks using recycled plastic and combined them with cement paste in the form of pellets. Two types of plastic were used: polypropylene [PP] and PE. The results showed a 20% reduction in brick weight compared to traditional cement bricks but a decrease in compressive strength values for the two types of plastic compared to cement bricks. Agrawal et al. [18] used PET waste in different proportions with stone dust to create road paver blocks. The study proved that a ratio of 1:4 is the best in terms of the mechanical properties and quality of the mixture, which was proven using the Pulse Velocity test. Gounden et al. [19] studied the use of High-Density Polyethylene (HDPE) as a binder for a mixture containing river sand as a filler in different proportions to produce plastic bricks, then added kaolin clay to each mixture. The results showed a significant increase in the compressive strength when 5% Kaolin clay was added to a mixture consisting of 75% sand and 25% plastic. Krishnan et al. [20] added fine glass waste and plastic waste to the clay brick mixture with alkaline activators (sodium silicate and sodium hydroxide). The results proved that the mixture could achieve the minimum specifications required for building bricks. Tulashie et al. [21] wanted to solve two problems facing Ghana: high cement prices and environmental pollution resulting from plastic. Accordingly, different types of plastic were used: HDPE, LDPE, and PP with quarry dust (QD) in different proportions. The best mixture in terms of compressive strength and water absorption was 40% HDPE and 60% QD. Koppula et al. [22] manufactured bricks composed of a mixture of HDPE with quartz sand and bitumen and proved that the bricks made from this mixture gave a compressive strength of 37.5 MPa without any water absorption, with less weight and cost compared to traditional bricks.
In the next sections, there is a detailed discussion regarding the material selection criteria and the testing methods, followed by the results and discussion, and finally, the conclusion and future work recommendation. The research’s main concern is the physical and mechanical properties regarding the change in plastic percentage in the samples. Knowing that the PE with sand and PET with sand samples, which are similar to those of previous studies, act as control samples and compare their results to the mix of PET and PE with sand samples to ensure alignment, which is the main focus for its novelty.

2. Research Significance and Knowledge Gap

In Egypt, there is mismanagement of plastic waste, resulting in significant accumulations in random dumps or sanitary landfills without being recycled or recovered optimally. The Egyptian construction market is considered rigid and inflexible, making it difficult to convince contractors to change the usual building materials. However, considering the existence of environmental law and the solid waste management law emerging from it, the articles of which stipulate the necessity of submitting an environmental impact assessment report for any project, it was necessary to find new building materials aiming at sustainability and not wasting natural resources and the necessity of finding actual solutions for solid waste produced from various activities and industries. Following this, this research mainly aims to manage one of the wastes that represent a large burden on the environment, plastic, and use it to produce a product made by degrading natural resources, clay, or cement brick.
A control sample of PE with sand only, and PET with sand only are used to: compare their results with those of previous studies, confirm if the results align with those of previous studies, use them as a baseline for subsequent work, and confirm the hypothesis. It was concluded from the literature that a new mixture consisting of PE and PET can be used as a binder, whereas sand is used as a filler. Samples of PE with sand and PET with sand will be made to compare their results to those of similar samples from previous studies. Then, new samples will be manufactured by mixing PET and PE with sand to create a new brick. The research objectives are summarized as follows:
  • Recycling plastic waste (PE and PET) into eco-friendly Lego bricks can help reduce the amount of microplastics in the environment.
  • Reducing factory emissions from kilns and cement, and preserving environmental natural resources such as clay, gravel, and the scarcest water by introducing Lego-like bricks that are made of plastic waste as a substitute for conventionally used bricks.
  • Selecting and designing the operating temperature of the new mixture is considered difficult due to PET and PE having different melting points, and this is essential to achieve the optimized adhesive bond. Mixing two different types of plastics has never been studied. However, it is considered a good idea to use multiple types of plastic waste to decrease sorting time as there is no need to remove the bottle labels or caps from it (as the bottle is made from PET and the label and cap are made from PE), which will lead to a reduction in separation and sorting costs.

3. Materials and Methods
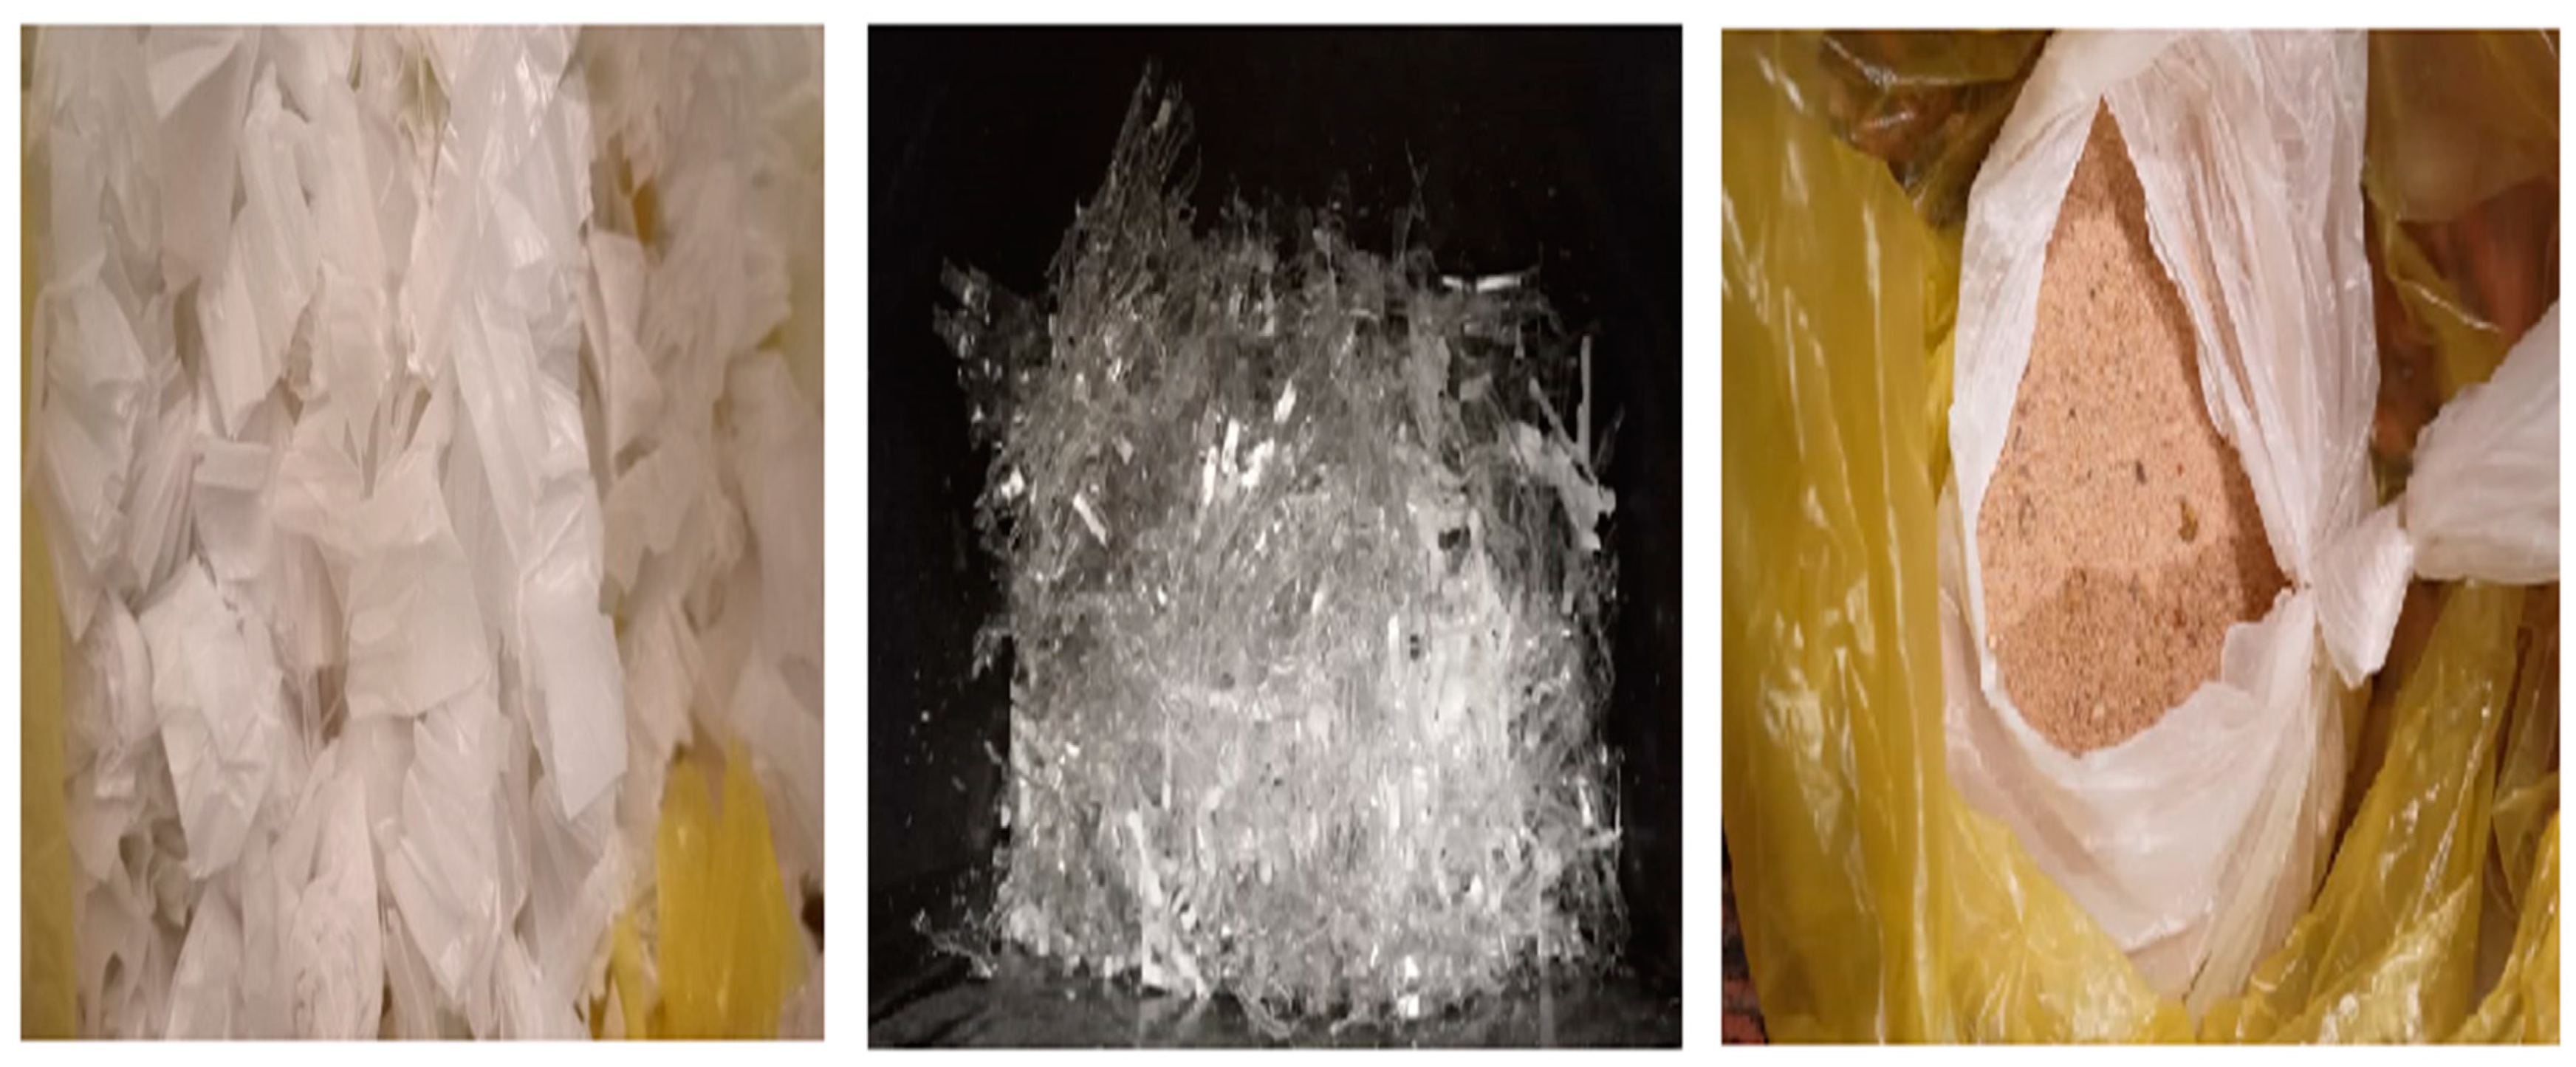
3.1. Materials

Two types of plastics were chosen to set three main categories of samples, PE, PET as control samples, and a mixture of both as a novel work, which were used with sand to manufacture building bricks. The sources relied upon for the materials used were waste PE bags and PET transparent water bottles after removing the covers and labels, as shown in Figure 1. Natural sand with sizes passing through a 1.18 mm sieve and retained on a 0.60 mm sieve was used, and the size was fixed to act as a control variable. Sand contains many oxides in its chemical composition, such as silicon dioxide (SiO2), aluminum oxide (Al2O3), iron oxide (Fe2O3), calcium oxide (CaO), and magnesium oxide (MgO), as well as minerals, such as feldspar and quartz. However, the specific chemical composition of the sand used remained undetermined, as it had not yet been subjected to analytical examination. Knowing that it is a dry mixture, the occurrence of a chemical reaction was not expected. The specific gravity of the sand was 2.67, bulk density 1608 kg/m3, and fineness modulus 2.87, while the density of PET plastic is 1.38 g/cm3, whereas the density of PE plastic is greater than or equal to 0.941 g/cm3. The chemical formula of PET is ( C 10 H 8 O 4 ) n while its properties are highly flexible, colorless, and resistant to impacts. While the chemical formula of PE is ( C 2 H 4 ) n and it has high ductility, high impact strength, and low water absorption.

3.2. Specimen Details

In this study, 45 samples were tested and divided into three groups of five different mixtures, with three ratios of samples for each mixture, for a total of 15 samples per group. In the first stage, small samples were used, consisting of cylinders with a diameter of 40 mm and a height of 50 mm, as shown in Figure 2, to reduce the quantity of materials used and to determine the best mixtures in terms of compressive strength, homogeneity, water absorption, and thermal conductivity. In the second stage, the best mixtures were chosen to manufacture the Lego-like bricks, as shown in Figure 3. A 20 mm thick steel mold was used to hold the mixture.

3.3. Mixtures’ Proportioning

The components of the 15 mixtures were based on three independent variables: proportions of PE, PET, and sand. Table 1 lists the mixing ratios by weight percentage for all samples.

3.4. Samples’ Preparation

To manufacture the samples, plastic waste was first collected in the required quantities, shredded into small pieces, and sand was prepared to the required size, using a locally manufactured extrusion machine to mix the mixture, with an operating speed of 20 rpm. Sand and plastic were first mixed in a concrete mixture and then introduced to the extrusion machine. The mixture is then reheated in the same extrusion machine until the mixture between sand and plastic is completely homogenous, which is suitable and easy to pour into the molds. The operating temperature is 200 ± 20 °C. The PE with sand mixture was dough, while the PET with sand was liquid, and both the PET and PE with sand were dough. The mixture was compacted to remove trapped air, and the samples were left to cool at room temperature. Figure 4 shows the prepared components for sample casting.

3.5. Testing Procedures

Several tests were conducted on all the samples to identify their physical and mechanical properties. The unit weight, water absorption, axial compressive strength at room temperature, axial compressive strength at 40 °C and 60 °C, and thermal conductivity were measured.
All the testing procedures and evaluation of results were conducted according to the Egyptian Standard Specifications ES:4763/2006 [23] for clay bricks and ES:1292-2/2005 [24] for cement bricks, which is technically equivalent to ASTM C62-23 [25] and ASTM C129-23 [26], respectively.
The axial compression test was performed using a DX-600 kN Instron Universal Testing Machine (Instron, Norwood, MA, USA), as shown in Figure 5. Samples were prepared to test the thermal conductivity using a lathe machine to obtain rings with a diameter of 26 mm and thickness of 15 mm, as shown in Figure 6. At room temperature, the water absorption test took place, and the samples were immersed in water for 24 h using tap water, which has fair temperature; their weights were measured before and after immersion, and the absorption was calculated as a percentage of the dry weight of the samples.

3.6. Emissions

To determine the emissions from the samples, an air quality detector model: PG-L58-WF; Infrared detection technology with an infrared sensor (NDIR), Manufacturer Guangzhou Chuzheg Technology Co., Ltd. Guangdong, China, was installed at a distance of 50 cm from the heating container, and the maximum readings were recorded during the casting of each sample, allowing the emissions from the recycled plastic to be studied and subsequently compared to the emissions of the traditional brick industry.
To accurately measure the CO2 emissions, the CO2 was measured before the start of sample making and again during sample making, with the difference between them being determined.
Note: The initial CO2 was about 300 ppm, equivalent to ≈0.3 kg/m3.

4. Results and Discussion

4.1. Physical Properties

Samples of PE with sand showed a dark green color, which began to lighten and turn grey as the percentage of PE increased. PET samples with sand exhibited a dark green color at all proportions, with a smoother and more homogeneous surface. The PE and PET samples with sand exhibited a light green color with a less smooth surface than that of the PET samples.
The density of the different samples was measured by dividing the sample’s dry weight by its volume. Figure 7 shows the density values for all samples, along with the densities of two types of bricks traded in the Egyptian construction market, namely clay and cement bricks. The results show that the density decreases as the percentage of plastic increases, which applies to the two types of plastic used. Values range from 2.0 g/cm3 to 1.64, 1.39, and 1.46 g/cm3 for PE, PET, and PE & PET samples, respectively.
All mixtures yielded lower values than traditional bricks as the percentage of plastic increases, which is a good indicator from a physical standpoint for reducing loads on structures. By reviewing the relationships in Figure 8 and considering the trendline drawn using the Excel software 2023, it becomes clear that the (PE/PET/sand) samples are the lightest, and the equations extracted from the relationships can be respected as the R2 values are between 0.84 and 0.99.

4.2. Water Absorption

The water absorption of the samples was calculated as a percentage of the dry weight of the sample after being immersed in water for 24 h. The results of all plastic samples showed outstanding performance compared to traditional bricks, as the absorption percentages for all samples ranged between 0 and 0.35%, as shown in Figure 9. These results give plastic bricks an advantage in terms of efflorescence and durability. All the results were compared with the clay and cement bricks according to the Egyptian Standard Specifications ES:4763/2006 [23] for clay bricks and ES:1292-2/2005 [24] for cement bricks, which is technically equivalent to ASTM C62-23 [25] and ASTM C129-23 [26], respectively.

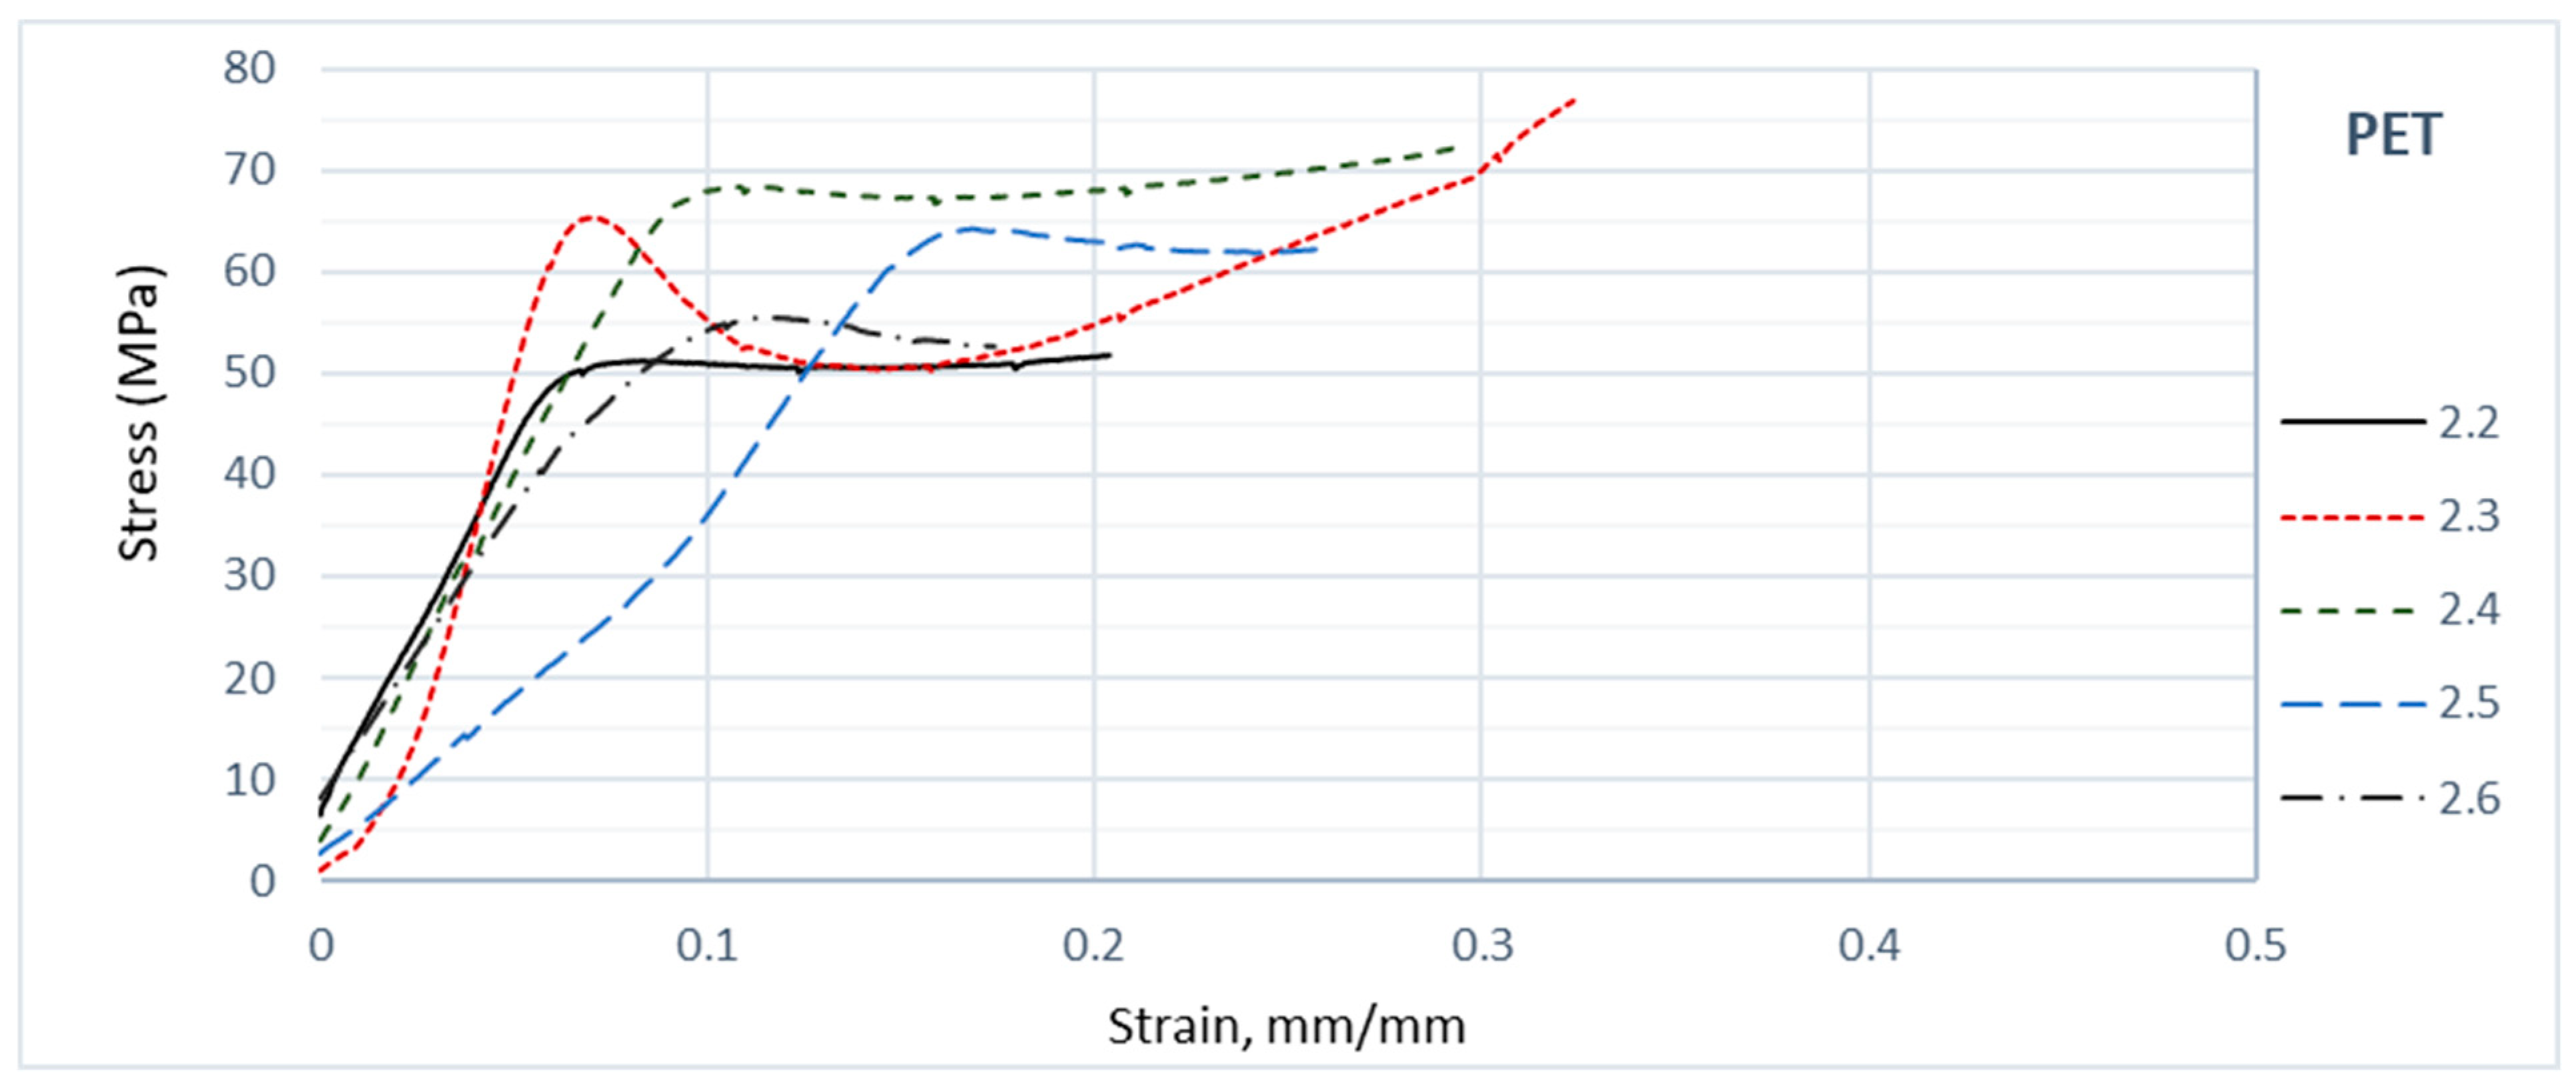
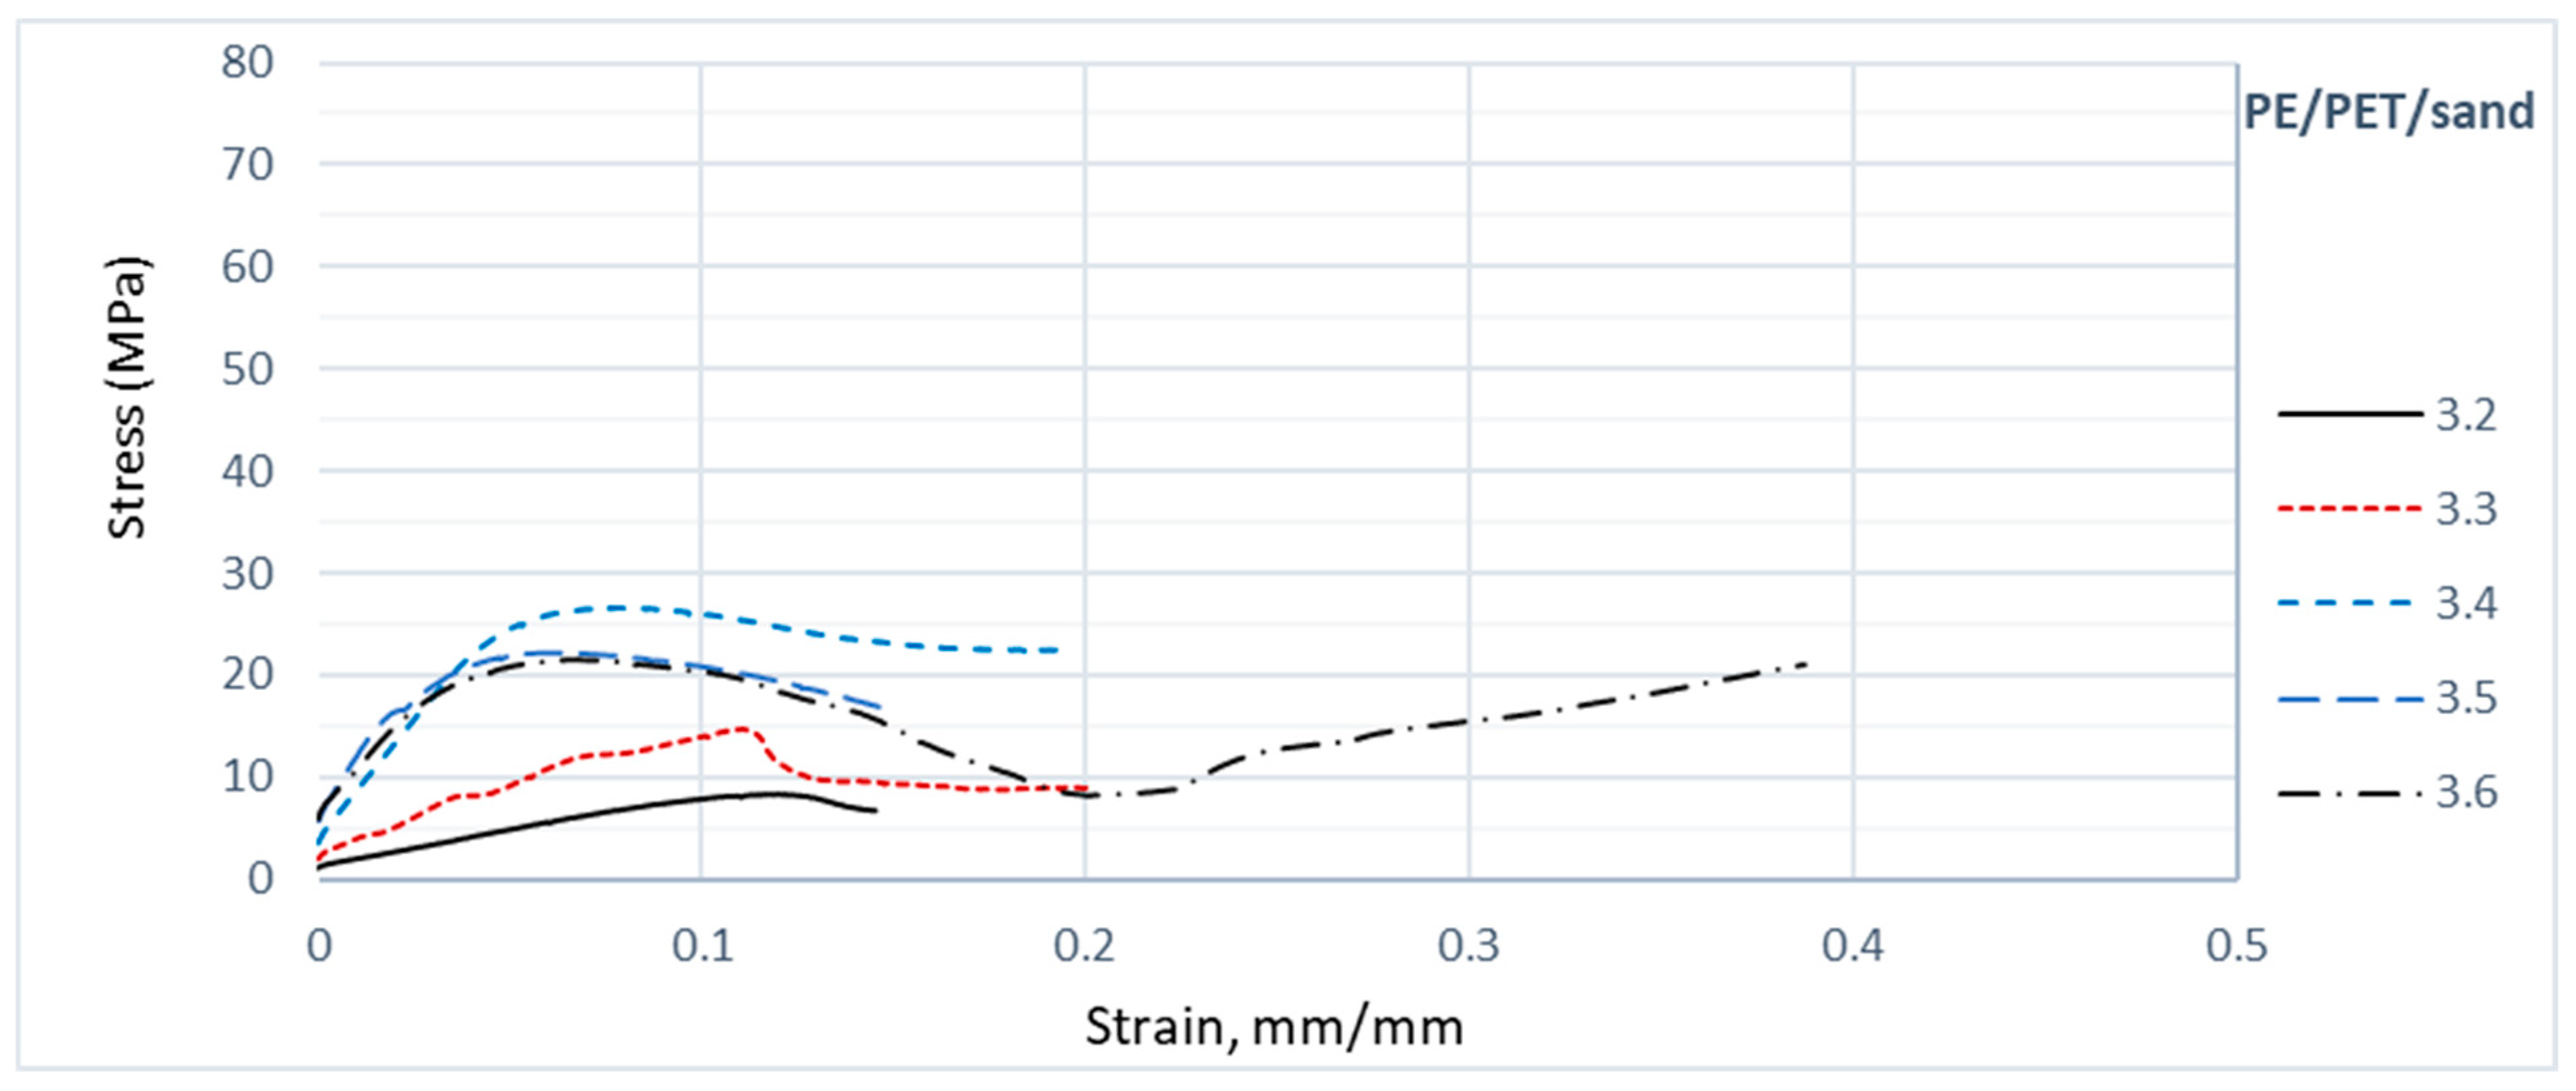
4.3. Mechanical Properties

Figure 10, Figure 11 and Figure 12 show the stress-strain relationships for all samples after an axial compression test. Reviewing the stress results, the PET samples are the highest, as their results ranged between 50 to 76 MPa. The rest of the results showed similar values for the rest of the samples, and the results ranged from 9 to 38 MPa. Looking at the strain values, which are considered a measure of the ductility of the samples, the values range between 20 to 30%, which gives the impression that the plastic bricks can be considered ductile, in contrast to the brittle nature of the clay and cement bricks. The results show that the samples exceeded the red and cement brick values by at least five times.
The study found that PE combined with sand significantly outperformed cement and red bricks, with samples 1.4 outperforming 1.5 and 1.3, and sample 1.6 having the lowest strength, as shown in Figure 10.
As shown in Figure 11, the second group, where PET was mixed with sand, showed the highest strengths of 2.3 and 2.4 samples, followed by 2.5 and 2.6.
While, as illustrated in Figure 12, the 3.4 sample with an equal mixture of PET and PE with sand had the highest strength at 26.64 MPa.
Increasing the percentage of plastic affects the strength values. Figure 13 shows the relationship between the plastic percentages and the compressive strength values for all samples. Interpreting the curves and trend lines, the optimal plastic percentage ranges between 30 and 40%. The equations given on the curves can be used, as the R2 values range between 0.74 and 0.88.

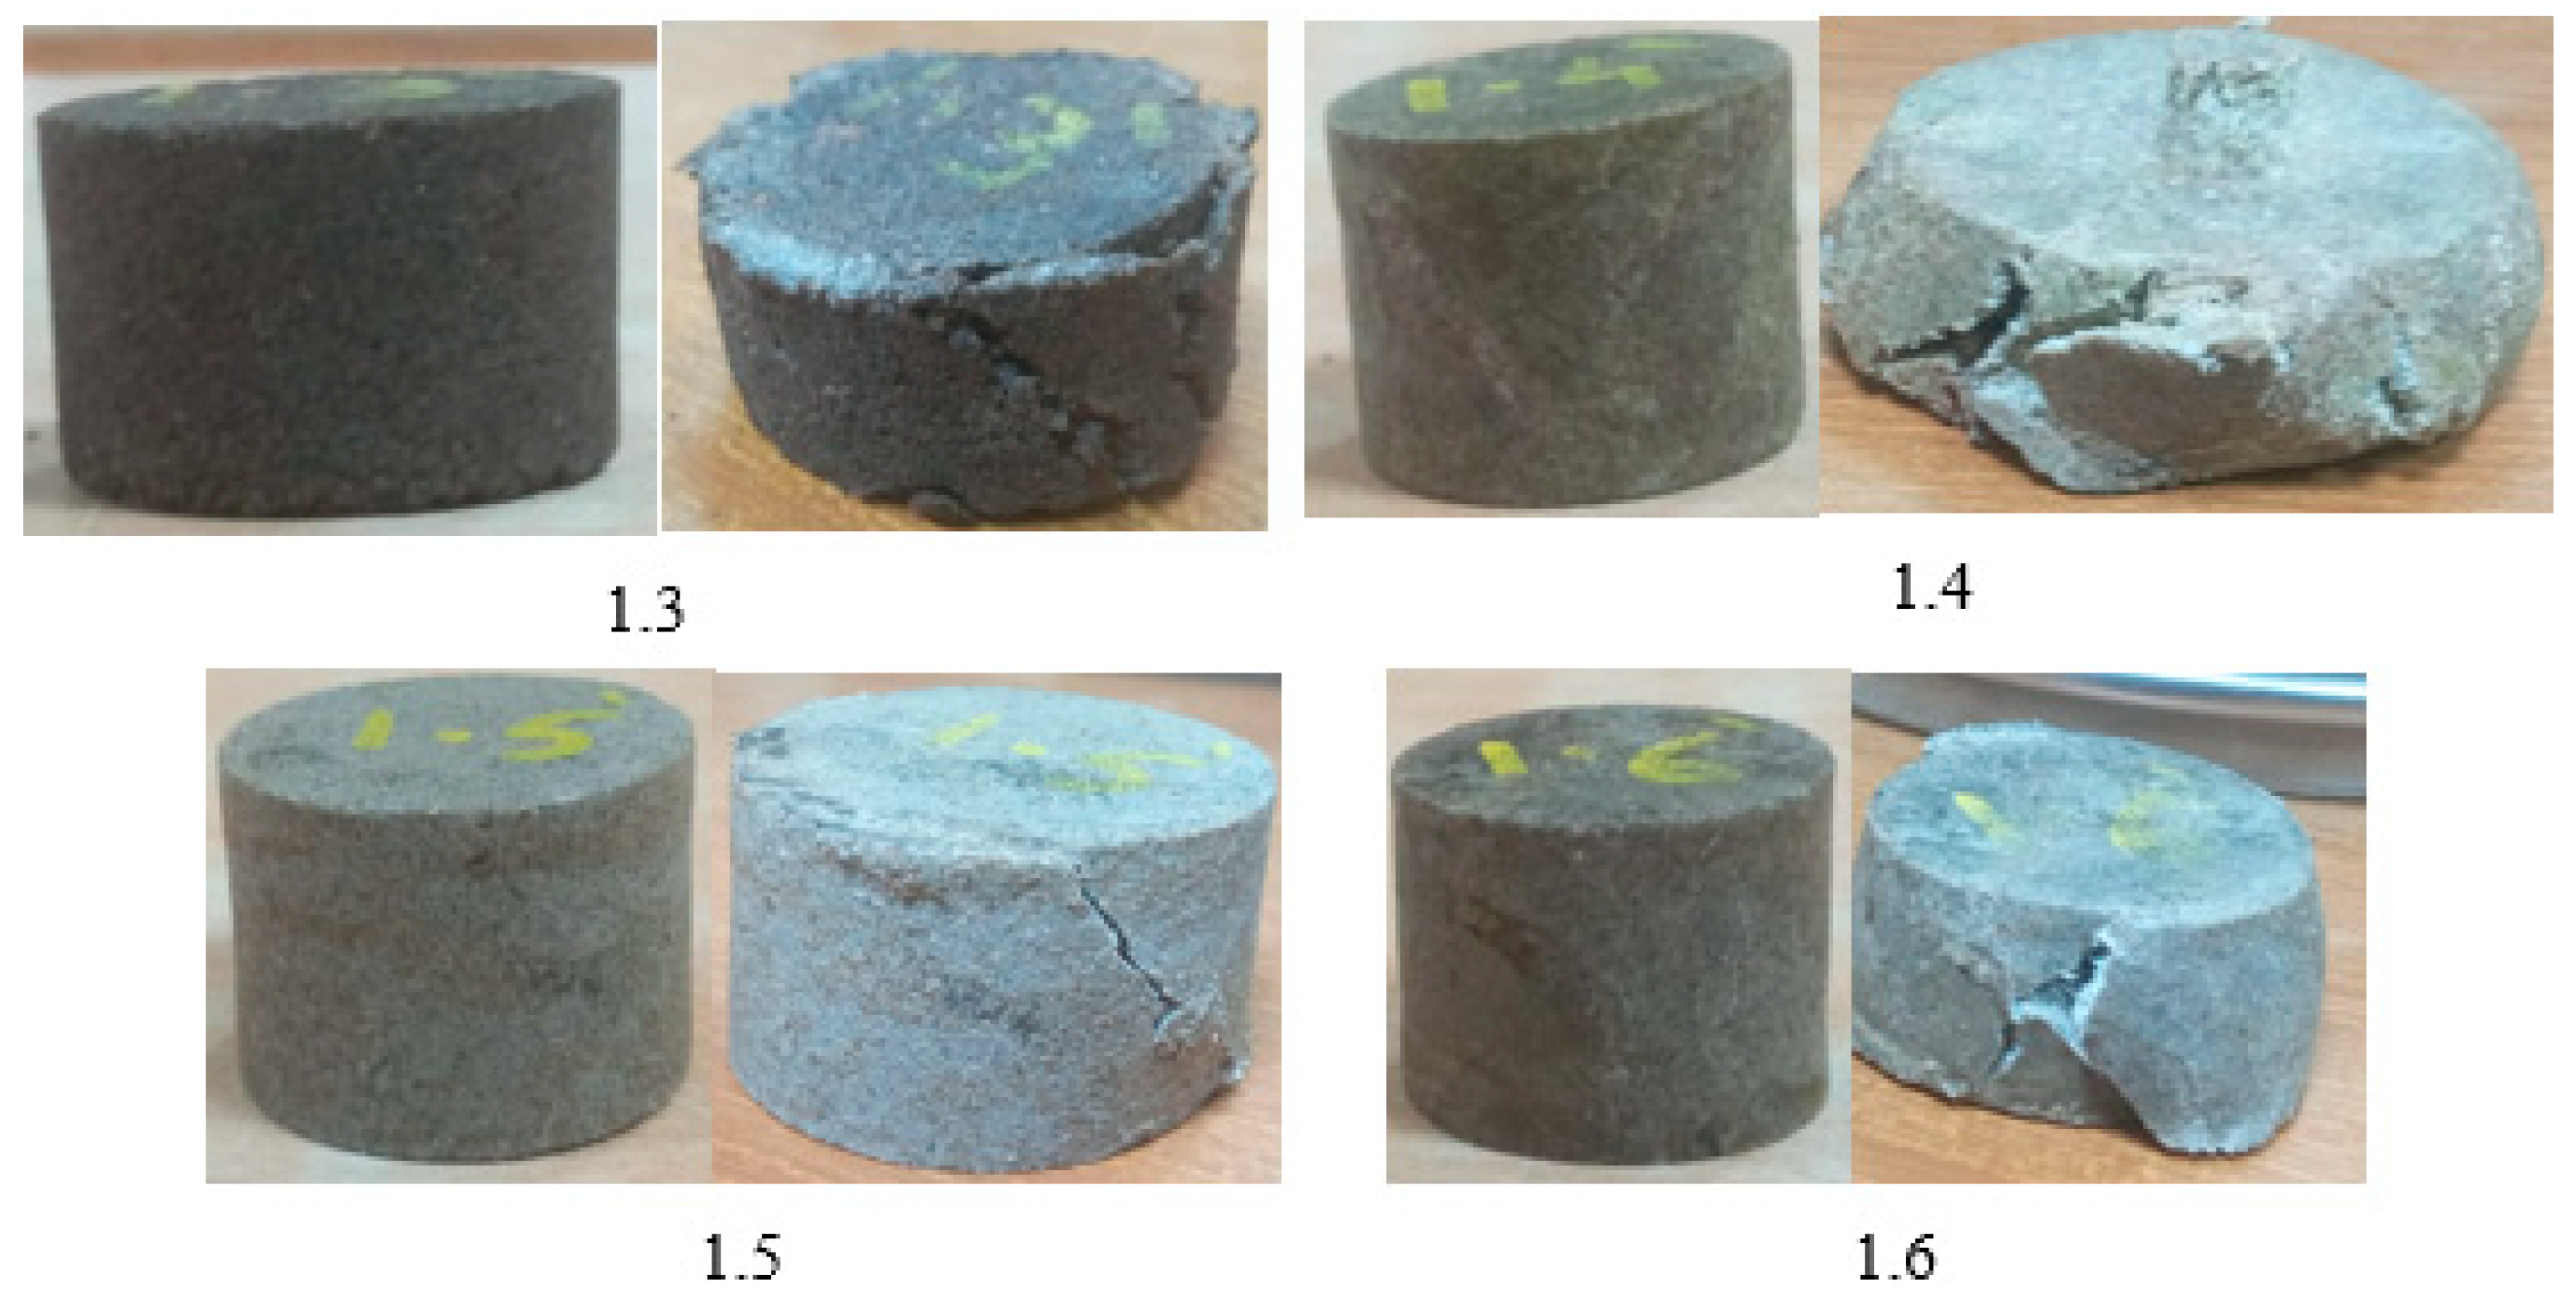
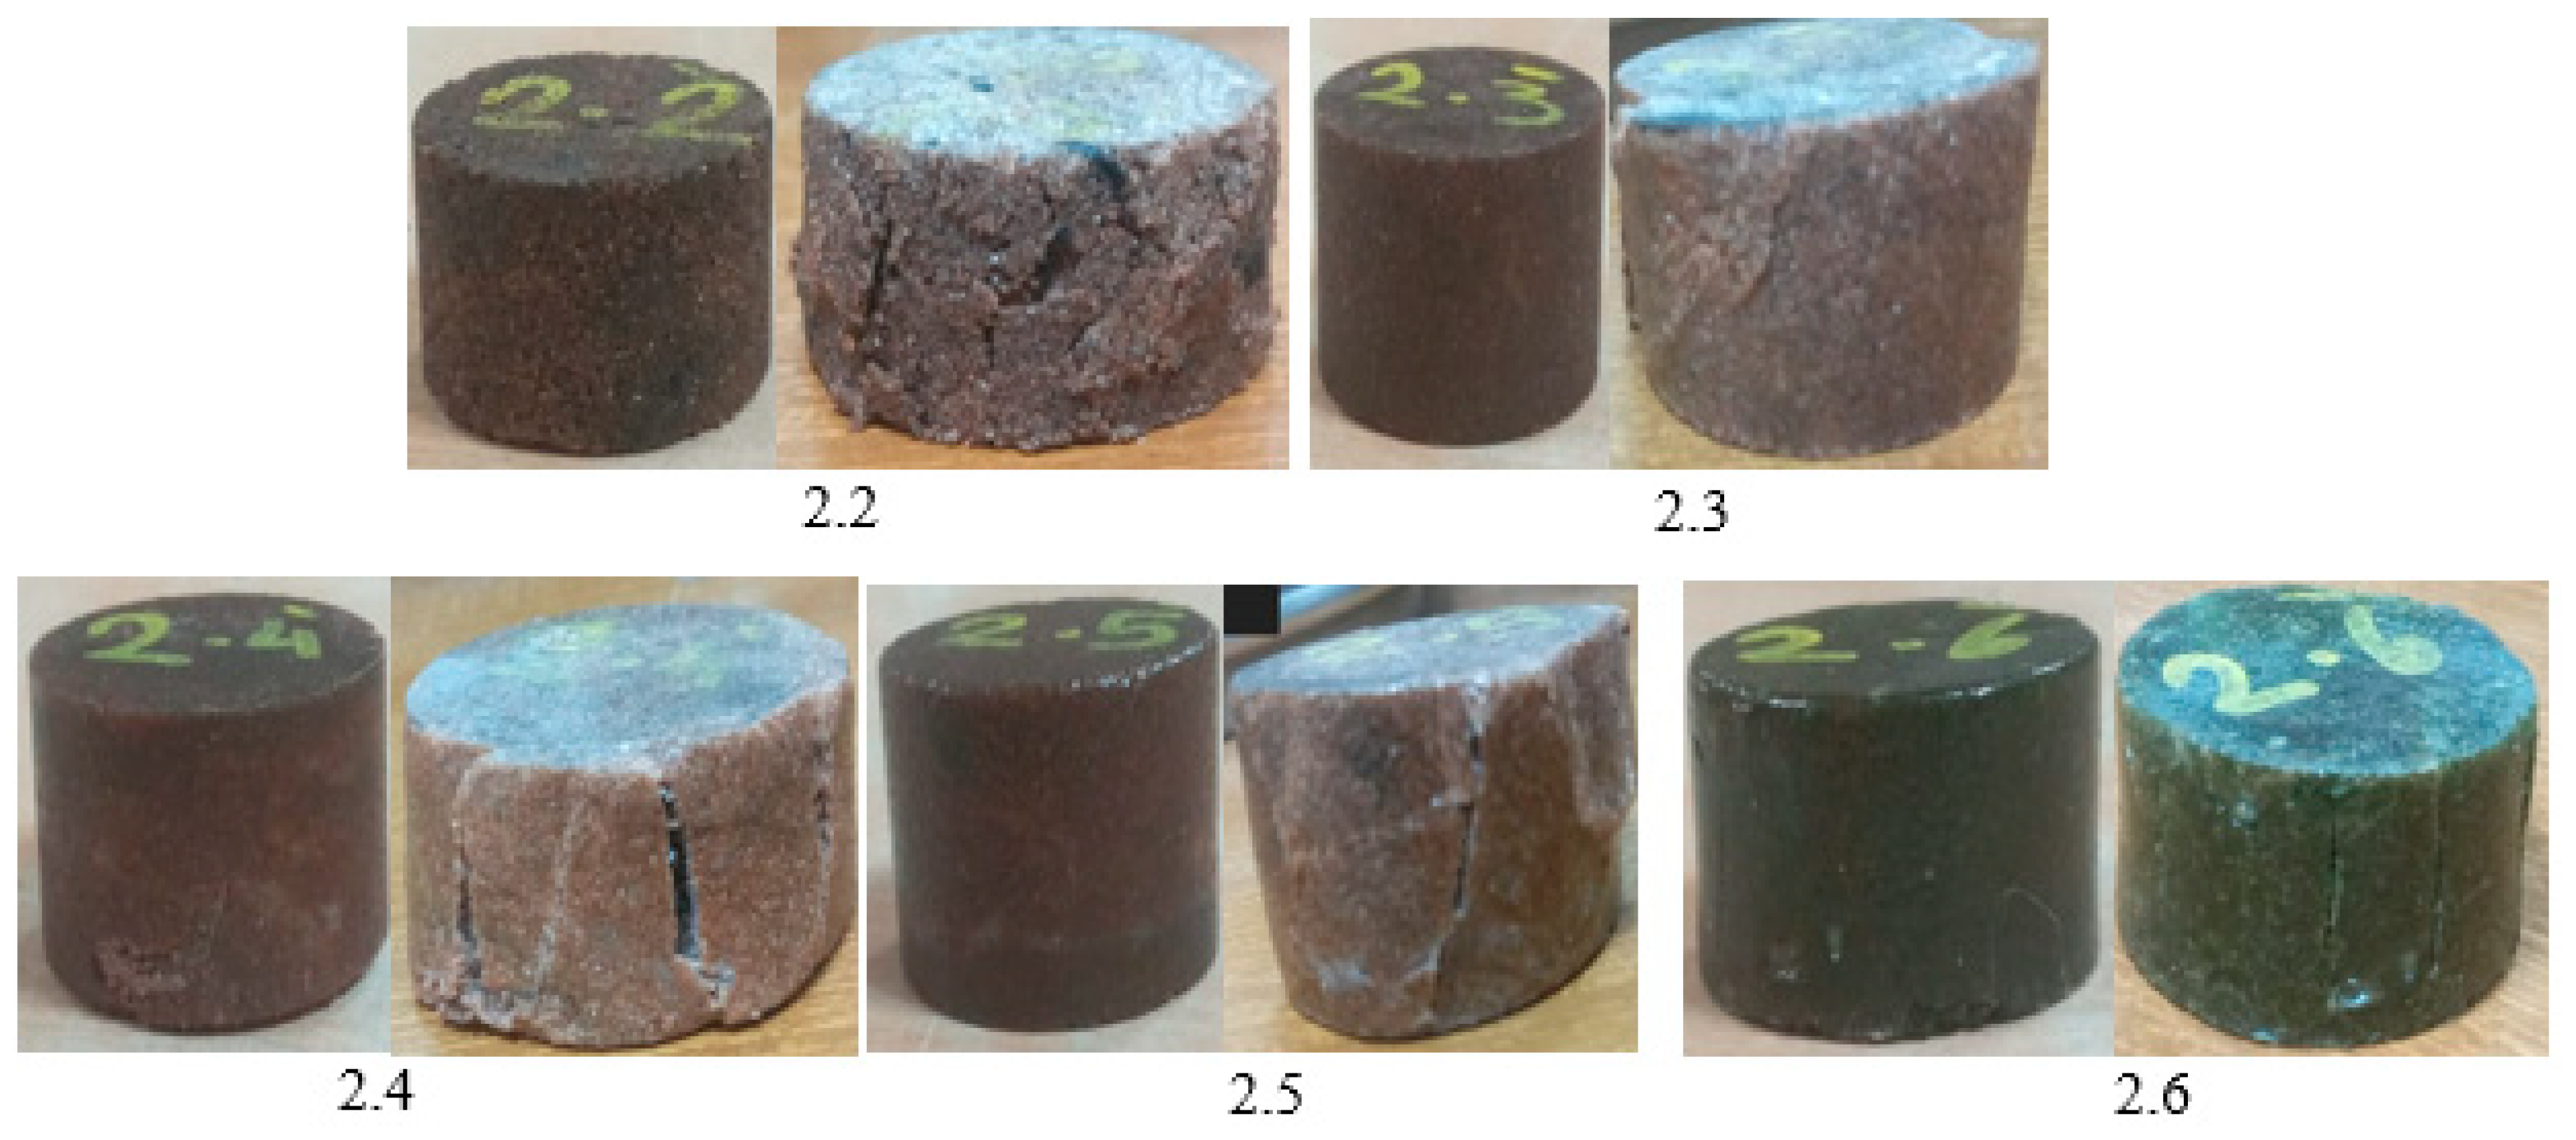
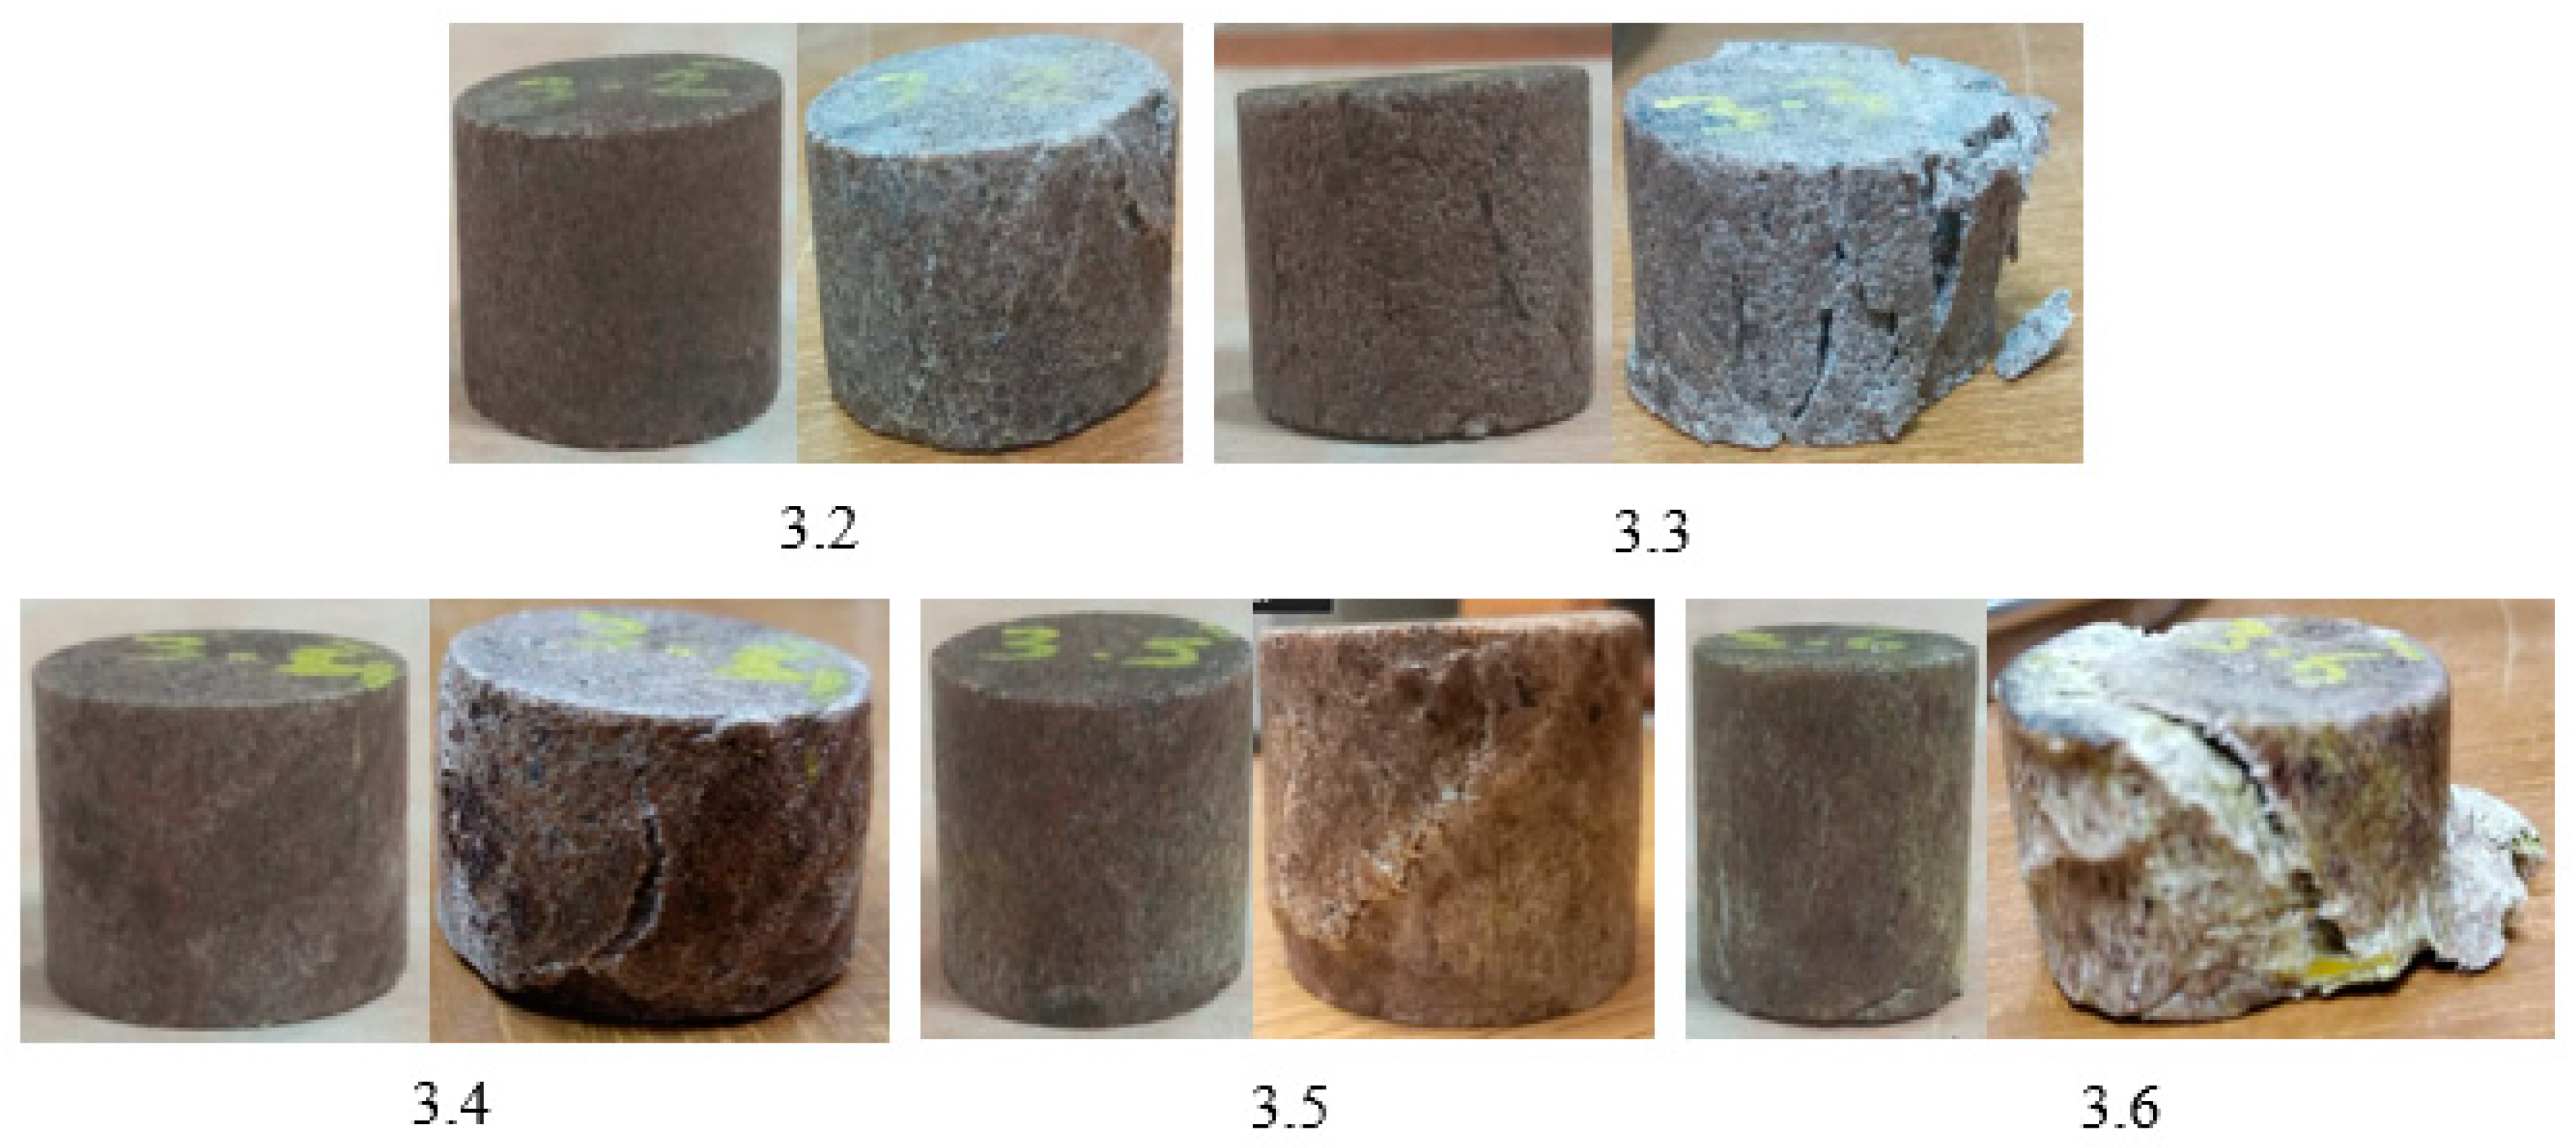
4.4. Fracture Pattern

The fracture patterns of all samples were studied. Figure 14, Figure 15 and Figure 16 show the fractured samples after the axial compression test for PE, PET, and PE/PET mixtures, respectively. The predominant fracture pattern in all samples was the tensile failure proved by longitudinal tensile cracks, with shear failure occurring in a small number of samples, such as the 30% PET sample, which gave the highest compressive strength value. The PE samples showed clear ductile failure, most notably the 40% PE sample, which acted like mild steel under compression.

4.5. Effect of Heating on Mechanical Properties

Two samples of each mixture were selected for compression tests after exposure to 40 °C and 60 °C. According to the above, it became clear that the optimal percentage of plastic ranges between 30 and 40%, and on this basis, the samples were selected. Regarding the heating temperature, the highest temperature recorded annually in Egypt (40 °C) was used, is monitored in July every year, and 1.5 times this value was used as a safety factor to reach a temperature of 60 °C. Table 2 shows the compressive strength values of samples exposed to heat. The results show the effect of temperature increase, with the most affected materials being the PE mixtures, followed by the PET, and then the PE/PET. The strength of PE samples decreased by 43% when exposed to 40 °C, which may reduce the chances of using PE bricks in hot climates, as is the case in Egypt in the summer.

4.6. Thermal Properties

The thermal properties of plastic samples were studied, and the results are shown in Table 3. First, by comparing the thermal conductivity results, it becomes clear that the results do not differ from clay bricks, as the plastic results gave values that ranged between 0.8 and 1.06 W/(m/K), while the values for commercial clay bricks range between 0.5 and 1.0 W/(m/K), and the results for PET samples were the lowest. Secondly, the thermal diffusivity readings are higher than those of clay bricks, as plastic samples gave results that ranged between 0.56 and 1.0 mm2/s, while clay bricks usually give readings that do not exceed 0.52.

4.7. Environmental Properties

Lianyang Zhang [27] mentioned that the production of 1 kg of cement releases 1 kg of CO2, and if using approximately 120 kg of cement per 1000 bricks,
CO 2   emission   per   brick = CO 2   emissions   per   kilogram   of   cement   ×   Cement   weight   per   brick number   of   bricks
CO 2   emissions   per   brick = 1   Kg   × 120   Kg 1000 = 0.12   Kg
So, approximately 0.12 kg of CO2 is released per cement brick.
While clay bricks release 0.41 kg of CO2 per brick [27]. Table 4 shows CO2 emissions per brick from clay, concrete, and Lego-like bricks, proving that Lego bricks release the least emissions.

4.8. Lego-like Bricks

(Figure 17) shows the final shape of Lego-like bricks, with the optimum ratios of plastic, which are 30%, and 40%, with each brick weighing around one kilogram and a half. Lego-like bricks are an ideal alternative for conventionally produced bricks that consume the planet’s natural resources and are negatively impacting the environment.

5. Conclusions

The current research studied the possibility of recycling plastic waste from PE and PET to produce Lego-like bricks that replace the bricks in the Egyptian market made of clay and cement. Thus, it is possible to reduce the excessive use of natural resources such as water, clay, and limestone, while reducing environmental pollution resulting from plastic waste and starting to produce sustainable building materials. The research conclusions can be summarized as follows:
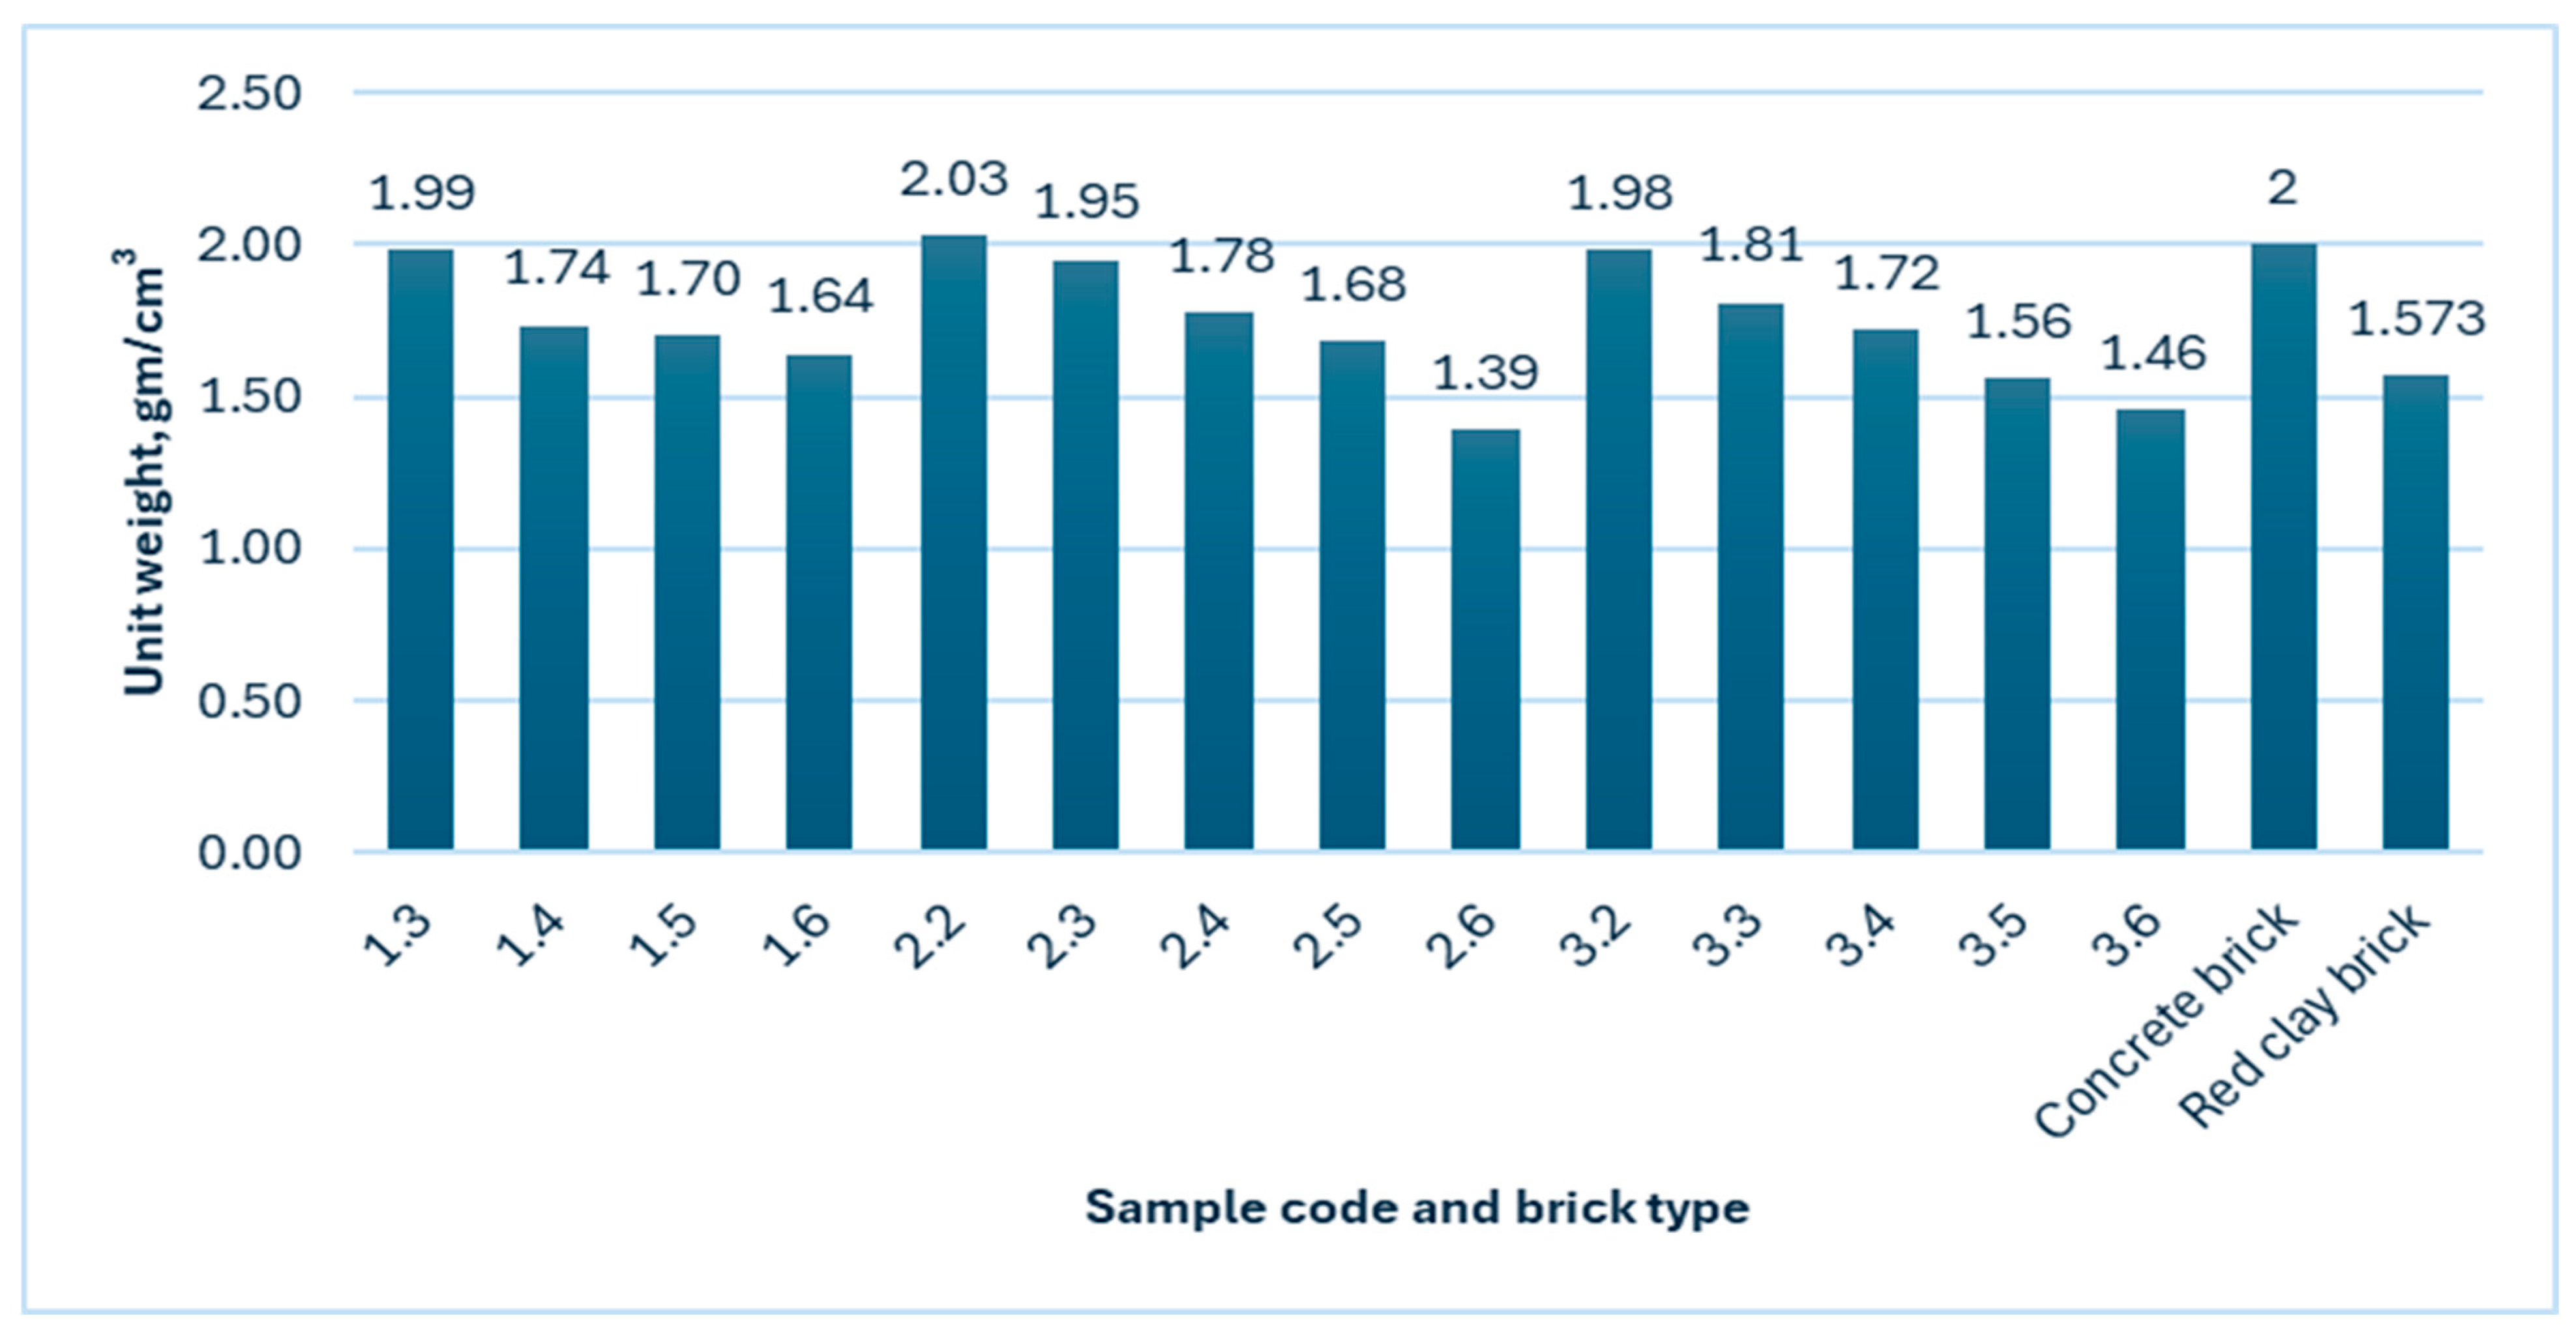
  • From a physical standpoint, there will be no fear of increasing wall loads on the structure, as the unit weight values have proven to be compatible with clay and cement bricks.
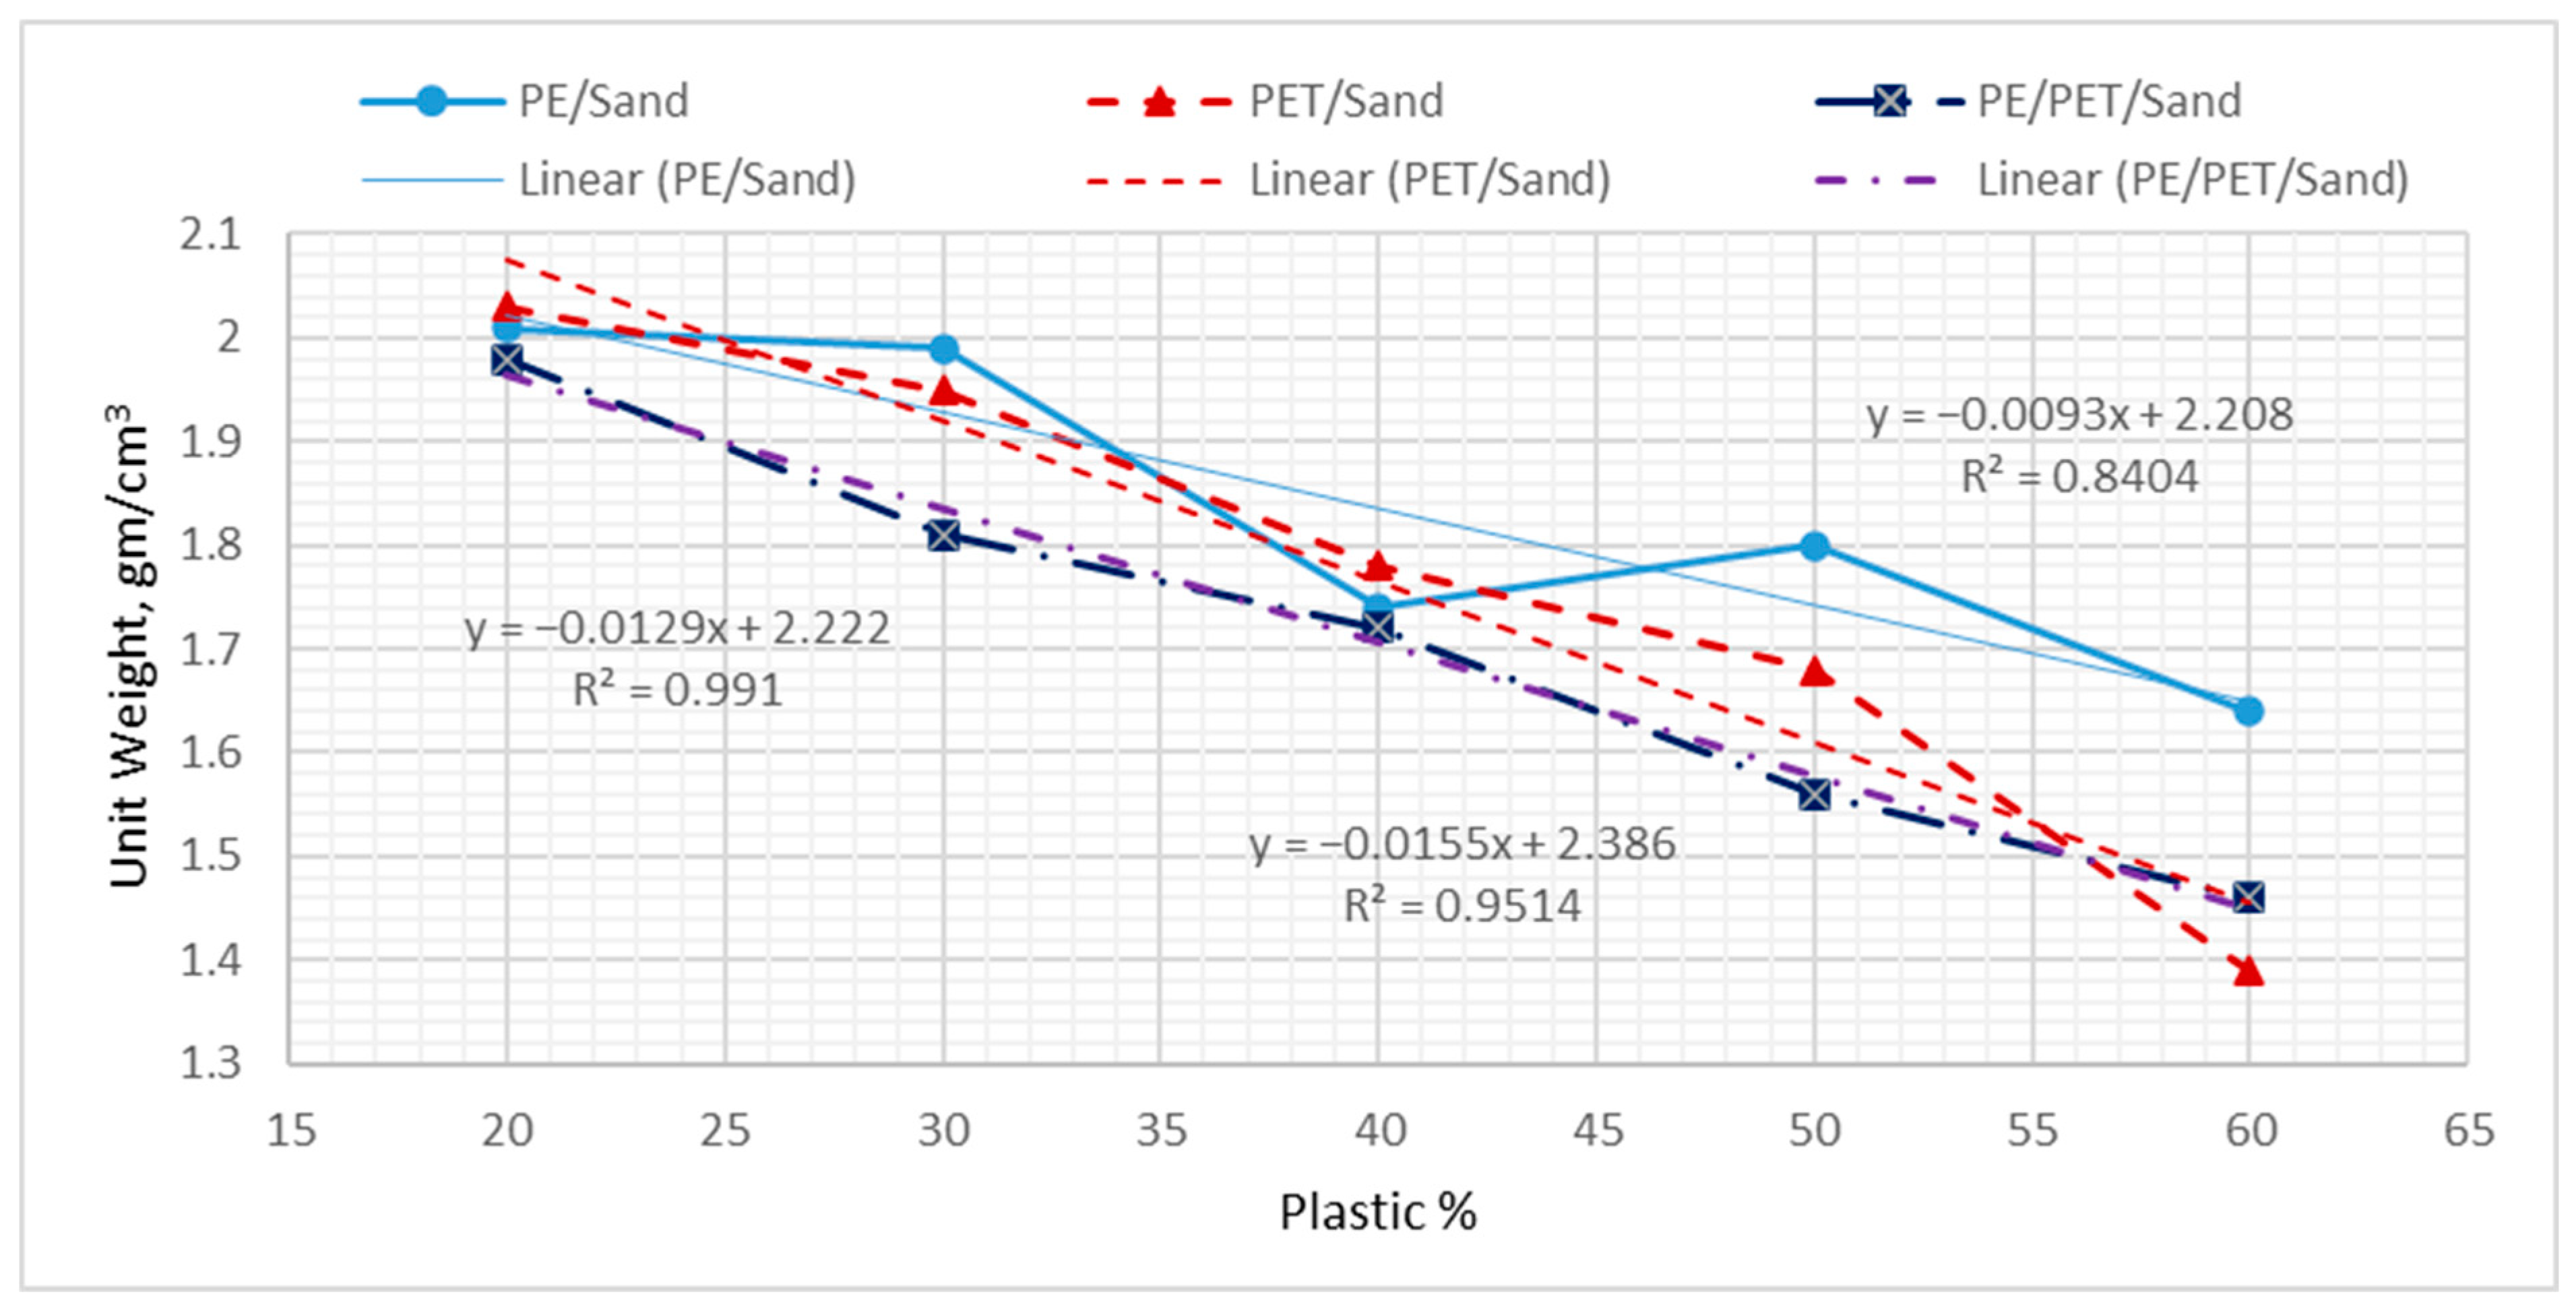
  • The unit weight of plastic bricks decreases as the percentage of plastic increases, and the PE/PET/sand samples were the least.
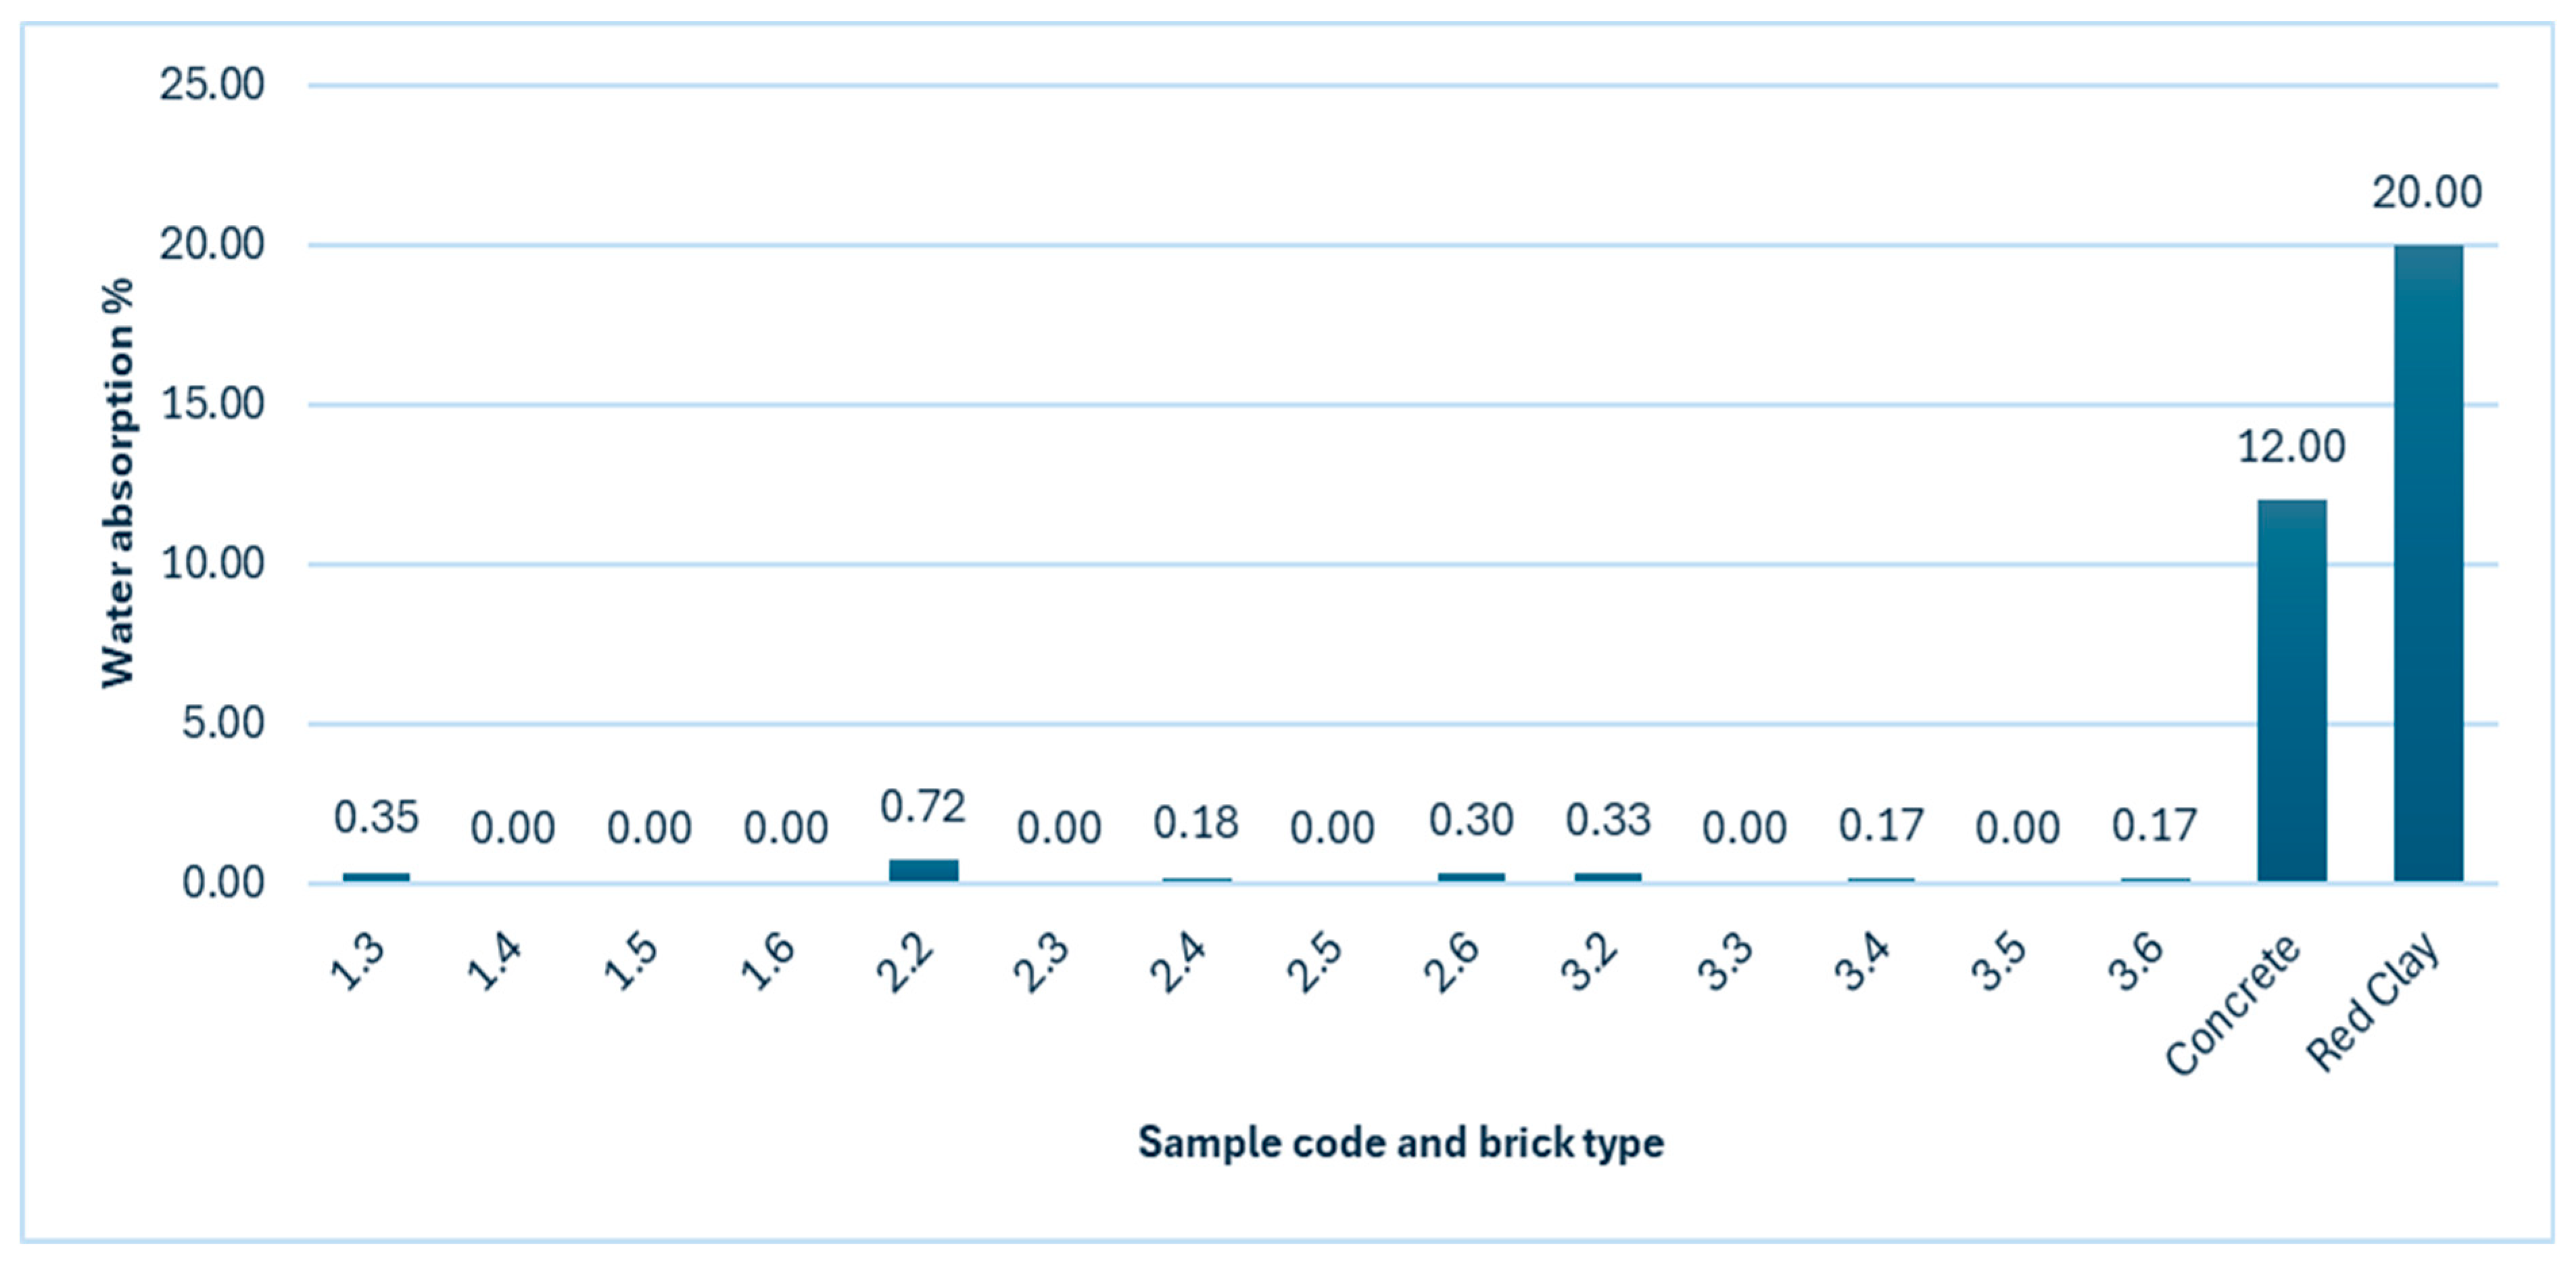
  • It is expected that plastic bricks will be better in terms of resistance to moisture factors, as the samples gave zero water absorption values.
  • Compressive strength results proved a significant superiority of plastic bricks over clay and cement bricks. The PET/sand samples gave a compressive strength of approximately 70 MPa.
  • It can be concluded that the optimal percentage of plastic ranges between 30% and 40% to obtain the highest possible strength in any of the mixtures.
  • All plastic samples showed a decrease in compressive strength values when exposed to temperatures of 40 °C and 60 °C, and the PE/sand samples were the most affected by a decrease value of approximately 43%. This decrease does not raise concerns regarding compressive strength, as the strength values are still higher than those in the construction market. The most important is to study other properties that may have been affected and were not covered in this research.
  • The thermal properties’ results demonstrated a significant convergence between the values of plastic and clay bricks. This also gives an incentive to use these bricks in the walls of buildings as a thermal insulator that helps reduce energy consumption.
  • Lego-like bricks are easy to install and do not require mortar like cement and red bricks, leading to labor, time and cost savings.
  • For the environment, the emissions measurements used in this study proved that plastic bricks emit significantly less CO2 than cement and red bricks. This means that the Lego-like bricks have no direct effect on increasing concentrations of GHGs.
  • Lego-like bricks are recommended for use on interior walls or room-splitting building blocks until further research is conducted regarding the degradation rates in open areas.

6. Recommendations

Fire resistance testing, environmental impact assessment, and recycling of the Lego-like bricks should be considered for future studies to provide more sustainable products and environmentally friendly construction materials.

Author Contributions

Methodology, N.A.; Validation, O.D.E.-M. and H.A.H.; Investigation, N.A.; Writing—original draft, N.A.; Writing—review & editing, O.D.E.-M. and H.A.H.; Visualization, N.A.; Supervision, O.D.E.-M. and H.A.H. All authors have read and agreed to the published version of the manuscript.

Funding

This research received no external funding.

Institutional Review Board Statement

Not applicable.

Informed Consent Statement

Not applicable.

Data Availability Statement

The data presented in this study are available on request from the corresponding author.

Acknowledgments

The authors extend their sincere thanks to the Department of Construction and Building, especially the Materials Testing Laboratory, College of Engineering and Technology, Arab Academy for Science and Technology, Cairo, Egypt, for offering the opportunity to conduct all tests in the laboratory.

Conflicts of Interest

The authors declare no conflicts of interest.

Abbreviations

PEPolyethylene
PETPolyethylene Terephthalate
MSWMunicipal Solid Waste
EEAAEgyptian Environmental Affairs Agency
GHGsGreenhouse Gases
CO2Carbon Dioxide
SO2Sulfur Dioxide
NONitrogen Oxide
UNICEFUnited Nations International Children’s Emergency Fund
LDPELow Density Polyethylene
PPPolypropylene
HDPEHigh Density Polyethylene
QDQuary Dust
SiO2Silicon dioxide
Al2O3Aluminum oxide
Fe2O3iron oxide
CaOCalcium oxide
MgOMagnesium oxide

References

  1. MOE; EEAA. Environmental State Report; Ministry of Environment: Cairo, Egypt, 2019. [Google Scholar]
  2. Wang, G.-X.; Huang, D.; Ji, J.-H.; Völker, C.; Wurm, F.R. Seawater-Degradable Polymers—Fighting the Marine Plastic Pollution. Adv. Sci. 2021, 8, 2001121. [Google Scholar] [CrossRef] [PubMed]
  3. Abdel Tawab, O.; Amin, M.; Ibrahim, M.; Abdel Wahab, M.; Abd El Rahman, E.; Hassanien, R.; Hatem, M.; Ghaly, A.E. Recycling waste plastic bags as a replacement for cement in production of building bricks and concrete blocks. J. Waste Resour. Recycl. 2020, 1, 202. [Google Scholar]
  4. Kaplan, S. By 2050, there will be more plastic than fish in the world’s oceans, study says. The Washington Post, 20 January 2016; 20. [Google Scholar]
  5. Alsobky, A.; Ahmed, M.; Al Agroudy, S.; El Araby, K. A smart framework for municipal solid waste collection management: A case study in Greater Cairo Region. Ain Shams Eng. J. 2023, 14, 102183. [Google Scholar] [CrossRef]
  6. MOE; EEAA. Environmental State Report; Ministry of Environment: Cairo, Egypt, 2020. [Google Scholar]
  7. Jambeck, J.R.; Geyer, R.; Wilcox, C.; Siegler, T.R.; Perryman, M.; Andrady, A.; Narayan, R.; Law, K.L. Plastic waste inputs from land into the ocean. Science 2015, 347, 768–771. [Google Scholar] [CrossRef] [PubMed]
  8. Verma, R.; Vinoda, K.; Papireddy, M.; Gowda, A. Toxic pollutants from plastic waste—A review. Procedia Environ. Sci. 2016, 35, 701–708. [Google Scholar] [CrossRef]
  9. Ministry of Environment. Egypt’s Firat Biennial Update Report to the United Nations Framework Convention on Climate Change; Environmental Affairs Agency: Cairo, Egypt, 2018. [Google Scholar]
  10. Khalil, E.A.; AbouZeid, M.N. Computation of the environmental performance of ready-mix concrete for reducing CO2 emissions: A case study in Egypt. Energy Rep. 2023, 9, 144–148. [Google Scholar] [CrossRef]
  11. Ministry of State of Environmental Affairs. Environmental State Report; Ministry of State of Environmental Affairs: Cairo, Egypt, 2018. [Google Scholar]
  12. United Nations Children’s Fund. UNICEF Annual Report; UNICEF: New York, NY, USA, 2021. [Google Scholar]
  13. Abohelal, M.; Nour, W.; Eldarwish, I.I.; Dewair, H. An Innovative Sustainable Approach in the Manufacturing of Recycled Brick Mixture for Buildings. J. Eng. Res. 2022, 6, 54–58. [Google Scholar] [CrossRef]
  14. Wahid, S.A.; Rawi, S.M.; Desa, N.M. Utilization of plastic bottle waste in sand bricks. J. Basic Appl. Sci. Res. 2015, 5, 35–44. [Google Scholar]
  15. Sahani, K.; Joshi, B.R.; Khatri, K.; Magar, A.T.; Chapagain, S.; Karmacharya, N. Mechanical properties of plastic sand brick containing plastic waste. Adv. Civ. Eng. 2022, 2022, 8305670. [Google Scholar] [CrossRef]
  16. Akinyele, J.; Igba, U.; Adigun, B.G. Effect of waste PET on the structural properties of burnt bricks. Sci. Afr. 2020, 7, e00301. [Google Scholar] [CrossRef]
  17. Ali, D.C.; Jassim, A.K.; Al-Sabur, R. Recycling of Polyethylene and Polypropylene Waste to Produce Plastic Bricks. J. Sustain. Dev. Energy Water Environ. Syst. 2023, 11, 1–13. [Google Scholar] [CrossRef]
  18. Agrawal, R.; Singh, S.K.; Singh, S.; Prajapat, D.K.; Sudhanshu, S.; Kumar, S.; Đurin, B.; Šrajbek, M.; Gilja, G. Utilization of Plastic Waste in Road Paver Blocks as a Construction Material. CivilEng 2023, 4, 1071–1082. [Google Scholar] [CrossRef]
  19. Gounden, K.; Mwangi, F.M.; Mohan, T.P.; Kanny, K. The use of recycled high-density polyethylene waste to manufacture eco-friendly plastic sand bricks. SPE Polym. 2023, 5, 20–34. [Google Scholar] [CrossRef]
  20. Krishnan, A.K.; Wong, Y.C.; Zhang, Z.; Arulrajah, A. Recycling of glass fines and plastics in clay bricks at low temperatures. Proc. Inst. Civ. Eng.-Waste Resour. Manag. 2022, 176, 153–161. [Google Scholar] [CrossRef]
  21. Tulashie, S.K.; Dodoo, D.; Ibrahim, A.A.-W.; Mensah, S.; Atisey, S.; Odai, R.; Mensah, D. Recycling plastic wastes for production of sustainable and decorative plastic pavement bricks. Innov. Infrastruct. Solut. 2022, 7, 265. [Google Scholar] [CrossRef]
  22. Koppula, N.K.; Schuster, J.; Shaik, Y.P. Fabrication and Experimental Analysis of Bricks Using Recycled Plastics and Bitumen. J. Compos. Sci. 2023, 7, 111. [Google Scholar] [CrossRef]
  23. ES:4763/2006; Building Brick Masonry Units Made From Clay. Egyptian Organization for Standards and Quality: Cairo, Egypt, 2006.
  24. ES:1292-2/2005; Concrete Masonry Units Part 2: Nonload Bearing Concrete Masonry Units. Egyptian Organization for Standards and Quality: Cairo, Egypt, 2005.
  25. ASTM C62-23; Standard Specification for Building Brick (Solid Masonry Units Made from Clay or Shale). ASTM International: West Conshohocken, PA, USA, 2023.
  26. ASTM C129-23; Standard Specification for Nonloadbearing Concrete Masonry Units. ASTM International: West Conshohocken, PA, USA, 2023.
  27. Zhang, L. Production of bricks from waste materials—A review. Constr. Build. Mater. 2013, 47, 643–655. [Google Scholar] [CrossRef]
Figure 1. PE plastic bags (left), and PET plastic bottles (right).
Sustainability 16 08567 g001
Figure 2. First stage samples’ mold (left), and the manufactured samples (right).
Sustainability 16 08567 g002
Figure 3. Lego-like brick mold detailing.
Sustainability 16 08567 g003
Figure 4. Prepared mixture components (at the (left) the shredded PE plastic, at the (middle) the shredded PET plastic, and at the (right) the sand).
Sustainability 16 08567 g004
Figure 5. Dx-600 kN Instron universal testing machine for the axial compression test.
Sustainability 16 08567 g005
Figure 6. Preparing samples for the thermal conductivity test.
Sustainability 16 08567 g006
Figure 7. Unit weight of plastic bricks vs. clay and cement bricks.
Sustainability 16 08567 g007
Figure 8. Unit weight vs. plastic % for the plastic samples.
Sustainability 16 08567 g008
Figure 9. Water absorption of plastic bricks vs. clay and cement bricks.
Sustainability 16 08567 g009
Figure 10. Compressive stress-strain curves for PE/sand samples.
Sustainability 16 08567 g010
Figure 11. Compressive stress-strain curves for PET/sand samples.
Sustainability 16 08567 g011
Figure 12. Compressive stress-strain curves for PE/PET/sand samples.
Sustainability 16 08567 g012
Figure 13. Compressive stress vs. plastic % for the plastic samples, where the 30% and 40% samples are the optimum ratios.
Sustainability 16 08567 g013
Figure 14. Fracture patterns—PE/sand samples.
Sustainability 16 08567 g014
Figure 15. Fracture patterns—PET/sand samples.
Sustainability 16 08567 g015
Figure 16. Fracture patterns—PE/PET/sand samples.
Sustainability 16 08567 g016
Figure 17. Lego-like Bricks.
Sustainability 16 08567 g017
Table 1. Experimental samples proportioning.
No.Mix TypeSample CodeMix Proportioning (%)
PEPETSand
1PE1.220-80
21.330-70
31.440-60
41.550-50
51.660-40
6PET2.2-2080
72.3-3070
82.4-4060
92.5-5050
102.6-6040
11PE/PET3.2101080
123.3151570
133.4202060
143.5252550
153.6303040
Table 2. Effect of heating on compressive strength.
Sample TypeSample No.Compressive Strength
MPa
Room Temperature
(Fo)
40 °C
(F40)
60 °C
(F60)
PE/sand1.323.4217.9816.00
0.77 Fo0.68 Fo
1.438.6521.9919.94
0.57 Fo0.52 Fo
PET/sand2.376.8556.7254.40
0.74 Fo0.71 Fo
2.472.1659.1056.20
0.82 Fo0.78 Fo
PE/PET/sand3.314.7514.0712.97
0.95 Fo0.88 Fo
3.426.6426.0023.93
0.98 Fo0.90 Fo
The numbers written in red are the percentage of compression strength at a certain temperature based on compression at the room temperature (Fo).
Table 3. Thermal properties of plastic bricks.
SampleThermal Conductivity
W/(m/K)
Thermal Diffusivity
mm2/s
Volumetric-Specific Heat Capacity
MJ/m3K
Thermal Effusivity
Ws−1/2/(m2K)
TypeNo.
PE1.31.0572920.9905051.5729741565.02
1.40.9286320.7910841.1744371044.259
PET2.30.8089050.9740390.8309819.7808
2.40.8740741.0612120.823958848.6113
PE/PET/sand3.30.9727730.5659571.7211771293.75
3.41.0215580.9982191.0261121023.535
Table 4. CO2 emissions per brick.
Type of Emission per BrickClay BrickConcrete BrickLego-like Brick
1.31.42.32.43.33.4
CO2 per brick (kg)0.410.120.0080.00850.00850.0090.00650.007
Disclaimer/Publisher’s Note: The statements, opinions and data contained in all publications are solely those of the individual author(s) and contributor(s) and not of MDPI and/or the editor(s). MDPI and/or the editor(s) disclaim responsibility for any injury to people or property resulting from any ideas, methods, instructions or products referred to in the content.

