Article

Operational and Design Factors in Air Staging and Their Effects on Fouling from Biomass Combustion

by
Akram Elsebaie
1,*,
Mingming Zhu
2 and
Yasir M. Al-Abdeli
1
1
School of Engineering, Edith Cowan University, Joondalup, WA 6027, Australia
2
Faculty of Engineering and Applied Sciences, Cranfield University, Bedford MK43 0AL, UK
*
Author to whom correspondence should be addressed.
Sustainability 2024, 16(19), 8584; https://doi.org/10.3390/su16198584
Submission received: 23 August 2024 / Revised: 23 September 2024 / Accepted: 29 September 2024 / Published: 3 October 2024
(This article belongs to the Special Issue Renewable Fuels Research and Sustainable Energy Transition)

Abstract

:
The global transition towards a carbon-neutral economy highlights the potential of biomass as a renewable fuel source. However, the sustainability of biomass energy systems is challenged by its complex fouling behaviours during combustion. This study investigates the impact of air staging on mitigating fouling in biomass combustion. By optimising the secondary-to-total air flowrate ratio (Qs/Qt) and the positioning of secondary air, this research investigates the impact of operational and design parameters on fouling deposits in biomass combustion. A fixed-bed combustor was used for the experiments, with hardwood pellets as fuel. This study employed TGA and SEM to analyse the fouling deposit samples’ chemical composition and morphology. First, visible inspection established that the inclination of fouling matter to accumulate on cooled deposition pipes is indeed sensitive to Qs/Qt. The results show that lower Qs/Qt ratios (<0.50) lead to heavier, stickier fouling. Peak temperatures in the fuel bed increase with higher Qs/Qt, enhancing the combustion efficiency and affecting the fouling characteristics. SEM analysis further shows that higher Qs/Qt ratios produce finer, more dispersed fouling particles, whereas lower ratios result in larger, more cohesive particles. These findings provide actionable insights for enhancing the sustainability of biomass energy systems and minimising their environmental impact.

1. Introduction

Despite the opportunity that biomass offers in terms of transitioning to a carbon-neutral economy, biomass combustion remains a significant topic of interest due to the complex and variable nature of biomass materials as fuels, which complicates fouling behaviours and mitigation efforts. The ongoing need to improve the efficiency and reliability of biomass energy systems sustains active research in this field [1,2].
Fouling is one of the challenges facing the use of biomass in energy production, because of the presence of inorganics in biomass. Alkaline and alkaline-earth elements along with chlorine compounds in biomass have melting temperatures as low as 500 °C, which can easily lead to fouling on the surfaces of heat tubes in the boiler [3,4,5,6]. Fly ash accumulation on upstream equipment is another contributor to biomass combustion fouling. The chemical compositions of biomass, operation conditions, and temperature differences in the combustor are key factors contributing to the formation of different types of fouling [7]. Fouling occurs when flying ash particles, which are non-combustible fine particles, hit a surface with a temperature lower than the particles’ melting point. The tendency of inorganic particulate matter to condense on surfaces in the heat recovery section of the combustor is higher due to the higher contents of alkaline and alkaline-earth elements [8].
While slagging and sintering are not discussed in this research, these challenges are important to mention because of their similarity to fouling. Slagging occurs in areas where surfaces are exposed to radiant heat, when the incombustible particles (ash) resulting from the biomass combustion process are molten in the areas with the highest temperature inside a combustor; in this event, molten and softened ash accumulates on the solid surfaces, causing significant reductions in combustion efficiency [9]. Combustor design optimisation to avoid localised elevated temperatures can reduce slagging [10].
With further accumulation of condensed particles, either through fouling or slagging, the outer surface of the deposited material increases in temperature as the outer surface becomes insulated from the relatively cooler surface, causing particles to start adhering to it in a process called sintering. Sandberg et al. ran a long-term experiment to investigate the effects of fouling in a boiler using biomass, and to observe the relationship between sintering and the alkaline material percentage in ash. It was found that, for biomass with 80% alkaline compounds with low melting temperatures, deposited material starts sintering at temperatures as low as 720 °C, while for lower amounts of alkaline materials, sintering occurs at higher temperatures [11,12].
Table 1 summarises recent studies investigating fouling from biomass combustion, which have not only focused on fixed-bed combustors [13,14,15] but also studied fouling in circulating fluidised bed (CFB) combustors [5]. In [13], where commercial wood pellets were used as fuel, the deposition rate ranged from 7 to 12 g·m−2·h−1 over the 20 h experiment. Another study [14] found that the fouling deposition rate from straw combustion was around 20 g·m−2·h−1 on heat exchangers carrying steam (550 °C) at flue gas temperatures of 1000 °C. Another study [15] reported fouling deposits ranging from 7 to 28 g·m−2·h−1 with a flue gas temperature of 550–600 °C and water at 25–95 °C passed through to cool the sample substrate when using wood pellets as fuel. In [5], using a circulating fluidised bed with a thermal capacity of 157 MW, the fouling rate ranged between 4 and 14.5 g·m−2·h−1 for blends of biomass fuels. These studies collectively attempted to investigate the challenges associated with fouling in biomass combustion, finding that the combustor design and operating conditions are among the causes that influence fouling formation. However, they lack a comprehensive exploration of the contribution of fuel bed and freeboard temperatures or the ratio of secondary to total air flowrate (Qs/Qt) as factors in biomass combustion fouling. The simultaneous impact of these factors on fouling deposition remains fundamentally absent from our understanding.
This paper provides valuable insights into the effects of air staging on biomass fouling in fixed-bed combustors. The scope of this work addresses the following aspects:
  • Operational factors: the effect of secondary air flowrate on fouling.
  • Design factors: the effect of secondary positioning on biomass fouling.
  • Fouling deposits: the chemical composition of biomass fouling deposits, as both operational and design factors vary, is analysed.
Considering the interrelationship between fouling deposits and the efficiency of heat exchangers, this research facilitates minimisation of the detrimental effects associated with using renewable solid fuels such as biomass.

2. Materials and Methods

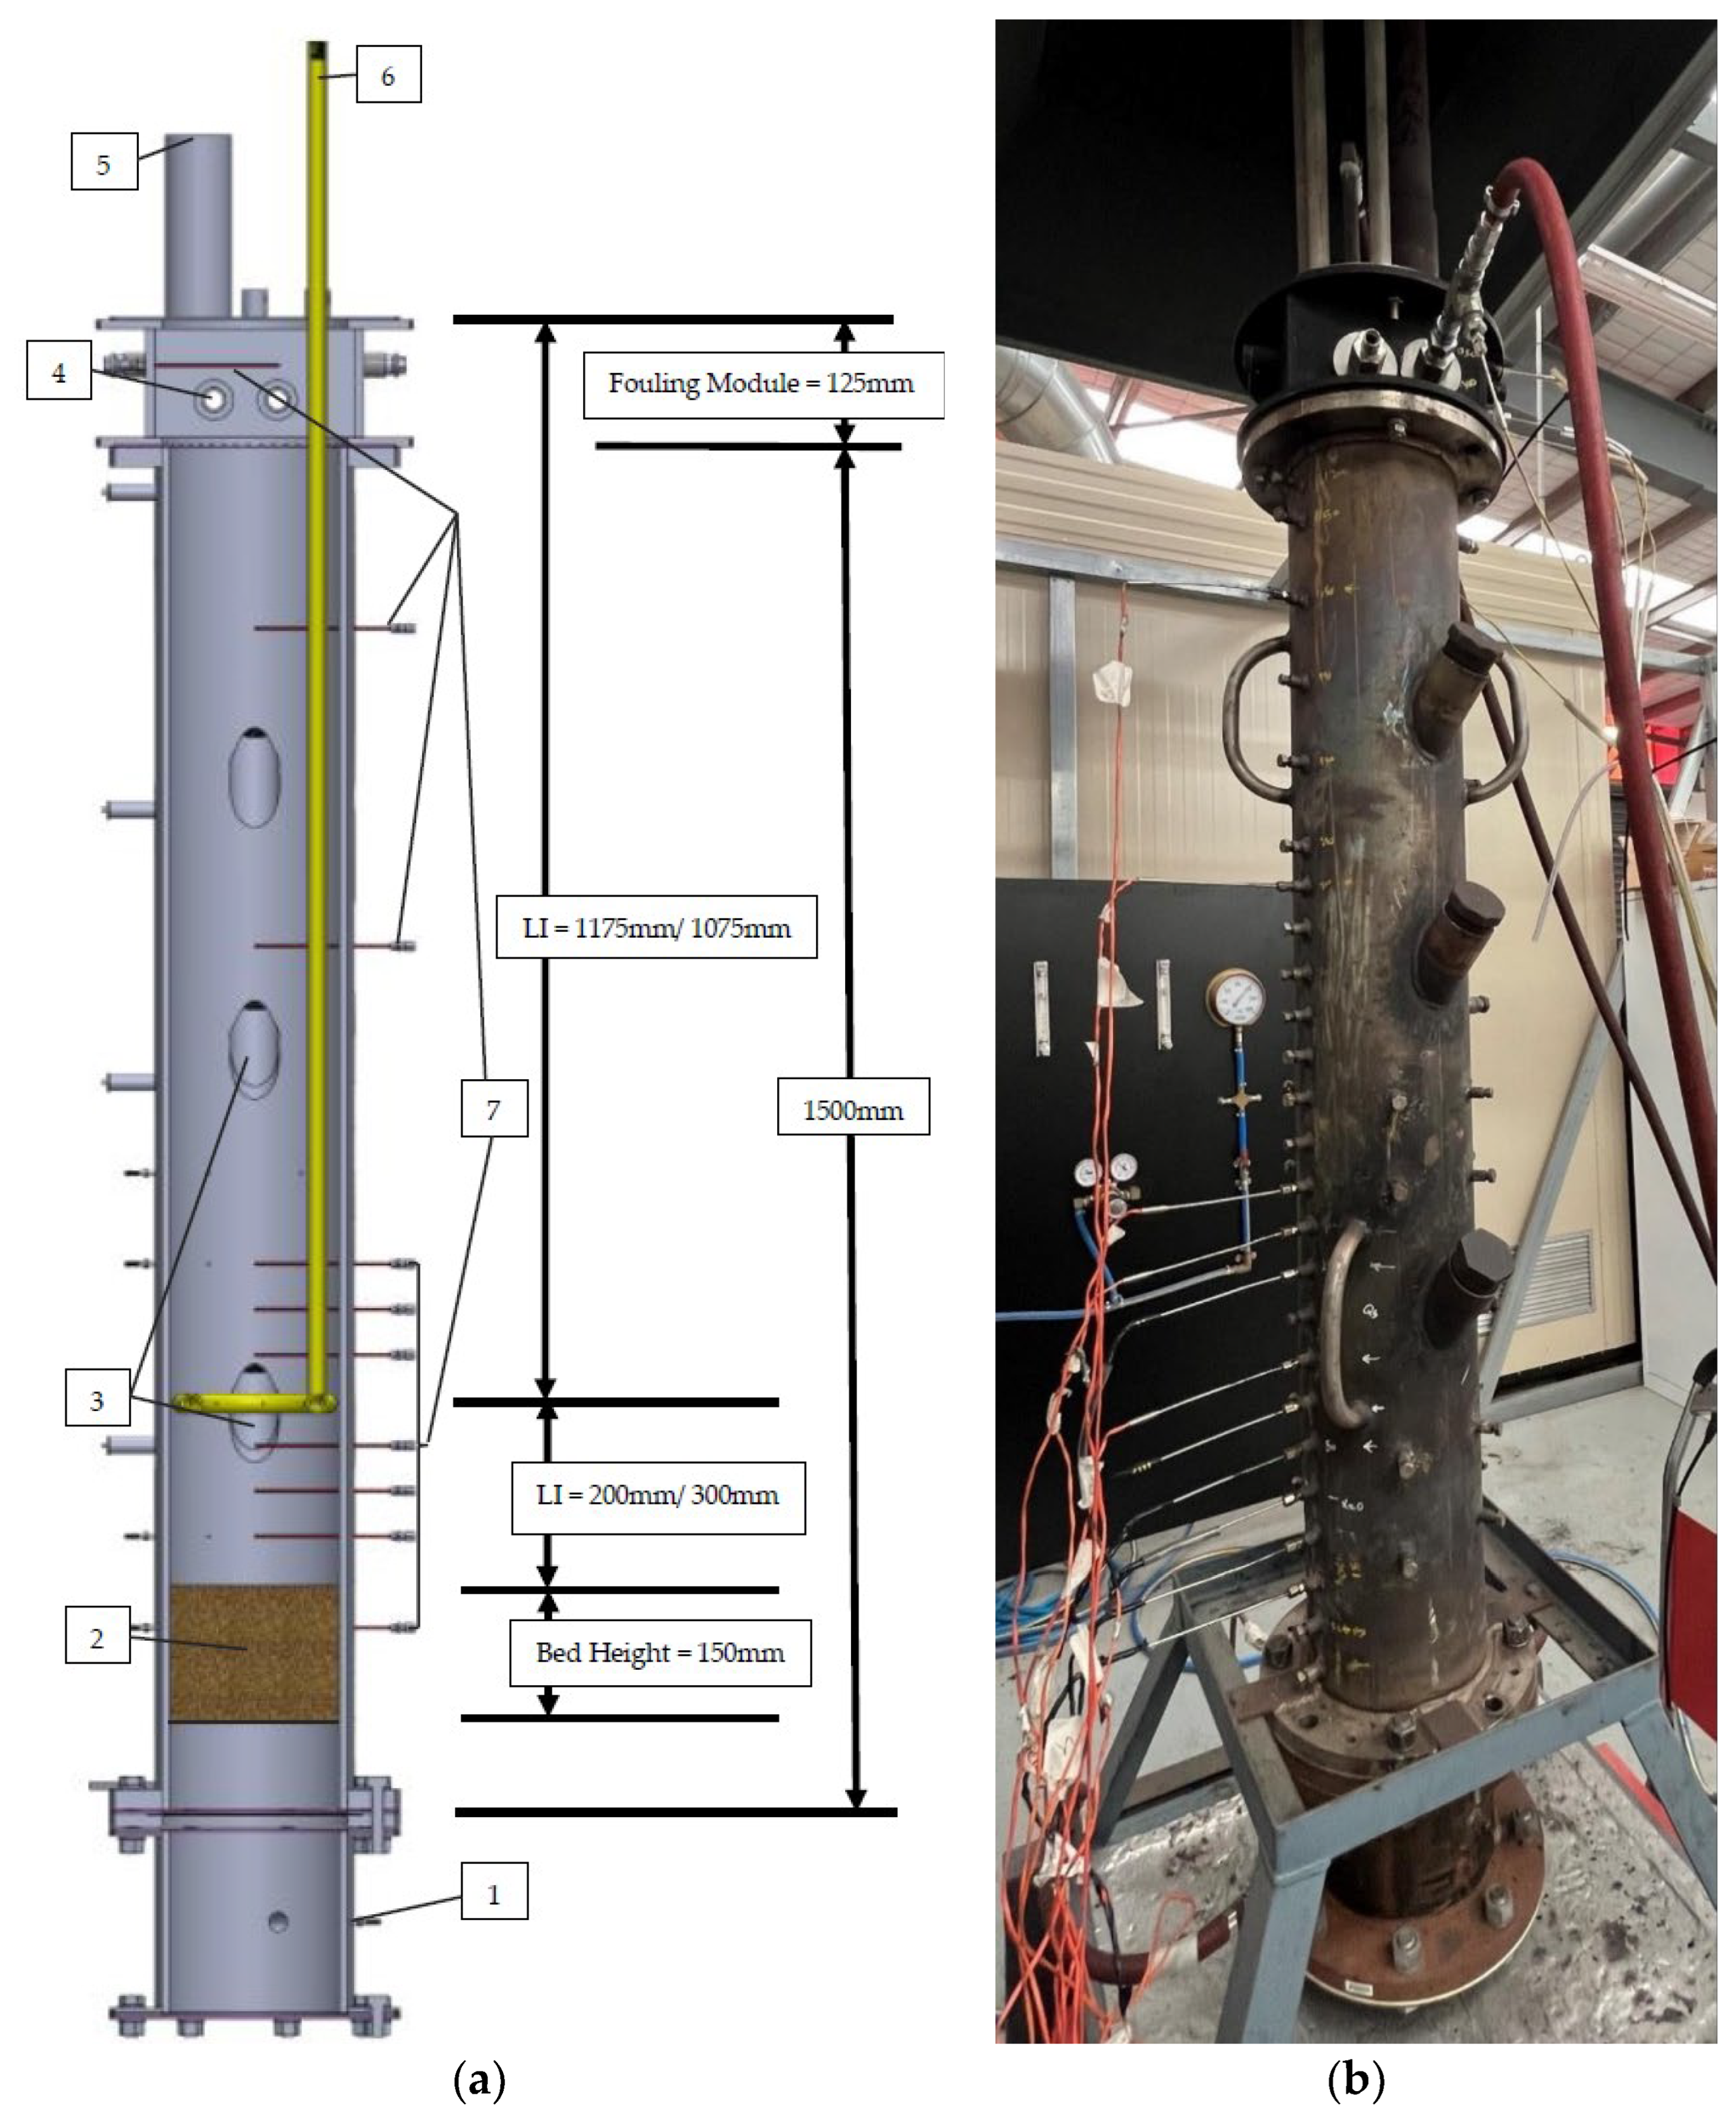
2.1. Combustor and Fuel

Figure 1 shows the experimental set-up of the fixed-bed combustor, which is designed to be modular. The main column is fabricated from SS310 stainless steel (202 mm inner diameter, 8.50 mm wall thickness, height 1500 mm). The column’s ends terminate at flanges (230 mm outer diameter), where the air plenum (bottom) and fouling modules (top) are attached to the combustor body. During the experiment, the fuel was batch-fed (manually) into the combustor through fuel charging ports to form a finite-height packed fuel bed on a fixed stainless steel grate. Fuel ignition was initiated through the same side port by injecting 15 mL of methylated spirits (96% ethanol) and igniting it using a handheld butane torch. Once ignited at the bed’s top surface, the counter-flowing primary air (Qp) that was introduced though the plenum and the circular perforations of the grate from beneath the fuel bed then caused a reaction front to propagate downwards and opposite to the primary air flow. The secondary air (Qs) was introduced to the combustion column through the secondary air assembly, which consists of a circular ring with 8 equally distributed 3 mm holes on the inner periphery of the ring. The secondary air assembly divides the space above the fuel bed into the primary freeboard (LI) and secondary freeboard (LII), based on the location of introducing secondary air staging. The total air flowrate was provided from an air compressor and passed through air flowmeters to the primary and secondary air. The primary and secondary air supply was delivered via a screw-type air compressor connected to a flow control board equipped with a pressure regulator and four calibrated flowmeters (Influx, model LV2S15-AI 27), with an accuracy of ±5% full scale. More details on the combustor and its set-up are available in the literature [16,17,18,19,20].
Fuel: Hardwood pellets of a commercially available Australian biomass (make: Maxiheat, Pellet Heater, Homebush, NSW, Australia) were used as fuel for the purpose of this study. Hardwood pellets with a diameter measuring 6.50 mm and a length ranging nominally from 5 to 40 mm were utilised. Table 2 shows the biomass fuel properties, including (dry basis) proximate and ultimate analyses, in addition to a Higher Heating Value (HHV) of 19.1 MJ·kg−1 and bulk density of 713.4 kg·m−3 [18,21,22,23,24,25,26].

2.2. Fouling Module and Deposit Characterisation

Fouling module: The configuration shown in Figure 2, where fouling deposits are acquired using cooled pipes made from seamless stainless steel 316 L (26.67 mm outer diameter, 2.87 mm wall thickness), was installed such that the flue gas stream passed over them. The set-up is designed was acquire a build-up of softened deposits, including the fouling material in addition to inorganic and/or organic vapours that may condense on the cooled deposition pipes. The cooled pipe with the accumulated sample was then removed from the module by the end of each set of experiments and replaced with a new pipe for the next set of experiments. Then, samples of the accumulated deposits were mechanically scraped with a scraper made of softer metal to prevent scratching the metal substrate and contaminating the samples, while a precise scale with 0.01 gm accuracy was used to record the collected quantities. The fouling module’s design was 125.00 mm height and located at the top of the combustor column bolted to its flange. A mass flow controller (make: Bronkhorst, Ruurlo, The Netherlands, model: EL-FLOW Prestige) was used to regulate the cooling air flowrate to 50.00 L·min−1 through the fouling deposition pipe. The cooled fouling deposition pipe was fed with ambient air, which was used for the simplicity of the set-up. The average ambient air temperature was 35 ± 7 °C over the range of experiments undertaken, indicating that the variation over the experiments was relatively small compared to the flue gas temperatures in the vicinity of the fouling pipe.
A TGA analyser (make: PerkinElmer, Waltham, MA, USA, model: TGA4000) was applied to identify the fixed carbon content, unburnt hydrocarbons, ash and inorganic content, and moisture in the collected fouling samples [27]. For the TGA analysis, samples collected from the deposition on the cooled pipe were exposed to increasing temperatures in the TGA analyser, with a heating rate of 10 °C per minute, as per the conditions shown in Table 3. All sample weights were around 10 mg. The purge gas used was nitrogen at a flowrate of 20 L·min−1 during the initial heating stage from 30 to 105 °C, where it was held for 15 min; the sample was then heated up from 105 to 500 °C and held at this temperature until the sample’s weight loss rate was stabilised and there was no further weight loss. The purge gas was then switched from pure nitrogen to air (21% oxygen and 79% nitrogen) at the same temperature throughout the remainder of the heating process.
The morphology of the collected biomass fouling samples was studied using SEM (make: JEOL, Tokyo, Japan, model: JCM-6000). The sample was fixed onto the SEM stub using a conductive carbon tape. The SEM was set to a 15 KV filament voltage and high vacuum, and then the working distance and focus were adjusted. The sample was positioned and multiple images were acquired at different locations, using various magnifications if needed. The acquisition of high-quality images of the fouling morphology was facilitated by selecting the appropriate imaging mode and ensuring meticulous adjustments of the beam current. Multiple images were acquired at diverse locations on the sample, employing varied magnifications when necessary to ensure comprehensive representation.

2.3. Data Acquisition

Temperature: The fuel bed and freeboard temperatures were measured along the centreline for the combustor column using N-type thermocouples (make: TC measurement, Berkeley, IL, USA, range: −270 to 1300 °C). N-type thermocouples are suitable in oxidising environments for continuous high-temperature operation, and their accuracy is within +/− 0.75%. The thermocouples were connected to the module (make: National Instruments, Austin, TX, USA, model: NI 9213), which was installed on the data acquisition system (model: CRIO-9074XT). Temperature data were captured at a rate of 0.2 Hz using a LabVIEW interface (specifically, version 2014). In the fuel bed, three thermocouples were spaced every 50 mm, starting from the top of the fuel bed. Within the freeboard, eight thermocouples were spaced every 100 mm
The temperatures inside the fouling module were measured using K-type thermocouples (make: TC measurement, range: 0 to 1100 °C), as the temperature ranges here were relatively lower than in the fuel bed and freeboard. The fouling module temperatures were acquired via another data acquisition system (make: OMEGA, Biel/Bienne, Switzerland, model: PDAQ323691). The reported steady-state temperatures (raw) are the average of three runs under each condition [28]. The temperatures reported in the fouling module are raw data with no radiation correction needed, due to the temperature variation due to radiation being less than 5% [18].
Fuel Consumption: Fuel consumption, expressed as the burning rate, was used (along with a time series of temperatures) to establish the onset of steady-state conditions during testing [18]. To achieve this, the entire combustor was carried on a load cell featuring an industrial scale (make: Wedderburn, Ingleburn, NSW, Australia, model: S-UK300, range 300 kg) and its data acquisition software (RINSTRUM R320, View300 V2.2.5.0).

2.4. Fuel and Testing/Operating Conditions

The conditions selected to investigate the effects of air staging (namely, secondary flowrate and its position) on fouling from raw biomass combustion can be set in one of two ways, both of which have been applied to earlier research published in relation to this type of combustor: (i) maintaining a constant total air flowrate (Qt) while varying the ratio of secondary to primary flowrates (Qs/Qp)—however, this leads to a situation where it is harder to quantify the role of the secondary air, as both Qs and Qp are variables [29]—or (ii) keeping the primary air flowrate (Qp) and combustion stoichiometry in the fuel bed constant by adjusting only the secondary air flowrate (Qs) so as to examine its impact on fouling [16]. The latter approach was used in this research. Table 4 shows that the freeboard lengths chosen were 200 and 300 mm from the fuel bed surface to the secondary air supply, and the secondary flowrates ranged from 70 to 420 L·min−1, while the primary air flowrate (Qp) was kept constant at 140 L·min−1. The ratios of secondary to total flowrate were Qs/Qt = 0.33, 0.50, 0.66, 0.71, and 0.75. A raw biomass fuel batch of 3.9 kg was used for all of the experiments, creating a fuel bed height of 150 mm. The conditions reported are free of combustion instability, which can occur under some other test conditions. More details on the conditions for thermo-acoustic instabilities in this combustor are published elsewhere [16,19,30].

2.5. Repeatability and Uncertainty Analysis

The experimental variability and uncertainty associated with studying the effects of biomass combustion on fouling deposition, using a range of secondary flowrate conditions, were taken into consideration. The results from repeated experiments conducted under nominally identical conditions were compared, with the focus on the temperatures’ repeatability. Each condition was repeated three times before the fouling deposition probe was replaced, and the deposited material was collected and prepared for analysis. In an experiment with a similar combustor set-up, where the fouling deposit sample pipe could not be removed or installed once the combustion began, specific tests were conducted to evaluate the impact of transient phases on fouling mass deposition; the tests showed that the contribution of these transient phases was insignificant. As a result, the total testing time, including the initial, steady-state, and final phases, was considered for data analysis [15]. Variations between identical experiments were primarily attributed to the complexity of solid fuel combustion, control of secondary and primary flowrates, ash deposition and collection procedures, inherent variability in fuel properties, and uncertainty in the system and instrumental standards. When calculating the system and instrumental uncertainties, despite being generally small contributors to the overall uncertainty, they were also taken into consideration. The relative variability, defined as the standard deviation divided by the average, was used to quantify the experimental variability and was divided into five categories that are related to the temperature data acquired:
  • Fuel bed peak temperature;
  • Primary freeboard steady-state temperatures;
  • Secondary freeboard steady-state temperatures;
  • Fouling deposition probe location steady-state temperature;
  • Ash percentage content measured by TGA.
To calculate the total relative variability ε t o t a l , the following equations were used [31]:
ϕ i ¯ = 1 N i = 1 N i
ϕ a v e = 1 n i = 1 n i
σ s = i = 1 n ( ϕ i ¯ ϕ a v e ) 2 ( n 1 )
ε r = σ s n 1 ϕ a v e
ε t o t a l = ± ε s 2 + ε r 2
where εs is the systemic uncertainty, εr is the random uncertainty, N is the specific number of data points in each run, and ϕ i ¯ is the calculated mean temperature across (N) points in each run, considering the repetition of each test condition three times (i = 1, 2, n). ϕ a v e is the average temperature over multiple runs, and σ s is the standard deviation across these three runs. The experimental uncertainty for temperature data collected from the three repeats of each condition did not exceed 5% [30].

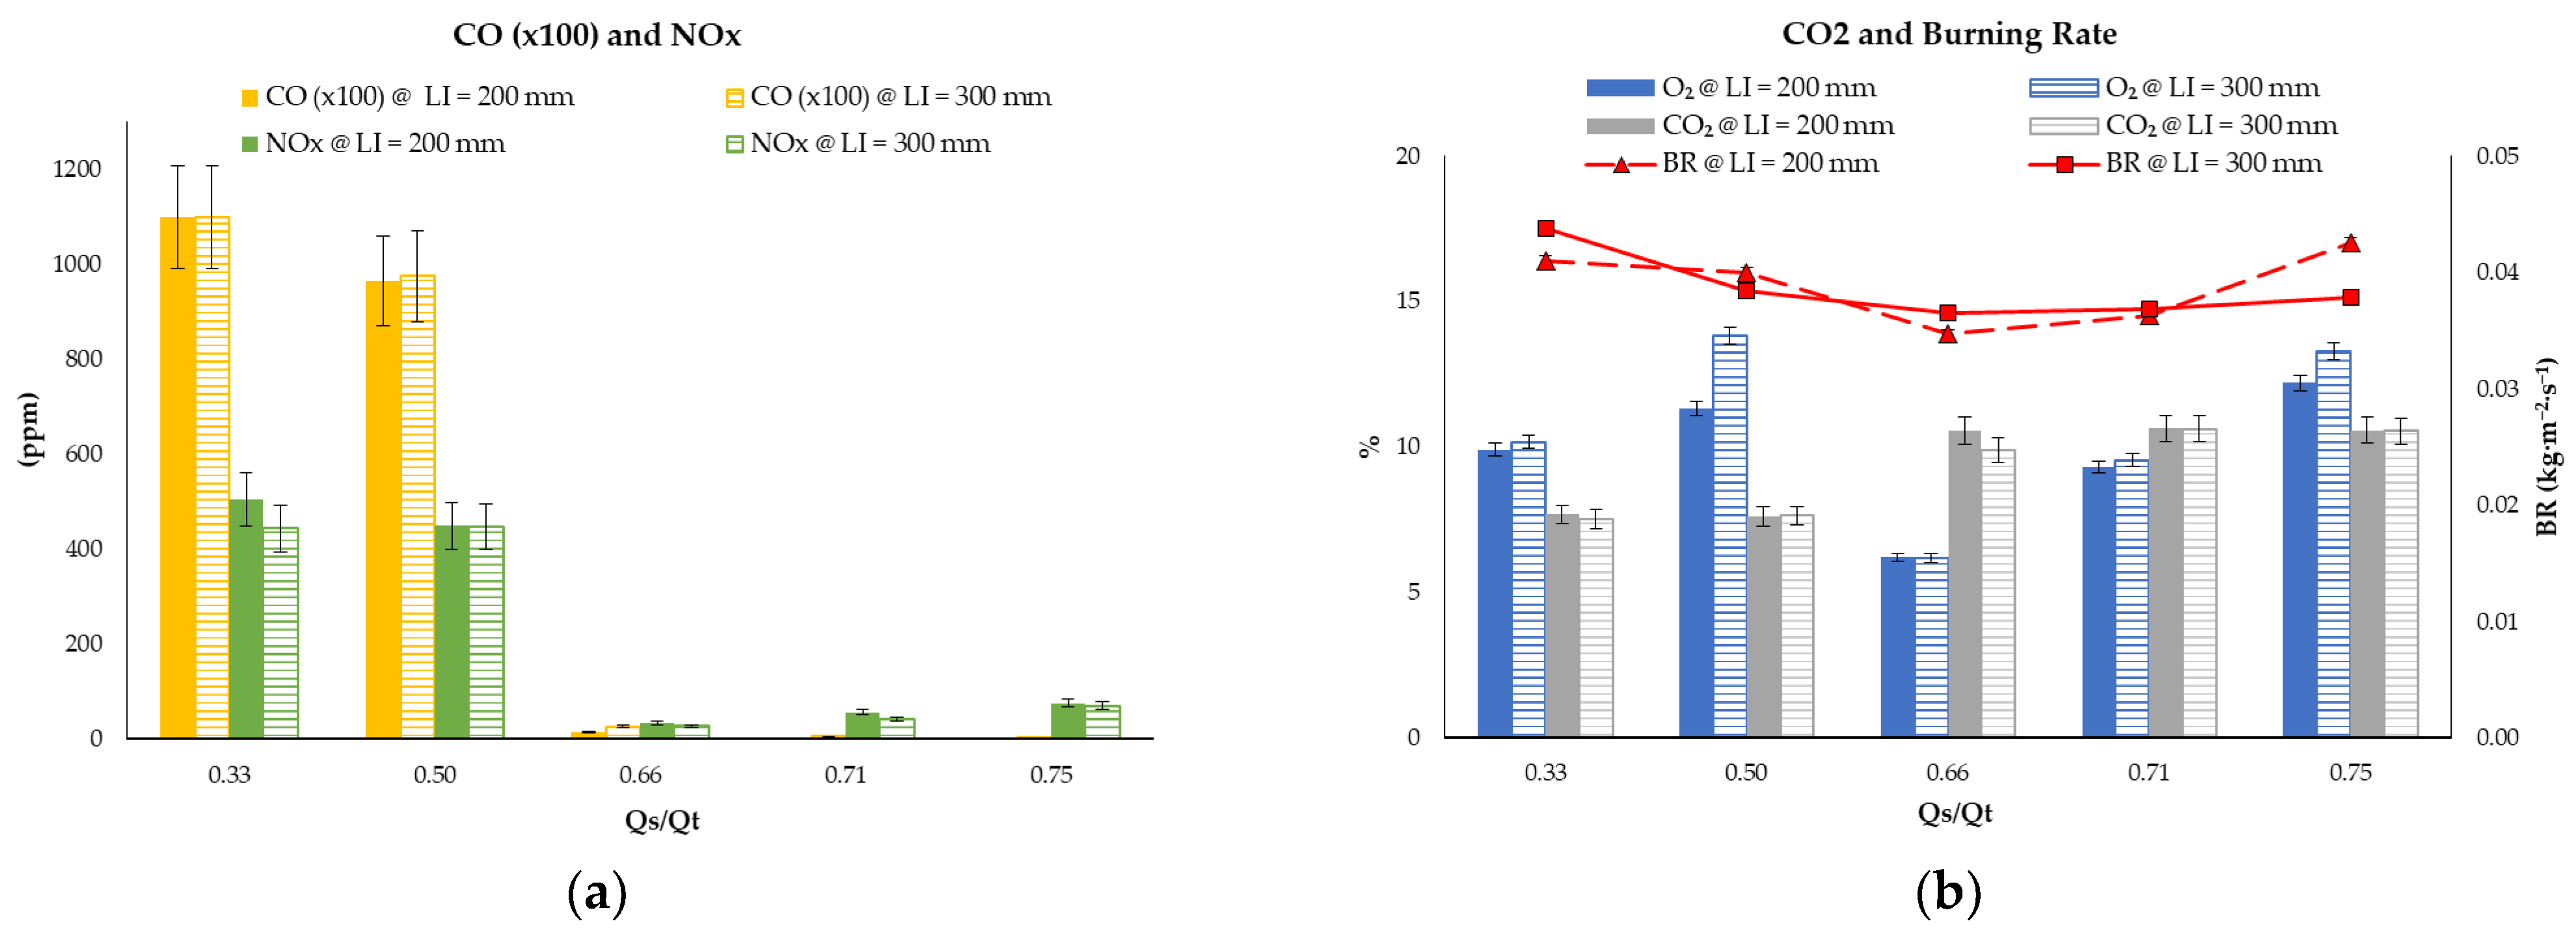
3. Results and Discussion

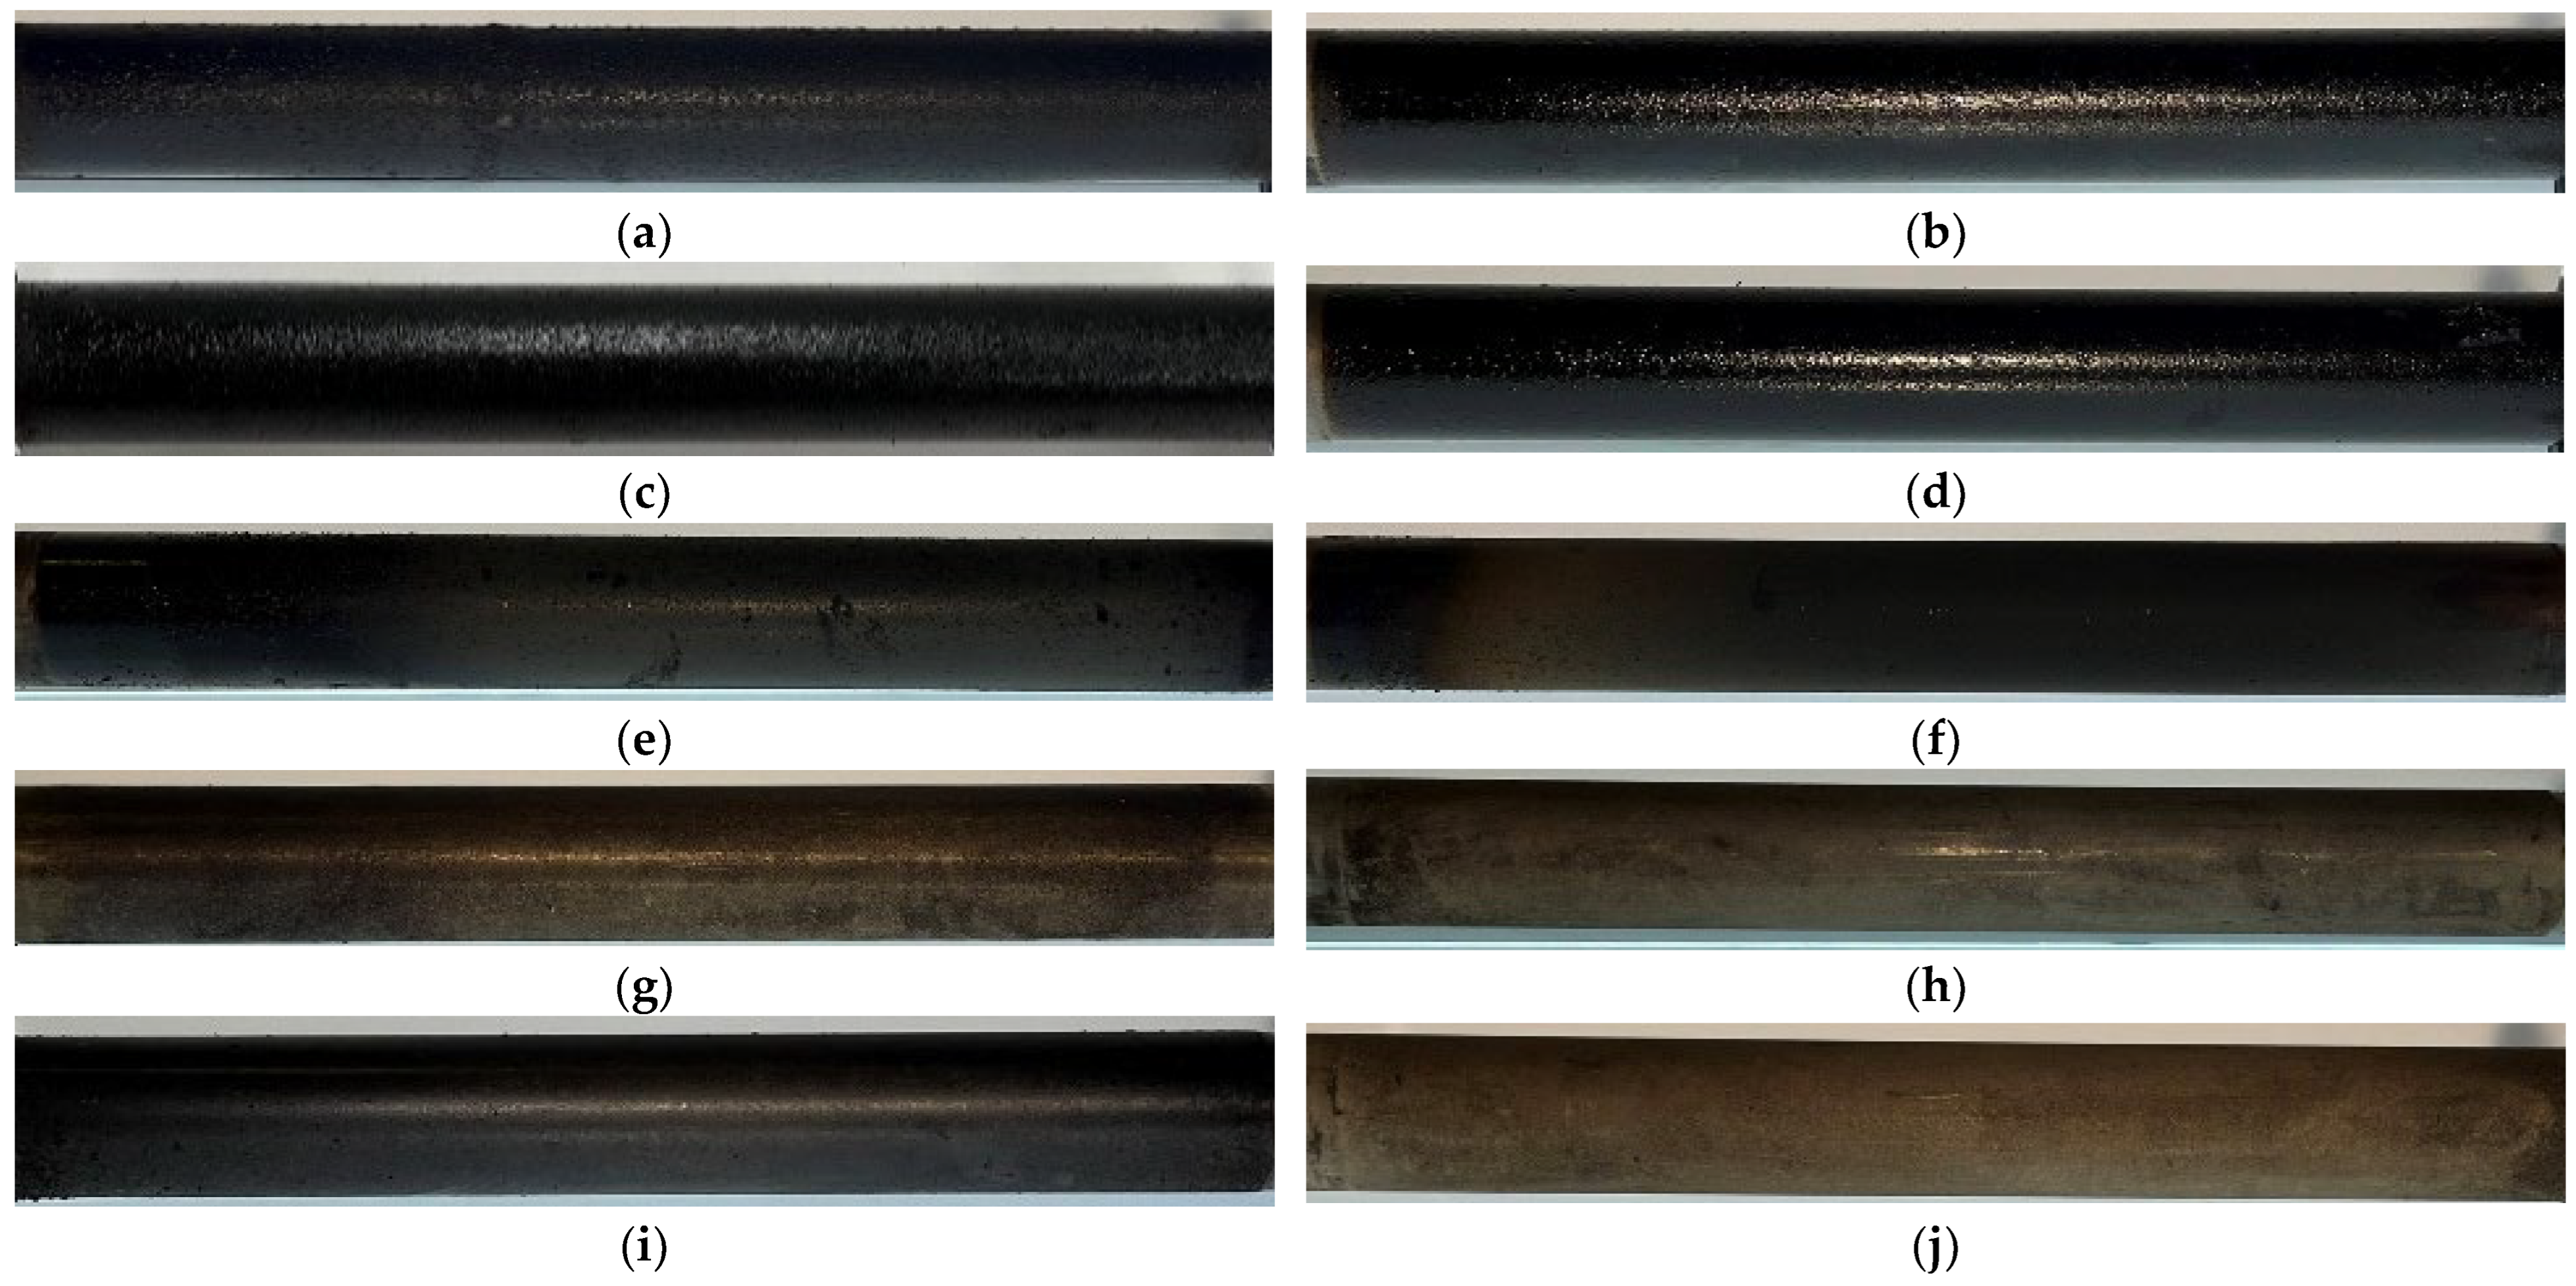
3.1. Physical Appearance and Hydrocarbon Deposits

Figure 3a–j shows the fouling deposits as they appeared on the surfaces of the cooled deposition pipes within the fouling module at the primary freeboard LI = 200 mm and LI = 300 mm over five ratios of Qs/Qt at the same Qp = 140 L·min−1 (0.089 kg·m−2·s−1). It is clearly visible that the fouling deposits are significantly different at the lower flowrates of Qs/Qt = 0.33 and 0.50, where they appear as thicker layers of sticky residue, indicative of higher hydrocarbon content, compared to the much thinner layers formed as Qs/Qt = 0.75 is approached.
To quantitatively assess the effects of Qs/Qt on the constituents of this fouling, Figure 4a,b present the TGA-normalised percentages of weight loss. Figure 4a depicts the weight loss percentage of the sample material collected for conditions with the primary freeboard LI = 200 mm. These data reveal a higher percentage of unburnt hydrocarbons at the lower two Qs/Qt ratios, where the freeboard, under the conditions of fixed fuel bed stoichiometry, is likely to be much richer compared to the Qs/Qt = 0.66 and above. The graph displays flattening of the weight loss percentage curve slope for conditions 0.33 and 0.50 at a time equal to 250 min. This time corresponds to a TGA system temperature of 500 °C using nitrogen as the purge gas. The gradual slope over the extended time interval of the first 250 min indicates a higher presence of heavier hydrocarbons in the analysed samples. This phenomenon contrasts with conditions 0.66 and 0.71, which exhibit steeper weight loss curves and a trend that becomes asymptotic just above 100 °C and up to 500 °C until the curve flattens after only about 75 min, indicative of a predominantly lighter hydrocarbon content that requires less time and temperature for disintegration. Notably, the combustion condition with Qs/Qt = 0.75 demonstrates the least hydrocarbon content, at less than 20%, compared to those of the other conditions, which can be multiple times greater. Similarly, the results in Figure 4b, which are for conditions of LI = 300 mm, are comparable in overall trend to the earlier ones (Figure 4a, at LI = 200 mm). However, most of the percentage weight losses at LI = 300 mm are greater compared to LI = 200 mm, particularly with stronger secondary air flow (Qs/Qt = 0.66 or higher). This indicates that the lower primary freeboard, or LI = 200 mm, led to less hydrocarbon content in the fouling materials.

3.2. Temperatures and Ash Deposits

Figure 5a,b show the temperature data and ash fouling deposits for LI = 200 mm and LI = 300 mm. A notable observation is that, although the primary air flow through the fuel bed remained unchanged throughout, at Qp = 140 L·min−1 (0.089 kg·m−2·s−1), the peak temperatures in the fuel bed increased with higher Qs/Qt values. This behaviour aligns with prior research by Junejo et al. [16], who analysed fuel bed temperatures across various secondary-to-total air ratios and primary freeboard lengths while holding the primary air flowrate constant, revealing consistent trends. The observed rise in peak bed temperature with increasing Qs/Qt values can be attributed to the fact that, despite the high flowrates at Qs/Qt = 0.66, 0.71, and 0.75, there was no suppression of the reactions within the bed, which instead aided the combustion process. Higher Qs/Qt values (0.66, 0.71, and 0.75) may facilitate combustion in the uppermost layers of the fuel bed. Consequently, this leads to possible temperature increases in the fuel bed itself. This trend was consistent across both primary freeboard lengths in the experiment, with the peak bed temperatures at LI = 200 mm recorded as 790, 818, 868, 919, and 908 °C for corresponding Qs/Qt values of 0.33, 0.50, 0.66, 0.71, and 0.75, respectively.
Despite the rise in peak fuel bed temperatures with increasing Qs/Qt values, changing the primary freeboard from 200 mm to 300 mm appeared to have minimal effects, with the largest variation being 3%, and the peak bed temperatures at LI = 300 mm for Qs/Qt = 0.33, 0.50, 0.66, and 0.71 were similarly recorded as 796, 800, 854, and 889 °C, respectively. Further away from the fuel bed and the point of injecting the secondary air into the freeboard, the temperatures in the fouling module’s air-cooled fouling deposition pipe also rose incrementally with the Qs/Qt ratio. This further supports the notion that a stronger secondary air flowrate (Qs), with the same primary air flowrate (Qp) used in this study, leads to higher temperatures in the flue gases.
This is evident from Figure 5, where the recorded freeboard temperatures in the fouling deposition pipe are 128, 154, 311, 333, and 397 °C at LI = 200 mm and 141, 152, 295, 321, and 330 °C at LI = 300 mm, for Qs/Qt ratios of 0.33, 0.50, 0.66, 0.71, and 0.75, respectively. However, whether in the fuel bed or at the fouling deposition pipe (i.e., freeboard), the temperatures appear comparable between data at LI = 200 and 300 mm. Temperatures at the fouling deposition pipe in the fouling module consistently recorded lower values for conditions with LI = 300 mm, with a maximum variation of up to 10% compared to the corresponding conditions at LI = 200 mm. The results in Figure 5a,b further indicate that the ash content, as deduced from the TGA data in Figure 4a,b, was directly proportional to the Qs/Qt ratio. This finding aligns with the visible reduction in sticky residue at higher Qs/Qt ratios, as shown in Figure 3, and was also accompanied by a reduction in hydrocarbons in the deposited constituents at greater Qs/Qt ratios, as indicated by Figure 4a,b. Beyond Qs/Qt = 0.50, the ash content percentages in the LI = 300 mm conditions were higher than in the LI = 200 mm conditions. Additionally, the influence of Qs/Qt on ash content appears stronger, with the ash content percentages recorded as 67.78% and 70.45% at Qs/Qt = 0.66 and 0.71 (LI = 200 mm), respectively, compared to 36.34% and 71.67% for larger primary freeboards (LI = 300 mm). The highest ash content percentage was observed at Qs/Qt 0.75, with values of 83.59% and 76.82% for LI = 200 and 300 mm, respectively, coinciding with the least amount of fouling matter observed in visual inspection (Figure 3). These results clearly indicate that the secondary air flowrate has a significant effect on the ash content in the deposited material.
While this study is primarily focused on the factors contributing to fouling in biomass combustion, it also highlights combustion indicators other than the temperatures. To better understand the effects of the secondary air flowrate and position on fuel conversion relative to fouling, in Appendix A, Figure A1a,b present the variation in additional indicators, such as the burning rate and flue gas emissions, including CO, CO2, and NOx (normalised to 10% oxygen reference as per ASTM PTC 19.10-1981) [16,32,33,34,35]. Over the air staging ratio (Qs/Qt) = 0.33 to 0.5 (Figure 5), lower ash contents occurred alongside elevated CO and NOx emissions (but relatively higher burning rates). Alternatively, when Qs/Qt = 0.66 to 0.75, a significant reduction in CO and NOx emissions was observed, alongside an increase in ash content and CO2, accompanied by relatively lower burning rates. Interestingly, at primary freeboard LI = 200 mm, increasing the Qs/Qt ratio appeared to influence the burning rate despite maintaining a constant primary air flowrate in the bed (i.e., same bed stoichiometry) [36]. The roles of staged combustion in emission and combustion efficiency have been published separately [16,29].

3.3. Morphology Analysis and Deposits

Fouling is a persistent issue encountered in biomass combustion systems. Understanding the characteristics and formation mechanisms of combustion fouling is crucial for optimising operational parameters. In this section, scanning electron microscopy (SEM) imaging is used to unravel the intricate morphology of fouling under varied Qs/Qt ratios at LI = 200 mm. In Figure 6a,b, lower flowrate ratios (Qs/Qt 0.33 and 0.50, respectively) show distinct morphological features in the SEM images. These images showcase well-defined structured fouling material, suggesting that, at lower flowrate ratios, the deposited fouling material may possess a more cohesive nature. The physical appearance of the pipes in Figure 3 and the TGA graphs in Figure 4a confirm this observation, validating the existence of higher contents of unburnt hydrocarbons and its tacky nature. The SEM images (Figure 6c–e) of conditions for Qs/Qt 0.66 and higher indicate a shift in the fouling morphology, resulting in a more compact and uniform deposition. This is obvious due to the effect of higher Qs/Qt ratios that fostered increased turbulence, which led to dispersion of the fouling deposition. As shown in Figure 5, Qs/Qt is a factor that influences the biomass peak bed temperature. Yao et al. [37] found that the fouling morphology is influenced by the biomass peak bed temperature, verifying the findings established from the SEM images in Figure 6. The images presented highlight the transition from structured, agglomerated fouling deposits at the lower Qs/Qt ratios towards the finer fouling layers at higher ratios, indicative of more compact deposition layers resulting from increased dispersion at the higher ratios.

4. Conclusions

An investigation into biomass fouling in combustion provided insights into the relationships between operational parameters, design factors, and fouling characteristics in fixed-bed batch-type biomass combustors. The effects of the secondary air flowrate (Qs/Qt) on fouling in a fixed-bed batch-type biomass combustor were investigated. Specifically, we examined the impact of Qs/Qt flowrate ratios of 0.33, 0.50, 0.66, 0.71, and 0.75 on the physical appearance of fouling, hydrocarbon deposits, and ash content under two air-staging conditions (primary freeboard lengths LI = 200 mm and 300 mm). The main outcomes of this research are as follows:

4.1. Physical Appearance and Hydrocarbon Deposits

  • At lower Qs/Qt ratios (0.33 and 0.50), the fouling deposits were thicker and stickier, indicating a higher content of unburnt hydrocarbons, which was confirmed by TGA analysis, showing gradual weight loss over an extended period during the heating process.
  • Higher Qs/Qt ratios (0.66, 0.71, and 0.75) resulted in thinner fouling layers, suggesting more complete combustion and less hydrocarbon residue.
  • At higher Qs/Qt ratios, particularly 0.75, the hydrocarbon content in the fouling was significantly reduced, with the weight loss curve indicating a faster and more complete combustion process.

4.2. Ash Deposits and Morphology

  • The ash content, as indicated by the TGA data, was directly proportional to the Qs/Qt ratios.
  • The experiments showed that conditions with a larger primary freeboard (LI = 300 mm) were correlated with higher ash content compared to a shorter primary freeboard (LI = 200 mm) at similar Qs/Qt ratios.
  • Scanning electron microscopy (SEM) revealed that higher Qs/Qt ratios promoted increased turbulence and finer particle dispersion, resulting in more dispersed fouling deposits. Lower Qs/Qt ratios, however, were associated with more cohesive particles, suggesting a distinct morphological impact on the fouling characteristics.
Higher Qs/Qt ratios fostered increased turbulence and dispersed particles, resulting in fine layer of fouling deposits. Conversely, lower Qs/Qt ratios displayed distinct features, hinting at a more cohesive nature of the fouling material. Temperature dynamics revealed a pivotal relationship between ash content and deposited mass on pipes, indicating the role of ash in mitigating fouling. Morphological investigations through SEM imaging unveiled the nuanced impact of Qs/Qt ratios on fouling characteristics. The findings of this research provide valuable insights into optimising combustion conditions in biomass energy systems. By adjusting the secondary air flowrate, it is possible to achieve more efficient combustion with reduced hydrocarbon deposits and manage fouling more effectively. While this study demonstrated the effect of air staging on fouling deposited using air-cooled fouling deposition pipes, future research could investigate the use of water to control the temperature of deposition pipes. Additionally, the influence of the primary air flowrate on fouling behaviour could be further explored to better understand its role in mitigating fouling. This optimisation could enhance the reliability and efficiency of biomass combustors, contributing to the advancement of biomass as a viable, carbon-neutral energy source.

Author Contributions

Conceptualisation, A.E. and Y.M.A.-A.; methodology, A.E. and Y.M.A.-A.; validation, A.E., M.Z., and Y.M.A.-A.; formal analysis, A.E.; investigation, A.E.; resources, A.E., M.Z., and Y.M.A.-A.; data curation, A.E.; writing—original draft preparation, A.E.; writing—review and editing, A.E., M.Z., and Y.M.A.-A.; visualisation, A.E.; supervision, M.Z. and Y.M.A.-A.; project administration, Y.M.A.-A.; funding acquisition, Y.M.A.-A. All authors have read and agreed to the published version of the manuscript.

Funding

This research received no external funding.

Institutional Review Board Statement

Not applicable.

Informed Consent Statement

Not applicable.

Data Availability Statement

The data presented in this study are available upon request from the corresponding author.

Conflicts of Interest

The authors declare no conflicts of interest.

Appendix A

Figure A1. (a) CO (100×) (ppm) and NOx (ppm) emissions and (b) CO2%, O2% (left axis), and burning rate (kg·m−2·s−1) (right axis) at LI = 200 mm (solid) and LI = 300 mm (stripes) for Qs/Qt = 0.33 to 0.75.
Sustainability 16 08584 g0a1

References

  1. Hilmawan, E.; Kuswa, F.M.; Darmawan, A.; Aziz, M. A comprehensive evaluation of cofiring biomass with coal and slagging-fouling tendency in pulverized coal-fired boilers. Ain Shams Eng. J. 2023, 14, 102001. [Google Scholar] [CrossRef]
  2. Kongto, P.; Palamanit, A.; Ninduangdee, P.; Singh, Y.; Chanakaewsomboon, I.; Hayat, A.; Wae-hayee, M. Intensive exploration of the fuel characteristics of biomass and biochar from oil palm trunk and oil palm fronds for supporting increasing demand of solid biofuels in Thailand. Energy Rep. 2022, 8, 5640–5652. [Google Scholar] [CrossRef]
  3. Febrero, L.; Granada, E.; Regueiro, A.; Míguez, J.L. Influence of Combustion Parameters on Fouling Composition after Wood Pellet Burning in a Lab-Scale Low-Power Boiler. Energies 2015, 8, 9794–9816. [Google Scholar] [CrossRef]
  4. Jagodzińska, K.; Gądek, W.; Pronobis, M.; Kalisz, S. Investigation of ash deposition in PF boiler during combustion of torrefied biomass. IOP Conf. Ser. Earth Environ. Sci. 2019, 214, 012080. [Google Scholar] [CrossRef]
  5. Sandberg, J. Long time investigation of the effect of fouling on the superheaters in a circulating fluidized biomass boiler. Int. J. Energy Res. 2006, 30, 1037–1053. [Google Scholar] [CrossRef]
  6. Chapela, S.; Porteiro, J.; Gómez, M.A.; Patiño, D.; Míguez, J.L. Comprehensive CFD modeling of the ash deposition in a biomass packed bed burner. Fuel 2018, 234, 1099–1122. [Google Scholar] [CrossRef]
  7. Cai, Y.; Tay, K.; Zheng, Z.; Yang, W.; Wang, H.; Zeng, G.; Li, Z.; Keng Boon, S.; Subbaiah, P. Modeling of ash formation and deposition processes in coal and biomass fired boilers: A comprehensive review. Appl. Energy 2018, 230, 1447–1544. [Google Scholar] [CrossRef]
  8. Koppejan, J.; van Loo, S. The Handbook of Biomass Combustion and Co-Firing; Taylor & Francis: Abingdon, UK, 2012. [Google Scholar]
  9. Singh, A.; Sharma, V.; Mittal, S.; Pandey, G.; Mudgal, D.; Gupta, P. An overview of problems and solutions for components subjected to fireside of boilers. Int. J. Ind. Chem. 2018, 9, 1–15. [Google Scholar] [CrossRef]
  10. Baxter, L. Biomass-Coal Cofiring: An Overview of Technical Issues. In Solid Biofuels for Energy: A Lower Greenhouse Gas Alternative; Grammelis, P., Ed.; Springer: London, UK, 2011; pp. 43–73. [Google Scholar]
  11. Sandberg, J.; Sand, U.; Bel Fdhila, R.; Sand, U. Measurements, Theories and Simulations of Particle Deposits on Super-Heater Tubes in a CFB Biomass Boiler. Int. J. Green Energy 2006, 3, 43–61. [Google Scholar] [CrossRef]
  12. Wang, L.; Skjevrak, G.; Hustad, J.E.; Skreiberg, Ø. Investigation of Biomass Ash Sintering Characteristics and the Effect of Additives. Energy Fuels 2014, 28, 208–218. [Google Scholar] [CrossRef]
  13. Patiño, D.; Crespo, B.; Porteiro, J.; Míguez, J.L. Experimental analysis of fouling rates in two small-scale domestic boilers. Appl. Therm. Eng. 2016, 100, 849–860. [Google Scholar] [CrossRef]
  14. Theis, M.; Skrifvars, B.-J.; Hupa, M.; Tran, H. Fouling tendency of ash resulting from burning mixtures of biofuels. Part 1: Deposition rates. Fuel 2006, 85, 1125–1130. [Google Scholar] [CrossRef]
  15. Regueiro, A.; Patiño, D.; Granada, E.; Porteiro, J. Experimental study on the fouling behaviour of an underfeed fixed-bed biomass combustor. Appl. Therm. Eng. 2017, 112, 523–533. [Google Scholar] [CrossRef]
  16. Junejo, A.; Al-Abdeli, Y.M.; Porteiro, J. Role of Air Staging in a Batch-Type Fixed Bed Biomass Combustor under Constant Primary Air. J. Therm. Sci. 2023, 33, 284–299. [Google Scholar] [CrossRef]
  17. Junejo, A.; Chapela, S.; Porteiro, J.; Al-Abdeli, Y.M. Secondary air induced flow structures and mixing in a fixed bed combustor. Proc. Inst. Mech. Eng. Part A J. Power Energy 2023, 237, 1479–1492. [Google Scholar] [CrossRef]
  18. Junejo, A.; Al-Abdeli, Y.M.; Ikhlaq, M. Progress Variables to Resolve the Steady State Period in a Batch-Type Fixed Bed Combustor. Combust. Sci. Technol. 2022, 196, 1–23. [Google Scholar] [CrossRef]
  19. Junejo, A.; Al-Abdeli, Y.M.; Porteiro, J. Freeboard Effects on Instabilities in a Fixed Bed Biomass. In Proceedings of the Australian Combustion Symposium, Queensland, Australia, 21–24 November 2021; pp. 176–180. [Google Scholar]
  20. Junejo, A. Freeboard Effects in a Fixed Bed Biomass Combustor. Ph.D. Thesis, Edith Cowan University, Perth, Australia, 2022. [Google Scholar]
  21. Riaz, S.; Al-Abdeli, Y.M.; Oluwoye, I.; Altarawneh, M. Torrefaction of Densified Woody Biomass: The Effect of Pellet Size on Thermochemical and Thermophysical Characteristics. BioEnergy Res. 2022, 15, 544–558. [Google Scholar] [CrossRef]
  22. ASTM E871-82(2019); Standard Test Method for Moisture Analysis of Particulate Wood Fuels. ASTM International: West Conshohocken, PA, USA, 2019.
  23. ASTM E872-82(2019); Standard Test Method for Volatile Matter in the Analysis of Particulate Wood Fuels. ASTM International: West Conshohocken, PA, USA, 2019.
  24. ASTM D1102-84(2021); Standard Test Method for Ash in Wood. ASTM International: West Conshohocken, PA, USA, 2021.
  25. ASTM E873-82(2019); Standard Test Method for Bulk Density of Densified Particulate Biomass Fuels. ASTM International: West Conshohocken, PA, USA, 2019.
  26. ASTM D5865(2007); A Standard Test Method for Gross Calorific Value of Coal and Coke. ASTM International: West Conshohocken, PA, USA, 2007.
  27. Menczel, J.D.; Prime, R.B. Thermal Analysis of Polymers: Fundamentals and Applications; John Wiley & Sons, Inc.: Hoboken, NJ, USA, 2009; pp. 260–266. [Google Scholar]
  28. Rashidian, B.; Al-Abdeli, Y.M.; Yeoh, G.H.; Patiño, D.; Guzzomi, F. Methodologies for Processing Fixed Bed Combustor Data. Combust. Sci. Technol. 2017, 189, 79–102. [Google Scholar] [CrossRef]
  29. Junejo, A.; Al-Abdeli, Y.M.; Porteiro, J. Role of Primary Freeboard on Staged Combustion of Hardwood Pellets in a Fixed Bed Combustor. BioEnergy Res. 2023, 16, 1579–1591. [Google Scholar] [CrossRef]
  30. Elsebaie, A.; Zhu, M.; Al-Abdeli, Y.M. Experimental uncertainty and time-resolved process variability of biomass combustion during fouling tests. In Proceedings of the Australian Combustion Symposium, Darwin, Australia, 26 November 2023; pp. 54–57. [Google Scholar]
  31. Moffat, R.J. Describing the uncertainties in experimental results. Exp. Therm. Fluid Sci. 1988, 1, 3–17. [Google Scholar] [CrossRef]
  32. Rashidian, B.; Al-Abdeli, Y.M.; Patiño, D.; Guzzomi, F.G.; Yeoh, G.H. Effect of freeboard deflectors in the fixed bed combustion of biomass. Appl. Therm. Eng. 2016, 103, 543–552. [Google Scholar] [CrossRef]
  33. Mami, M.A.; Mätzing, H.; Gehrmann, H.-J.; Stapf, D.; Bolduan, R.; Lajili, M. Investigation of the Olive Mill Solid Wastes Pellets Combustion in a Counter-Current Fixed Bed Reactor. Energies 2018, 11, 1965. [Google Scholar] [CrossRef]
  34. Lundgren, J.; Hermansson, R.; Dahl, J. Experimental studies of a biomass boiler suitable for small district heating systems. Biomass Bioenergy 2004, 26, 443–453. [Google Scholar] [CrossRef]
  35. American Society of Mechanical Engineers. Flue and Exhaust Gas Analysis, ASME Power Test Code 19.10; ASME: New York, NY, USA, 1981. [Google Scholar]
  36. Junejo, A.; Chapela, S.; Porteiro, J.; Al-Abdeli, Y.M. Secondary air induced flow structures and their interplay with the temperature field in fixed bed combustors. Proc. Inst. Mech. Eng. Part A J. Power Energy 2024, 09576509241275778. [Google Scholar] [CrossRef]
  37. Yao, X.; Xu, K.; Yan, F.; Liang, y. The Influence of Ashing Temperature on Ash Fouling and Slagging Characteristics during Combustion of Biomass Fuels. BioResources 2017, 12, 1593–1610. [Google Scholar] [CrossRef]
Figure 1. (a) Combustor sectional view and (b) lab set-up: (1) primary air inlet ports (2×), (2) packed fuel bed, (3) fuel charging ports, (4) fouling module and air-cooled fouling deposition probes, (5) exhaust stack, (6) secondary air supply line and distribution, (7) thermocouples.
Sustainability 16 08584 g001
Figure 2. (a) Fouling module lab set-up and (b) schematic diagram.
Sustainability 16 08584 g002
Figure 3. Deposit pipes’ physical appearance: (a) Qs/Qt = 0.33 at LI = 200 mm, (b) Qs/Qt = 0.33 at LI = 300 mm, (c) Qs/Qt = 0.50 at LI = 200 mm, (d) Qs/Qt = 0.50 at LI = 300 mm, (e) Qs/Qt = 0.66 at LI = 200 mm, (f) Qs/Qt = 0.66 at LI = 300 mm, (g) Qs/Qt = 0.71 at LI = 200 mm, (h) Qs/Qt = 0.71 at LI = 300 mm, (i) Qs/Qt = 0.75 at LI = 200 mm, and (j) Qs/Qt = 0.75 at LI = 300 mm.
Sustainability 16 08584 g003
Figure 4. Normalised weight loss percentages of fouling deposits derived from TGA (left Y-axis) at Qs/Qt = 0.33 to 0.75; program temperature (right Y-axis). Conditions: (a) LI = 200 mm and (b) LI = 300 mm.
Sustainability 16 08584 g004
Figure 5. Temperatures, ash content, and total deposits for (a) LI = 200 mm and (b) LI = 300 mm at Qs/Qt = 0.33 to 0.75. Left axis: fuel bed temperatures (°C) and total fouling deposits (mg). Right axis: fouling probe temperatures.
Sustainability 16 08584 g005
Figure 6. SEM images of fouling deposits samples for combustion condition LI = 200 mm at Qs/Qt ratios of (a) 0.33, (b) 0.50, (c) 0.66, (d) 0.71, and (e) 0.75.
Sustainability 16 08584 g006aSustainability 16 08584 g006b
Table 1. Biomass fouling studies.
Ref.Combustor TypeFuel FormFouling TypeFR * (g·m−2·h−1)Temp. Range
[13]Top-feed, 24 kWWood pellets,
6 mm diameter
Deposited matter7–12-
[14]Lab-scale, top-feed reactorPeat
(air-dried milled < 1 mm)
Fly ash deposition201000
Bark
(air-dried milled < 1 mm)
80
Straw
(air-dried milled < 1 mm)
160
[15]Lab-scale under-feed fixed-bed,
12 kW
Wood pellets,
6 mm diameter, 20 mm length
Attached and deposited matter7–28550–600
[5]CFB ** boiler,
157 MW
Biomass: peat: recycling wood
55%: 38%: 7%
Fly ash and alkaline compounds, condensation and sintering4785–820
86%: 7%: 7%14.5
78%: 7%: 15%12
* FR: fouling rate; ** CFB: circulating fluidised bed.
Table 2. Proximate and ultimate fuel analysis [18,21].
Proximate Analysis (wt %)
Moisture6.62
Volatile matter *78.41
Fixed carbon *14.11
Ash0.86
Ultimate Analysis (wt %)
Carbon45.80
Oxygen48.80
Hydrogen5.40
Nitrogen0
* Dry basis.
Table 3. TGA process conditions.
StepProgram ConditionProcess DetailPurge GasFlowrate
1From ambient to 105 °CHeating rate 10 °C·min−1Nitrogen20 mL·min−1
2Hold at 105 °C (15 min)IsothermalNitrogen20 mL·min−1
3From 105 °C to 500 °CHeating rate 10 °C·min−1Nitrogen20 mL·min−1
4Hold at 500 °C (240 min)IsothermalNitrogen20 mL·min−1
5Hold at 500 °C (180 min)IsothermalAir20 mL·min−1
Table 4. Raw biomass combustion conditions using a fuel batch of 3.9 kg for each test.
#Qs (L·min−1) [kg·m−2·s−1]Qt (L·min−1) [kg·m−2·s−1]Qs/QtQp (L·min−1) [kg·m−2·s−1]LI (mm)
1(70) [0.044](210) [0.134]0.33(140) [0.089]200
2(140) [0.089](280) [0.178]0.50
4(280) [0.178](420) [0.267]0.66
5(350) [0.223](490) [0.312]0.71
6(420) [0.267](560) [0.356]0.75
7(70) [0.044](210) [0.134]0.33(140) [0.089]300
8(140) [0.089](280) [0.178]0.50
10(280) [0.178](420) [0.267]0.66
11(350) [0.223](490) [0.312]0.71
12(420) [0.267](560) [0.356]0.75
Disclaimer/Publisher’s Note: The statements, opinions and data contained in all publications are solely those of the individual author(s) and contributor(s) and not of MDPI and/or the editor(s). MDPI and/or the editor(s) disclaim responsibility for any injury to people or property resulting from any ideas, methods, instructions or products referred to in the content.

