Abstract
Phosphorus is a vital nutrient essential for plant development and numerous biological functions. It is primarily obtained from phosphate rock through a process known as beneficiation. However, the declining reserves of high-grade phosphate rock, combined with the uneven global distribution of phosphorus and the environmental impacts associated with its extraction and use, highlight the need for a more efficient management of this critical resource. Increasingly, alternative sources of phosphorus, such as extraction from waste materials, are being explored. This study aims to assess the feasibility of recovering phosphorus from coarse rejects produced during phosphate beneficiation at a phosphate washing plant. Before conducting laboratory preparation and reverse flotation tests, the sample underwent initial laboratory examination and analysis. The sample was found to contain low-grade apatite minerals with a phosphorus pentoxide (P2O5) content ranging from 19% to 20%. Additionally, carbonate and quartz were identified as the primary accompanying minerals. Flotation experiments yielded a phosphorus recovery rate of 29% P2O5, with a carbonation rate of 1.6. Although this recovery rate is slightly below the commercial phosphate standard of 30% P2O5, it represents a significant improvement and demonstrates potential for further optimization to meet industry requirements. Consequently, these coarse discarded rejects could serve as a supplementary source of phosphorus in the future.
1. Introduction
Phosphorus is a key nutrient essential for plant growth and is involved in various biological processes, including DNA synthesis, photosynthesis, and energy transfer. Its critical role in sustaining global food production makes it a necessary component of fertilizers used in agriculture [1,2].
The majority of the Earth’s phosphorus is extracted from phosphate rock, a non-renewable resource predominantly sourced from sedimentary (87%) and igneous (13%) types [3,4]. The increasing global population and shifts in dietary habits are expected to significantly raise the demand for phosphorus in the coming decades, particularly due to the growing consumption of meat and dairy products, which are phosphorus-intensive [5]. However, the accessibility of phosphorus is increasingly limited, with most reserves concentrated in a few countries, including Morocco, China, the USA, South Africa, and Jordan [6]. Morocco alone holds around 70% of the global phosphate rock reserves [7]. This uneven distribution of phosphorus, one of the world’s most critical minerals, could lead to geopolitical tensions and instability regarding its future supply [6].
Phosphate rock used to produce phosphoric acid must meet specific industry criteria, including a minimum P2O5 concentration of 30%, a CaO/P2O5 ratio of less than 1.6, a maximum MgO content of 1%, and a combined Fe2O3 and Al2O3 content of no more than 2.5% [8,9]. Phosphate rocks that do not meet these criteria require beneficiation, a process that involves separating phosphate-bearing minerals from other minerals in the rock. This typically involves crushing, grinding, desliming, and flotation [10]. However, the beneficiation process generates significant volumes of byproducts, particularly coarse rejects, which contain around 20% P2O5 and high concentrations of carbonates. These byproducts pose environmental challenges due to the need for extensive land use for storage, often leading to the creation of large waste ponds [10].
Given the challenges associated with current phosphate refining processes, an alternative approach involves recovering phosphorus from waste materials, such as coarse phosphate rejects. Reusing these secondary products can greatly reduce resource wastage and alleviate environmental problems [11,12,13].
In recent years, the recovery of phosphorus from mining waste has gained significant attention as part of broader sustainability and circular economy strategies. One notable example is the ReeMAP project in Sweden, which focuses on extracting phosphorus and rare earth elements from tailings through innovative processes such as flotation and acid leaching. This project exemplifies how mining waste, often considered a liability, can be transformed into valuable resources, contributing to the reduction in environmental impact and the enhancement in resource efficiency [14].
Various techniques have been employed to enhance the quality of phosphate byproducts for fertilizer production:
- Grinding and Flotation: Techniques like grinding and flotation [15,16,17] have shown promising results in recovering phosphorus from coarse rejects. For example, rougher waste from the Redayef processing plant in Tunisia was subjected to a series of physicochemical treatments, including crushing, grinding, scrubbing, classification, attrition, desliming, and reverse flotation, achieving a commercial-grade P2O5 concentration of approximately 29% [15]. Similarly, a coarse reject from the Kef-Eddur washing plant was upgraded from 12.51% to 26.80% P2O5 through attrition and reverse flotation processes [17]. Additionally, recent studies on Florida waste clay have demonstrated the effectiveness of desliming followed by froth flotation, increasing the P2O5 grade from an initial 8% to 21%, with a corresponding recovery of approximately 80% [18].
- Acid Leaching: Acid leaching has also been effectively used to extract phosphorus from phosphate ore wastes. In one study, acetic acid was employed as a leaching agent on phosphate ore wastes from El-Nasr Mining. The process resulted in a significant increase in P2O5 concentration, from 23.88% to 28.44% for particles measuring −100 μm, with a corresponding weight recovery of 84%. For particles measuring −250 μm, the P2O5 concentration increased from 21.42% to 25.51%, with a weight recovery of 86.33% [19]. This method highlights the potential of acid leaching in upgrading the quality of low-grade phosphate ores.
- Calcination: Calcination is another method that has shown promise in enhancing the quality of calcareous phosphate ores, particularly in the concentration of coarse phosphate waste. By subjecting phosphate ore to elevated temperatures, impurities are eliminated, transforming the material into a more concentrated state. This process has been particularly effective in improving the concentration of coarse phosphate waste, making it a viable option for recovering phosphorus from low-grade ores [20].
This study addresses the key challenges of phosphate waste management by investigating the application of reverse flotation. As previously mentioned, froth flotation is widely regarded as one of the most efficient and commonly used beneficiation techniques, particularly for processing complex ores with fine particles and high levels of carbonate impurities [21,22,23,24]. Compared to other beneficiation methods, such as magnetic or gravity separation, flotation consistently proves more effective. However, direct flotation tends to be less efficient in the presence of carbonaceous gangue due to the similar physicochemical properties of phosphate and carbonate minerals [25]. For this reason, reverse flotation is the preferred method for separating valuable phosphate minerals from carbonate gangue, selectively removing carbonates and silicates from phosphate ores [26]. Studies show that reverse flotation not only improves phosphorus recovery but also significantly reduces waste generation [27,28]. Additionally, it reduces the need for large reagent doses, making the process more sustainable and cost-efficient [29].
By optimizing the parameters of the reverse flotation process, this study aims to assess whether it can effectively convert phosphate waste into a valuable resource. Ultimately, this approach could contribute to the sustainable development of the phosphate industry by reducing environmental impact and improving resource efficiency.
2. Materials and Methods
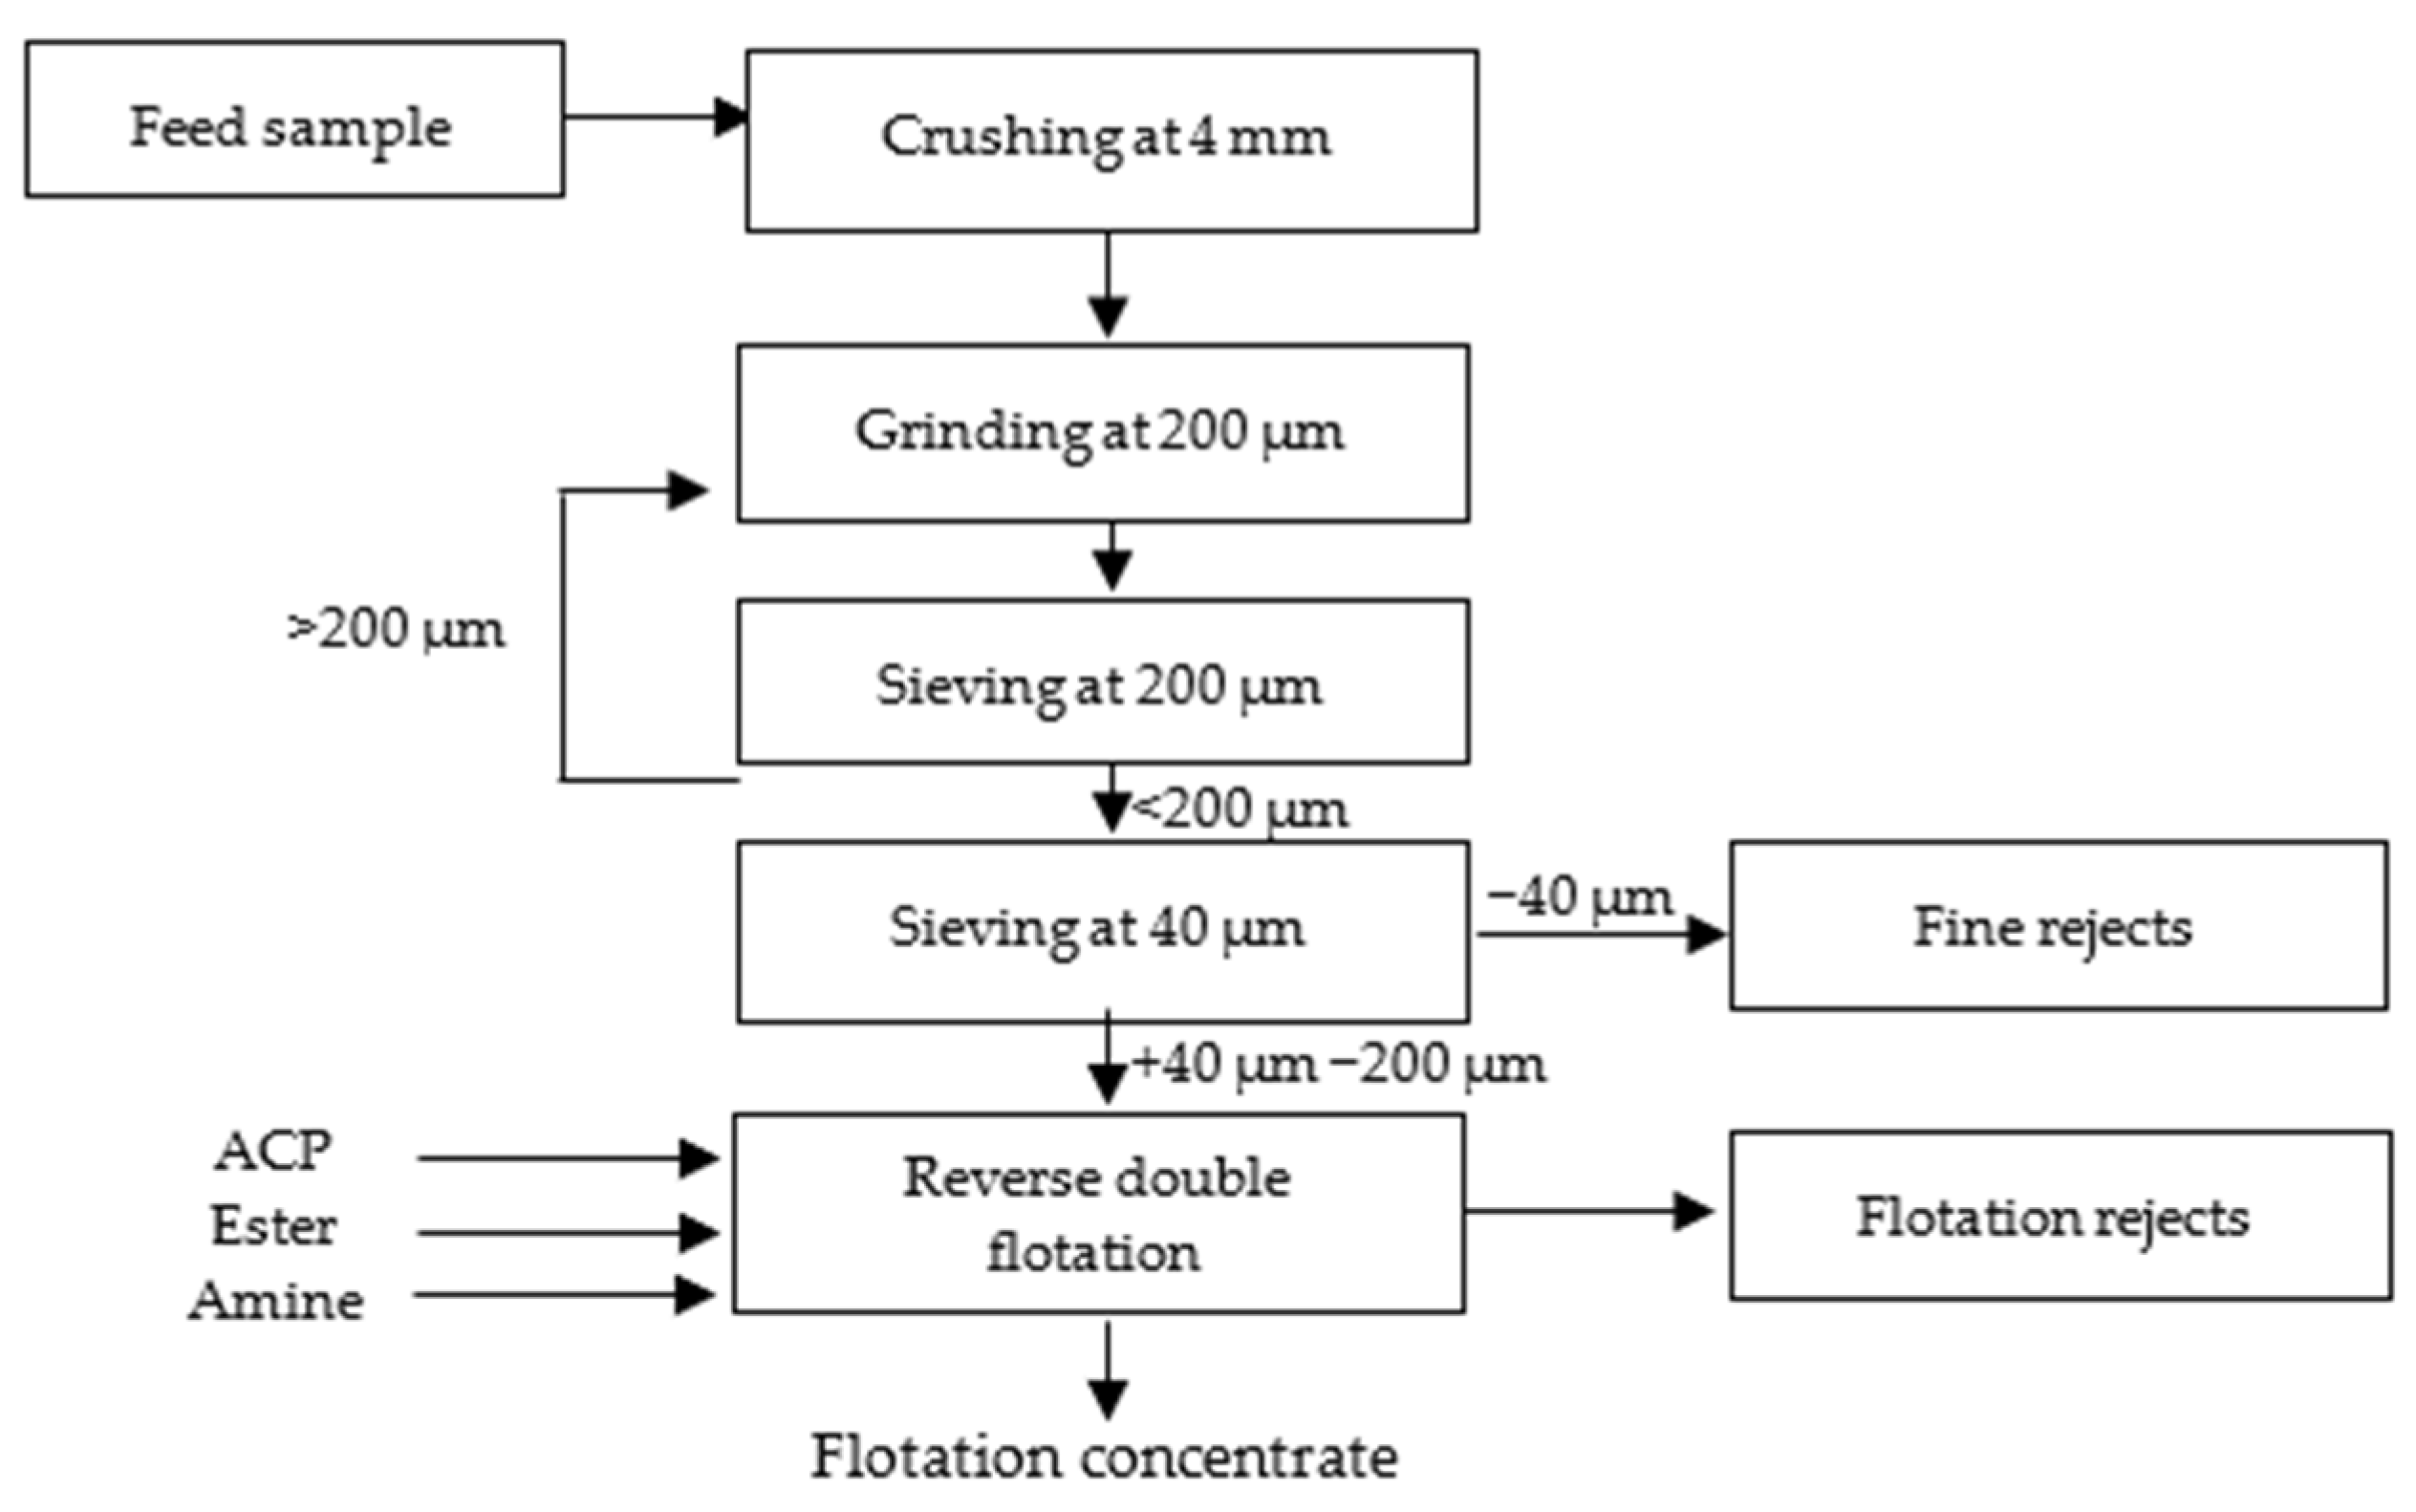
A sample of the coarse reject from the beneficiation of phosphate ore (highlighted in bold in Figure 1), collected during screening at a 2.5 mm size in the washing plant, was provided for this study. The sampling method adhered to the established procedures used at the plant. It is important to note that the ore contains the same mineralogical phases as the reject but exhibits better mineral liberation and is richer in P2O5, with a content of approximately 27–29%, compared to the reject, which has a P2O5 content of 19–20%.
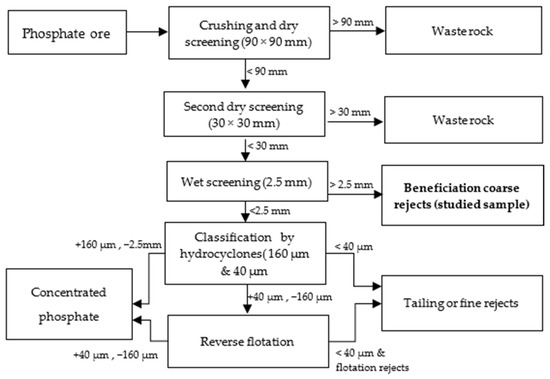
Figure 1.
Extraction and beneficiation steps.
2.1. Analysis and Characterization
The sample underwent preparation, division, identification, and storage in dedicated storage boxes. A portion of this sample was further ground to 75 μm for chemical and mineralogical characterization.
Physical analysis was conducted using AFNOR standard sieves with apertures of 2500, 1000, 800, 400, 250, 160, 125, 80, 40, and 200 microns. The sieves were shaken in a mechanical shaker for a sufficient time to ensure complete separation according to the specifications of the sieve shaker used.
Chemical analysis was conducted using ICP-AES and ICP-MS to determine the chemical composition of the samples. The solids were first dissolved using a multi-acid solution. The resulting solutions were then analyzed using two different approaches: inductively coupled plasma atomic emission spectrometry (ICP-AES) and inductively coupled plasma mass spectrometry (ICP-MS). ICP-AES was used primarily for analyzing major elements and specific trace elements, while ICP-MS was employed for multi-element analysis requiring higher sensitivity, particularly for elements present at trace levels.
Mineralogical analysis: The samples were analyzed using X-ray diffraction (XRD) and scanning electron microscopy (SEM) coupled with energy-dispersive X-ray spectroscopy (EDX) to determine the main mineralogical phases present in the ore and their respective proportions. Additionally, the SEM-EDX analysis allowed for the identification and characterization of mixed or intergrown mineral phases. Automated mineralogical analysis was also conducted using a Zeiss Mineralogy SEM to determine the proportions of valuable minerals and gangue minerals. Prior to analysis, the samples were prepared as polished sections.
2.2. Flotation Experiments
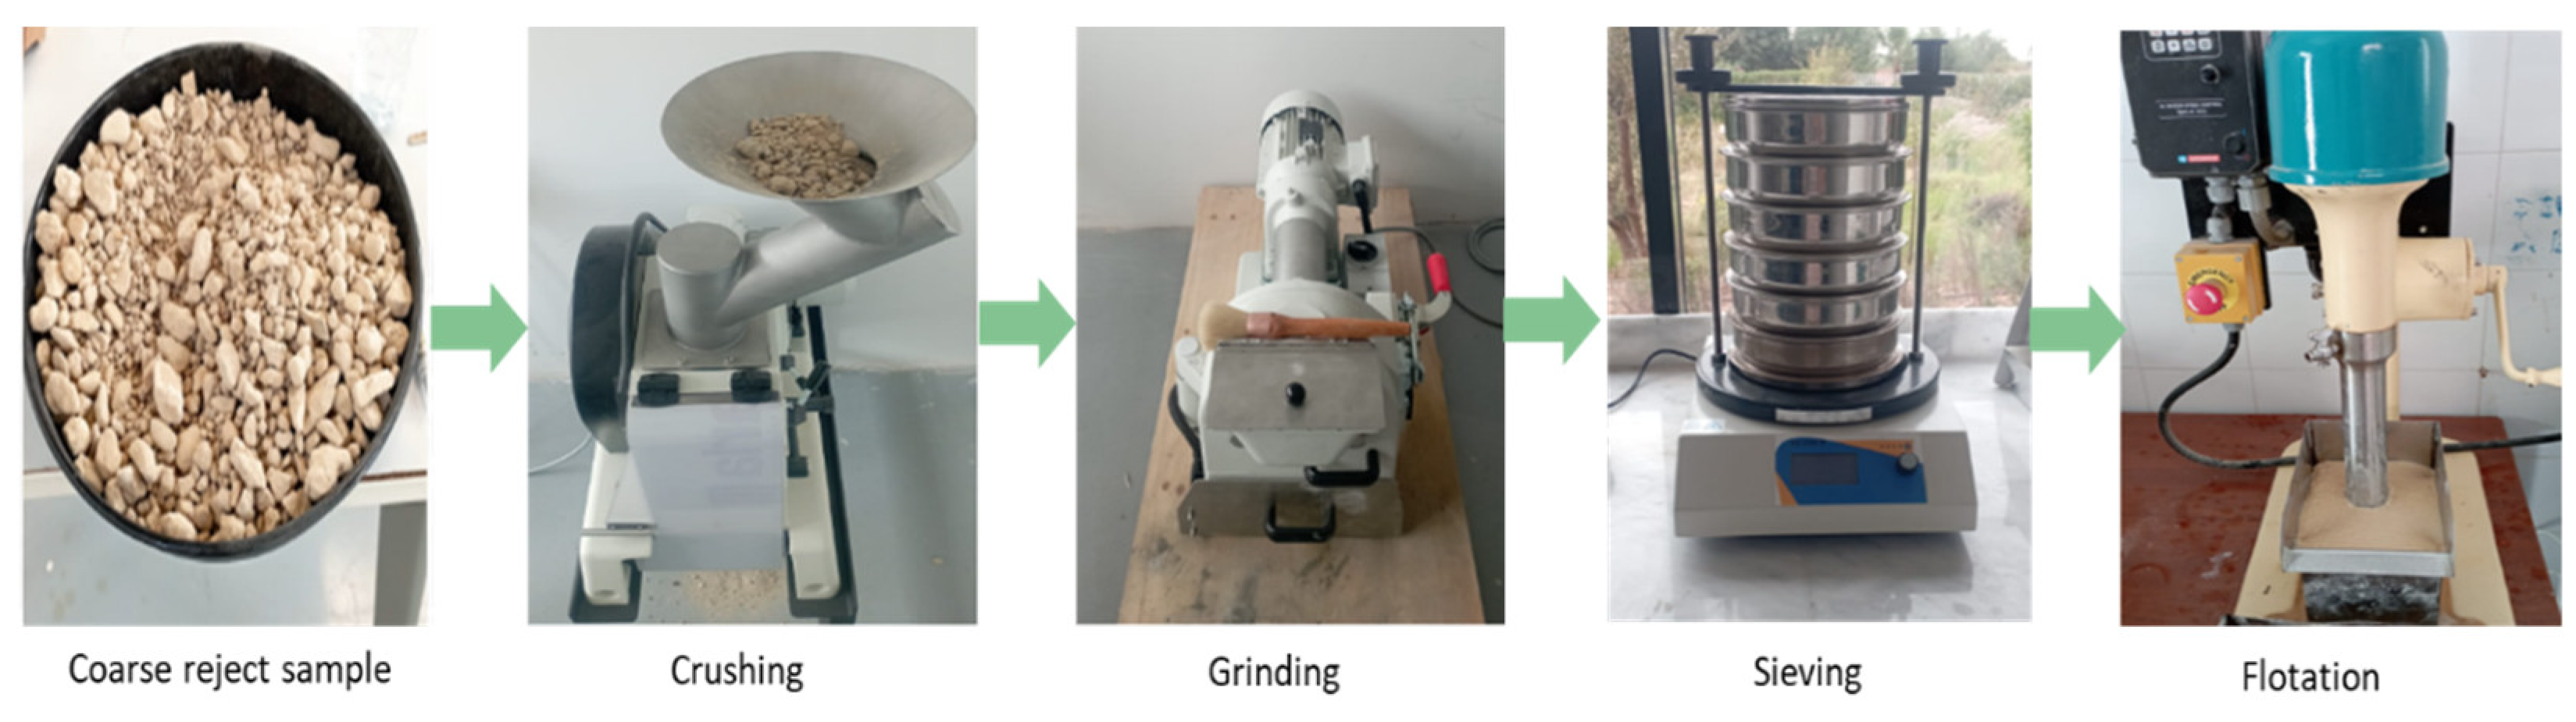
As shown in Figure 2 and Figure 3 below, the sample underwent several preparation stages for the tests. Initially, it was crushed to a size of 4 mm and then ground to achieve a liberation mesh size of 200 µm. The grinding continued until the entire sample passed through a 200 µm sieve. After grinding, sieving at 40 µm was carried out to remove fine particles that can affect flotation efficiency negatively.

Figure 2.
Laboratory test protocol.
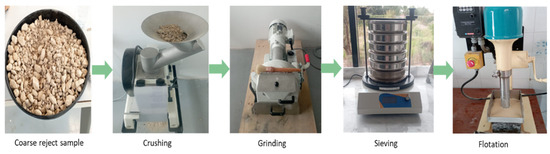
Figure 3.
Laboratory test preparation.
For the reverse cationic–anionic flotation tests, a dry sample weighing 500 g was utilized in a laboratory flotation machine (Denver D12) operating at a rotational speed of 1000 rpm. Phosphoric acid (ACP), ester, and amine were used as apatite depressant, carbonate collectors, and quartz collectors, respectively, to facilitate the flotation process. For pH measurement, a 10% NaOH solution was added until the desired pH level was reached, and the pH meter provided a precise reading of the final value. The acidity was primarily controlled by the presence of ACP.
To evaluate the results obtained from these tests, we conducted analyses on the feed samples, flotation tailings, and concentrate samples, focusing on critical parameters such as BPL% (Bone Phosphate of Lime) content and recovery. BPL is a key indicator of phosphate content and plays a crucial role in determining the economic viability of the beneficiation process. The outcomes are summarized in Table 1.

Table 1.
Major elements in the coarse reject.
For the modeling procedure to establish the optimal conditions for flotation tests, we employed a screening design using a Hadamard matrix to evaluate five operational factors: dosage of phosphoric acid (ACP), dosage of ester (Ester), dosage of amine (Amine), pH value (pH), and pulp solid rate (Ts). The Hadamard matrix, a non-geometric design, was selected due to its efficiency in identifying the most significant factors with a minimal number of experimental runs. This initial phase involved 12 experiments, which provided a comprehensive overview of how each factor influenced the flotation performance. Additionally, 3 center point experiments were conducted to assess reproducibility and check for any potential curvature in the response.
Following the screening phase, we proceeded with an optimization plan using a central composite design to refine the key parameters that significantly influenced flotation performance. We employed a central composite design with 8 factorial points, 6 star points, and 4 center points, specifically the face-centered version with alpha = 1. This design was selected to ensure a robust model for our system, providing a balanced exploration of the factor space while allowing for an accurate prediction of the response surface. The experimental design was meticulously conducted using the NemrodW_OPEX_2007 software package, which is based on a new efficient methodology for research using an optimal experimental design from LPRAI. The primary response variables analyzed were the non-float grade (TP2O5%) and P2O5 recovery (RP2O5%).
3. Results and Discussion
3.1. Characterization Results
The chemical composition analysis shows that this sample contains significant amounts of P2O5, CaO, SiO2, MgO, Al2O3, and SO3 and loss on ignition. The overall quality of the sample is around 38,5%BPL, which is notably lower when compared to phosphate raw materials.
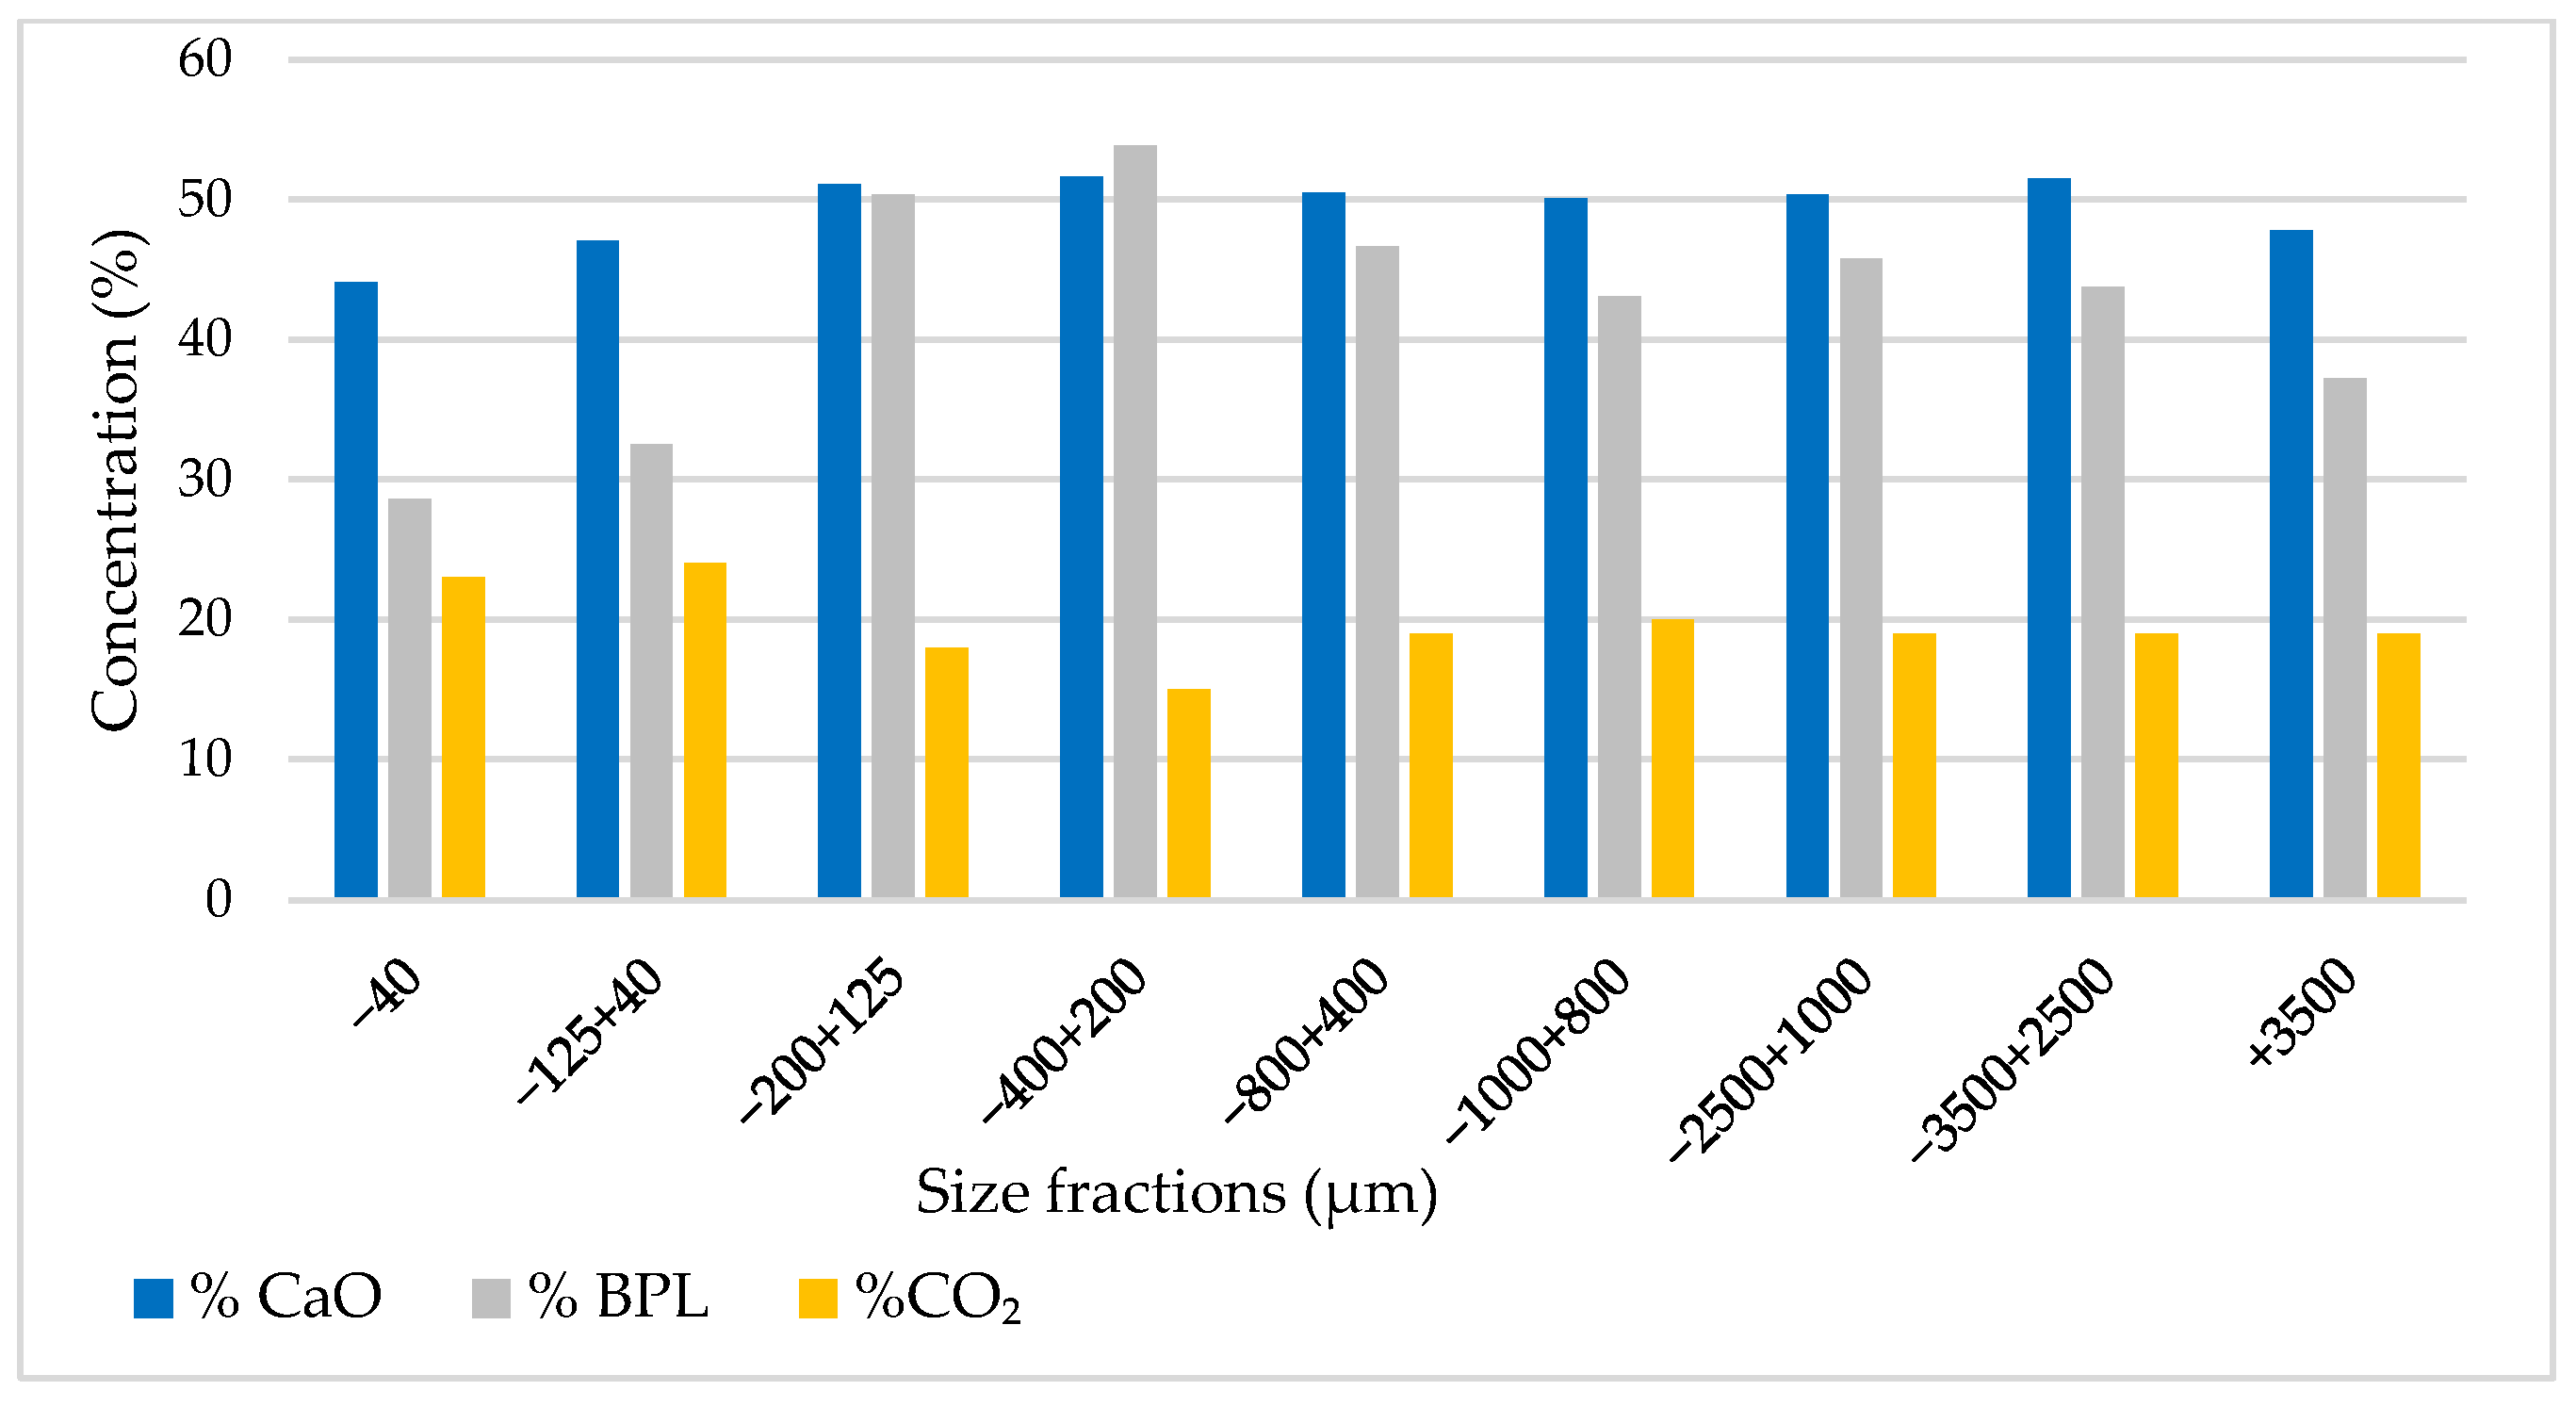
Additionally, the analysis indicates that particle sizes larger than 125 µm display a high concentration, with the highest concentration observed in the range of 125–400 µm, as illustrated in Figure 4.
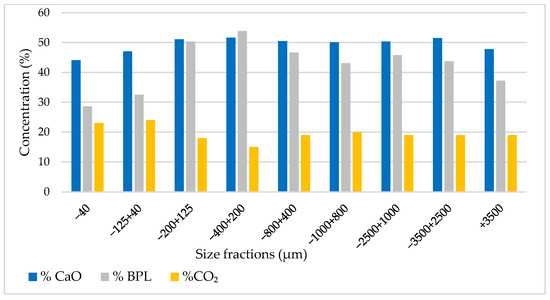
Figure 4.
BPL, CO2, and CaO concentrations by particle size range.
X-ray diffraction (XRD) was conducted on the sample to identify the different minerals and other possible materials present in the sample. The analysis identified a mineralogy predominantly characterized by carbonate-fluorapatite. This mineral phase is recognized as the principal bearer of phosphate within the sample, and the accompanying gangue material comprises quartz and carbonate minerals, notably calcite and dolomite, which delineate the non-phosphate matrix of the sample (Figure 5).
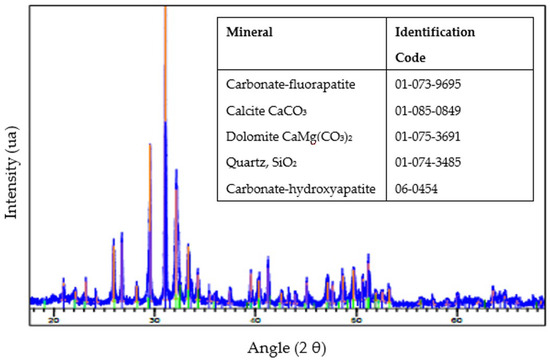
Figure 5.
An X-ray diffractogram of the sample.
From the reconciliation of chemical analysis with mineralogical characterization, it is observed that carbonate-fluorapatite is the dominant mineral phase, making up 41% of the sample. This is significant because carbonate-fluorapatite is a valuable source of phosphate, suggesting that the residue is a substantial phosphate resource. Table 2 provides a detailed breakdown of the proportions of mineralogical phases in residue particles that are greater than 2500 µm.
Table 2.
The proportion of each mineralogical phase in the sample.
The SEM analysis depicted in Figure 6 and Figure 7 reveals the composition of quartz and carbonate-fluorapatite. Specifically, cadmium presence is exclusively detected in quartz, confirming its occurrence within this mineral.
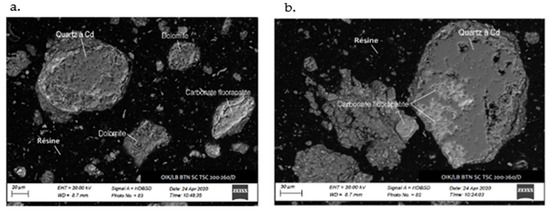
Figure 6.
SEM image of the sample: (a) cadmium detected in quartz, absent in dolomite and (b) cadmium localized in quartz, coexisting with carbonate-fluorapatite.
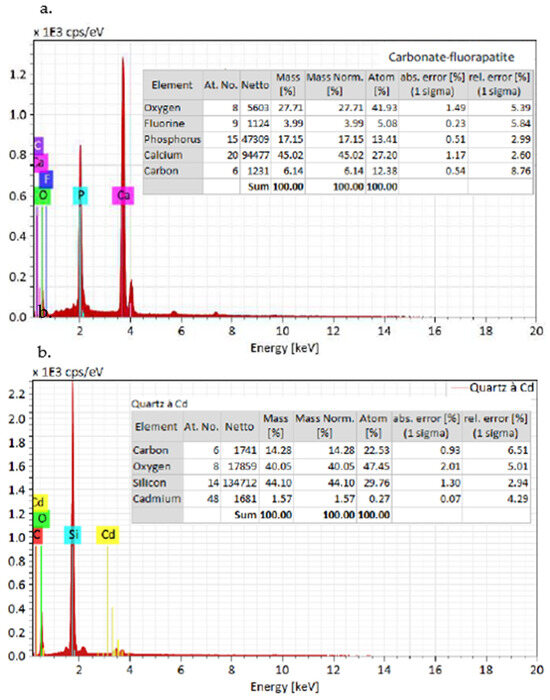
Figure 7.
EDX spectra of the grains from the SEM Figure 6: (a) carbonate-fluorapatite spectrum and (b) cadmium in quartz spectrum.
The study of mixed phase in the sample revealed that, in the case of quartz–carbonate-fluorapatite composites, cadmium presence was confined primarily to the quartz grains. An assessment of the cadmium distribution as shown in Figure 8 indicated that it constitutes approximately 43% of the quartz phase, while calcite contains around 33%, and the carbonate-fluorapatite phase holds about 24%, with dolomite grains showing no cadmium content.
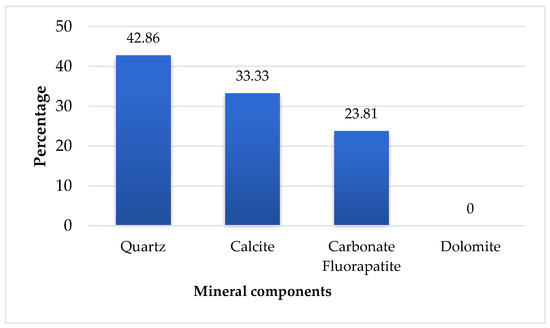
Figure 8.
Distribution of cadmium by mineralogical phase in sample.
The SEM analysis, combined with the chemical analysis carried out using EDX and mineralogical mapping, indicated that the sample shows a notable mixture of fluorapatite carbonates and accompanying elements. Table 3 details the ratio of mixing between fluorapatite carbonate and gangue in this coarse reject sample.
Table 3.
Mixing ratio between carbonate-fluorapatite and gangue minerals.
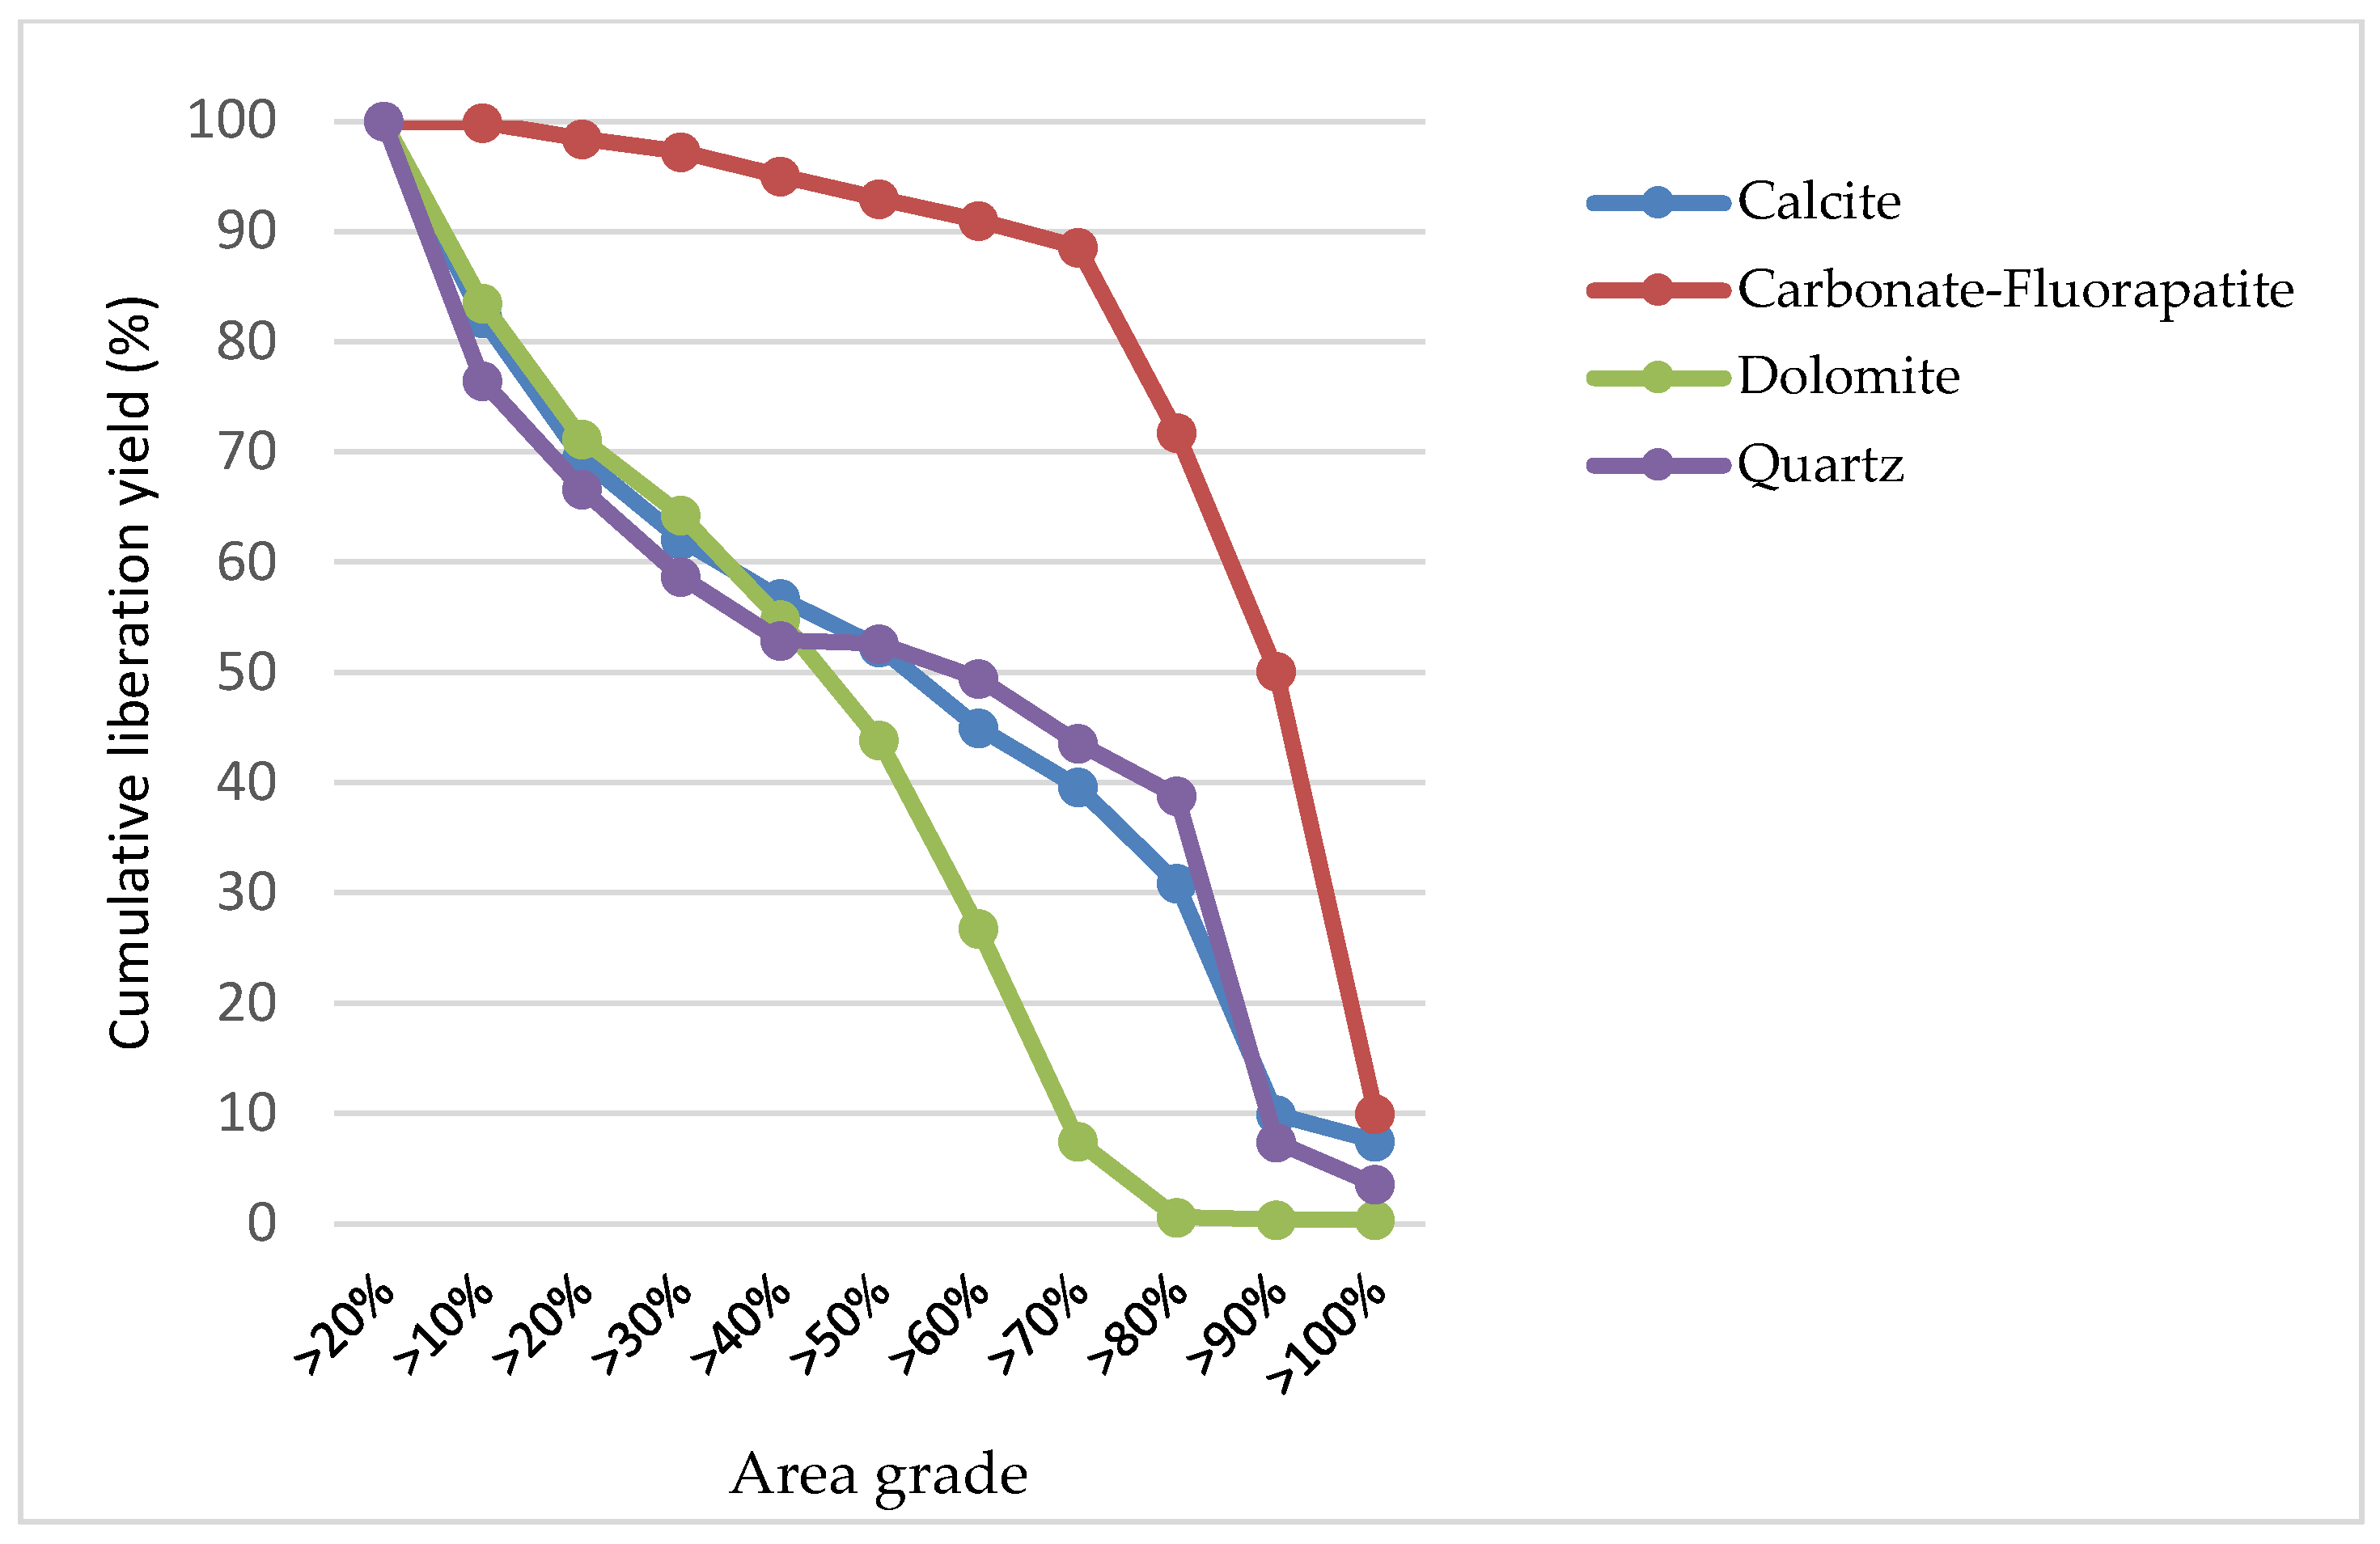
Mineral liberation, as illustrated in Figure 9, depicts the progressive disengagement of several minerals, specifically calcite, carbonate-fluorapatite, dolomite, and quartz, in relation to their respective liberation percentages, as indicated by the area grade. This percentage is an important measure of how effectively each mineral has been freed from the surrounding gangue or matrix, which is a critical efficiency metric in mineral processing.
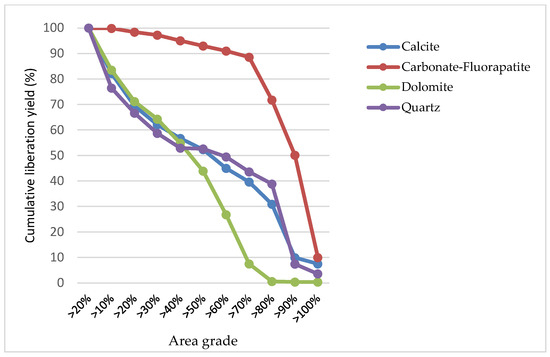
Figure 9.
The results of the mineral liberation study of the sample.
Particularly for carbonate-fluorapatite, represented by a blue dashed line, there is a high level of initial liberation, nearly reaching 100%. This high degree of liberation persists until reaching an area grade of about 70%. This trend suggests an efficient liberation process for carbonate-fluorapatite, with a substantial proportion being liberated at lower liberation thresholds. However, past the 70% mark, the graph shows a noticeable decline, indicating a reduced number of grains being completely liberated.
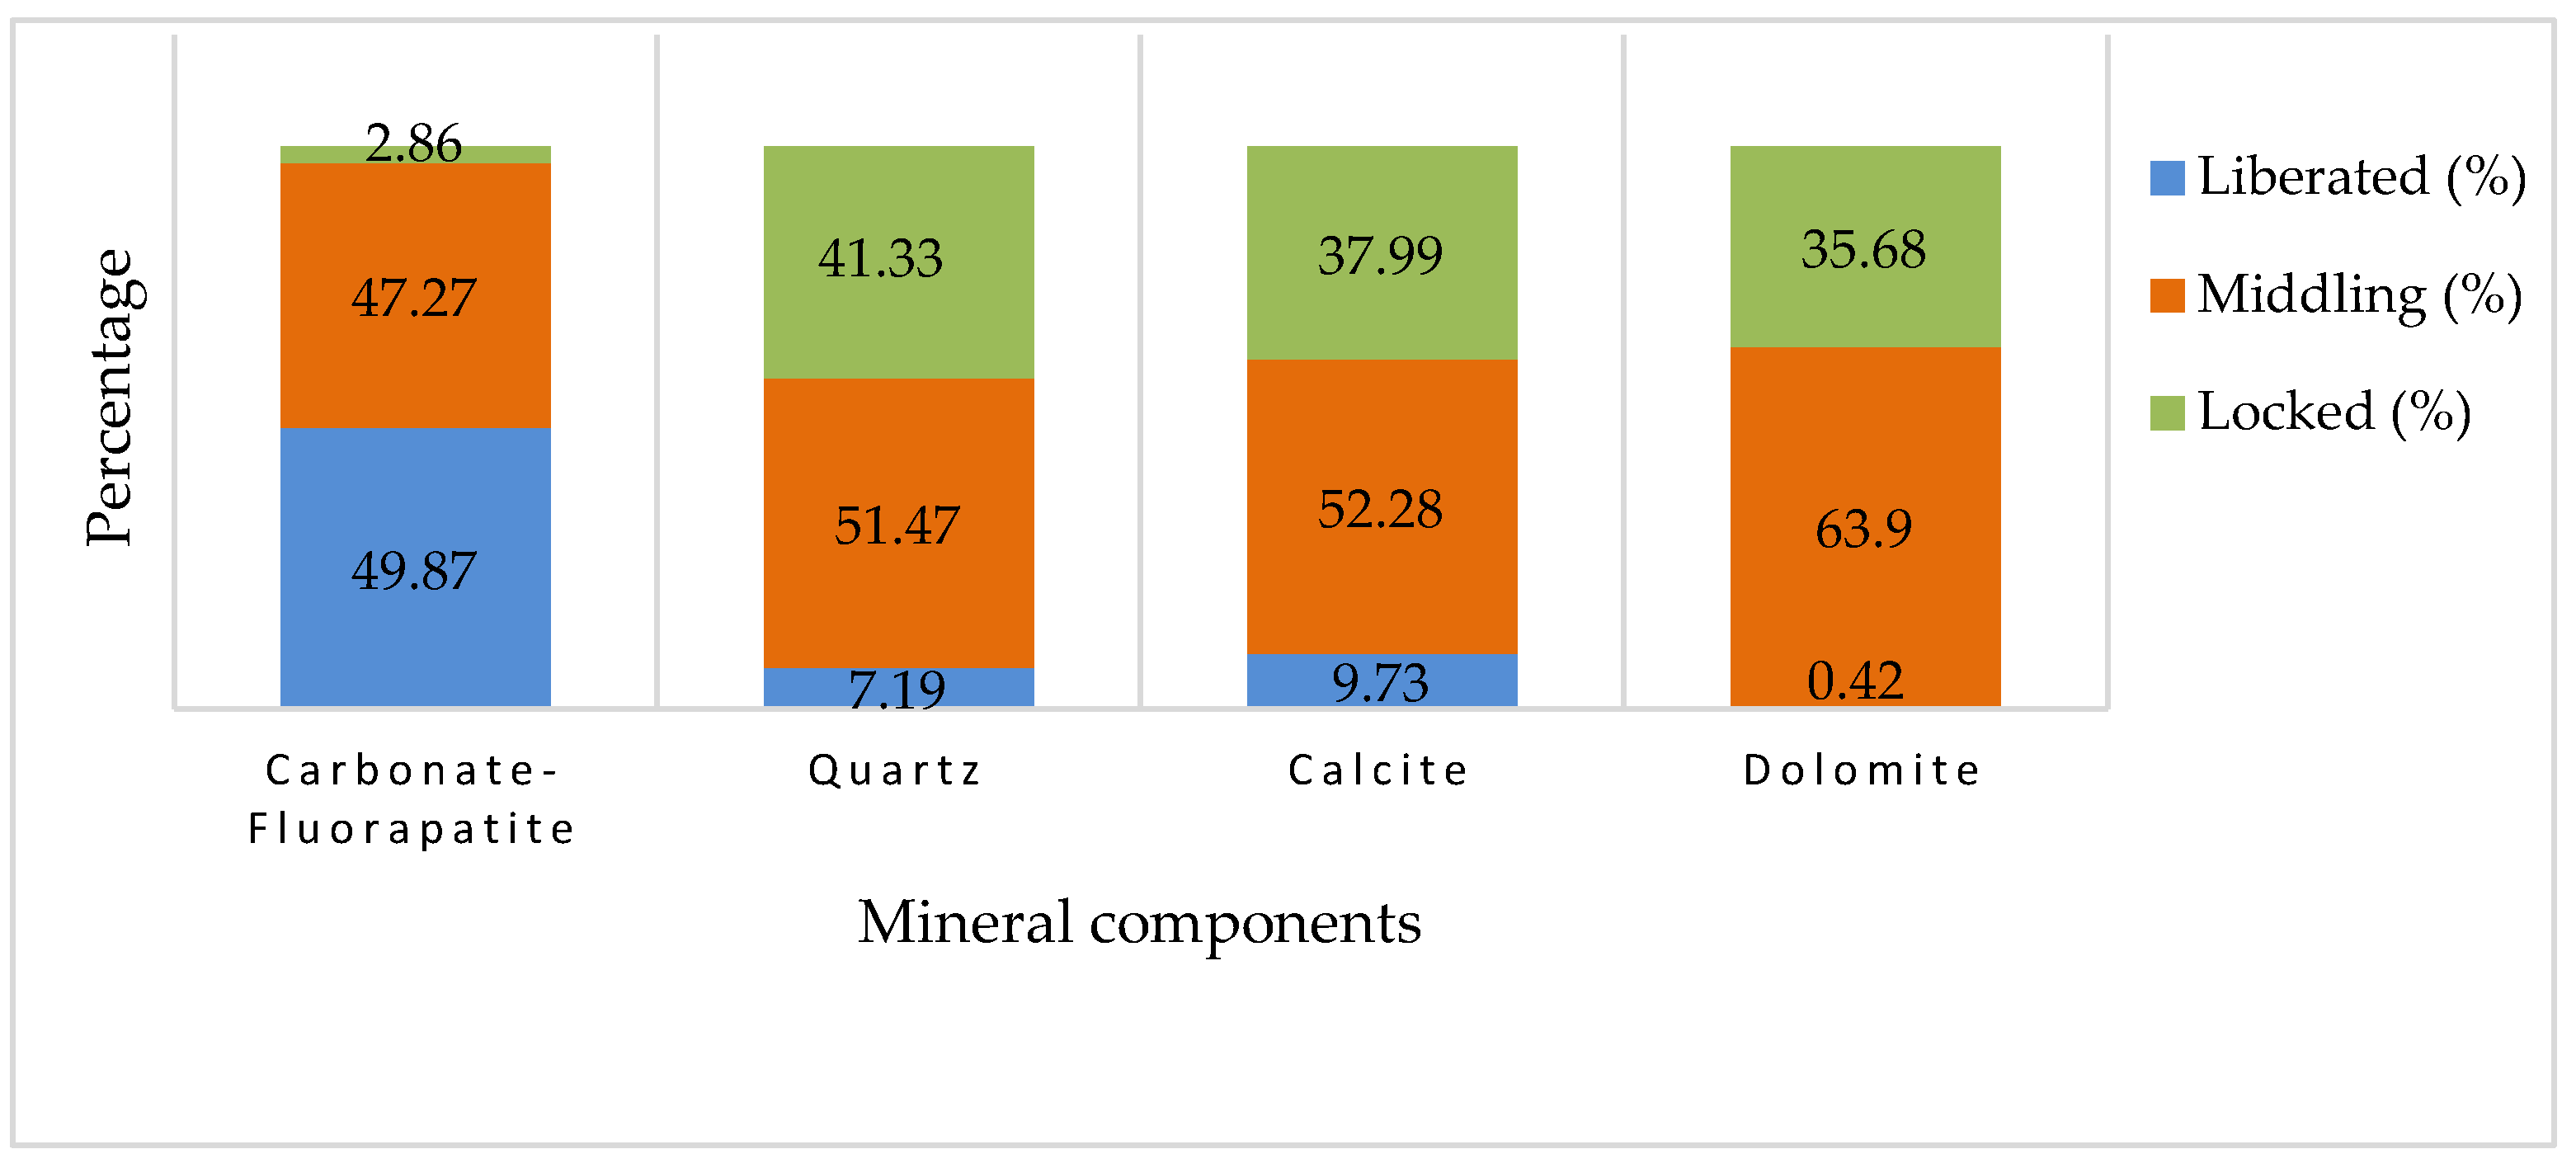
Focusing on carbonate-fluorapatite, the mineral of interest, the graph shown in Figure 10 indicates that approximately 49.87% of this mineral is categorized as ‘liberated’. This implies that nearly half of the carbonate-fluorapatite present in the sample is free from the surrounding material and could be readily available for processing. Another 47.27% is identified as ‘middling’, meaning that these particles are partially liberated and may require further processing to fully separate them from the gangue material. Only a small fraction, about 2.86%, remains ‘locked’, indicating that it is still encapsulated within the gangue matrix. This low percentage of locked particles suggests a relatively high efficiency in the liberation process for carbonate-fluorapatite.

Figure 10.
The cumulative liberation of minerals from the sample.
3.2. Experimental Results
3.2.1. Screening Plan
The preliminary screening design was employed to evaluate the importance of various factors, analyzing their impact at different levels. This method also examines the variability in the responses within individual factors and comparatively between different factors. The results of flotation experiments, conducted in alignment with the screening plan, are summarized in Table 4. The data illustrates a consistent trend across different flotation conditions, leading to favorable results for grade (%P2O5) in the non-float fraction.
Table 4.
Experimental design and response factors for the screening plan.
To guarantee the credibility of our research, confirming the statistical model’s accuracy is imperative. The model referred to here is based on the Hadamard matrix, which was used to develop a screening design exploring five factors at two levels each. This first-order model is typical for screening designs where the primary objective is to identify the most significant factors with minimal experimental runs. The validation of this first-order model is an essential precursor to any investigative efforts. The process includes a comprehensive set of evaluations, such as ANOVA (Analysis of Variance), R2 (Coefficient of Determination), R2A (adjusted R2), R2 pred (predictive R2), and the Prediction Error Sum of Squares (PRESS), along with the assessment of residual normality, to ensure the robustness and reliability of the model before advancing to further optimization. These metrics collectively provide a thorough understanding of the model’s performance, ensuring that it is both accurate and reliable for predictive purposes.
The statistical analysis illustrated in Table 5 and Table 6 reveals that the regression model shows solid performance, explaining 88.8% of the variance of the dependent variable (R2 of 0.888) and demonstrating statistical significance in the ANOVA with a large portion of the variance explained by the regression (69.4025 out of 78.1336). Despite its high capacity to capture data trends, the model shows room for improvement, as indicated by an adjusted R2A of 0.795 and a R2pred of 0.553, highlighting the need for caution when making predictions on new data.
Table 5.
Variance analysis.
Table 6.
Estimates and coefficient statistics.
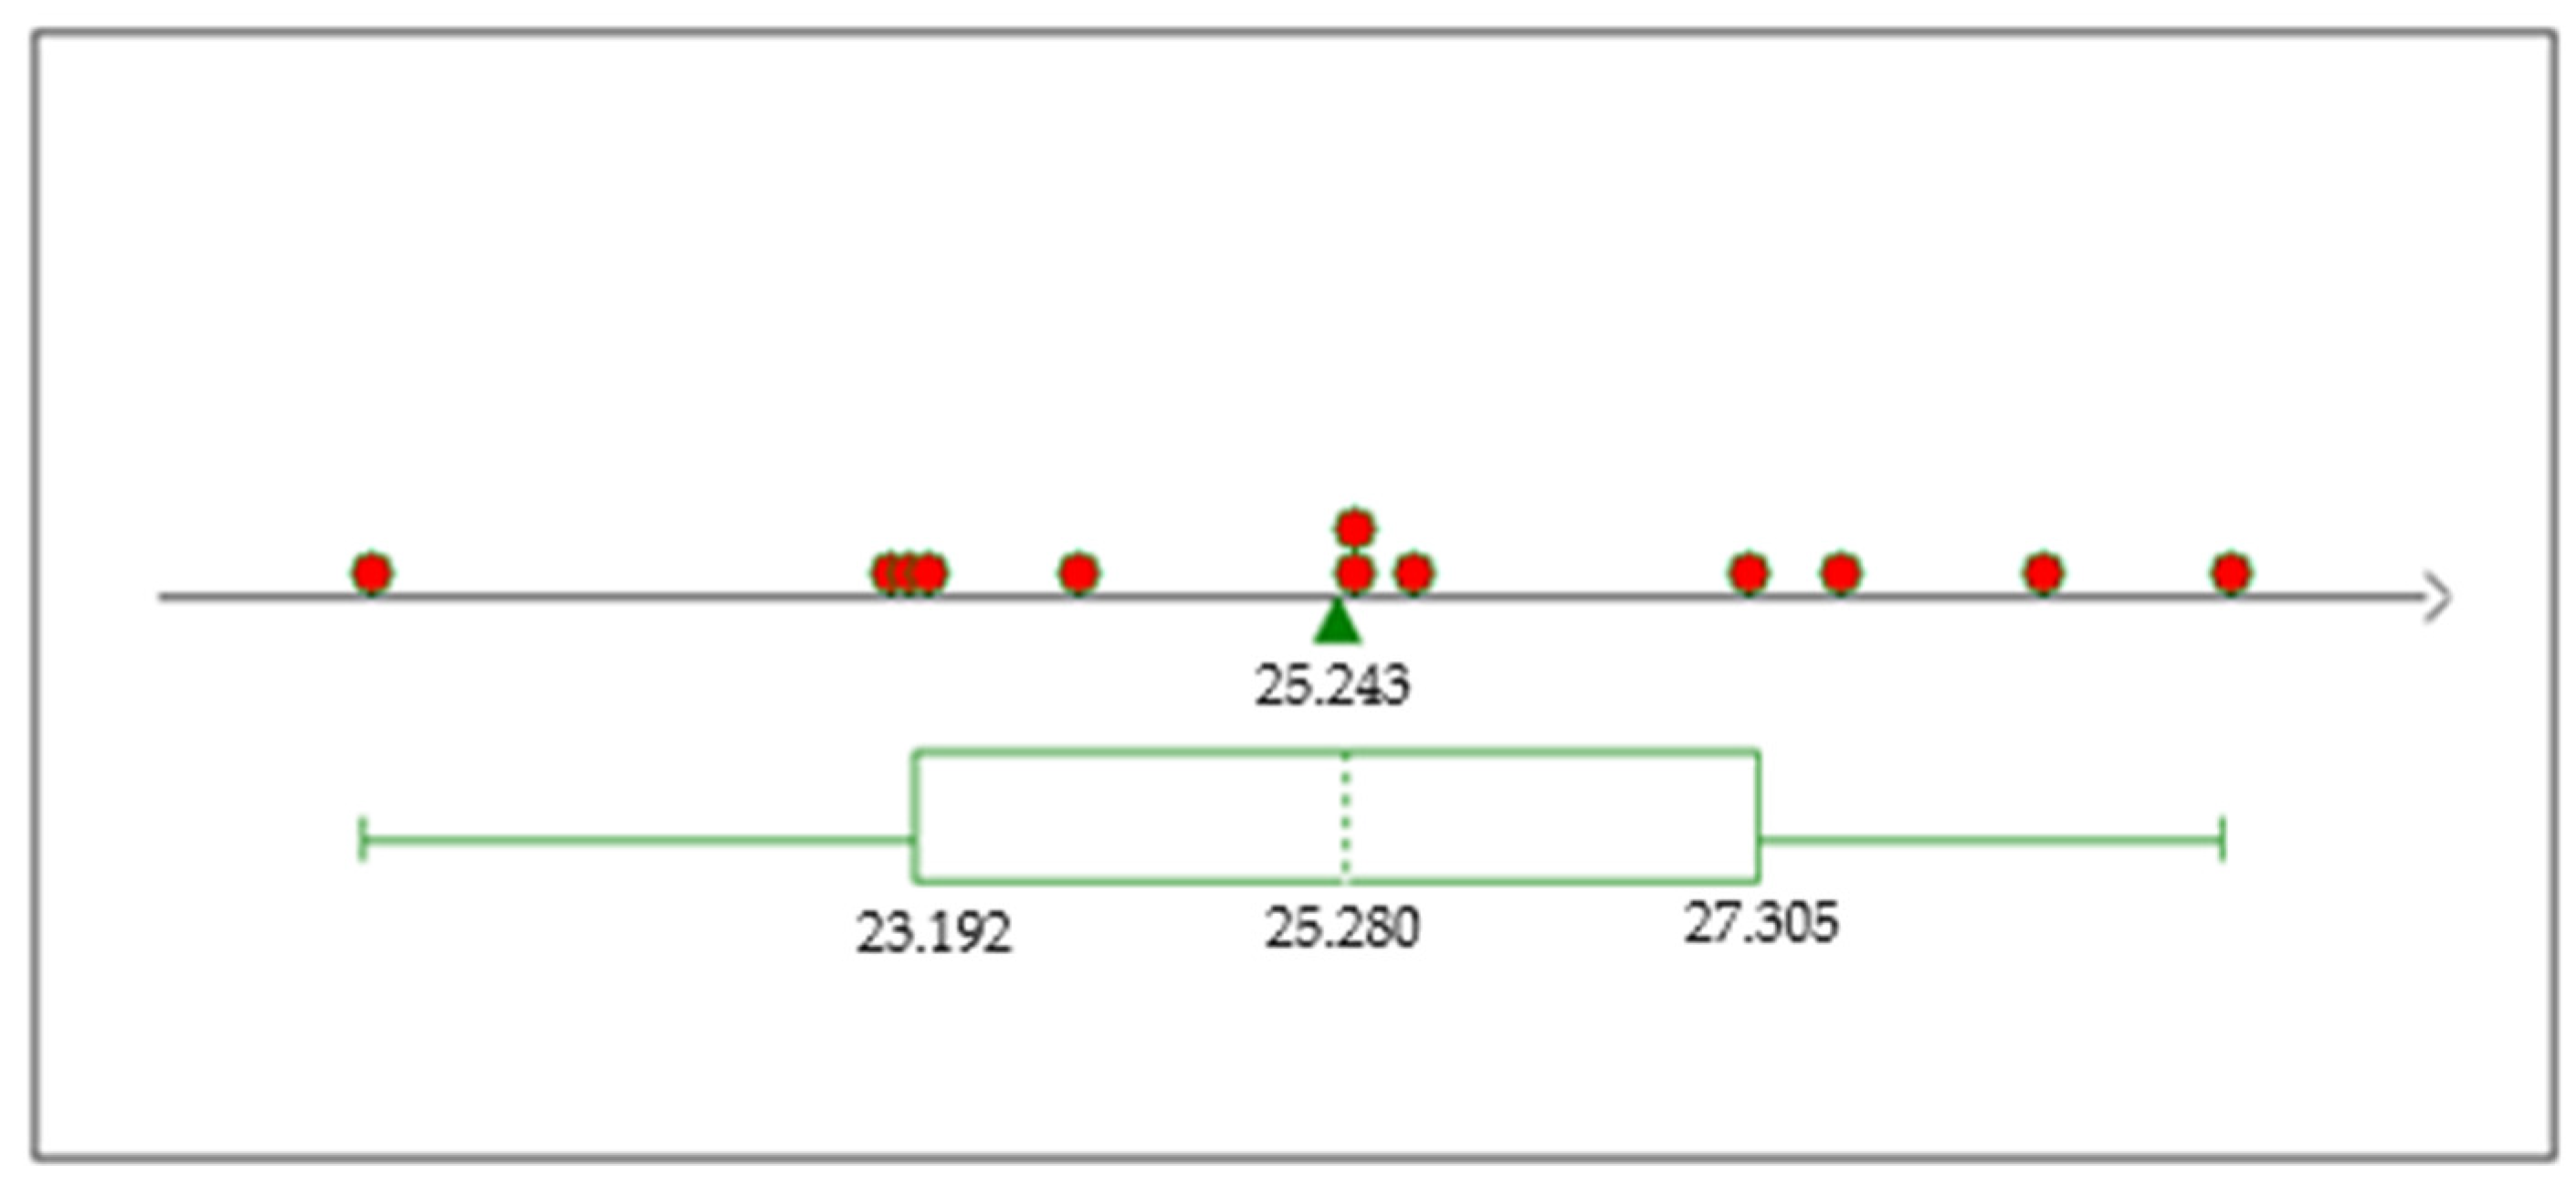
The boxplot analysis (Figure 11) for the P2O5 grade response from our series of experiments reveals a promising potential for P2O5 enrichment. We demonstrated the ability to enhance P2O5 levels to as high as 29% under experimental conditions, with most trials registering above the 25% mark. This significant increase from the baseline ore content of around 19% P2O5 underscores the efficacy of our experimental procedure in extracting and concentrating this valuable mineral. In the figure, the red dots represent individual data points from the dataset, and the green triangle indicates the mean value, which is labeled as 25.243. This visual representation further supports the success of our approach, as the majority of the data points fall above the 25% mark.
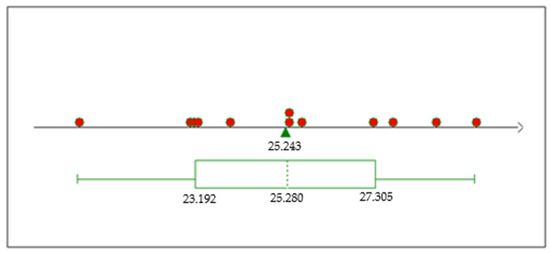
Figure 11.
TP2O5 boxplot.
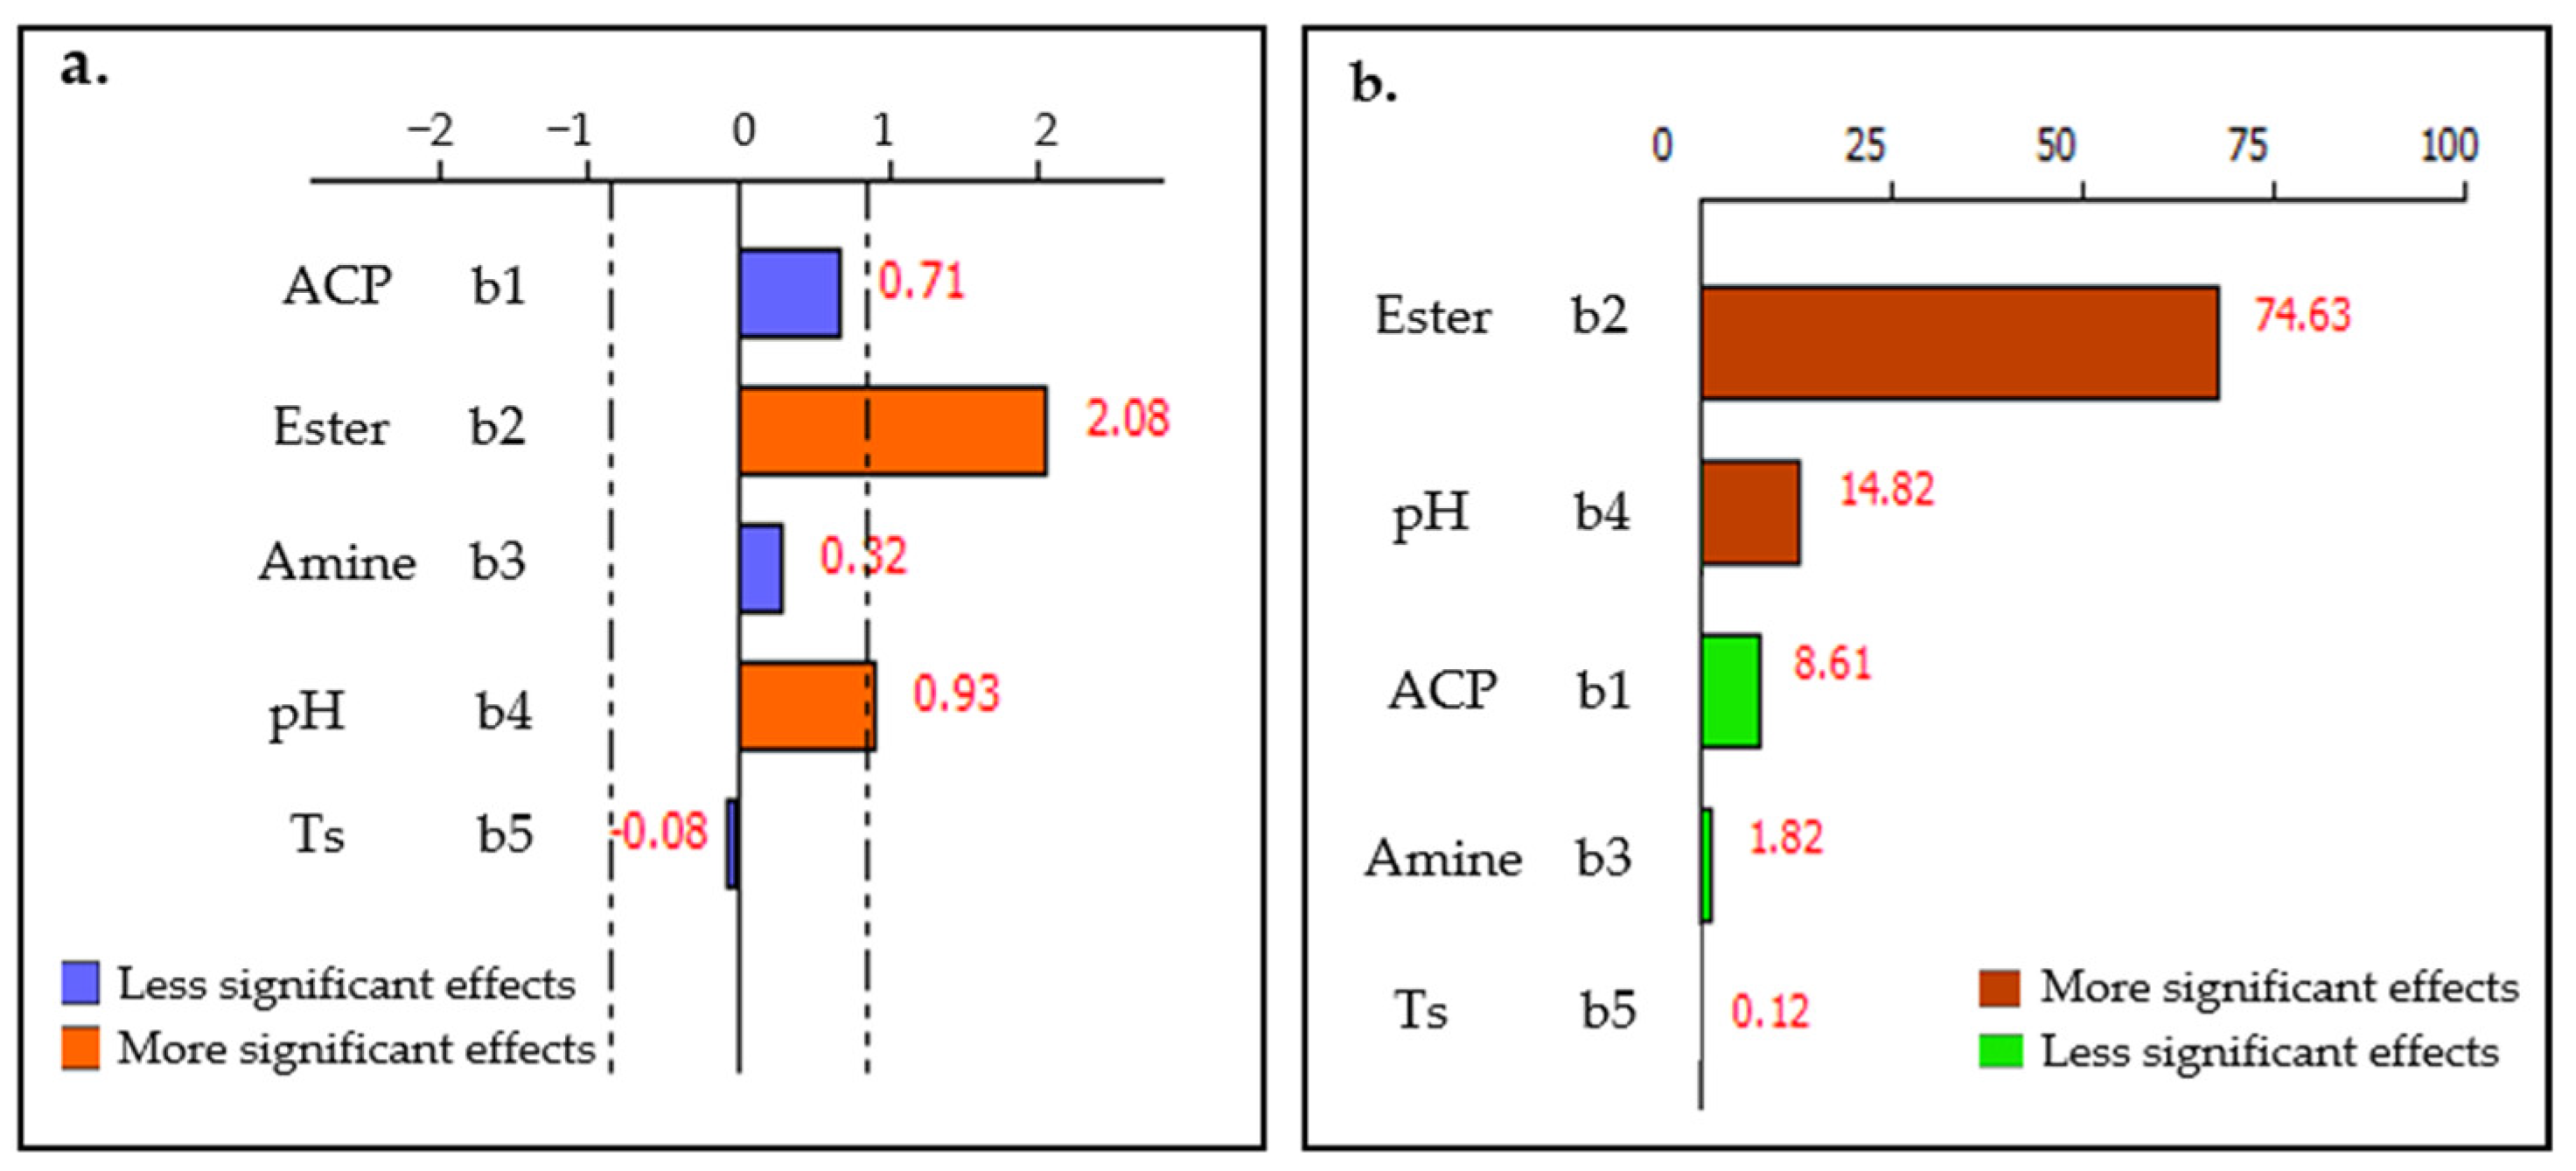
An insightful examination of the graph presented in Figure 12 reveals a predominant influence of ester dosage and pulp pH on the P2O5 concentration within the non-floated fraction, jointly contributing to 89% of the observed effect. In contrast, variations in solid content, ACP dosage, and amine dosage appear to play a minor role, accounting for just 11% of the effect. This significant disparity underscores the critical role of ester dosage and pulp pH in optimizing P2O5 recovery, while the other examined factors may be considered of secondary importance in the context of these specific experimental conditions.
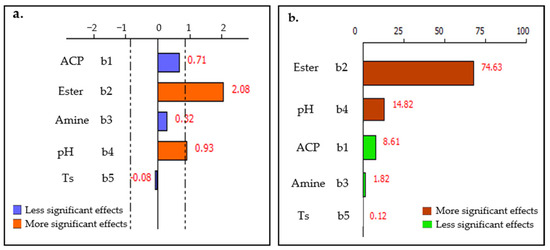
Figure 12.
(a) Factors effects and (b) Pareto chart for TP2O5 response.
3.2.2. Response Surface Plan
The experimental setup adhered to the same conditions as those specified in the screening plan, with the addition of specific parameters for pH and solid content. Initially, the pH was naturally around 8, but it decreased to between 6 and 7 following the addition of ACP. The solid content was kept at 13%. After the experimental trials were conducted, the results from this part of the study were meticulously compiled in Table 7. This table presents the experimental design used for the response surface analysis, as well as the corresponding response values for each experiment.
Table 7.
Experimental design and response factors for the response surface plan.
Table 8 and Table 9 provide statistics for evaluating the performance of two separate regression models for the responses Y1: TP2O5 and Y2: RP2O5.
Table 8.
Estimates and statistics of coefficients for response Y1: TP2O5.
Table 9.
Estimates and statistics of coefficients for response Y2: RP2O5.
- For the first model, the standard deviation of the response is relatively low at 0.780, indicating good prediction accuracy. With a very high R2 of 0.977, the model explains almost all the variability in TP2O5, which is reinforced by an adjusted R2A of 0.952, proving that the model is well fitted even after penalizing for the number of predictors used. A R2pred of 0.807 and a PRESS of 41.51 show that the model is quite robust in predicting new data but with room for improvement.
- For the second model, despite a higher standard deviation of the response of 1.85, an R2 of 0.987 and an adjusted R2A of 0.972 indicate an exceptional ability to explain the variance of RP2O5. A R2pred of 0.874 and a considerably higher PRESS of 263.7049 suggest that this model, while extremely well fitted, might not perform as well in predicting new data compared to the first model.
In summary, the first model shows better predictive performance, while the second model has a better explanatory capacity, although potentially at the expense of the accuracy of predictions.
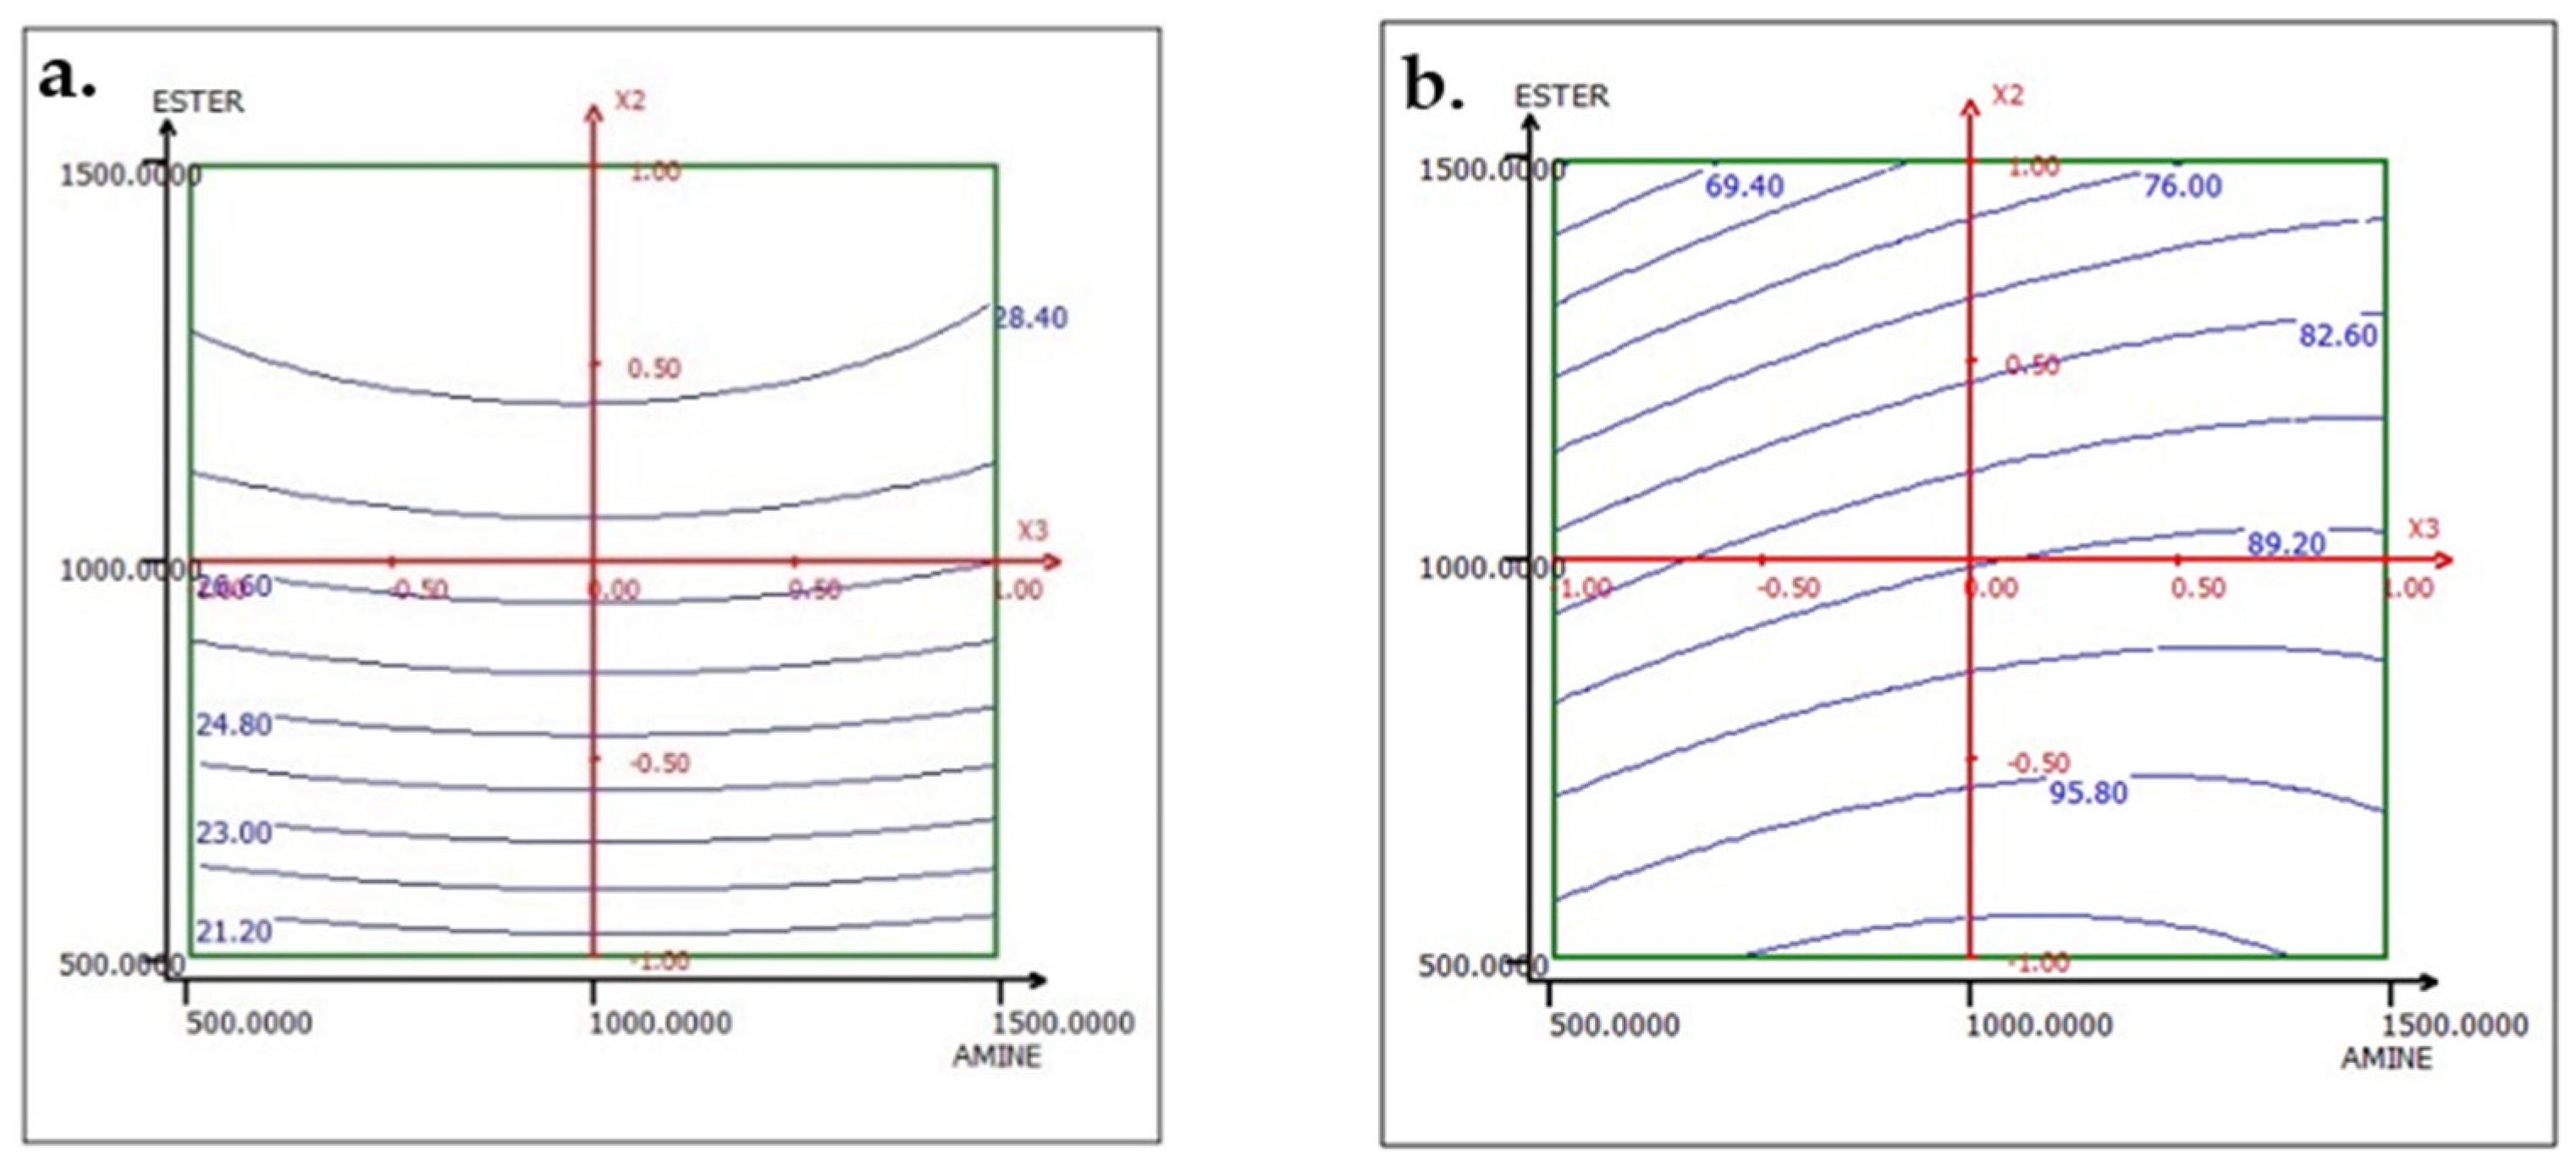
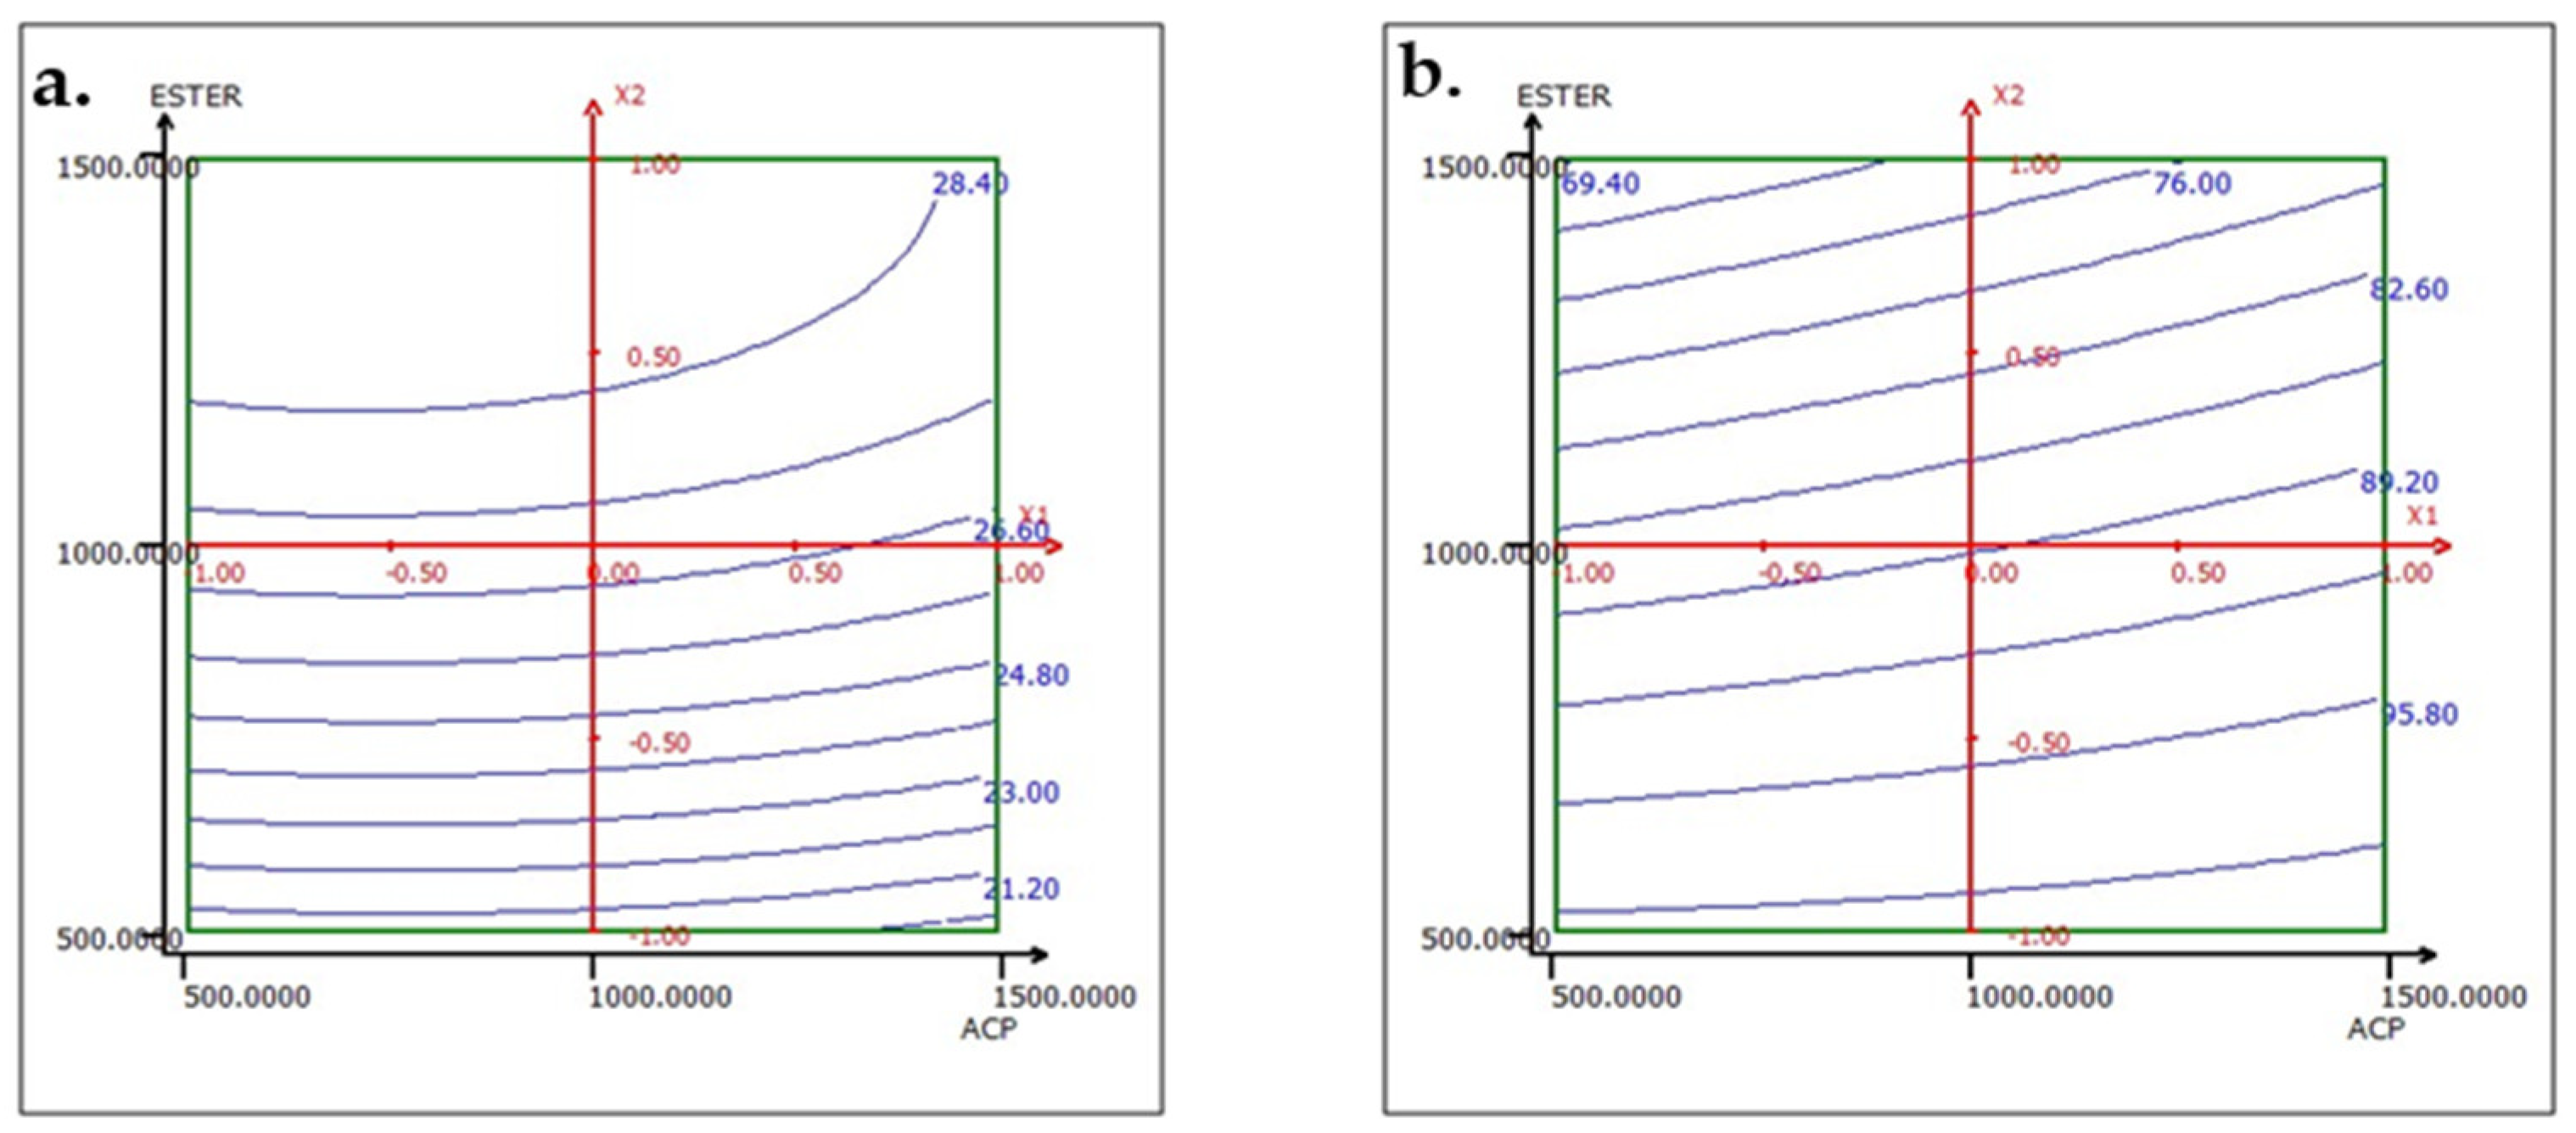
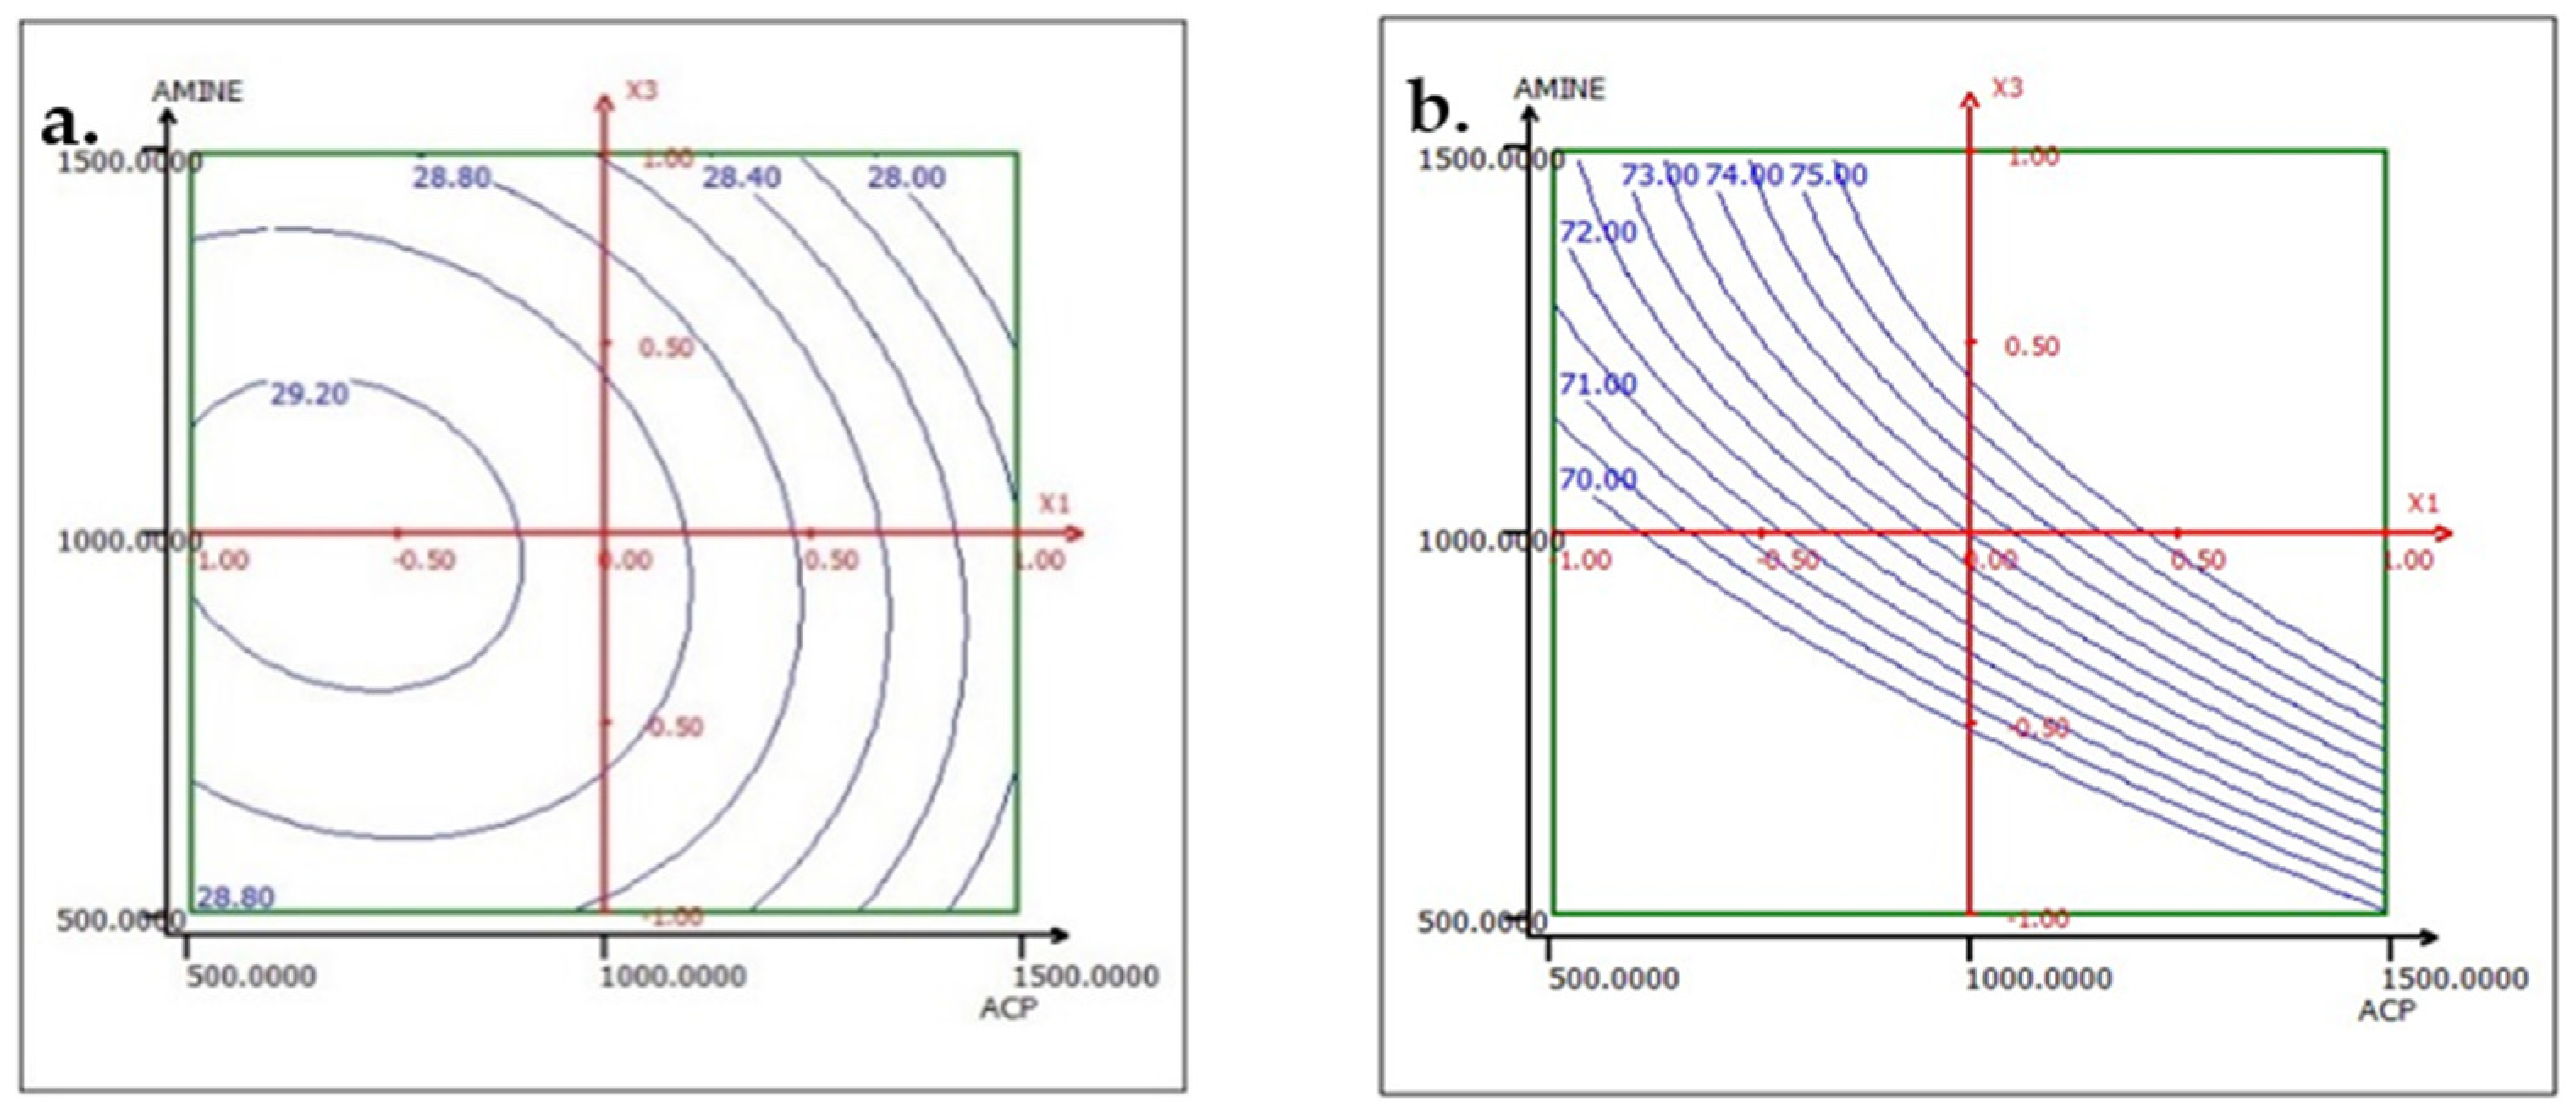
To interpret the results of the effect factors, response surfaces (2D iso-response curves) are plotted in the domains of interest for the three studied factors: ACP dosage, ester dosage, and amine dosage. The iso-response curves are a projection of the response surface onto the horizontal plane, which are interpreted as contour lines on which the response value is projected. When there are more than two factors, it is necessary to keep all factors not described in the horizontal plane at a constant level. Below, in the results corresponding to the two responses TP2O5 and RP2O5 are discussed when the factors are set as follows: ACP dosage at 1000, ester dosage at 1500, and amine dosage fixed at 1000.
The analysis of the interactions between the operational parameters is graphically presented in Figure 13, Figure 14 and Figure 15. It shows that the most significant factor affecting both responses is the dosage of ester. The results obtained from the iso-response curves indicate that the optimal conditions for P2O5 content and recovery were found under a high ester dosage and medium amine and ACP dosages. The desirability study, illustrated in Table 10 and Table 11, aimed to achieve the maximum P2O5 content and maximum recovery. It showed that a P2O5 content of 29% with a recovery of 76.14% could be obtained by applying the dosages of the mentioned reagents in Table 10 to obtain a concentrate with 29% P2O5 and 76% P2O5 recovery (Table 11).
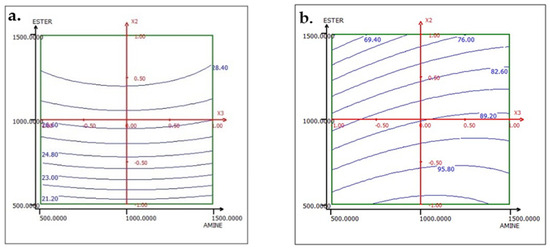
Figure 13.
Response variation: (a) TP2O5 and (b) RP2O5 in the AMINE and ESTER plan with ACP fixed at 1000 g/t.
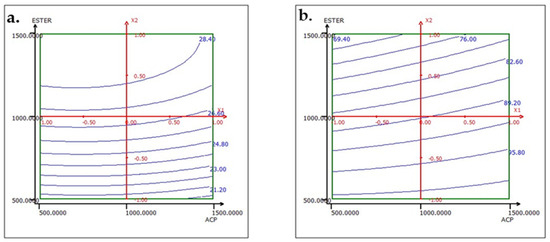
Figure 14.
Response variation: (a) TP2O5 and (b) RP2O5 in the ACP and ESTER plan with AMINE fixed at 1000 g/t.
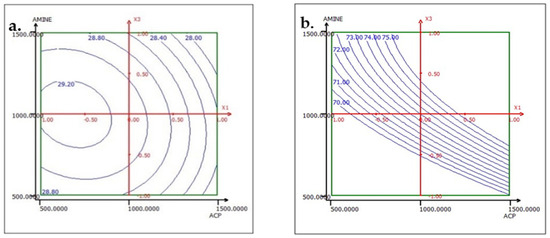
Figure 15.
Response variation: (a) TP2O5 and (b) RP2O5 in the ACP and AMINE plan with ESTER fixed at 1500 g/t.
Table 10.
Desirability, coordinates of the maximum.
Table 11.
The characteristics of the maximum.
4. Conclusions
The characterization results of this study underscore the critical role of the mineralogical composition of coarse rejects, particularly the dominance of carbonate-fluorapatite as the primary host for phosphate. Gangue minerals, mainly composed of quartz and carbonates like calcite and dolomite, exhibit significant co-occurrence with the valuable phosphate-bearing mineral. Furthermore, the concentration of cadmium within gangue suggests that its removal could not only enrich the P2O5 content but also lower the cadmium content, addressing significant environmental concerns associated with phosphate mining and processing.
Our laboratory tests demonstrated that the optimized beneficiation process, utilizing a fixed ester dosage of 1500 g/t, effectively increased the P2O5 content to 29%. While this represents substantial progress from the initial 19% P2O5 in the coarse reject, it remains slightly below the commercial viability threshold of 30%. These results are comparable to those obtained in previous studies, such as those conducted on Redayef waste [15] and Kef Eddur rejects [17], where similar physicochemical treatments successfully increased the P2O5 content. However, it is important to note that achieving this improvement involved a relatively high consumption of flotation reagents, which raises concerns about the overall cost-effectiveness of the process. This underscores the need for further research to identify more efficient preconcentration methods that could reduce the reliance on flotation reagents and enhance the economic feasibility of the process.
In light of these findings, future studies should focus on exploring alternative preconcentration techniques that could improve the quality of the phosphate concentrate before flotation treatment. This approach could potentially lower reagent consumption and production costs, making the recovery of phosphate from waste streams not only more sustainable but also more economically viable. Such advancements are crucial for aligning with the principles of sustainable development and contributing to the circular economy within the phosphate industry. While significant progress has been made, further optimization is necessary to meet the desired product quality and address the associated challenges in energy consumption and cost.
Author Contributions
Conceptualization, M.E.K.; methodology, K.L. and A.A.; software, K.L.; validation, Y.C. and A.A.; formal analysis, K.L.; resources, A.C.; data curation, K.L., M.E.K. and A.A.; writing—original draft preparation, K.L.; writing—review and editing, Y.C., M.E.K. and A.A.; funding acquisition, A.C. All authors have read and agreed to the published version of the manuscript.
Funding
This research received no external funding.
Data Availability Statement
Data are contained within the article.
Conflicts of Interest
The authors declare no conflict of interest.
References
- De Boer, M.A.; Romeo-Hall, A.G.; Rooimans, T.M.; Slootweg, J.C. An Assessment of the Drivers and Barriers for the Deployment of Urban Phosphorus Recovery Technologies: A Case Study of The Netherlands. Sustainability 2018, 10, 1790. [Google Scholar] [CrossRef]
- Withers, P.J.A.; Van Dijk, K.C.; Neset, T.-S.S.; Nesme, T.; Oenema, O.; Rubæk, G.H.; Schoumans, O.F.; Smit, B.; Pellerin, S. Stewardship to Tackle Global Phosphorus Inefficiency: The Case of Europe. Ambio 2015, 44, 193–206. [Google Scholar] [CrossRef] [PubMed]
- Van Vuuren, D.; Bouwman, A.; Beusen, A. Phosphorus demand for the 1970–2100 period: A scenario analysis of resource depletion. Glob. Environ. Chang. 2010, 20, 428–439. [Google Scholar] [CrossRef]
- Steiner, G.; Geissler, B. Sustainable Mineral Resource Management—Insights into the Case of Phosphorus. Sustainability 2018, 10, 2732. [Google Scholar] [CrossRef]
- Cordell, D.; Drangert, J.-O.; White, S. The story of phosphorus: Global food security and food for thought. Glob. Environ. Chang. 2009, 19, 292–305. [Google Scholar] [CrossRef]
- Cordell, D.; White, S. Peak Phosphorus: Clarifying the Key Issues of a Vigorous Debate about Long-Term Phosphorus Security. Sustainability 2011, 3, 2027–2049. [Google Scholar] [CrossRef]
- U.S. Geological Survey. Mineral Commodity Summaries 2021; U.S. Geological Survey: Reston, VA, USA, 2021; p. 200. [CrossRef]
- Gharabaghi, M.; Irannajad, M.; Noaparast, M. A review of the beneficiation of calcareous phosphate ores using organic acid leaching. Hydrometallurgy 2010, 103, 96–107. [Google Scholar] [CrossRef]
- Sis, H.; Chander, S. Reagents used in the flotation of phosphate ores: A critical review. Miner. Eng. 2003, 16, 577–585. [Google Scholar] [CrossRef]
- Hakkou, R.; Benzaazoua, M.; Bussière, B. Valorization of Phosphate Waste Rocks and Sludge from the Moroccan Phosphate Mines: Challenges and Perspectives. Procedia Eng. 2016, 138, 110–118. [Google Scholar] [CrossRef]
- Daneshgar, S.; Callegari, A.; Capodaglio, A.G.; Vaccari, D. The Potential Phosphorus Crisis: Resource Conservation and Possible Escape Technologies: A Review. Resources 2018, 7, 37. [Google Scholar] [CrossRef]
- Geissler, B.; Hermann, L.; Mew, M.C.; Steiner, G. Striving Toward a Circular Economy for Phosphorus: The Role of Phosphate Rock Mining. Minerals 2018, 8, 395. [Google Scholar] [CrossRef]
- Mew, M.C.; Steiner, G.; Geissler, B. Phosphorus Supply Chain—Scientific, Technical, and Economic Foundations: A Transdisciplinary Orientation. Sustainability 2018, 10, 1087. [Google Scholar] [CrossRef]
- Pettersson, M.; Johansson, O. Mining Waste as a Resource in the Green Transition: Legal Conditions for Secondary Extraction. SSRN 2023. [Google Scholar] [CrossRef]
- Gallala, W.; Herchi, F.; Ben Ali, I.; Abbassi, L.; Gaied, M.E.; Montacer, M. Beneficiation of Phosphate Solid Coarse Waste from Redayef (Gafsa Mining Basin) by Grinding and Flotation Techniques. Procedia Eng. 2016, 138, 85–94. [Google Scholar] [CrossRef]
- Srinivas, K.; Dassin, Y.; Prabhulingaiah, G.; Sekhar, D.M.R. Utilization of Eshidiya Phosphate Beneficiation Plant Rejects. In Proceedings of the International Mineral Processing Congress (IMPC), Bangalore, India, January 2009. International Mineral. [Google Scholar]
- Zidi, R.; Babbou-Abdelmalek, C.; Chaabani, F.; Abbassi, L. Enrichment of low-grade phosphate coarse particles by froth-flotation process, at the Kef-Eddur washing plant, Tunisia. Arab. J. Geosci. 2016, 9, 1–15. [Google Scholar] [CrossRef]
- Eskanlou, A.; Huang, Q.; Zhang, P. De-sliming followed by froth flotation for the recovery of phosphorus and enrichment of rare earth elements from Florida waste clay. Resour. Conserv. Recycl. 2021, 178, 106049. [Google Scholar] [CrossRef]
- Mohamed, M.A.K.; Ibrahim, G.A.E.A.; Rizk, A.M.E.; Ahmed, M.M.; El Nozahi, A.M.; Abdel-Khalek, N.A.; Bakheat, H. Upgrading of Phosphate Ore Wastes of El-Nasr Mining Company, Egypt. Int. J. Miner. Process. Extr. Met. 2018, 3, 37. [Google Scholar]
- El-Midany, A.; El-Aleem, F.; Al-Fariss, T. Why do relatively coarse calcareous phosphate particles perform better in a static-bed calciner? Powder Technol. 2013, 237, 180–185. [Google Scholar] [CrossRef]
- Kawatra, S.K.; Carlson, J.T. Beneficiation of Phosphate Ore; Society for Mining, Metallurgy & Exploration: Englewood, CO, USA, 2013. [Google Scholar]
- Karapetian, K.; Dzhevaga, N. Modern Technologies of Complex Processing of Phosphates. ARPN J. Eng. Appl. Sci. 2017, 12, 4588–4594. [Google Scholar]
- Ruan, Y.; Zhang, Z.; Luo, H.; Xiao, C.; Zhou, F.; Chi, R. Effects of Metal Ions on the Flotation of Apatite, Dolomite and Quartz. Minerals 2018, 8, 141. [Google Scholar] [CrossRef]
- Aleksandrova, T.; Elbendari, A.; Nikolaeva, N. Beneficiation of a Low-Grade Phosphate Ore Using a Reverse Flotation Tech-nique. Miner. Process. Extr. Metall. Rev. 2022, 43, 22–27. [Google Scholar] [CrossRef]
- Boujlel, H.; Daldoul, G.; Tlil, H.; Souissi, R.; Chebbi, N.; Fattah, N.; Souissi, F. The Beneficiation Processes of Low-Grade Sedimentary Phosphates of Tozeur-Nefta Deposit (Gafsa-Metlaoui Basin: South of Tunisia). Minerals 2018, 9, 2. [Google Scholar] [CrossRef]
- Ahmadi, N.; Felhi, M.; El Bahri, D.; Molina-Piernas, E.; Chebbi, N.; Tlili, A. Beneficiation of low-grade carbonated phosphate ore by reverse flotation technics using anionic and cationic collectors, Sra Ouertane region, Northwest Tunisia. Euro-Mediterr. J. Environ. Integr. 2024. [Google Scholar] [CrossRef]
- Ruan, Y.; He, D.; Chi, R. Review on Beneficiation Techniques and Reagents Used for Phosphate Ores. Minerals 2019, 9, 253. [Google Scholar] [CrossRef]
- Arroug, L.; Elaatmani, M.; Zegzouti, A. A preliminary study to investigate the beneficiation of low-grade phosphate sludge using reverse flotation: Modeling and optimization through Box-Behnken design and response surface methodology. Chem. Eng. Res. Des. 2024, 204, 228–237. [Google Scholar] [CrossRef]
- Farid, Z.; Abdennouri, M.; Barka, N.; Sadiq, M. Grade-recovery beneficing and optimization of the froth flotation process of a mid-low phosphate ore using a mixed soybean and sunflower oil as a collector. Appl. Surf. Sci. Adv. 2022, 11, 100287. [Google Scholar] [CrossRef]


Disclaimer/Publisher’s Note: The statements, opinions and data contained in all publications are solely those of the individual author(s) and contributor(s) and not of MDPI and/or the editor(s). MDPI and/or the editor(s) disclaim responsibility for any injury to people or property resulting from any ideas, methods, instructions or products referred to in the content. |
© 2024 by the authors. Licensee MDPI, Basel, Switzerland. This article is an open access article distributed under the terms and conditions of the Creative Commons Attribution (CC BY) license (https://creativecommons.org/licenses/by/4.0/).