Abstract
This study focuses on the application of neural networks to optimize 3D printing parameters in order to reduce particulate matter (PM) emissions and enhance sustainability. This research identifies key parameters, such as head temperature, bed temperature, print speed, nozzle diameter, and cooling, that significantly impact particle matter emissions. Quantitative analysis reveals that higher head temperatures (225 °C), faster print speeds (50 mm/s), and larger nozzle diameters (0.8 mm) result in elevated PM emissions, while lower settings (head temperature at 190 °C, print speed at 30 mm/s, nozzle diameter of 0.4 mm) help minimize these emissions. Using multilayer perceptron (MLP) neural networks, predictive models with an accuracy of up to 95.6% were developed, allowing for a precise optimization of 3D printing processes. The MLP 7-19-6 model showed a strong correlation (0.956) between input parameters and emissions, offering a robust tool for reducing the environmental footprint of additive manufacturing. By optimizing 3D printing settings, this study contributes to more sustainable practices by lowering harmful emissions. These findings are crucial for advancing sustainable development goals by providing actionable strategies for minimizing health risks and promoting eco-friendly manufacturing processes. Ultimately, this research supports the transition to greener technologies in the field of additive manufacturing.
1. Introduction
Additive manufacturing, also known as 3D printing, is a cutting-edge technology that creates three-dimensional objects by layering materials. Since it started in the 1980s, 3D printing has developed into a versatile method for making objects of various shapes and uses [1,2]. This process involves repeatedly applying layers of materials, such as plastic, metal, ceramic, or even organic substances, to build the final object. This technology has become popular in industries like manufacturing, medicine, and architecture as it allows for quick prototyping and custom production [3]. Key benefits of 3D printing include its ability to produce complex shapes, enable personalization, reduce material waste, and speed up production. It also supports advanced CADs (Computer-Aided Designs), which provide a foundation for creating innovative solutions [4,5].
In recent years, 3D printing technology has gained immense popularity, leading to major changes in various industries and manufacturing sectors. Also known as additive manufacturing, 3D printing creates three-dimensional objects by adding material layer by layer, making it one of the most innovative and flexible manufacturing techniques available. However, as this technology advances rapidly, it also brings new environmental challenges, such as plastic waste, airborne particles, volatile organic compounds (VOCs), energy consumption, and chemical exposure. Three-dimensional printing produces several types of emissions that can be harmful to both the environment and human health. The impact of these emissions depends on the specific 3D printing method and the materials used [4,6,7].
Despite the numerous studies conducted on 3D printing and its associated emissions, the current understanding of environmental and health impacts remains insufficient. As this technology continues to evolve, a further investigation into the impact of different materials and processes is needed to address emerging challenges. The authors propose that the use of neural networks will enable learning from new data sets, allowing for the continued development of 3D printing emission models as the technology evolves.
1.1. Types of Technologies in 3D Printing
Additive manufacturing (also known as incremental technology, additive technology, or 3D printing) is a zero-waste technology that builds objects by assembling pre-prepared materials or by applying material in layers. This method can be used to create components such as connectors for robots or implants for bone defects [5]. Additive manufacturing utilizes virtual computer designs to produce objects in three dimensions. It is commonly used for Rapid Prototyping, Rapid Manufacturing, and Rapid Tooling [4,5].
The different methods of additive manufacturing are mainly distinguished by the technologies and processes they use to create 3D objects. Here are some common 3D printing methods:
- Fused Deposition Modeling (FDM): this popular technique involves melting plastic and layering it to build objects;
- Stereolithography (SLA): uses UV light to cure resin layer by layer, allowing for highly detailed prints;
- Selective Laser Sintering (SLS): employs a laser to melt or sinter plastic, metal, or ceramic powders layer by layer;
- Digital Light Processing (DLP): similar to SLA, this method uses UV light to cure resin but employs a projector for faster printing;
- Binder Jetting: applies a binder to a layer of powder, which is then cured to form the object, built up layer by layer;
- Electron Beam Melting (EBM): uses an electron beam to melt and fuse metal powders, creating strong, durable objects;
- Laminated Object Manufacturing (LOM): involves stacking, cutting, and gluing layers of material, such as paper or plastic, to form a 3D object.
This article focuses on Fused Deposition Modeling (FDM), the most popular and widely used 3D printing technology. FDM works by layering material to build up an object. The process involves melting thermoplastic materials, such as PLA, ABS, or nylon, and applying them layer by layer. An FDM printer uses a 3D model, which is sliced into layers and printed with a hot nozzle that follows a specific pattern. One of the main advantages of FDM is its versatility, as it can use different materials to produce objects with various mechanical and aesthetic properties. Additionally, FDM technology is relatively easy to use and is commonly employed in industrial applications, prototyping, education, and custom product manufacturing [4,5].
1.2. Types of FDM 3D Printing Emissions
FDM technology generates two main types of pollutants during the manufacturing process: volatile organic compounds (VOCs) and particulate matter (dust).
Volatile organic compounds (VOCs) are a group of organic compounds that readily change their state, volatilizing and entering the environment. Characteristic features of VOCs include low solubility in water and high vapor pressure. At standard pressure (1013 hPa), the boiling points of VOCs range from 50 °C to 250 °C. VOCs include substances such as aromatic and aliphatic compounds, alcohols, esters, and ketones, among others [8,9,10,11,12,13].
During the FDM process, particles are formed due to chemical changes caused by sudden thermodynamic variations in the printer nozzle, such as high temperature and pressure. The changes that create solid particles (dust and fumes) include the evaporation of additives, thermal depolymerization, the decomposition of chemical compounds, and the coagulation of smaller molecules (including VOCs) [8,9,10,11,12,13]. Advanced imaging techniques can show how VOCs are emitted during the printing process and how they move through heated air during 3D printing [14]. An additional effect of the 3D printing process is the emission of dust, which can pose a potential threat to human health and the environment.
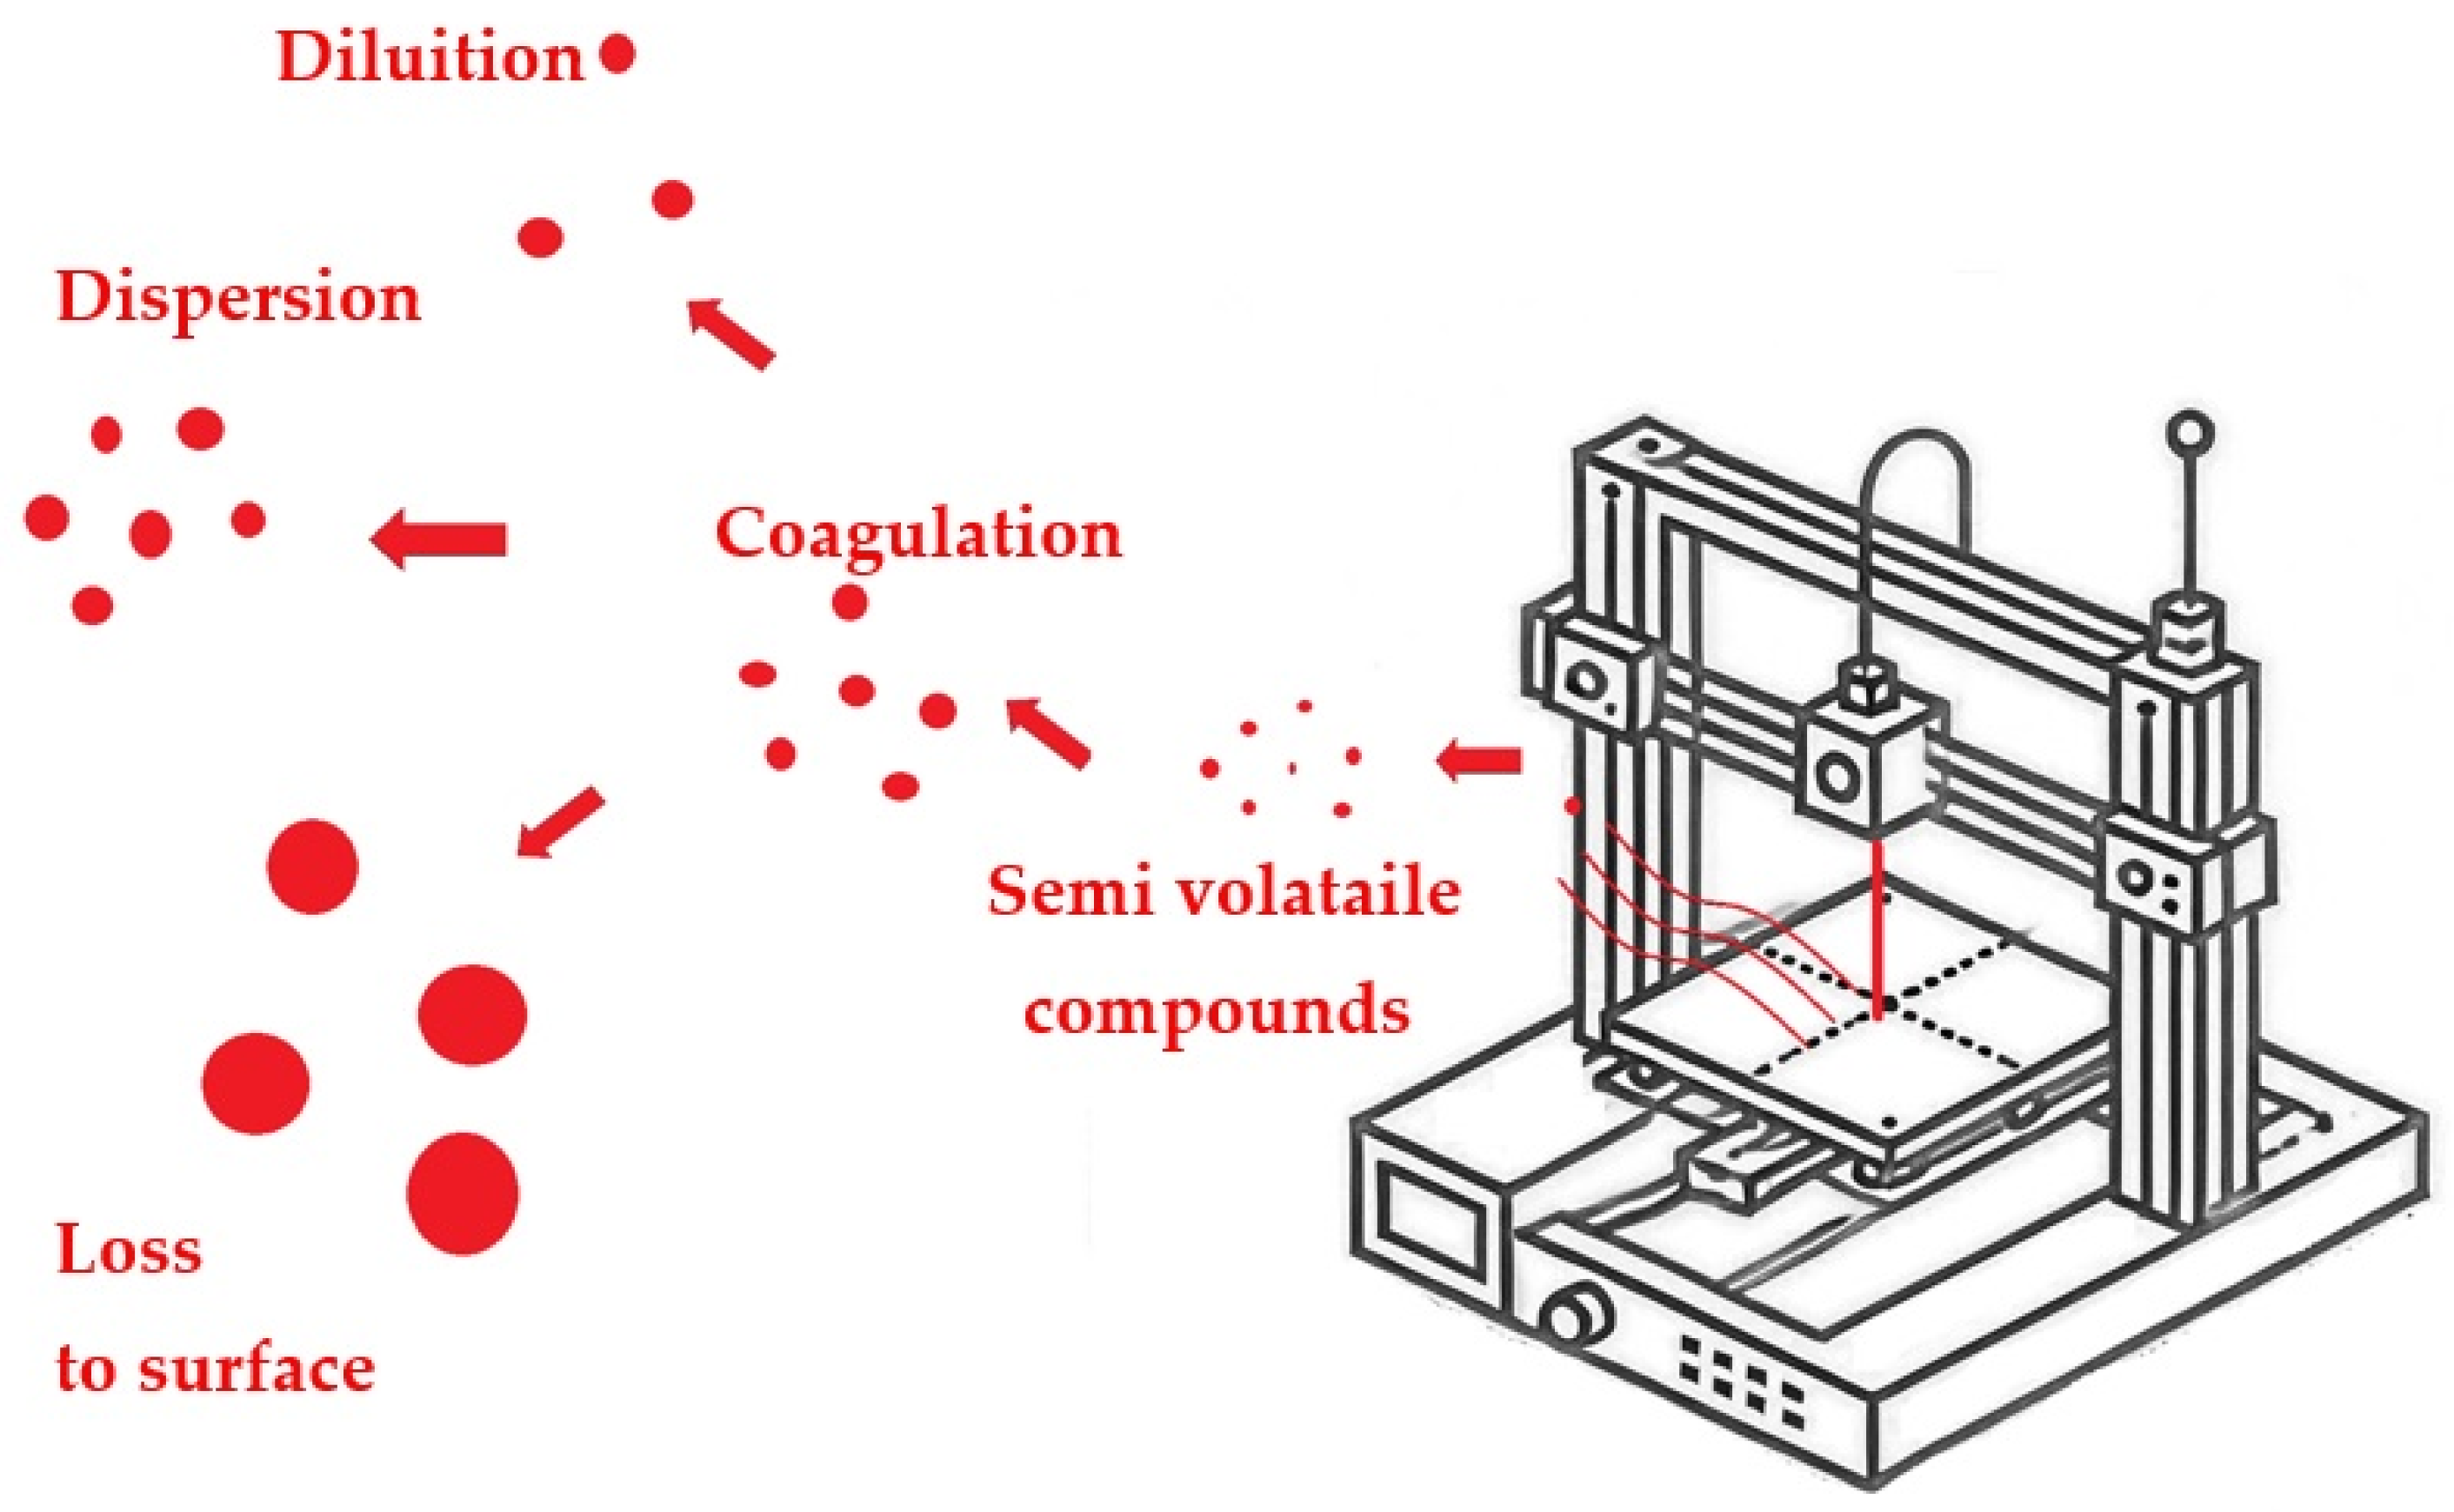
These microscopic particles are mainly created by the fragmentation of materials used for printing, such as plastics, metals, or ceramics. Along with potential chemicals used in the printing process, these dust particles can be inhaled by workers involved in production, posing a health risk, especially with prolonged exposure. Therefore, it is important to use appropriate safeguards and procedures, such as ventilation systems, air filters, and suitable personal protective equipment, to minimize the risks associated with dust emissions in the work environment. Additionally, research on the environmental impact of these dusts is crucial for assessing the overall impact of 3D printing on ecosystems and developing methods to reduce such emissions [15,16,17,18,19,20]. The literature data on dust emissions from 3D printing are presented in Table 1. Particulate matter (PM) refers to a mixture of tiny solid particles and liquid droplets found in the air, which can include dust, dirt, soot, and smoke. These particles vary in size, with PM2.5 and PM10 being commonly measured types, representing particles with diameters less than 2.5 and 10 micrometers, respectively. PM is significant because inhaling these particles can lead to serious health issues, including respiratory and cardiovascular diseases. Moreover, the particles emitted can also be subjected to numerous transformations, such as aggregation, sedimentation, dispersion, or even the sublimation of gaseous particles on solid surfaces, as shown in Figure 1. The emission rate quantifies the amount of a specific pollutant released into the atmosphere over a set period, typically expressed in units such as grams per hour or kilograms per year. Understanding and controlling the emission rate of pollutants, including PM, is crucial for maintaining air quality and protecting public health [21,22,23]. Ultrafine particle emissions from 3D FDM printers show inconsistencies in measurement rates. Studies highlight two main measurement methods—chamber and flow tunnel—that can be used to assess 3D printer emissions and predict exposure levels [24,25].

Table 1.
Data sheet with baseline parameters (runs 1 and 8, described as two experiments).

Figure 1.
Schematic of particle formation, growth, and loss processes (own version based on [15]).
Nanoparticles, a component of the dust created during the 3D printing process, are particularly dangerous due to their microscopic size. These ultra-small particles, often smaller than 100 nanometers, can penetrate deep into the respiratory system and bloodstream. The health effects associated with exposure to nanoparticles can be much more severe than those of larger dust particles. Absorption of such particles through the respiratory system can lead to inflammation as well as damage to lung tissue, and can even affect other organs in the body. Additionally, nanoparticles may have the ability to penetrate the blood–brain barrier, increasing their potential impact on the nervous system [15,16,17,18,19,20]. Studies show that a large number of nanoparticles can be inhaled and deposited in the lungs, particularly in the alveolar region, highlighting the importance of printing conditions [26]. Consequently, controlling airborne nanoparticle emissions in 3D printing workplaces is crucial to ensure worker safety. Proper safeguards, such as specialized air filters and ventilation systems, can help reduce the risks associated with exposure to these dangerous particles. Additionally, research into the effects of nanoparticles on living organisms is key to understanding the full range of health risks associated with 3D printing and developing effective strategies to protect human health [15,16,17,18,19,20]. Research on PLA and ABS filaments used in 3D FDM printing has highlighted emission rates and particle sizes under different conditions, highlighting the need for emission reduction strategies, although the collective impact of all influencing factors remains under-researched, requiring future research to fill these gaps [27]. The authors note that the research area presented here still contains many gaps that can be addressed through the use of neural networks. The findings presented here are intended to serve as a starting point for future research in this area.
Current research is focused on selecting the best possible solutions to predict particulate emissions from 3D printing processes, aiming to improve safety and environmental impact. Using neural networks and advanced modeling techniques, researchers can accurately predict particulate emissions based on material and process parameters, helping to reduce potential risks. This research is key to understanding how different materials, such as PLA, emit particles, and provides a basis for extending the research to other materials and additive manufacturing technologies, such as metal AM. Ongoing development aims to extend the scope to different printing techniques and materials, providing safer and more efficient industrial applications across a range of sectors.
The novelty of this research lies in the innovative use of neural networks to predict and optimize 3D printing parameters, particularly to reduce particulate emissions, a crucial but under-researched aspect of additive manufacturing. Unlike previous studies focusing on print quality or material properties, this research emphasizes environmental sustainability and health safety by targeting emission reduction. The integration of advanced machine learning techniques provides a unique, data-driven approach to identifying optimal printing conditions for different materials and technologies. This framework can also be extended to other additive manufacturing processes, making it a pioneering contribution to both sustainable manufacturing and emission control.
1.3. Aim of the Study
The main goal of this research is to use neural networks to model and optimize 3D printing parameters in order to reduce the emission of particulate matter. As 3D printing becomes more common, concerns about its environmental and health impacts, especially dust emissions, are increasing. By applying neural networks, this study aims to create models that predict and minimize these emissions, making 3D printing processes cleaner and safer. Moreover, by focusing on the reduction in particulate emissions, this study aligns with broader environmental goals aimed at mitigating air pollution and its associated health risks, which is a crucial aspect of sustainable development.
Another key objective is to make 3D printing more sustainable. Traditional methods of optimization often struggle with the complex and variable nature of 3D printing. Neural networks, which can learn from data and identify patterns, offer a powerful way to improve these processes. This research focuses on reducing dust emissions while also improving material use and energy efficiency, which supports the overall goal of environmental sustainability. Ultimately, the integration of neural network-based optimization in 3D printing is not only about technological advancement but also about fostering a more responsible and sustainable approach to manufacturing, in line with global efforts to achieve sustainable production patterns.
In the end, this study aims to develop a practical approach that incorporates neural network modeling and optimization into 3D printing. The results will help manufacturers, policymakers, and researchers reduce the environmental impact of 3D printing and promote its sustainable growth.
2. Materials and Methods
2.1. Data Set
The 3D printer selected for this study was the ANYCUBIC i3 Mega S (ANYCUBIC, Shenzhen, China) (Figure 2). The Anycubic i3 Mega S is a 210 × 210 × 205 mm open-chamber FDM 3D printer with a robust metal frame and a color touchscreen for easy operation. It features a Titan extruder for improved performance with flexible filaments, a heated bed for versatile material options, and a filament sensor that stops printing if the filament runs out. With a print accuracy of ±0.0125 mm on the X/Y axes and ±0.002 mm on the Z axis and layer heights from 0.05 mm to 0.3 mm, the device offers both precision and reliability for a variety of projects. Its features are common in home, school, and small office settings. It has a single printhead and a table that moves along the y-axis. The 3D printer was placed in a specially prepared chamber with a volume of 1 cubic meter to test the presence and concentration of volatile molecules emitted during the printing process.
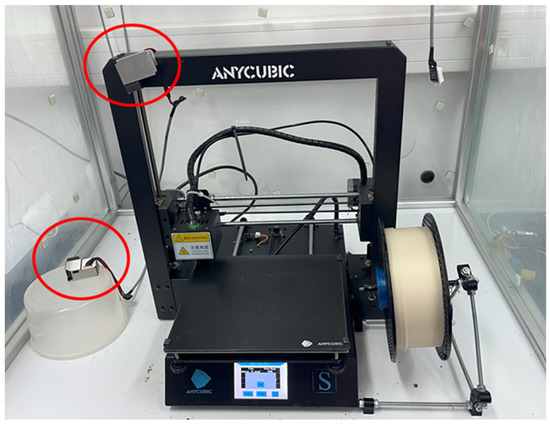
Figure 2.
Test chamber with a 3D printer installed for experiments. The sensors, marked with red circles, are positioned as follows: Sensor 1 is placed at the height of the print bed, while Sensor 2 is located directly above the extruder.
In this study, a PMS3003 sensor (Plantower, Nanchang, China) was used to measure the concentrations of PM1, PM2.5, and PM10. This laser sensor works by emitting a laser beam through the air sample. As particulate matter passes through the laser beam, it scatters the light, and the sensor detects these scattering events. Based on the amount and intensity of the scattered light, the sensor calculates the particle concentrations, providing real-time data on air quality. The sensor analyzed pollution levels in three particle size ranges: 0.3 μm to 1.0 μm, 1.0 μm to 2.5 μm, and 2.5 μm to 10 μm.
Inside the chamber, two sensors were placed at different heights: one at the level of the printing bed and the other above the printhead (see Figure 2). Additionally, a third sensor was positioned outside the chamber, near the door. This sensor was used to monitor background contamination (i.e., the level of contamination before printing) and to continuously check the chamber’s seal. A sudden increase in contaminant concentrations outside the chamber would indicate that pollutants were escaping from the measurement chamber.
In the study, PLA filament was used because it is popular and commonly used in low-cost 3D printers found in homes, schools, and offices [28,29]. PLA (polylactic acid) is a biodegradable thermoplastic commonly used in 3D printing due to its ease of use, low melting temperature, and good print quality. It is derived from renewable resources like cornstarch, making it an environmentally friendly option. PLA is one of the most popular materials in 3D printing, especially for non-professional use, because it is user-friendly, does not require a heated bed, and produces minimal warping. The material is generally considered safe and non-toxic, which contributes to its widespread adoption in home and educational environments. However, as indicated by recent studies, the emission of ultrafine particles (UFPs) during the printing process can pose a potential health risk, suggesting the need for proper ventilation and safety precautions. The filament was white and made by a leading European manufacturer of 3D printers and printing materials. PLA is easy to use and widely available, making it a good choice for studying particulate emissions and optimizing printing settings.
The database, stored in an Excel spreadsheet, contains 884 records and 26 parameters (columns). The data relate to particle emission experiments during 3D printing, including details of the printing conditions and emission measurement results.
The database contains a variety of experiment-related parameters, such as the following:
- Experiment number—a unique identifier for each series of experiments;
- Manufacturer, material, and color—information about the filament used in the printing process;
- Moisture content of the filament and age of the filament—parameters affecting print quality and particle emissions;
- Printer, construction, and class—details of the printing equipment used;
- Printing time, humidity, and temperature—environmental conditions during printing;
- PM 1.0, PM 2.5, and PM 10.0 concentrations—results of particle emission measurements in different ranges per unit time, measured by two independent sensors.
The data are stored in MS Excel format in a single sheet. Each record corresponds to one sample or measurement taken as part of an experiment. The file structure allows easy viewing and analysis of the data, as well as its conversion to other formats or analytical applications.
In this study, two distinct experiments were conducted to evaluate the effects of varying 3D printing parameters. The first experiment (Experiment 1) was carried out with the printing parameters set to the maximum levels recommended by the manufacturer, while the second experiment utilized the minimum recommended settings. These parameter values for both experiments are detailed in Table 1. This approach allowed for a comprehensive analysis of how extreme variations in printing conditions influence the outcomes of the 3D printing process.
In addition to the primary experiments, each setup was subjected to six repetitions to ensure the reliability of the results. During these repetitions, one specific parameter was varied: for Experiment 1, this involved adjusting one parameter to its minimum value, while for Experiment 2, the parameter was set to its maximum value. This approach allowed for a detailed assessment of how individual parameter changes impact the overall printing performance under both the maximum and minimum recommended settings.
Table 1 compares the 3D printing parameters from the two experiments, with Experiment 1 using settings associated with potentially higher emissions, such as higher temperatures, faster printing speed, and enabled cooling. In contrast, Experiment 2 used lower temperatures, slower speed, and disabled cooling, which are linked to lower emissions according to the literature.
Experiment 1 consisted of seven trials using the maximum values of the printing parameters that, according to the available literature, are responsible for the highest particulate emissions. The settings used, such as printhead temperature (225 °C), worktable temperature (60 °C), layer thickness (0.3 mm), print speed (50 mm/s), and nozzle diameter (0.8 mm), were within the manufacturer’s allowable values, but were also configured in a way that could lead to intensified emissions. Repetition 1 had all its parameters set at maximum values, while each subsequent repetition had one factor changed to a minimum value.
Experiment 2 also consisted of seven trials using the minimum parameter values given by the manufacturer that, according to the literature, lead to the lowest particulate emissions. The performance of the printer was tested at a lower head temperature (190 °C), a lower work table temperature (21 °C), a thinner layer (0.2 mm), a slower print speed (30 mm/s), and a smaller nozzle diameter (0.4 mm). These experiments were designed to determine parameter configurations that minimize particle emissions while maintaining adequate print quality.
Table 2 shows the detailed parameters of every run of the experiment on the effect of different 3D printing settings on atmospheric particulate emissions.
Table 2.
Summary data sheet with all parameters.
During each run, measurements of the concentration inside the testing chamber were taken at a frequency of 1 s. To make the data more manageable, the frequency was reduced to 1 min. For each 1-min interval, theparticle matter emission increment was calculated by subtracting the initial concentration value from the final concentration value. The formula used is
where
PMEmission Increment = Cfinal − Cinitial
- Cfinal is the final concentration value at the end of the 1-min interval, and
- Cinitial is the initial concentration value at the start of the 1-min interval.
2.2. Analysis of Measurement Data
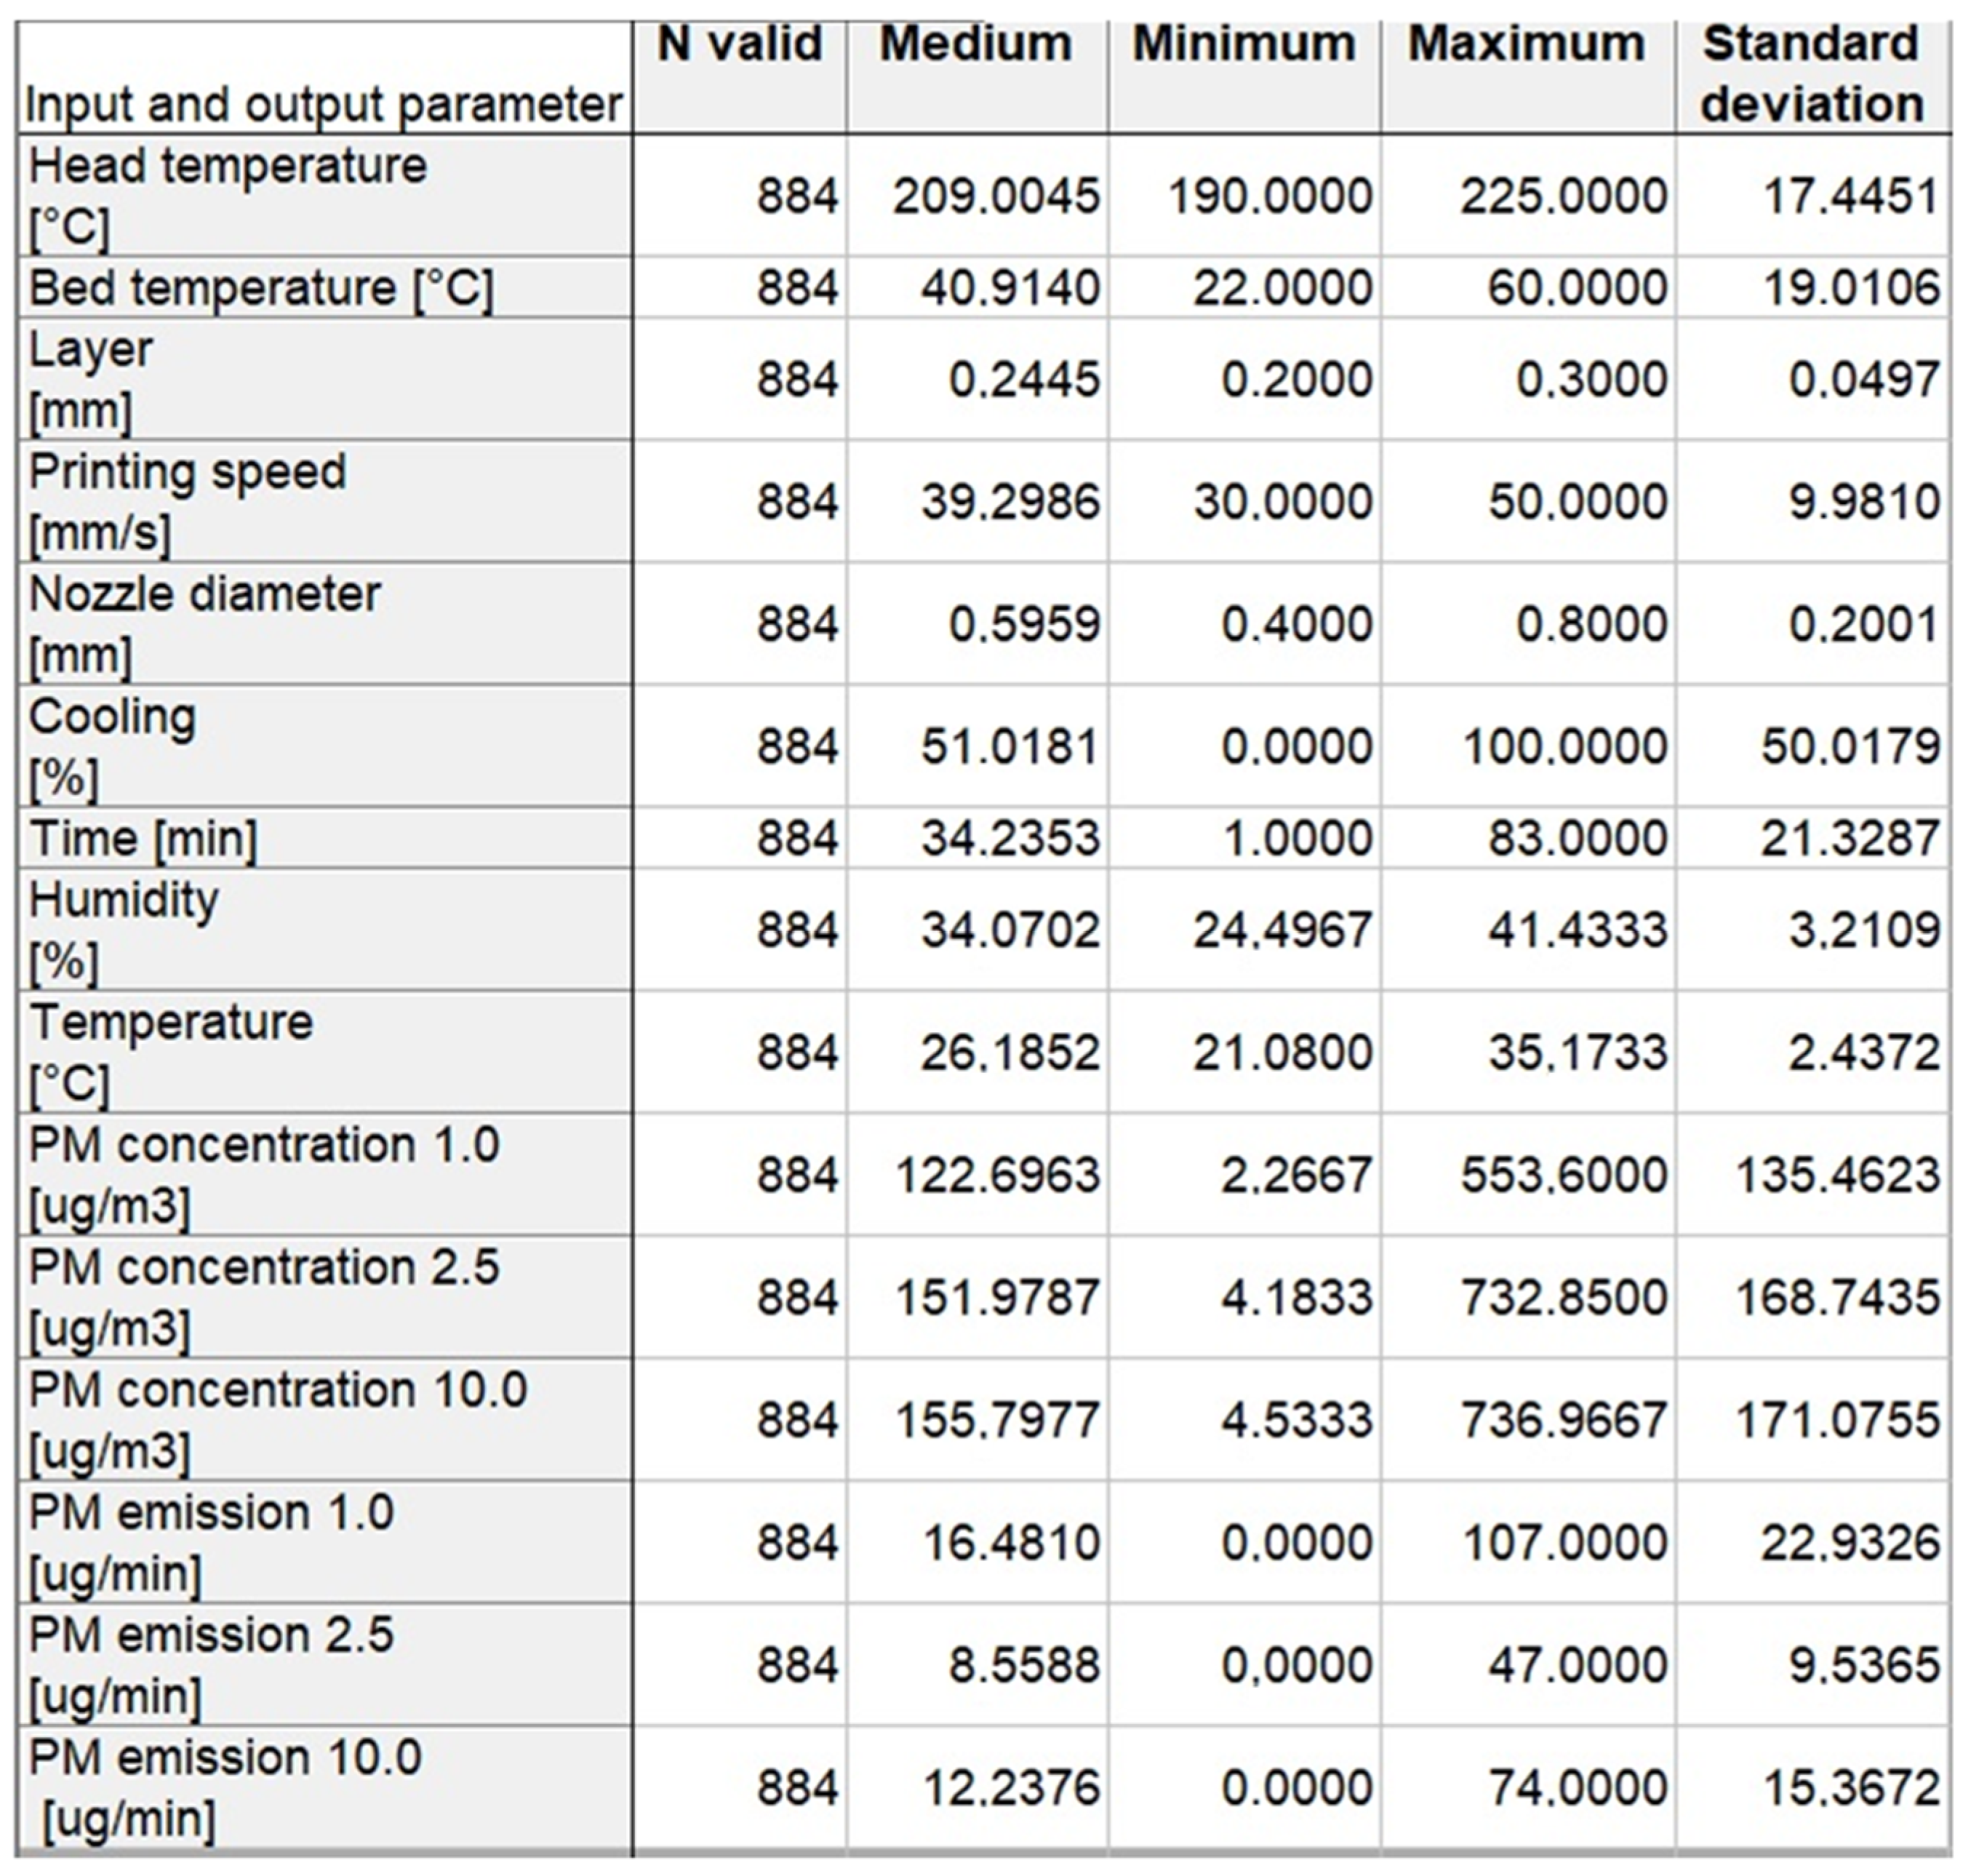
The basic analysis of the measurement data is shown in Figure 3. The input data arehead temperature [°C], bed temperature [°C], layer [mm], printing speed [mm/s], nozzle diameter [mm], cooling [%], time [min], humidity [%], and temperature [°C]. The output data are PM concentration 2.5 [ug/m3], PM concentration 10.0 [ug/m3], PM emission 1.0 [ug/min], PM emission 2.5 [ug/min], and PM emission 10.0 [ug/min].For each input and output parameter, the following were determined: N valid values, the medium value, the minimum and maximum values, and the standard deviation. The following is how the descriptive statistics of the data values are presented.
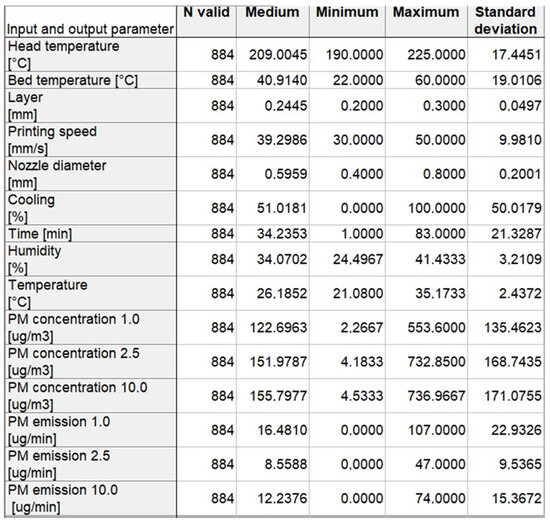
Figure 3.
The basic analysis of measurement data (input, output) in Statistica 13.
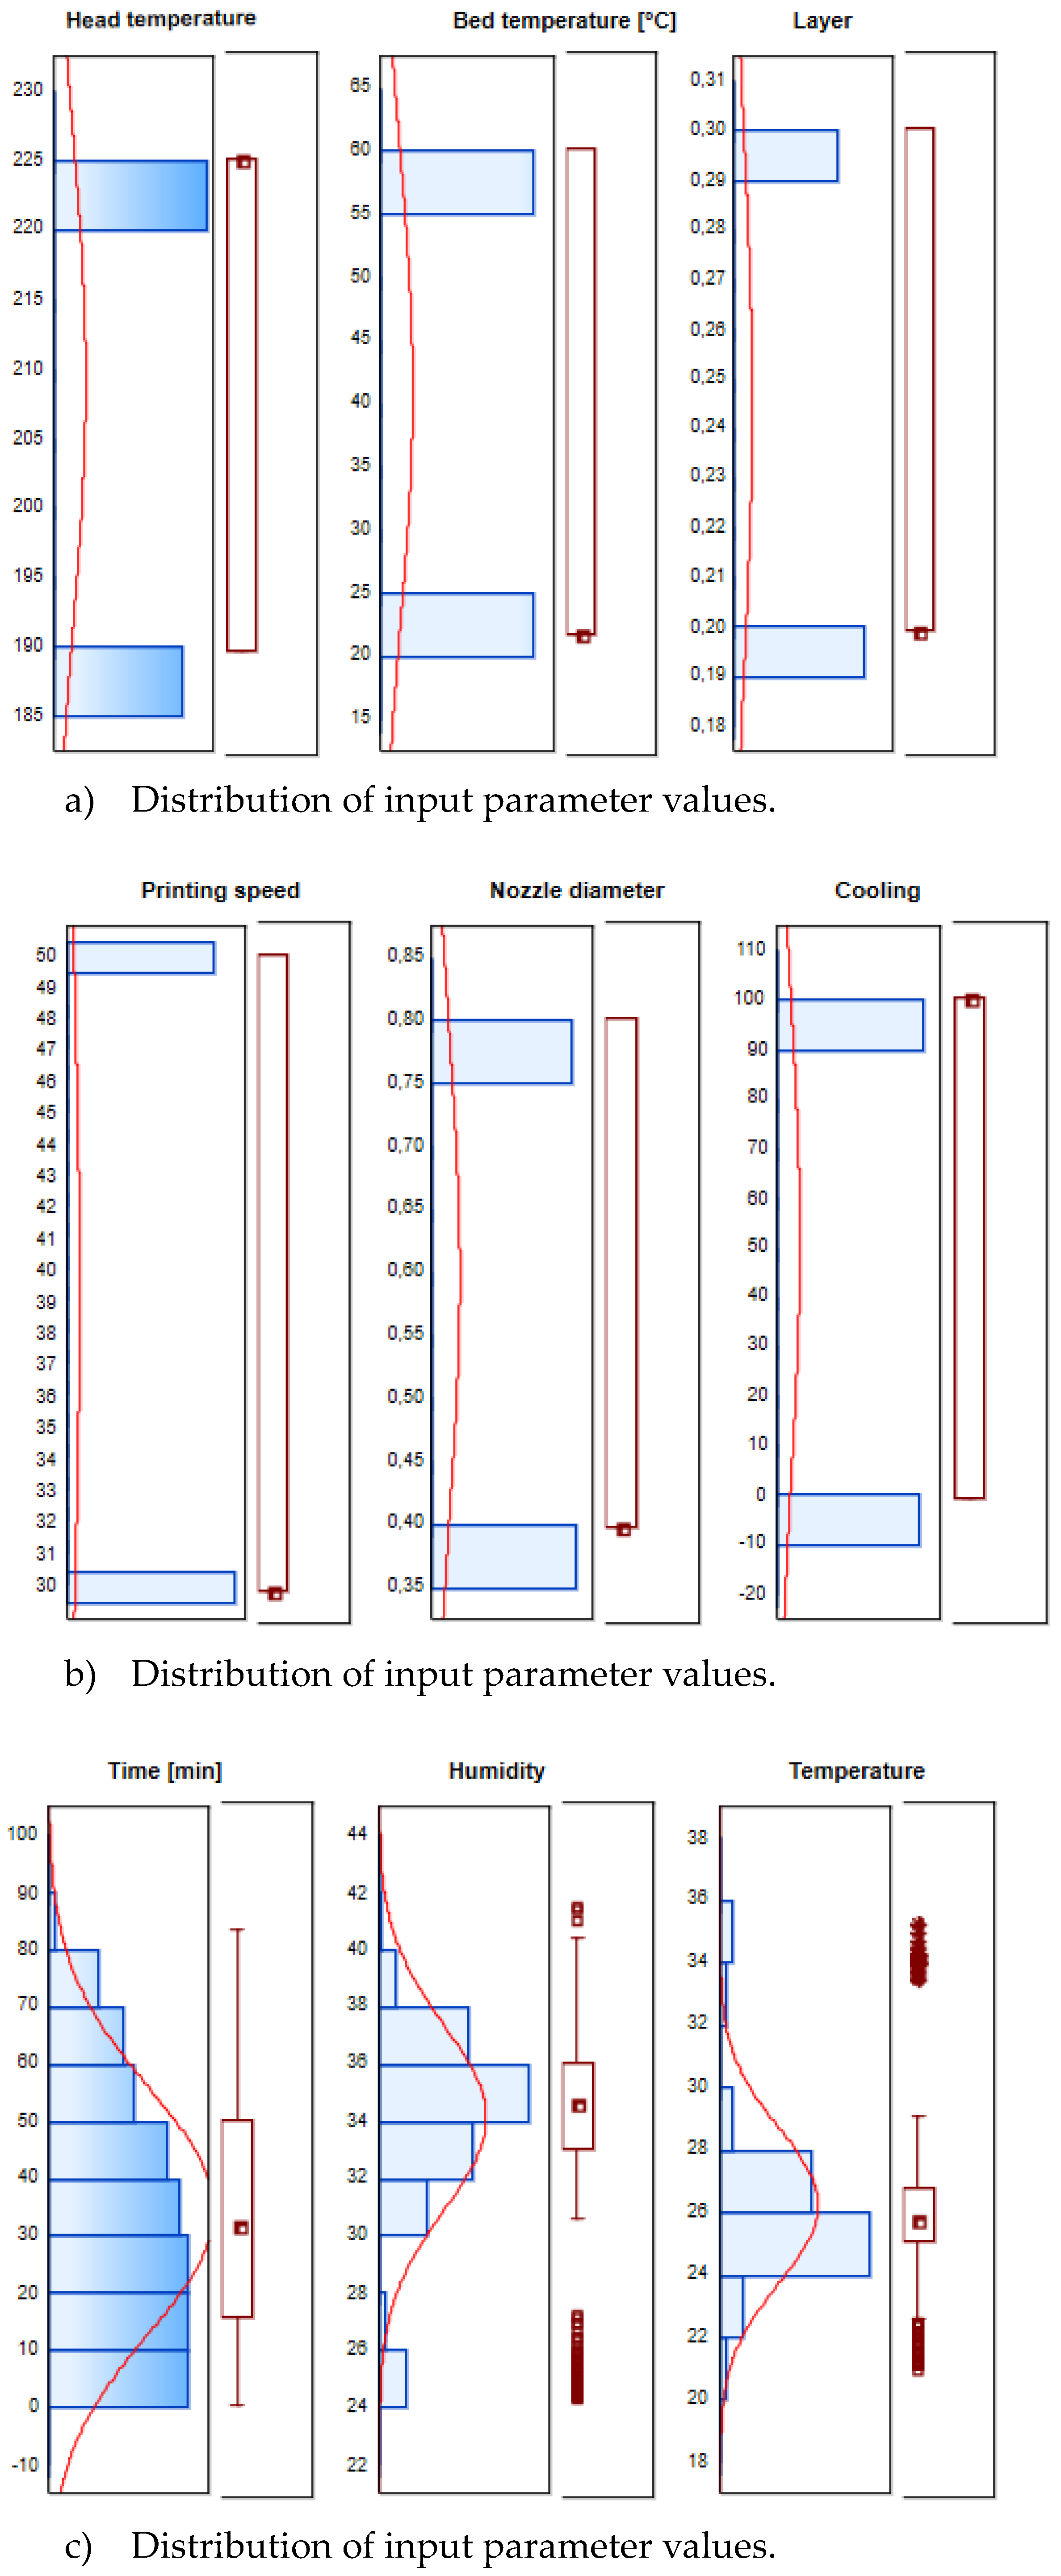
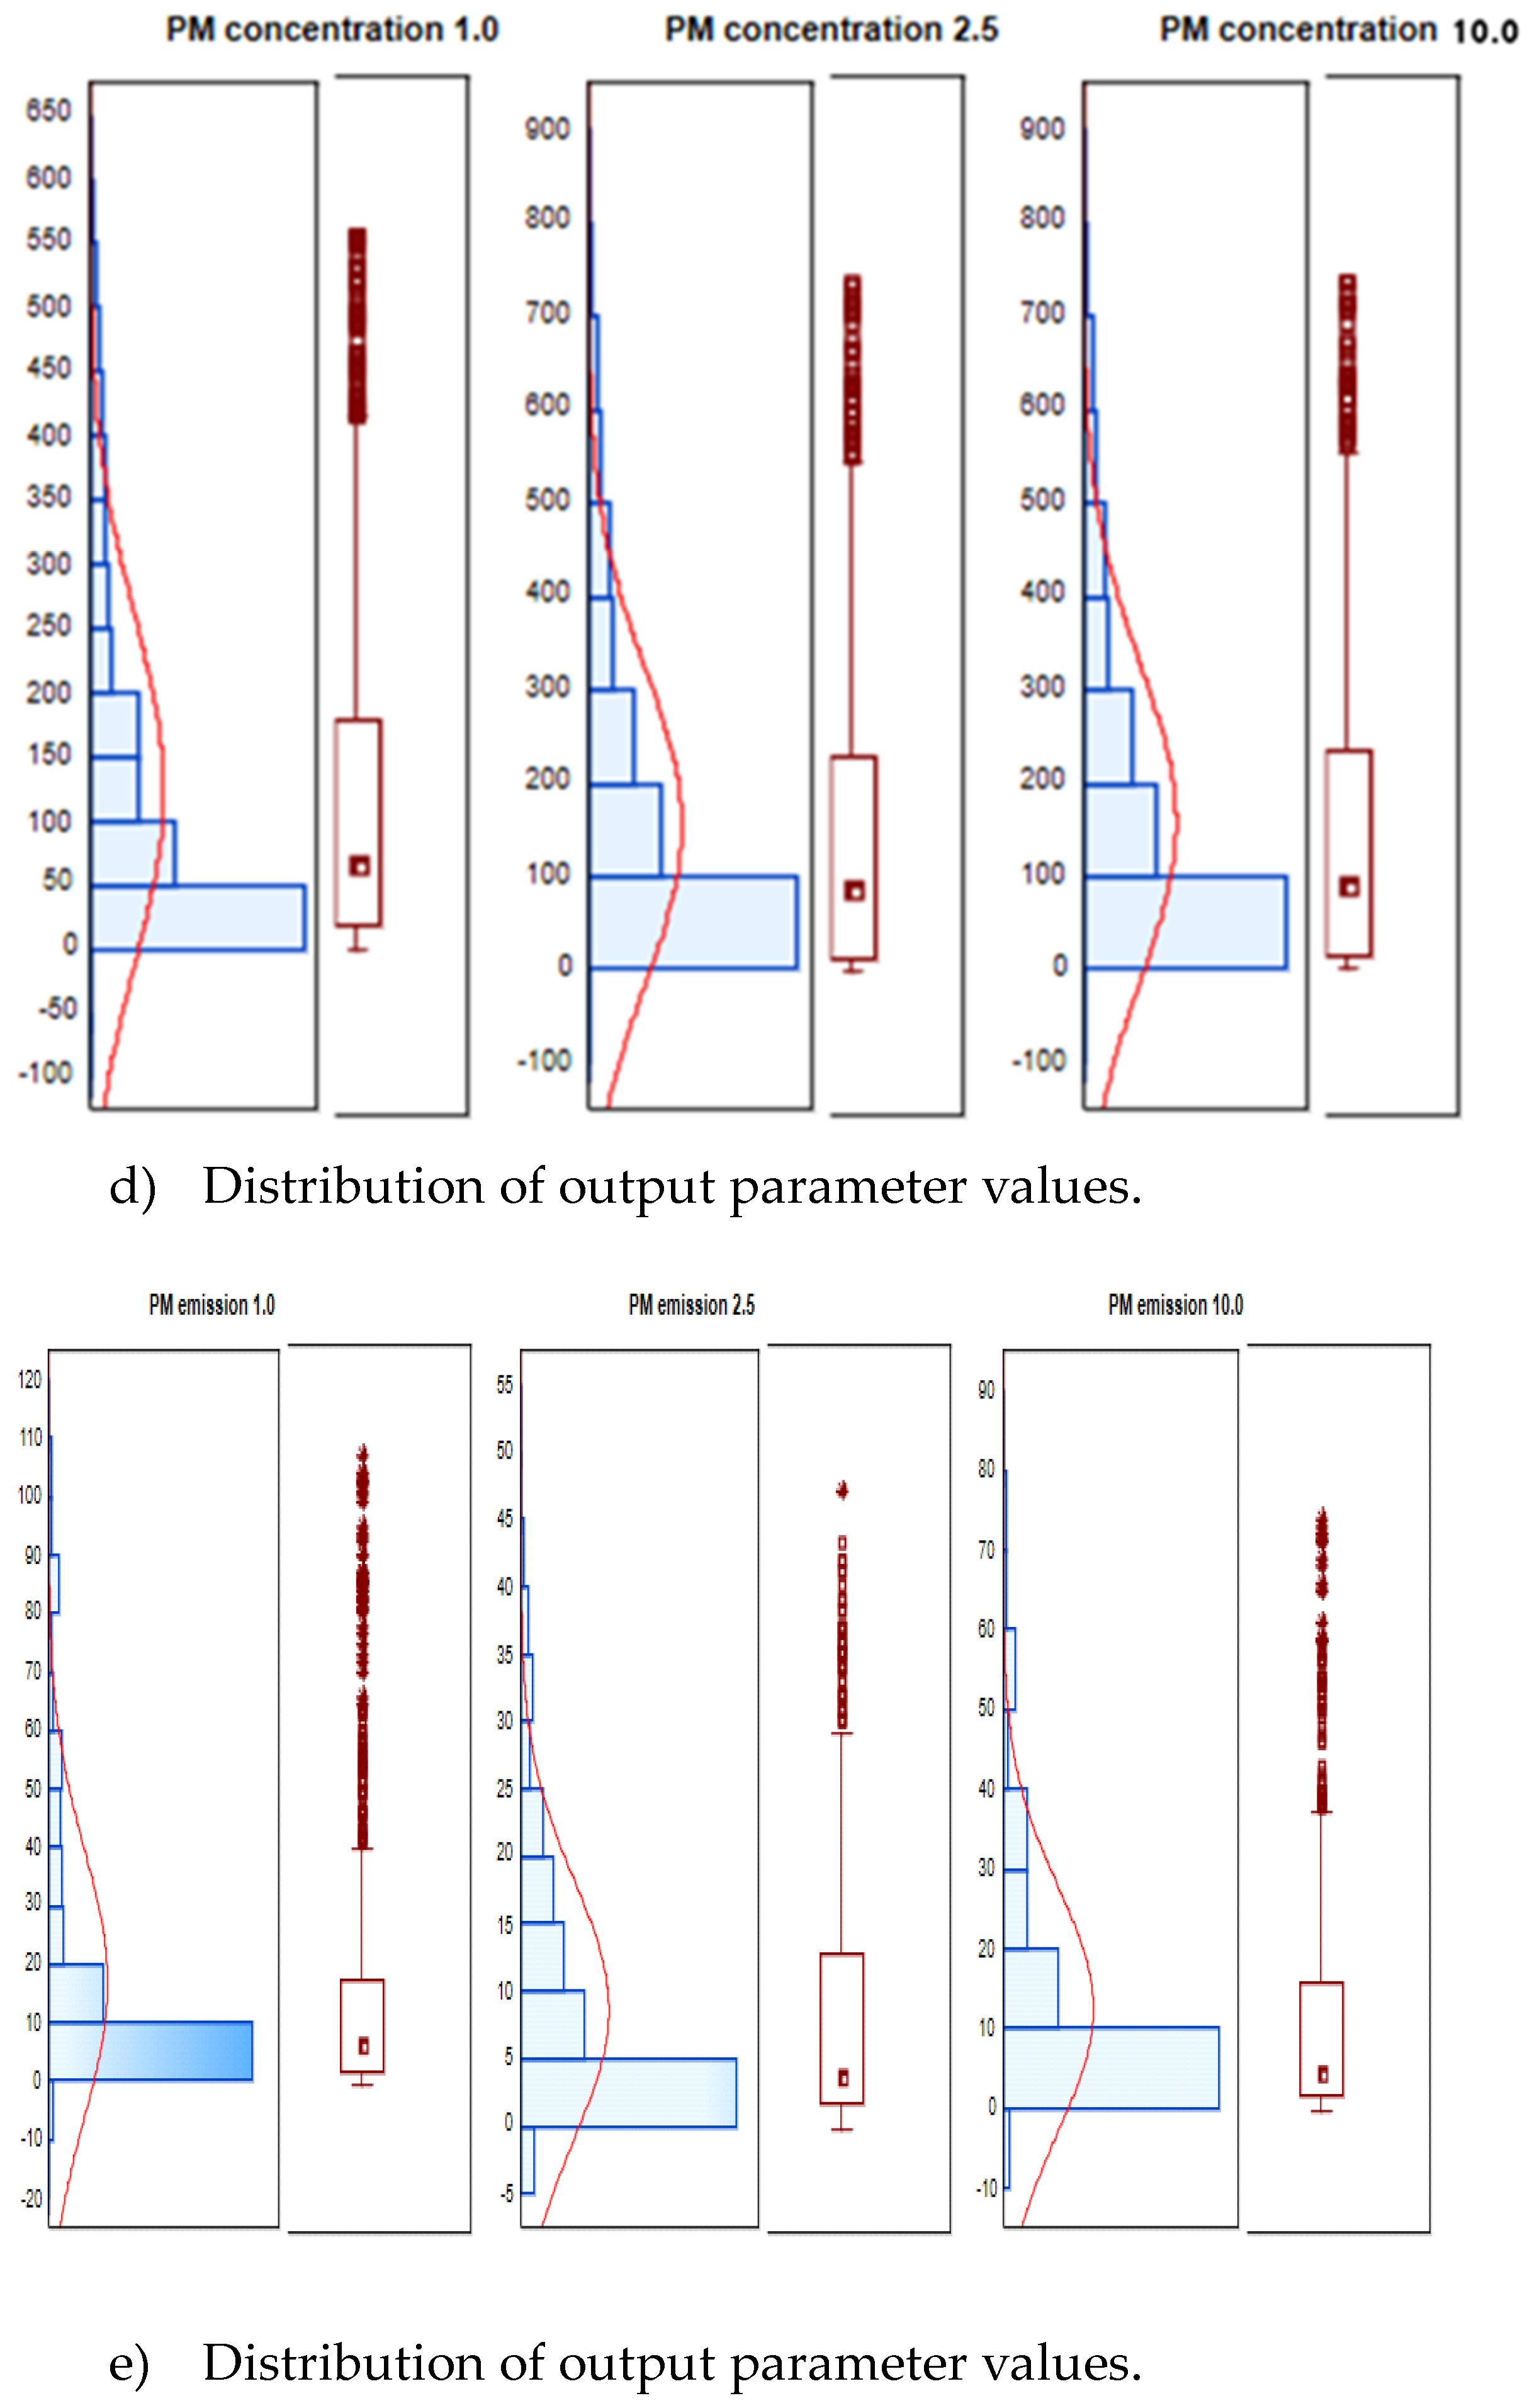
Another very valuable piece of information about the data value is the shape of the distribution (Figure 4), which provides information about the frequency of occurrence of values of this variable in various areas of its variability. Figure 4 shows the characteristics of the distribution shape for each input and output variable in the form of a histogram, which facilitates the assessment of the normality of the empirical distribution, because the histogram is overlaid with the fitted density curve of the normal distribution. The shape of the distribution of a variable informs about the frequency of occurrence of the value of this variable in different areas of its variability. It allows to determine whether the analyzed distribution is an approximate normal distribution (symmetric) or an asymmetric distribution. For example, if the skewness (a measure of the asymmetry of the distribution) is clearly different from 0, then the analyzed distribution is asymmetric (e.g., Figure 4e), while the normal distribution must be exactly symmetric. If the kurtosis (a measure of the slenderness of the distribution) is clearly different from zero, then the distribution is either flatter than the normal distribution or more slender, because the kurtosis of the normal distribution is exactly 0 (e.g., Figure 4b or Figure 4c).
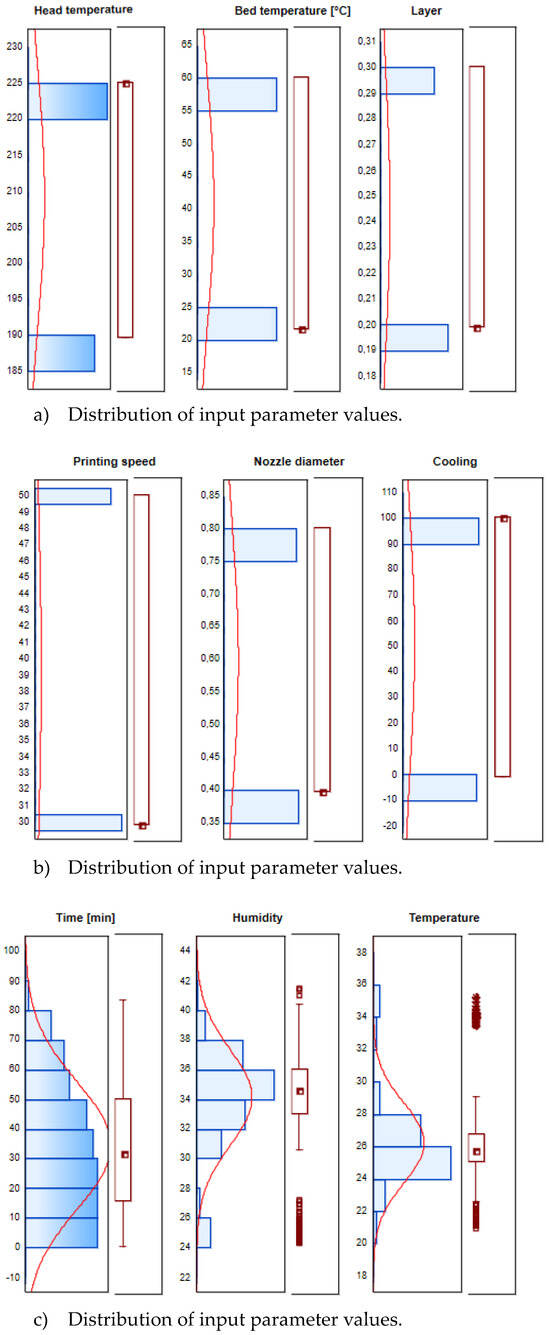
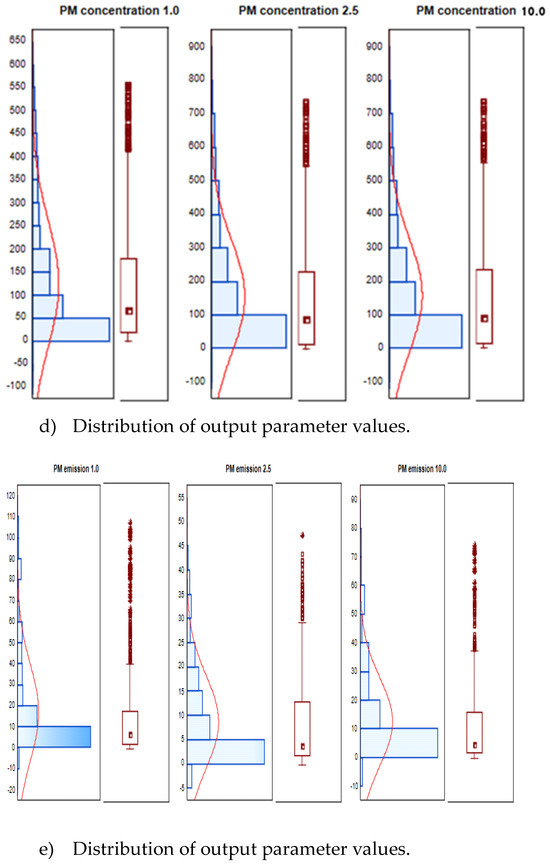
Figure 4.
Summary for distribution of input and output parameters.
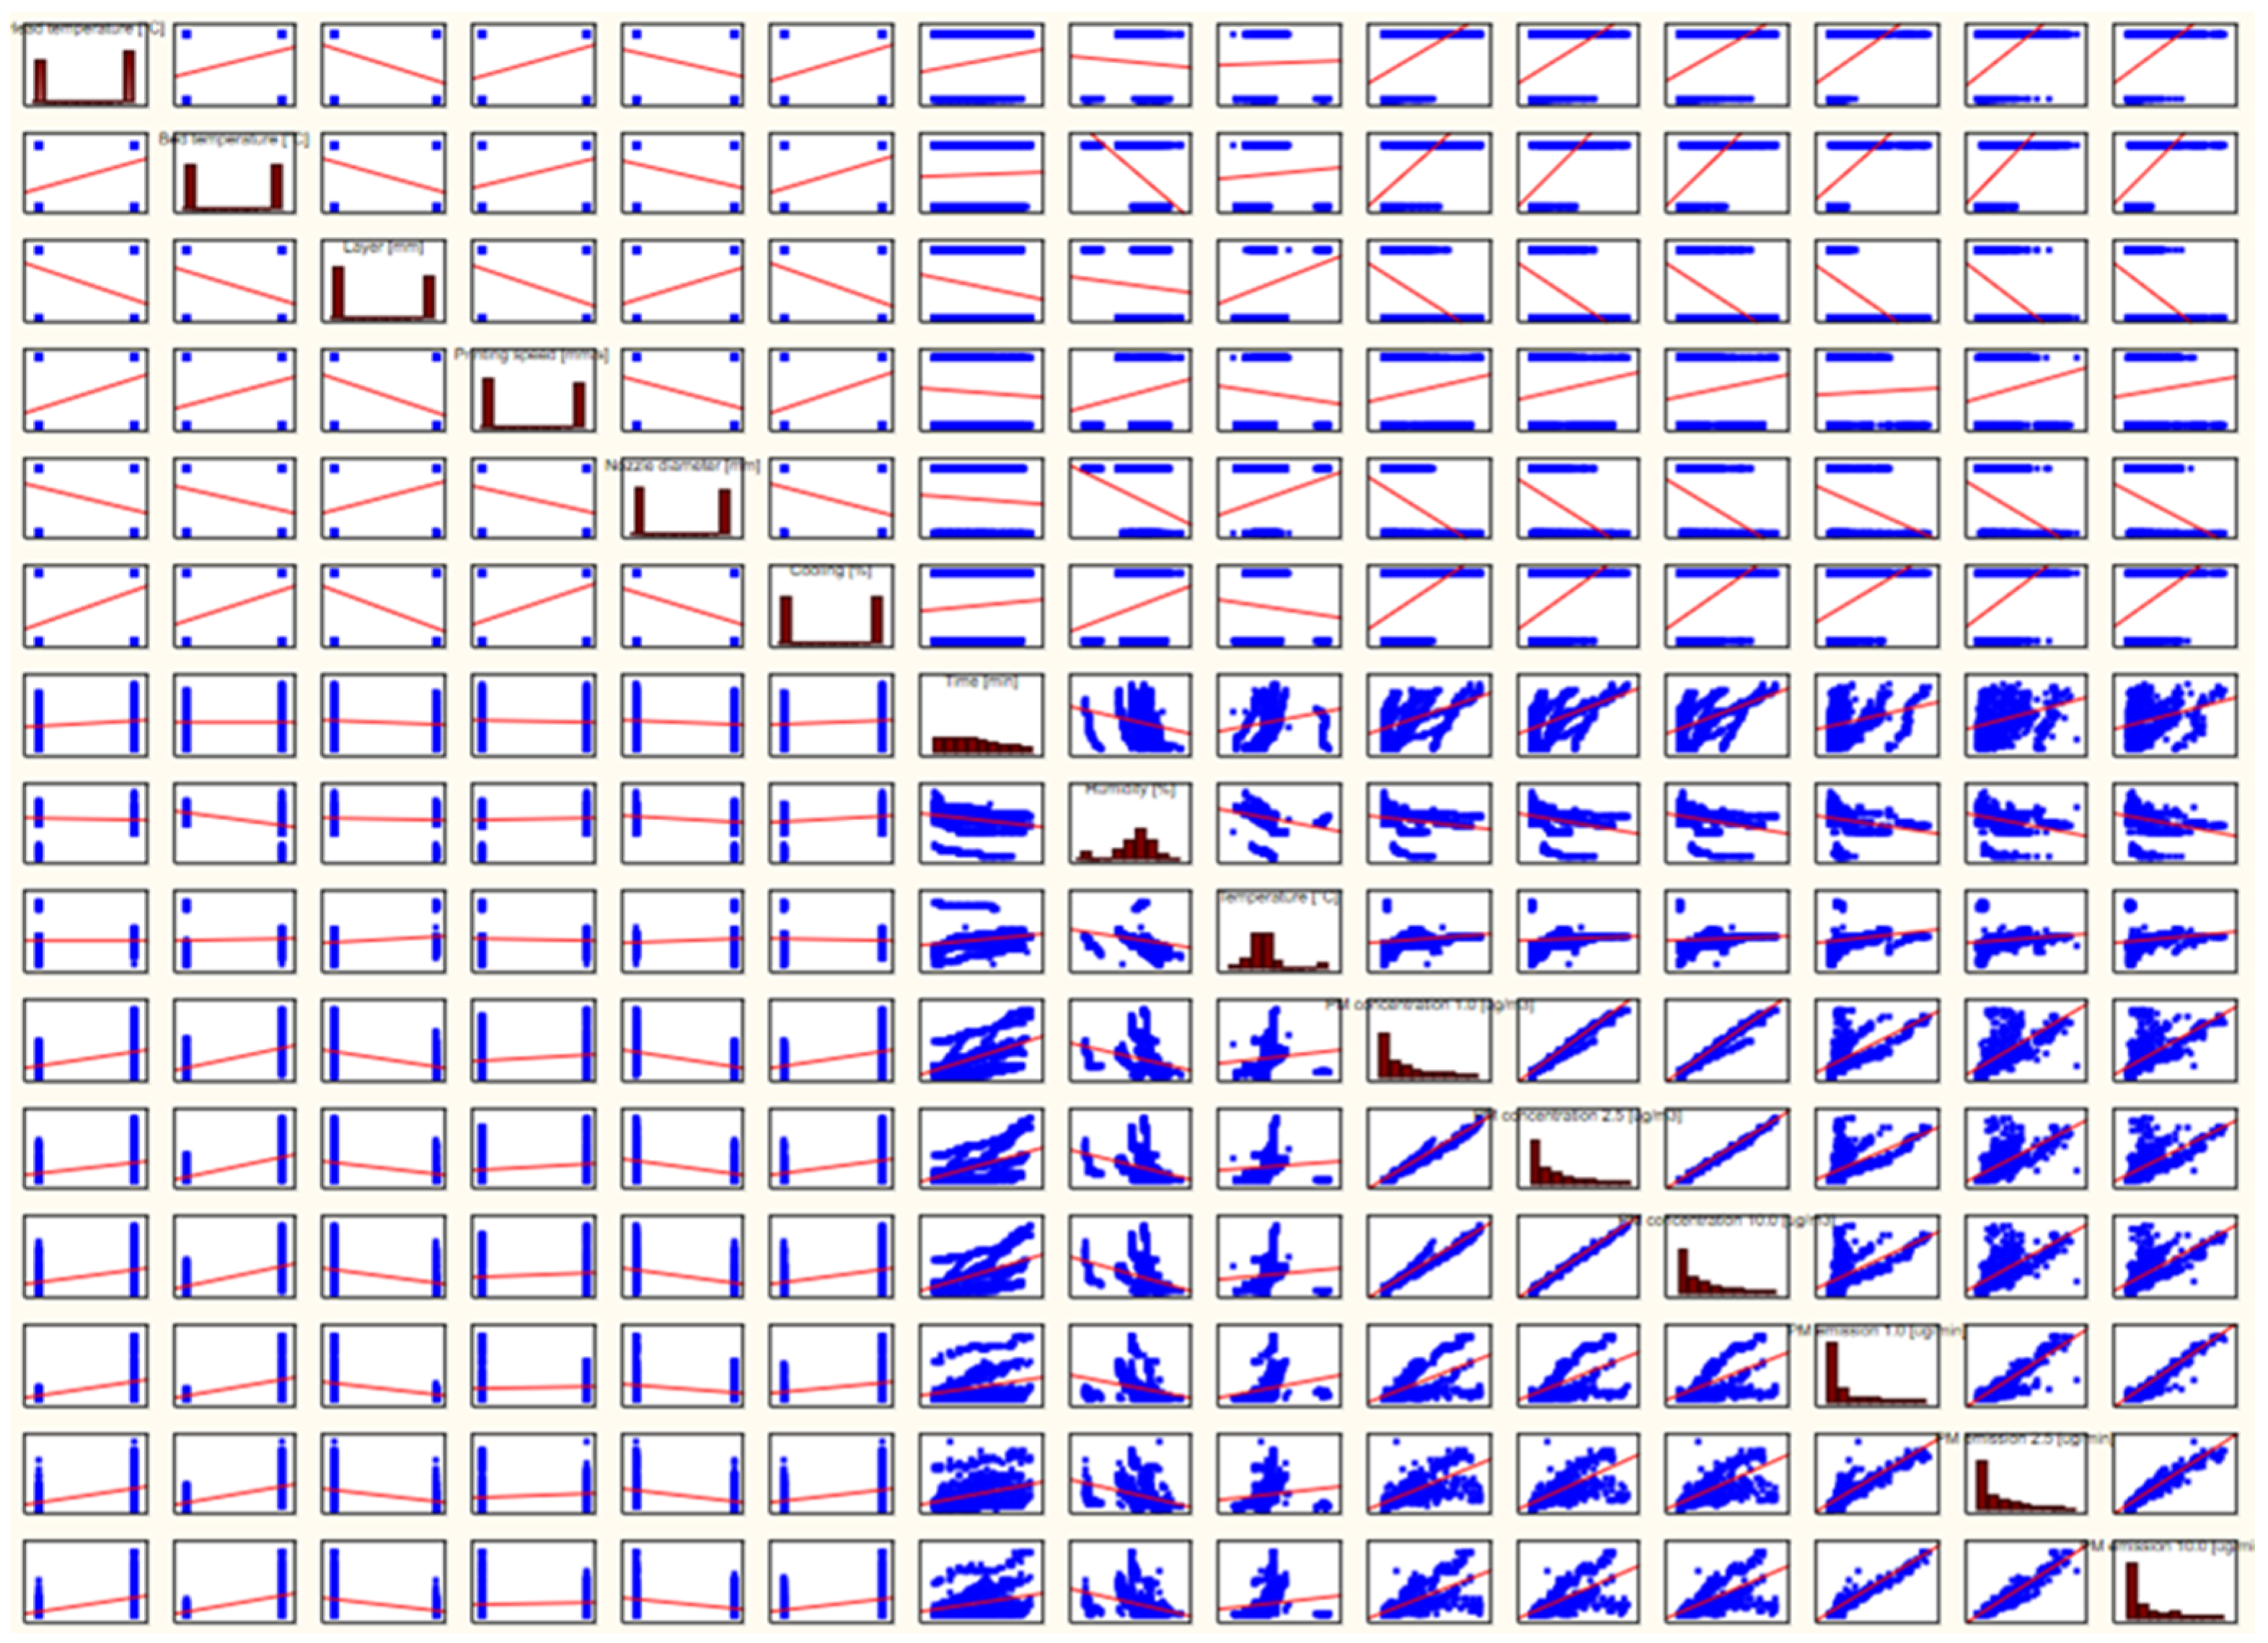
Additionally, the correlation between all 15 parameters (9—input parameters, 6—output parameters) was determined. The correlation graphs are shown in Figure 5. Figure 5 shows a matrix scatterplot for all 15 parameters. Matrix plots are used to collectively present the interdependencies between many variables in the form of a matrix of ordinary X–Y plots. The most commonly used type of matrix plot is the scatterplot matrix, which can be treated as a graphical equivalent of the correlation matrix. The basic application of matrix plots is to summarize, on a single graph, the distributions and interrelations of the analyzed variables. Histograms representing the distribution of each variable are displayed along the diagonal of the matrix. Additionally, graphs of the normality of the variables and graphs of deviations from normality are presented. In this way, the variables were analyzed and it was checked whether there were variables that did not correlate with the other variables.
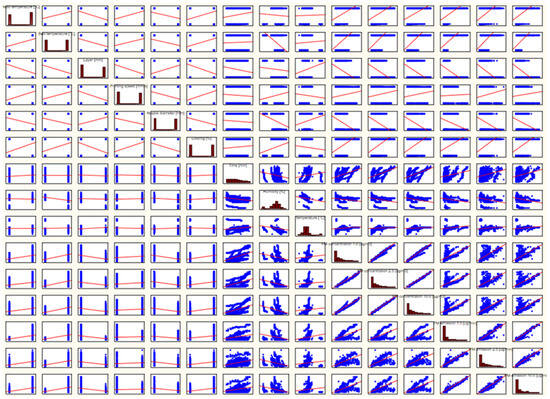
Figure 5.
Correlations among variables of 15 parameters.
The observed correlations were as follows: the parameters with the greatest impact on emissions were printing speed, printhead temperature, and nozzle diameter, while the parameters with the least impact were ambient humidity and ambient temperature. Higher printhead temperatures can result in higher particle emissions (e.g., PM10) due to higher material melting and decomposition rates. Higher printing speeds can lead to increased dust emissions because a shorter time for layer cooling leads to the increased evaporation of volatile substances. A larger nozzle diameter in the 3D printing process contributes to reduced particulate emissions, which is due to a better ratio of the surface area of the release of contaminants to the total volume of processed material. When a larger nozzle diameter is used, the material being processed passes through the nozzle more slowly and a larger amount of material is melted simultaneously over a larger surface area. As a result, the surface area relative to the volume from which dust particles and volatile organic compounds (VOCs) can be released decreases. Compared to smaller nozzles, where more material is subjected to greater thermal stress, which can lead to more evaporation and chemical decomposition, larger nozzles allow for a more controlled melting process.
A data cleaning process, i.e., a validation of the measured data values, was carried out. With descriptive statistics, it was possible to assess the quality of the data.
2.3. Computationalmethods
Statistica 13 software (MathWorks, USA) was used to build multilayer perceptron models (MLPs).
The MLP is a type of feedforward neural network with one or more hidden layers between the input and output layers. Common activation functions include ReLU, Sigmoid, and Tanh, which introduce nonlinearity. The learning rate determines how many weights are updated during training; a value too high or too low can lead to suboptimal convergence. Increasing the number of hidden layers can improve the capacity of the model but can lead to overfitting. More neurons can capture complex patterns but require careful tuning to avoid overfitting. Regularization: Techniques such as L2 regularization (weight decay) or dropout prevent overfitting by penalizing large weights or randomly removing neurons. Optimizers such as Adam, SGD, or RMSprop control how the network learns from the data. Smaller batch sizes provide noisy updates but can generalize better, while larger batch sizes are more stable but require more memory [30,31,32].
The parameter settings in an MLP neural network significantly affect its learning and performance. The size of the input layer is determined by the number of features in the data set, as this dictates how manydata are fed into the model. The size of the output layer corresponds to the number of desired predictions, such as the number of classes in a classification problem. The numbers of hidden layers and neurons per hidden layer areset based on the complexity of the model; too few may underfit, while too many may overfit or lead to unnecessary computational costs. Activation functions such as ReLU or Sigmoid affect nonlinearity, allowing the network to learn more complex patterns. The learning rate controls how much the model weights are updated during training, with values that are too high leading to instability and values that are too low leading to slow convergence. The batch size affects how manydata the model processes at once; larger sizes stabilize the updates but require more memory, while smaller batches lead to noisier updates that can help it escape local minima. Weight initialization strategies such as Xavier or He prevent problems such as vanishing or exploding gradients that affect training performance. Dropout factor is a regularization technique that avoids overfitting by randomly disabling neurons during training. The choice of optimizer (e.g., Adam, SGD) affects how the model moves on the loss surface, balancing convergence speed and robustness.
MLP networks were chosen because they are the most universal, they learn quickly, and if their quality is high, then other methods are not sought. The authors consider that with the growth of the amount of data, they will use other intelligent models in the future, because MLP networks may not be enough. In the rest of the paper, only the best-performing MLP neural networks are presented. These models were selected based on their superior accuracy, stability, and generalization on the data set. Each presented network underwent a rigorous tuning of hyperparameters such as layer size, activation functions, and learning rates to optimize performance. As a result, only the most efficient and reliable architectures were distinguished for further analysis. The network parameters were selected based on the authors’ knowledge and experience. The choice of a specific algorithm is based on the lowest errors. In the case of regression problems, it is based on the sum of the squared errors of the training and test samples. These errors are calculated for the original (unscaled) value of the objectives. In the case of classification tasks, the choice is based on the misclassification rate. The percentage of misclassified cases is easy to interpret because it takes values from 0% to 100%, with 0% being the best, because it means zero misclassifications. The quality of the network is given in the quality (training) and quality (testing) columns, separately for the training and test data. The quality measure used depends on the type of the output variable. In the case of continuous numbers (regression), it is the correlation coefficient, where the given value is the average of the correlation coefficients calculated for the training, test, and validation data (if any). For categorized alternatives (classification), a number is provided that is included in the case of classification (from primary key to number of users).
3. Results
This study identifies the most influential parameters and optimization strategies to prevent environmental and health risks, thus promoting more advanced 3D printing practices. This research identifies key parameters, such as head temperature, bed temperature, print speed, nozzle diameter, and cooling, that significantly impact particle matter emissions. Quantitative analysis reveals that higher head temperatures (225 °C), faster print speeds (50 mm/s), and larger nozzle diameters (0.8 mm) result in elevated PM emissions, while lower settings (head temperature at 190 °C, print speed at 30 mm/s, nozzle diameter of 0.4 mm) help minimize these emissions. Using multilayer perceptron (MLP) neural networks, predictive models with an accuracy of up to 95.6% were developed, allowing for the precise optimization of 3D printing processes. The results of this research are crucial for the development of 3D technology and the development of safety guidelines. Furthermore, this study shows the potential of neural networks in the analysis and optimization of technical processes in various industrial applications, contributing to a more sustainable and environmentally friendly approach in this field. It is an extended study of the potential of neural networks fortechnical solutions in various industrial applications that are available in a more advanced and environmentally friendly environment in this field.
When looking for the best MLP model, a number of models differing in structure must be developed. In these models, the input (nine) and output (six) are fixed. The number of neurons in the hidden layer is selected experimentally. Another parameter selected is the learning algorithm. In our study, the BFGS (Broyden–Fletcher–Goldfarb–Shanno) algorithm was used. The number given next to the abbreviation BFGS denotes the number of epochs, i.e., learning cycles of the model, which are used to optimize the model weights. In the model structure, the next element selected is the error function. For the regression, the error function used is the sum-of-squares (SOS). The other parameters that are changed are the hidden layer activation function and the final layer activation function. In the case of MLP networks, these can be the following functions: Linear, Logistic, Hyperbolic tangent (tanh), Exponent, Sine.
In the case of regression, i.e., continuous variables, the quality of the model is determined by the correlation coefficient, with the reported value being the average of the correlation coefficients calculated for the learning, test, and validation data.
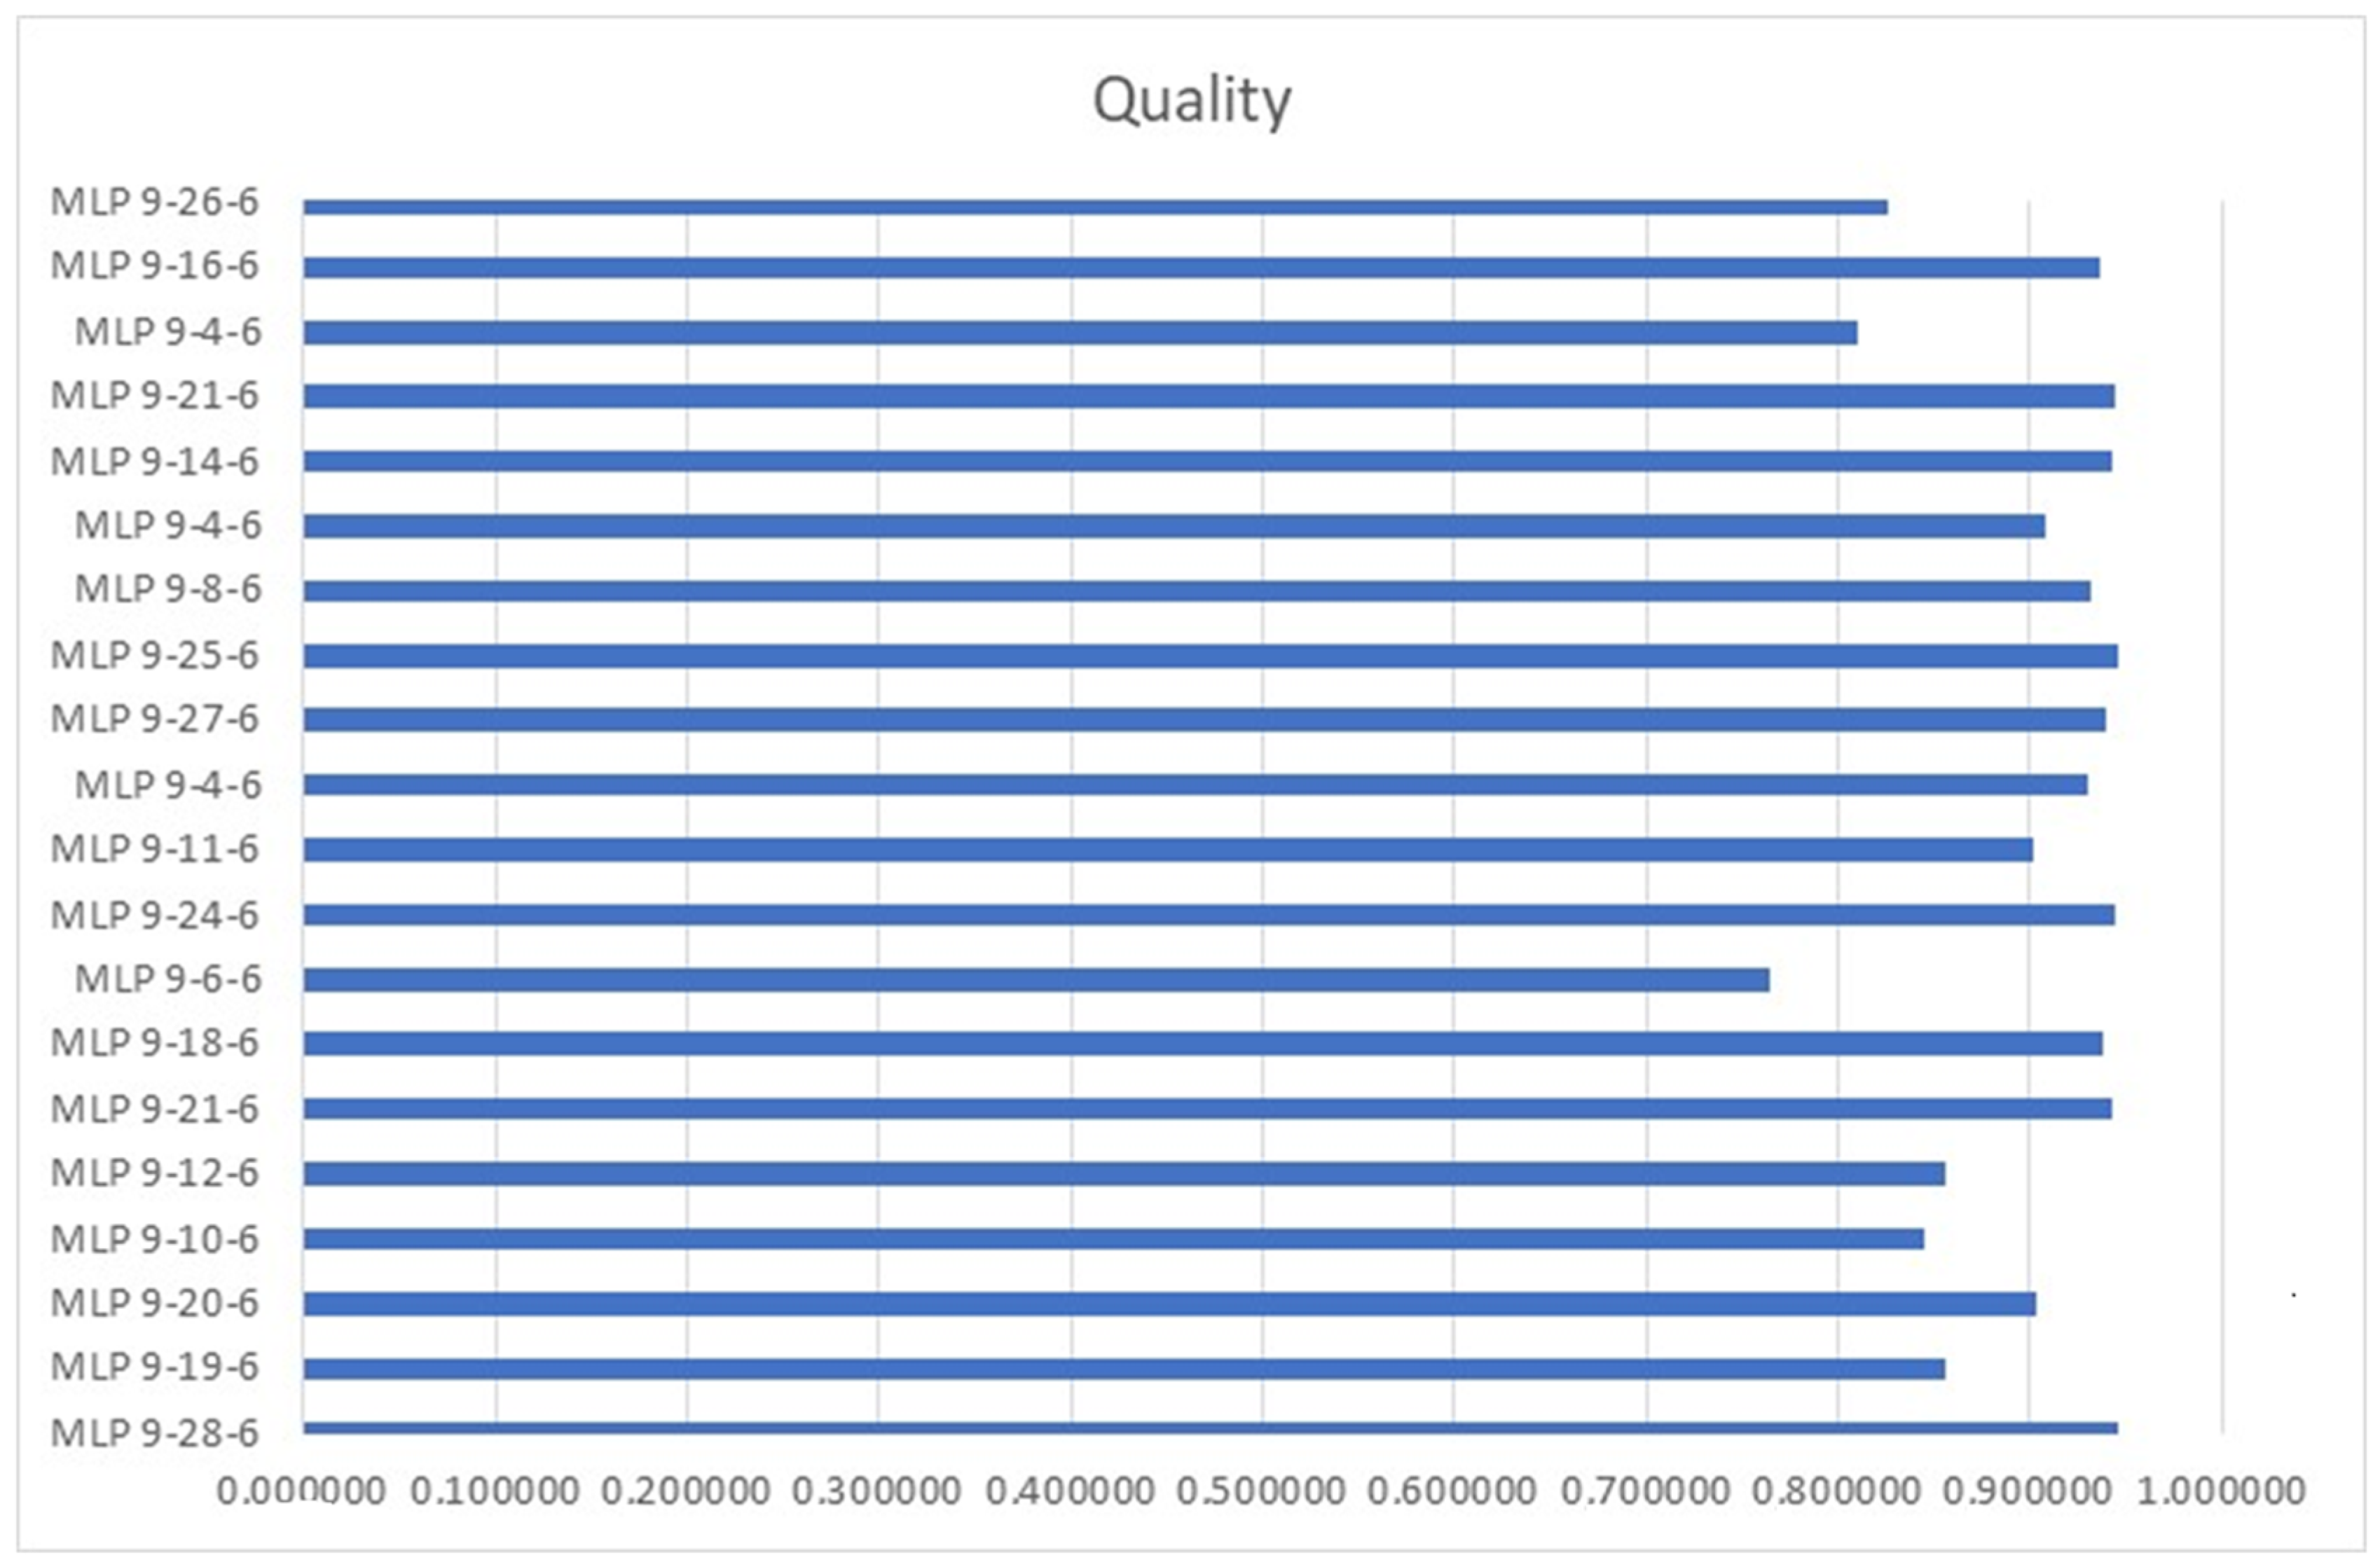
The best ANNs for the nine input parameters (including humidity and temperature) are presented in Table 3 in Figure 6. The best quality, 0.945697,showed MLP 9-28-6 and 0.946325–MLP 9-25-6. When we have small differences in the quality of the model, it is important to pay attention to the learning or teaching time of the neural network. The first network was taught for 140 epochs, while the second network was taught for 213 epochs.
Table 3.
The best neural networks for the nine input parameters.
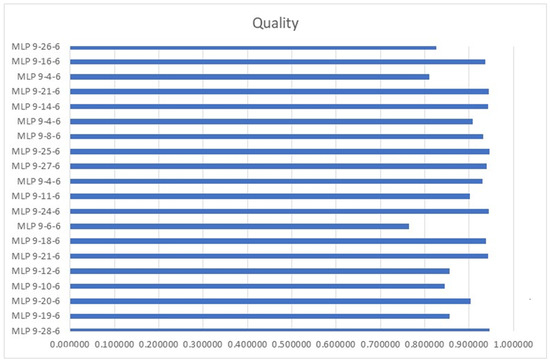
Figure 6.
Graph of average quality of MLP networks for nine parameters.
The next stage of the research involved building MLP neural network models with seven inputs, excluding humidity and temperature. The MLP model had the following inputs: head temperature [°C], bed temperature [°C], layer [mm], printing speed [mm/s], nozzle diameter [mm], cooling [%], and time [min]. The output data are the following: PM concentration 2.5 [ug/m3], PM concentration 10.0 [ug/m3], PM emission 1.0 [ug/min], PM emission 2.5 [ug/min], and PM emission 10.0 [ug/min].
The humidity and temperature parameters are parameters that are not controlled on the unit. Instead, they change during the process. The temperature increases and the humidity decreases. This is a direct consequence of placing the heated head and table in a low-volume chamber.
The second stage of the research investigated whether the omission of these two parameters affects the quality of the MLP models built.
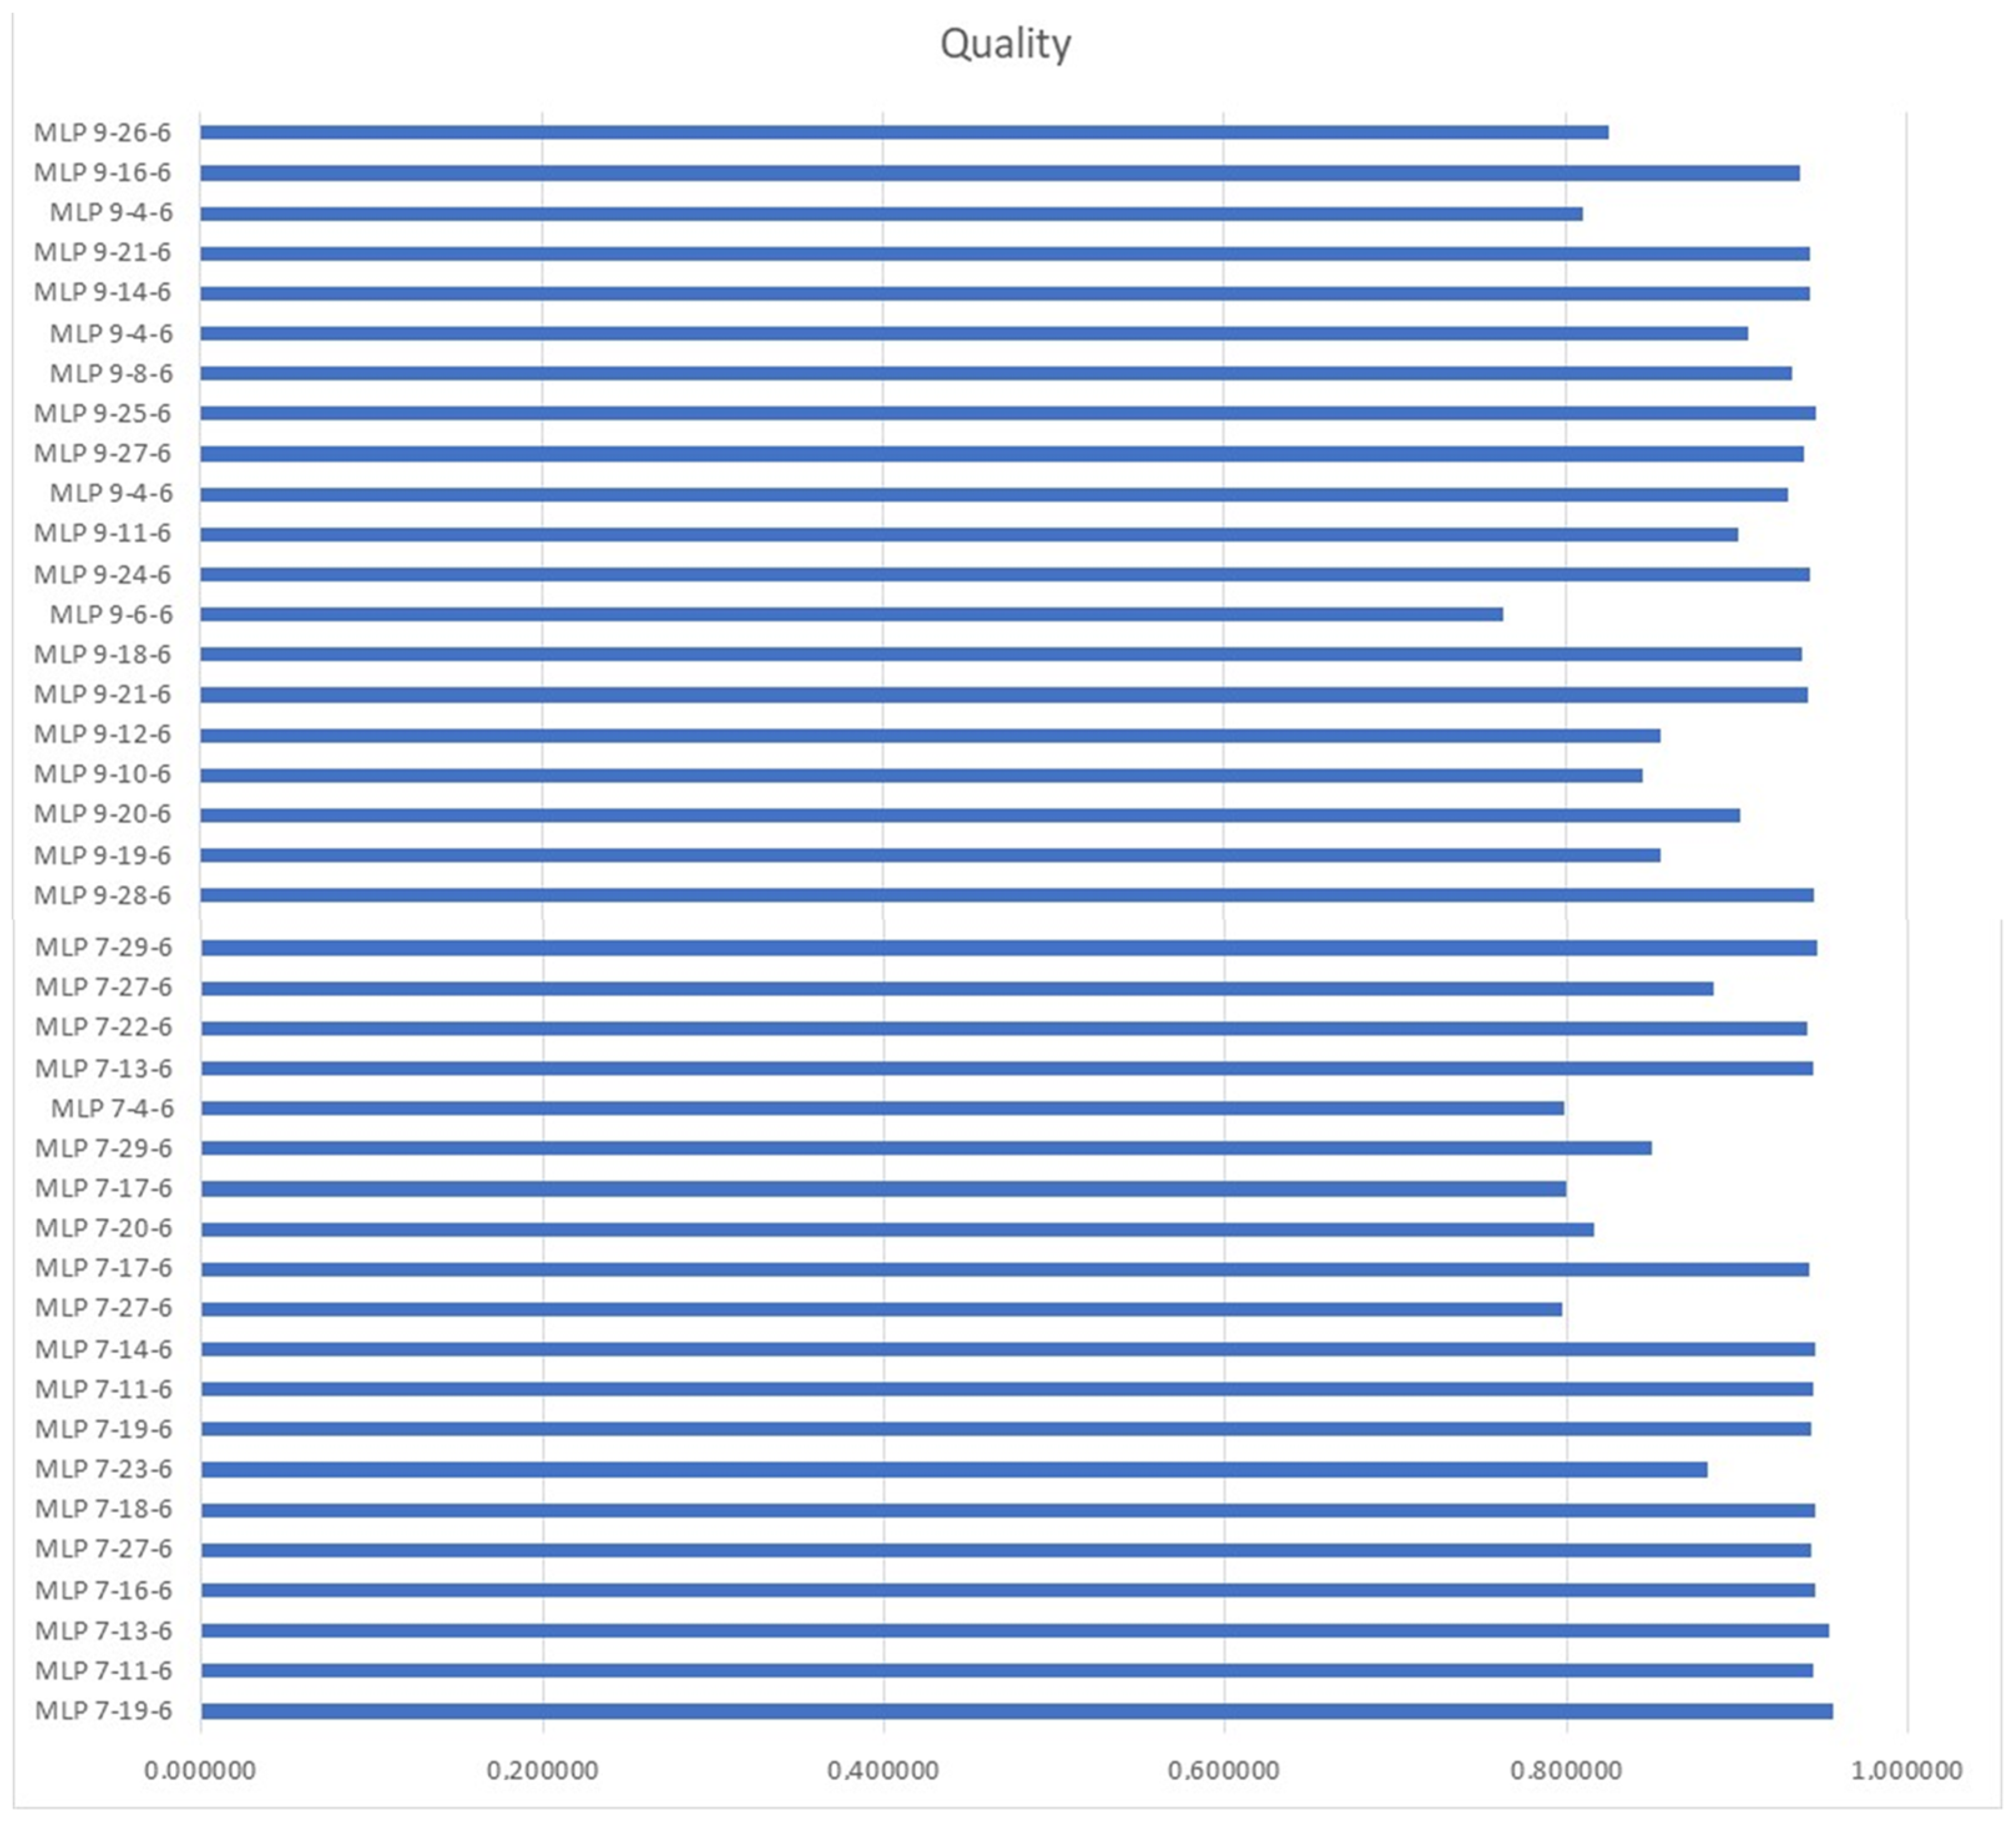
The best ANNs for seven input parameters are presented in Table 4 and Figure 7. The best quality, 0.956329,showed MLP 7-19-6.
Table 4.
The best neural networks for the seven input parameters.
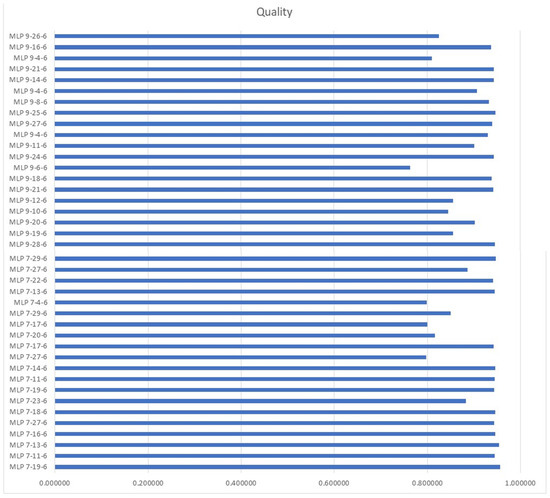
Figure 7.
Summary of the average quality of all MLP models (nine and seven inputs).
Omitting these two parameters showed no significant change in the quality of the MLP models built.
4. Discussion
In high-tech societies, it is becoming a priority to identify key research areas and key challenges related to the human-centric AI (HCAI) approach in the field of Industry 5.0 and the sustainable circular economy. This requires not only combining the skills and efforts of interdisciplinary teams but also taking into account various aspects from technical ones to social, legal, and sustainable ones. An area for such cooperation has been identified, among others, in additive manufacturing in the context of Industry 5.0.Sustainable production systems based on 3D printing can be better optimized with AI and will become a platform for connecting different levels of applications and integrating HCAI concepts [30,31,32,33]. The Human–Machine Collaboration Reference Framework for Additive Manufacturing for Industry 5.0 establishes a three-level product–economy–ecology model. The traditional applications of human–machine collaboration in additive manufacturing at the product, economic, and ecological levels include personalized product design, interactive manufacturing, human–machine interaction technology for the process chain, collaborative design, distributed manufacturing, and energy conservation and emission reduction. This promotes the transformation of additive manufacturing toward the Industry 5.0 paradigm, and better meets the personalized needs of users [34].The increasing need to reduce the negative impact of the manufacturing industry on the environment and humans has recently become a global challenge. Production is already strongly affected by sustainability issues, and production modeling and evaluation criteria need to be improved to keep up with these new challenges. This is made possible, among others, by sustainability assessment measures. It is still unclear whether the concepts of smart manufacturing and sustainability will interact constructively or destructively [35].The need to increase productivity without removing human workers from manufacturing imposes severe challenges on the economy. Many of the concerns that any manufacturer may have about Industry 5.0 seem to be unfounded from an economic and productivity perspective, as Industry 5.0 will create more jobs than it will take away [36].
4.1. Limitations of Previous Studies
The use of ANNs to simulate the harmful effects of 3D printing has been hampered to date by a number of research limitations. ANNs require large data sets for training, but collecting extensive, high-quality data on 3D printing parameters and particulate emissions can be difficult and expensive. The 3D printing process involves many interdependent variables (e.g., temperature, speed, material composition), making it difficult for neural networks to accurately capture all relevant interactions. ANNs can overfit to specific data sets, making them less generalizable. This limits their ability to accurately predict emissions for different printing materials, machines, or environmental conditions. ANNs are often viewed as “black boxes”, making it difficult to interpret how specific parameters affect particulate emissions and sustainability, making it difficult to understand and trust the model. While ANNs can predict outcomes based on historical data, they can have difficulty adapting in real time to dynamic changes in printing conditions or unexpected changes in material properties. Training complex neural networks requires significant computational power and time, which can be limiting, especially for small-scale or resource-constrained operations. ANNs can be very sensitive to small changes in input parameters, leading to instability in predictions, especially in the context of minor adjustments to 3D printing processes. The computational requirements of training large ANNs can themselves contribute to environmental impacts, potentially offsetting the sustainability benefits achieved with optimized 3D printing. ANNs trained on current 3D printing technologies may not generalize well to new or emerging 3D printing methods, limiting their long-term utility. Integrating neural network predictions into existing 3D printing processes can be technically challenging, requiring significant adjustments to both software and hardware, potentially hindering widespread adoption [37,38,39,40,41,42,43].
Neural networks in predicting 3D printing parameters face challenges in data collection and the management of the large and complex data sets that represent multiple variables (temperature, material type and print speed, layer thickness, and others) in 3D printing that affect particulate matter emissions. Not all users may want to collect and share these data. Ensuring the automatic, widespread collection of high-quality data is critical, as incomplete or noisy data can lead to inaccurate predictions and model overfitting. Interpretability can also be a challenge, making it difficult to understand how specific parameters contribute to emissions, complicating regulatory compliance and optimization. The computational complexity of the prediction of 3D printing parameters for reducing particulate matter emissions and enhancing sustainability, similarly totraining deep neural networks, makes it difficult to create real-time applications. However, their successful implementation could drastically reduce particulate matter emissions by fine-tuning printing processes, increasing environmental sustainability through cleaner production. This approach would also lead to resource efficiency, reducing material waste and energy consumption, thereby aligning with broader sustainability goals in manufacturing.
4.2. Directions for Further Studies
Future research should focus on developing data augmentation methods and improving data acquisition techniques, providing a robust and diverse data set covering a wide range of 3D printing parameters, materials, and conditions [44,45,46]. Research should prioritize the development of explainable neural networks that offer insight into the decision-making process, helping users to understand how specific 3D printing parameters affect particulate emissions and sustainability. Combining neural networks with physics-based models or other machine learning techniques can improve the accuracy of predictions by using both data-driven and theoretical approaches, addressing the complexities of 3D printing processes. Improving neural networks that can adapt in real time to changes in the printing environment or in material properties would be crucial for the dynamic control and optimization of 3D printing processes [47,48,49,50]. Exploring the application of transfer learning could help neural networks trained on specific 3D printing setups generalize to different machines, materials, and even new printing technologies. Further research could explore how neural networks can be optimized to reduce their computational demands, making their application more energy efficient and aligning their application with sustainability goals [51,52,53,54,55,56,57]. Research should aim to integrate neural networks with multi-scale modeling frameworks, capturing the influence of microscopic material properties on macroscopic emission outcomes, improving the overall accuracy of predictions. Future research should include methods to quantify and reduce uncertainty in neural network predictions, providing more reliable guidance for tuning 3D printing parameters. Research should also focus on integrating comprehensive sustainability metrics into neural network models, enabling predictions not only of particulate emissions but also broader environmental impacts such as energy consumption and material waste [54,55,56,57,58,59,60,61].
5. Conclusions
The incorporation of neural network modeling, particularly using MLP architectures such as MLP 9-28-6 and MLP 7-19-6, into 3D printing has demonstrated a high predictive accuracy, with quality metrics of 0.945697 and 0.956329, respectively. These models can optimize key parameters in 3D printing processes, leading to improved quality and efficiency. The ability to predict and control outcomes based on input parameters allows manufacturers to minimize waste, reduce energy consumption, and improve material utilization. The ability to predict emissions from 3D printing levels using developed neural networks will enable the precise optimization of production processes. This will make it possible to reduce their negative environmental impact, contributing to sustainable development. Implementing such technologies will allow for more efficient resource management and the minimization of emissions.
These advancements represent an important initial step toward reducing the environmental footprint of additive manufacturing, as the further optimization of processes will be necessary to achieve significant reductions in emissions and resource conservation. Future research will focus on refining these predictive models and exploring new variables to enhance the sustainability and efficiency of 3D printing technologies.Policymakers can use these insights to set industry standards that promote sustainability in additive manufacturing. Researchers can advance these models to further improve the environmental performance of 3D printing technologies. Further development of these neural network models could lead to breakthroughs in energy-efficient manufacturing processes, directly supporting global sustainability goals, such as those outlined in the United Nations’ Sustainable Development Goals (SDGs).Overall, this approach supports the sustainability of 3D printing by aligning economic goals with environmental responsibility.
Supplementary Materials
The following supporting information can be downloaded at: https://www.mdpi.com/article/10.3390/su16198616/s1.
Author Contributions
Conceptualization, E.D., F.O., D.M., A.S. and I.R.; methodology, E.D., F.O., D.M., A.S. and I.R.; software, E.D., F.O., D.M. and I.R.; validation, E.D., F.O., D.M., A.S. and I.R.; formal analysis, E.D., F.O., D.M., A.S. and I.R.; investigation, E.D. and F.O.; resources, E.D., F.O., D.M., A.S. and I.R.; data curation, D.M. and I.R.; writing—original draft preparation, E.D., F.O., D.M., A.S. and I.R.; writing—review and editing, E.D., F.O., D.M., A.S. and I.R.; visualization, E.D., F.O., D.M., A.S. and I.R.; supervision, E.D., F.O., D.M., A.S. and I.R.; project administration, E.D. and I.R.; funding acquisition, E.D. and I.R. All authors have read and agreed to the published version of the manuscript.
Funding
The work presented in this paper has been financed under a grant to maintain the research potential of Kazimierz Wielki University and grant No. 0613/SBAD/4888.
Institutional Review Board Statement
Not applicable.
Informed Consent Statement
Not applicable.
Data Availability Statement
The original contributions presented in the study are included in the Supplementary Materials, further inquiries can be directed to the corresponding author.
Conflicts of Interest
The authors declare no conflicts of interest.
References
- Campbell, I.; Bourell, D.; Gibson, I. Additive manufacturing: Rapid prototyping comes of age. Rapid Prototyp. J. 2012, 18, 255–258. [Google Scholar] [CrossRef]
- Gibson, I.; Rosen, D.W.; Stucker, B. Additive Manufacturing Technologies: 3D Printing, Rapid Prototyping, and Direct Digital Manufacturing; Springer: New York, NY, USA, 2014. [Google Scholar]
- Karayannis, P.; Petrakli, F.; Gkika, A.; Koumoulos, E. 3D-Printed Lab-on-a-Chip Diagnostic Systems—Developing a Safe-by-Design Manufacturing Approach. Micromachines 2019, 10, 825. [Google Scholar] [CrossRef] [PubMed]
- Saadi, M.A.S.R.; Maguire, A.; Pottackal, N.T.; Thakur, M.S.H.; Ikram, M.M.; Hart, A.J.; Ajayan, P.M.; Rahman, M.M. Direct ink writing: A 3D printing technology for diverse materials. Adv. Mater. 2022, 34, 2108855. [Google Scholar] [CrossRef]
- Siemiński, P.; Budzik, G. Techniki Przyrostowe. Druk, Drukarki 3D; Politechnika Warszawska: Warszawa, Poland, 2015; pp. 11–145. [Google Scholar]
- Bravia, L.; Murmura, F.; Santos, G. Additive Manufacturing: Possible Problems with Indoor Air Quality. Procedia Manuf. 2019, 41, 952–959. [Google Scholar] [CrossRef]
- Khaki, S.; Rio, M.; Marin, P. Monitoring Indoor Air Quality in Additive Manufacturing Environments. Procedia CIRP 2020, 90, 455–460. [Google Scholar] [CrossRef]
- Stabile, L.; Scungio, M.; Buonanno, G.; Arpino, F.; Ficco, G. Airborne Particle Emission of a Commercial 3D Printer: The Effect of Filament Material and Printing Temperature. Indoor Air 2016, 27, 398–408. [Google Scholar] [CrossRef] [PubMed]
- Azimi, P.; Zhao, D.; Pouzet, C.; Crain, N.E.; Stephens, B. Emissions of Ultrafine Particles and Volatile Organic Compounds from Commercially Available Desktop Three-Dimensional Printers with Multiple Filaments. Environ. Sci. Technol. 2016, 50, 1260–1268. [Google Scholar] [CrossRef]
- Gu, J.; Wensing, M.; Uhde, E.; Salthammer, T. Characterization of Particulate and Gaseous Pollutants Emitted during Operation of a Desktop 3D Printer. Environ. Int. 2019, 123, 476–485. [Google Scholar] [CrossRef]
- Stefaniak, A.B.; Le Bouf, R.F.; Yi, J.; Ham, J.; Nurkewicz, T.; Schwegler-Berry, D.E.; Chen, B.T.; Wells, J.R.; Duling, M.G.; Lawrence, R.B.; et al. Characterization of Chemical Contaminants Generated by a Desktop Fused Deposition Modeling 3-Dimensional Printer. J. Occup. Environ. Hyg. 2017, 14, 540–550. [Google Scholar] [CrossRef]
- Schönberger, R.; Bernau, M.; Lüllmann, H.; Janhäll, S.; Heringa, M.; Kim, Y.-S.; Li, D.; Geyer, H.; Göbel, J.; Möller, W. Emissions of Volatile Organic Compounds and Particulate Matter from Fused Deposition Modeling 3D Printers: Analysis and Exposure Assessment. Environ. Sci. Technol. 2021, 55, 8747–8755. [Google Scholar]
- Ntziachristos, L.; Drossinos, Y.; Crounse, J.D.; Elshout, R.; Weichenthal, S.; O’Neill, M.S.; Donahue, N.M. Particulate Matter Emissions from 3D Printing: A Study of the Contribution of Different Print Materials and Operating Conditions. J. Hazard. Mater. 2022, 423, 127257. [Google Scholar] [CrossRef]
- Misztal, T.J.; Addasi, O.; Albano, J.; Liu, Y. An Experimental Study on the Emission Dynamics in Fused Deposition Modelling (FDM) 3D Printing Process. In Proceedings of the Fluids Engineering Division Summer Meeting, Anaheim, CA, USA, 15–17 July 2024; Volume 88124, p. V001T01A021. [Google Scholar]
- Zhang, Q.; Wong, J.; Davis, A.; Black, M.; Weber, R. Characterization of Particle Emissions from Consumer Fused Deposition Modeling 3D Printers. Aerosol Sci. Technol. 2017, 51, 1275–1286. [Google Scholar] [CrossRef]
- Viitanen, A.; Kallonen, K.; Kukko, K.; Kanerva, T.; Saukko, E.; Hussein, T.; Hameri, K.; Saamanen, A. Technical Control of Nanoparticle Emissions from Desktop 3D Printing. Indoor Air 2021, 31, 1061–1071. [Google Scholar] [CrossRef] [PubMed]
- Min, K.; Li, Y.; Wang, D.; Chen, B.; Ma, M.; Hu, L.; Liu, Q.; Jiang, G. 3D Printing-Induced Fine Particle and Volatile Organic Compound Emission: An Emerging Health Risk. Environ. Sci. Technol. Lett. 2021, 8, 616–625. [Google Scholar] [CrossRef]
- Zhang, Q.; Pardo, M.; Rudich, Y.; Kaplan-Ashiri, I.; Wong, J.P.S.; Davis, A.Y.; Black, M.S.; Weber, R.J. Chemical Composition and Toxicity of Particles Emitted from a Consumer-Level 3D Printer Using Various Materials. Environ. Sci. Technol. 2019, 53, 12054–12061. [Google Scholar] [CrossRef]
- Lee, S.; Park, H.; Kim, H.; Lim, H.; Hwang, H.; Ryu, J.; Lee, J.; Kim, Y.; Jeong, J.; Park, S. Emission Characteristics and Health Risks of Particulate Matter and Volatile Organic Compounds from Fused Deposition Modeling 3D Printers with Various Filament Types. Environ. Sci. Technol. 2023, 57, 1550–1560. [Google Scholar]
- Yang, Y.; Xu, Z.; Zhang, X.; Wang, J.; Chen, L.; Shi, J.; Zheng, X.; Liu, S. Investigation of Particle and Gas Emissions from 3D Printers: Impacts of Printing Materials and Conditionson Air Quality. J. Hazard. Mater. 2023, 448, 131169. [Google Scholar]
- Wang, S.; Chen, Y.; Li, X.; Zhang, Y.; Xu, X.; Zhang, L. Recent Advances in Understanding the Health Impacts of Fine Particulate Matter (PM2.5) Exposure. Sci. Total Environ. 2020, 730, 139154. [Google Scholar] [CrossRef]
- Zhao, B.; Chen, R.; Kan, H.; Huang, W.; Xu, X.; Bai, Z. The Impact of Fine Particulate Matter (PM2.5) on Health: A Review of Recent Research. Environ. Pollut. 2021, 276, 116673. [Google Scholar] [CrossRef]
- Jiang, Y.; Li, Z.; Lin, H.; Zhang, J.; Zhang, M.; Liu, W. Fine Particulate Matter (PM2.5) and Cardiovascular Health: A Review of Current Evidence and Future Directions. Int. J. Environ. Res. Public Health 2022, 19, 2221. [Google Scholar] [CrossRef]
- Khaki, S.; Duffy, E.; Smetaon, A.F.; Morrin, A. Monitoring of particulate matter emissions from 3D printing activity in the homesetting. Sensors 2021, 21, 3247. [Google Scholar] [CrossRef] [PubMed]
- Ding, S.; Wan, M.P.; Ng, B.F. Dynamic analysis of particle emissions from FDM 3D printers through a comparative study of chamber and flow tunnel measurements. Environ. Sci. Technol. 2020, 54, 14568–14577. [Google Scholar] [CrossRef] [PubMed]
- Park, J.; Kwon, O.H.; Yoon, C.; Park, M. Estimates of particulate matter inhalation doses during three-dimensional printing: How many particles can penetrate into our body? Indoor Air 2021, 31, 392–404. [Google Scholar] [CrossRef] [PubMed]
- Zhang, J.; Chen, D.R.; Chen, S.C. A review of emission characteristics and control strategies for particles emitted from 3D fused deposition modeling (FDM) printing. Build. Environ. 2022, 221, 109348. [Google Scholar] [CrossRef]
- O’Connell, S.; Smith, G.; Jonnalagadda, S.; Wensel, S. The Use and Applications of 3D Printing Materials: A Survey. J. Manuf. Process. 2021, 64, 431–442. [Google Scholar] [CrossRef]
- Jang, J.; Ko, K.; Kim, S.; Kim, K.; Song, J. A Review of 3D Printing Technologies for Industrial Applications. Adv. Mater. Sci. Eng. 2020, 2020, 6018401. [Google Scholar]
- Zhang, Q.; Zhou, Y.; Zou, S. Convergence Guarantees for RMSProp and Adamin Generalized-smooth Non-convex Optimization with Affine Noise Variance. arXiv 2024, arXiv:2404.01436. [Google Scholar]
- Kwesi Wayo, D.D.; Irawan, S.; Satyanaga, A.; Kim, J. Data-Driven Fracture Morphology Prognosis from High Pressured Modified Proppants Based on Stochastic-Adam-RMSprop Optimizers; tf. NNR Study. Big Data Cogn. Comput. 2023, 7, 57. [Google Scholar] [CrossRef]
- Zou, F.; Shen, L.; Jie, Z.; Zhang, W.; Liu, W. A Sufficient Condition for Convergences of Adam and RMSProp. In Proceedings of the IEEE/CVF Conference on Computer Vision and Pattern Recognition (CVPR), LongBeach, CA, USA, 15–20 June 2019; pp. 11127–11135. [Google Scholar]
- Martini, B.; Bellisario, D.; Coletti, P. Human-Centered and Sustainable Artificial Intelligence in Industry 5.0: Challenges and Perspectives. Sustainability 2024, 16, 5448. [Google Scholar] [CrossRef]
- Rani, S.; Jining, D.; Shoukat, K.; Shoukat, M.U.; Nawaz, S.A. A Human–Machine Interaction Mechanism: Additive Manufacturing for Industry 5.0—Design and Management. Sustainability 2024, 16, 4158. [Google Scholar] [CrossRef]
- Abubakr, M.; Abbas, A.T.; Tomaz, I.; Soliman, M.S.; Luqman, M.; Hegab, H. Sustainable and Smart Manufacturing: An Integrated Approach. Sustainability 2020, 12, 2280. [Google Scholar] [CrossRef]
- Nahavandi, S. Industry 5.0—A Human-Centric Solution. Sustainability 2019, 11, 4371. [Google Scholar] [CrossRef]
- Zhou, L.; Miller, J.; Vezza, J.; Mayster, M.; Raffay, M.; Justice, Q.; Al Tamimi, Z.; Hansotte, G.; Sunkara, L.D.; Bernat, J. Additive Manufacturing: A Comprehensive Review. Sensors 2024, 24, 2668. [Google Scholar] [CrossRef] [PubMed]
- Rojek, I.; Mikołajewski, D.; Dostatni, E.; Kopowski, J. Specificity of 3D Printing and AI-Based Optimization of Medical Devices Using the Example of a Group of Exoskeletons. Appl. Sci. 2023, 13, 1060. [Google Scholar] [CrossRef]
- Vahed, R.; Zareie Rajani, H.R.; Milani, A.S. Can a Black-Box AI Replace Costly DMA Testing?—A Case Study on Prediction and Optimization of Dynamic Mechanical Properties of 3D Printed Acrylonitrile Butadiene Styrene. Materials 2022, 15, 2855. [Google Scholar] [CrossRef]
- Rehman, S.U.; Riaz, R.D.; Usman, M.; Kim, I.-H. Augmented Data-Driven Approach towards 3D Printed Concrete Mix Prediction. Appl. Sci. 2024, 14, 7231. [Google Scholar] [CrossRef]
- Bohušík, M.; Stenchlák, V.; Císar, M.; Bulej, V.; Kuric, I.; Dodok, T.; Bencel, A. Mechatronic Device Control by Artificial Intelligence. Sensors 2023, 23, 5872. [Google Scholar] [CrossRef]
- Huang, Z.; Shen, Y.; Li, J.; Fey, M.; Brecher, C. A Survey on AI-Driven Digital Twins in Industry 4.0: Smart Manufacturing and Advanced Robotics. Sensors 2021, 21, 6340. [Google Scholar] [CrossRef]
- Rojek, I.; Dostatni, E.; Mikołajewski, D.; Pawłowski, L.; Wegrzyn-Wolska, K. Modern approach to sustainable production in the context of Industry 4.0. Bull. Pol. Acad. Sci. Tech. Sci. 2022, 70, e143828. [Google Scholar] [CrossRef]
- Păvăloaia, V.-D.; Necula, S.-C. Artificial Intelligence as a Disruptive Technology—A Systematic Literature Review. Electronics 2023, 12, 1102. [Google Scholar] [CrossRef]
- See, A.R.; Advincula, W.D. Creating Tactile Educational Materials for the Visually Impaired and Blind Students Using AI Cloud Computing. Appl. Sci. 2021, 11, 7552. [Google Scholar] [CrossRef]
- Pazienza, A.; Monte, D. Introducing the Monitoring Equipment Mask Environment. Sensors 2022, 22, 6365. [Google Scholar] [CrossRef] [PubMed]
- Rojek, I. Models for Better Environmental Intelligent Management within Water Supply Systems. Water Resour. Manag. 2014, 28, 3875–3890. [Google Scholar] [CrossRef]
- Živković, M.; Žujović, M.; Milošević, J. Architectural 3D-Printed Structures Created Using Artificial Intelligence: A Review of Techniques and Applications. Appl. Sci. 2023, 13, 10671. [Google Scholar] [CrossRef]
- Zylka, L.; Burek, J.; Mazur, D. Diagnostic of peripheral longitudinal grinding by using acoustic emissionsignal. Adv. Prod. Eng. Manag. 2017, 12, 221–232. [Google Scholar]
- Li, C.; Bian, S.; Wu, T.; Donovan, R.P.; Li, B. Affordable Artificial Intelligence-Assisted Machine Supervision System for the Small and Medium-Sized Manufacturers. Sensors 2022, 22, 6246. [Google Scholar] [CrossRef]
- Rojek, I. Neural networks as prediction models for water intake in water supply system. In Artificial Intelligence and Soft Computing—ICAISC 2008; Lecture Notes in Computer Science; Rutkowski, L., Tadeusiewicz, R., Zadeh, L.A., Zurada, J.M., Eds.; Springer: Berlin/Heidelberg, Germany, 2008; Volume 5097, pp. 1109–1119. [Google Scholar]
- Gašparovič, M.; Jungová, P.; Tomášik, J.; Mriňáková, B.; Hirjak, D.; Timková, S.; Danišovič, Ľ.; Janek, M.; Bača, Ľ.; Peciar, P.; et al. Evolving Strategies and Materials for Scaffold Development in Regenerative Dentistry. Appl. Sci. 2024, 14, 2270. [Google Scholar] [CrossRef]
- Lubkowski, P.; Krygier, J.; Sondej, T.; Dobrowolski, A.P.; Apiecionek, L.; Znaniecki, W.; Oskwarek, P. Decision Support System Proposal for Medical Evacuations in Military Operations. Sensors 2023, 23, 5144. [Google Scholar] [CrossRef]
- Kaščák, Ľ.; Varga, J.; Bidulská, J.; Bidulský, R. Simulation of 316L Stainless Steel Produced the Laser Powder Bed Fusion Process. Materials 2023, 16, 7653. [Google Scholar] [CrossRef]
- Kaščák, Ľ.; Varga, J.; Bidulská, J.; Bidulský, R.; Manfredi, D. Weight Factor as a Parameter for Optimal Part Orientation in the L-PBF Printing Process Using Numerical Simulation. Materials 2024, 17, 3604. [Google Scholar] [CrossRef]
- Han, H.R. Hybrid Fiber Materials according to the Manufacturing Technology Methods and IOT Materials: A Systematic Review. Materials 2023, 16, 1351. [Google Scholar] [CrossRef] [PubMed]
- Jekateryńczuk, G.; Piotrowski, Z. A Survey of Sound Source Localization and Detection Methods and Their Applications. Sensors 2024, 24, 68. [Google Scholar] [CrossRef] [PubMed]
- Rojek, I.; Jagodziński, M. Hybrid Artificial Intelligence System in Constraint Based Scheduling of Integrated Manufacturing ERP Systems. In Hybrid Artificial Intelligent Systems; Lecture Notes in Computer Science; Corchado, E., Snášel, V., Abraham, A., Woźniak, M., Graña, M., Cho, S.B., Eds.; Springer: Berlin/Heidelberg, Germany, 2012; Volume 7209, pp. 229–240. [Google Scholar]
- Krajewski, D.; Oleksy, M.; Oliwa, R.; Bulanda, K.; Czech, K.; Mazur, D.; Masłowski, G. Methods for Enhancing the Electrical Properties of Epoxy Matrix Composites. Energies 2022, 15, 4562. [Google Scholar] [CrossRef]
- Martinek, R.; Ladrova, M.; Sidikova, M.; Jaros, R.; Behbehani, K.; Kahankova, R.; Kawala-Sterniuk, A. Advanced Bioelectrical Signal Processing Methods: Past, Present, and Future Approach—Part III: Other Biosignals. Sensors 2021, 21, 6064. [Google Scholar] [CrossRef]
- Režek Jambrak, A.; Nutrizio, M.; Djekić, I.; Pleslić, S.; Chemat, F. Internet of Nonthermal Food Processing Technologies (IoNTP): Food Industry 4.0 and Sustainability. Appl. Sci. 2021, 11, 686. [Google Scholar] [CrossRef]

Disclaimer/Publisher’s Note: The statements, opinions and data contained in all publications are solely those of the individual author(s) and contributor(s) and not of MDPI and/or the editor(s). MDPI and/or the editor(s) disclaim responsibility for any injury to people or property resulting from any ideas, methods, instructions or products referred to in the content. |
© 2024 by the authors. Licensee MDPI, Basel, Switzerland. This article is an open access article distributed under the terms and conditions of the Creative Commons Attribution (CC BY) license (https://creativecommons.org/licenses/by/4.0/).