Abstract
Subtropical moss peatlands have important ecological functions, and their protection and restoration are urgent. The lack of understanding of the biogeochemical changes in subtropical moss peatlands after human disturbance, particularly regarding their underground ecological changes, limits the efforts towards their protection and restoration. In this study, typical subtropical moss peatlands and the Cryptomeria swamp forest (CSF) formed by long-term (more than 20 years) drainage and afforestation in the Yunnan–Guizhou Plateau of China were selected as the research sites. Moreover, 16S rRNA high-throughput sequencing technology was used to study the differences in soil bacterial community diversity and composition among a natural Sphagnum fen (SF), Polytrichum bog (PB), and CSF to explore the effects of drainage and afforestation on different types of moss peatlands and its mechanism combined with soil physicochemical properties. Results showed that (1) drainage and afforestation significantly reduced the α diversity of soil bacterial communities in SF while significantly increasing the α diversity of soil bacterial communities in PB. Soil bacterial communities of SF had the highest α diversity and had many unique species or groups at different taxonomic levels. (2) The impact of drainage and afforestation on the soil bacterial community composition in SF was significantly higher than that in PB. Drainage and afforestation caused significant changes in the composition and relative abundance of dominant groups of soil bacteria in SF at different taxonomic levels, such as significantly reducing the relative abundance of Proteobacteria, significantly increasing the relative abundance of Acidobacteria, and significantly reducing the ratio of Proteobacteria to Acidobacteria, but did not have a significant impact on the corresponding indicators of PB. The changes in the ratio of Proteobacteria to Acidobacteria may reflect changes in the trophic conditions of peatlands. (3) Soil moisture content, available phosphorus content, and pH were key driving factors for changes in soil bacterial community composition and diversity, which should be paid attention to in the restoration of moss peatlands. This study provides insights into the protection and restoration of subtropical moss peatlands.
1. Introduction
Subtropical moss peatlands have important ecological functions, such as biodiversity maintenance, carbon storage, and water conservation, and are characterized by their rarity [1]. Microtopography affects the formation and characteristics of moss peatlands, and different microtopography forms different types of moss peatlands (bogs and fens), which are usually occupied by different dominant moss plants [2,3]. For example, in the Yunnan–Guizhou Plateau of China, the typical subtropical moss peatlands form ombrotrophic Polytrichum bogs (PBs) in the plateau area and minerotrophic Sphagnum fens (SFs) in the low-lying area. Driven by economic interests, moss peatlands all over the world are faced with the disturbance threats of human activities such as agricultural reclamation [4], drainage and afforestation [5], peat mining [6,7], and fire [8]. Drainage and afforestation pose the greatest threat to the patchy moss peatlands in the subtropical region, which greatly reduces their area and causes them to lose their ecological function. Therefore, the protection and restoration of subtropical moss peatlands are urgently needed [9]. Studying the differential effects and mechanisms of drainage and afforestation on different types of subtropical moss peatlands can provide insights for their protection and restoration.
Soil microorganisms are important drivers of element cycling in peatland ecosystems [10]. Studies have found that the most common bacteria in peat are representatives of Proteobacteria and Acidobacteria, which have good adaptability to acidic environments and exhibit a variety of different lifestyles [10,11,12]. Other important bacterial groups typically found in peatlands include Actinobacteria, Verrucomicrobia, Planctomycetes, Chloroflexi, Firmicutes, and Chlamydiae. The study of peatlands in different climate zones has found that although there are common dominant groups in different peatlands, the correlation between microbial communities and environmental factors is different. In primitive peatlands, the composition and function of soil microbial communities have been shown to vary according to the hydrological conditions, nutritional status, and vegetation composition of a site [10]. For example, the relative abundances of Acidobacteria and Proteobacteria showed opposite changes with changes in pH and substrate availability [12,13,14]. For example, the water table has been shown to affect the structure of peatland microbial communities or their α diversity [15]. Other environmental factors, such as nitrogen content [16], organic matter content, moisture, and phosphorus [17], have also been shown to have an impact on the microbial communities of peatland ecosystems. Compared with high-latitude and tropical peatlands, there are few studies related to subtropical moss peatlands due to their rarity [18,19,20]. A few studies have reported that the microbial community of Sphagnum peatlands is affected by microhabitats, and it has been found that groundwater level and total nitrogen content have significant effects on the soil bacterial community of Sphagnum peatlands [15]. There are few reports on the differences in soil microbial structure and function of different types of subtropical moss peatlands (bogs and fens) and their influencing factors.
Studies of northern peatlands have shown that fens have greater microbial diversity due to additional nutrient input from groundwater, higher pH, and different quality litter compared to nutrient-poor acidic bogs, which mainly obtain nutrients from precipitation [11,21,22,23,24]. Urbanová and Bárta [25] studied the effects of long-term drainage on different types of peatlands (bogs, fens, and swamps) and found that fens and swamps were more affected, while bogs were less affected, and the soil microbial structure and function of the three types of peatlands became similar after long-term drainage and suggested that the subsurface microbial community in the drainage sites seems to be driven primarily by the biogeochemical characteristics of peat rather than plant community composition. Compared with long-term drainage disturbance, vegetation is more homogeneous, and long-term drainage and afforestation will make the soil microbial community structure and function of affected bogs and fens more similar to each other [5]. Are there significant differences in the soil microbial community structure and function between SFs and PBs in subtropical regions? Compared to which type of pristine moss peatland does the soil microbial community in swamp forest formed by long-term drainage and afforestation show greater changes? What are the biogeochemical mechanisms driving changes in the soil microbial community? The answers to these questions can enhance our understanding of the underground ecological characteristics of different types of moss peatlands in subtropical regions. They can also help clarify which major soil microbial groups in specific moss peatlands undergo significant changes after drainage and afforestation and the mechanisms involved, which may indicate the onset or extent of future restoration.
This study selected typical subtropical moss peatlands and the Cryptomeria swamp forest (CSF) formed by long-term drainage and afforestation in the Yunnan–Guizhou Plateau of China as the research objects. By collecting the topsoil (0–10 cm) that is easily disturbed or strongly affected by climate change, 16S rRNA gene Illumina sequencing technology was used to study the differences in soil bacterial community composition and structure between natural SF, PB, and CSF habitats and combined with soil physicochemical properties to explore the important environmental factors affecting the soil bacterial community. We hypothesized that (1) SF has a higher diversity of the soil bacterial community than PB. (2) Compared with PB, the differences in soil bacterial communities between CSF and SF were greater, and this difference was caused by the differences in soil water and nutrients between the different types of peatlands.
2. Materials and Methods
2.1. Study Area
The study area is in the Niangniangshan National Wetland Park Conservation area in China. The wetland is located at the junction of Yunnan–Guizhou Province with geographical coordinates of 104°45′24″ E–104°51′41″ E and 26°04′25″ N–26°8′24″ N. It is a typical subtropical karst mountain moss peatland wetlands in the Yunnan–Guizhou Plateau. Moss peatlands are developed in the waterlogged areas of basalt formations on subalpine platforms and have important functions such as water conservation, biodiversity protection, climate regulation, and carbon sink. Before the 1990s, a large area of moss peatlands was distributed in the wetland, and different topographic environments formed different moss peatlands, including ombrotrophic PB in the plateau area and minerotrophic SF in the low-lying area. However, in the late 1990s, large-scale drainage and construction of the Cryptomeria fortuneana forest resulted in the disappearance of a large area of moss peatlands. The vegetation was mainly swamp forest, and the moss peatlands and herbaceous peatlands were mosaic landscapes. The ecological function of wetlands declined significantly, and the diversity and heterogeneity of vegetation and the environment decreased.
The climate of the area where the wetland is located is cool and humid, which is a typical subtropical monsoon climate. The extreme maximum temperature is 36.7 °C, the extreme minimum temperature is −7.9 °C, and the annual average temperature is 15.2 °C. The average annual sunshine duration is 1615 h, and the percentage of sunshine is 37%. The average annual rainfall is 1413.6 mm, and the average evaporation is 1526.7 mm. The annual average relative humidity is 76%, the maximum relative humidity is 100%, and the minimum relative humidity is 2%. The annual average frost-free period is 271 days. The main soil types in the wetland conservation area are peat soil and scrub meadow soil [26].
2.2. Site Setting and Sampling
Typical SF, PB, and CSF patches in wetland conservation areas were selected as sites. SF and PB patches were used as pristine control sites. The CSF patch served as the site representing these two types of moss peatlands affected by drainage and afforestation. The dominant species in the SF plant community are Sphagnum palustre, Carex nemostachys, Oenanthe linearis, Neanotis hirsuta, and Isachne globosa. The dominant species in the PB plant community are Polytrichum commune, Pteridium revolutum, Gaultheria hookeri, Smilax china, and Cyanotis vaga. The CSF was a pure artificial forest with an average density of 1283.33 trees/hm2, an average diameter at breast height of 10.44 cm, an average tree height of 8.68 m, and an average canopy density of 85%. There were sparse shrubs and herbs under the forest.
Three 1 m × 1 m plots were randomly set near the center of the SF and PB patches. In each plot, 0–10 cm of soil was collected by using the random 3-point sampling method to form a mixed repeat soil sample. Three 20 m × 30 m plots were set in CSF; one plot was set in the high and flat area with the terrain similar to that of SF, one plot was set in the low-lying area with the terrain similar to that of PB, and one plot was set in the transition zone between the two. Each plot was kept at least 10 m away from the vegetation boundary between swamp forest and moss peatlands to avoid edge effects. The random 3-point sampling method was used to collect 0–10 cm of soil to form a mixed repeat soil sample. Therefore, three repeated soil samples were collected for each of the three types of sites. Plant roots, litter, and debris were removed immediately and stored under appropriate conditions. Each repeat soil sample was divided into 2 parts: one fresh soil sample was stored at 4 °C for soil physicochemical property analysis, and the other was stored at −80 °C for DNA analysis. Samples for the determination of soil bulk density and water content were collected simultaneously with the sampling in a cutting ring (100 cm3 volume) [27].
2.3. Determination of Soil Physicochemical Properties
The fresh soil sample was divided into two parts. One fresh soil sample was used for the determination of soil ammonium nitrogen content (NH4+-N) and nitrate nitrogen content (NO3−-N), and the other was naturally air-dried and screened through a 2 mm sieve for the determination of other indices [28]. Soil weight water content (SWW) and soil bulk density (SBD, g/cm3) were measured by the oven at 70 °C [25]. SWW refers to the ratio of the weight of water in the soil to the weight of the corresponding solid substances. Soil pH was determined by a glass electrode pH meter (STARTER 300, Ohaus, Parsippany, NJ, USA) with a soil–water ratio of 1:5 [29]. The soil total carbon content (TC) was determined by an elemental analyzer (Vario TOC cube, Elementar, Hanau, Germany) [30]. The soil total nitrogen content (TN) was measured by the Kjeldahl method [27]. NH4+-N and NO3−-N in soil were extracted by 1 mol/L KCl (soil–water ratio 1:10), and the extract was determined by a continuous flow analyzer (AA3, SEAL Analytical, Aachen, German) [31]. The content of available phosphorus (AP) in soil was determined by the molybdate blue colorimetric method after leaching with sodium bicarbonate [30].
2.4. High-Throughput Sequencing
2.4.1. Soil Bacterial DNA Extraction and PCR Amplification
The total DNA of soil samples was extracted using the Power soil DNA Isolation Kit (MOBIO, Saint Paul, MN, USA), with 9 DNA samples for 9 mixed soil samples. Nanodrop 2000c was used to detect the quality of DNA, followed by PCR amplification of the bacterial 16S rRNA gene. The amplification primers were 338F (5′-ACTCCTACGGGAGGCAGCA-3′) and 806R (5′-GACTACHVGGGTWTCTAAT-3′) [28]. The PCR conditions were as follows: predenaturation at 98 °C for 3 min; denaturation for 30 s at 98 °C; annealing at 50 °C for 30 s; 72 °C extension for 30 s; 27 cycles; maintenance at 72 °C for 5 min; and storage at 4 °C. The electrophoretic PCR products were gelled and purified using an AxyPrep DNA gel recovery kit (AXYGEN, Silicon Valley, CA, USA). The recovered and purified PCR products were then quantified using the QuantiFluorTM-ST blue fluorescence quantification system (Promega, Madison, WI, USA). According to the quantitative results and sequencing quantity requirements, PCR products were used to construct a sequencing library. The constructed library was sequenced on the IlluminaPE300 sequencing platform (Illumina, San Diego, CA, USA).
2.4.2. Data Processing
Bacterial 16S rRNA gene sequences were analyzed using the Quantitative Insights Into Microbial Ecology (QIIME 1.9.1 version) platform. First, the bidirectional sequences were spliced, the sequences with matching errors were checked, the chimeric sequences were removed, and high-quality sequences were obtained for the next analysis. According to UCLUST, all gene sequences were clustered according to 97% similarity, singleton OTUs were removed, and a representative OTU sequence was obtained. The species information was obtained by comparing the representative OTU sequences with the RDP reference database.
2.5. Statistical Analysis
Nonmetric multidimensional scale analysis (NMDS) was conducted based on the relative abundance of all groups at the phylum, class, family, and genus levels of soil bacteria, and the significance of differences in soil bacterial communities among different types of vegetation was tested by ANOSIM based on Bray–Curtis distance. A one-way ANOVA was used to analyze the significance of the distance difference between any two of them, and the LSD method (least significant difference method) was used for the post-test. The significance of differences in soil physicochemical properties, the α diversity indexes of the soil bacterial community, and the relative abundances of the top ten phyla, classes, families, and genera in the soil bacterial community among different vegetation types were analyzed by one-way ANOVA, and the LSD method was used for the post-test. The indicator species in different types of vegetation were identified via linear discriminant analysis effect size (LEfSe) [32]. Based on the relative abundance data of major groups of phyla, class, family, and genus in soil bacterial communities of different vegetation types, redundancy analysis (RDA) was used to explore the key soil factors affecting the composition differentiation of major groups at different classification levels of soil bacterial communities. The significance of soil factors was determined by the Monte Carlo test. Pearson correlation was used to analyze the correlation between soil factors and the α diversity index of soil bacterial communities and the relative abundance of major groups at the phylum, class, family, and genus levels. All statistical analysis and mapping were completed using R v4.3.1 [33]. Among them, Adonis, RDA, and Monte Carlo permutation tests were all completed using the package “vegan”(version 2.6.4) [34], one-way ANOVA and LSD post hoc tests were completed using the package “agricola”(version 1.3.6) [35], Pearson correlation analysis was completed using the program package “corrplot”(version 0.92) [36], and all plots were completed using the package “ggplot2”(version 3.4.3) [37].
3. Results
3.1. Soil Physicochemical Properties
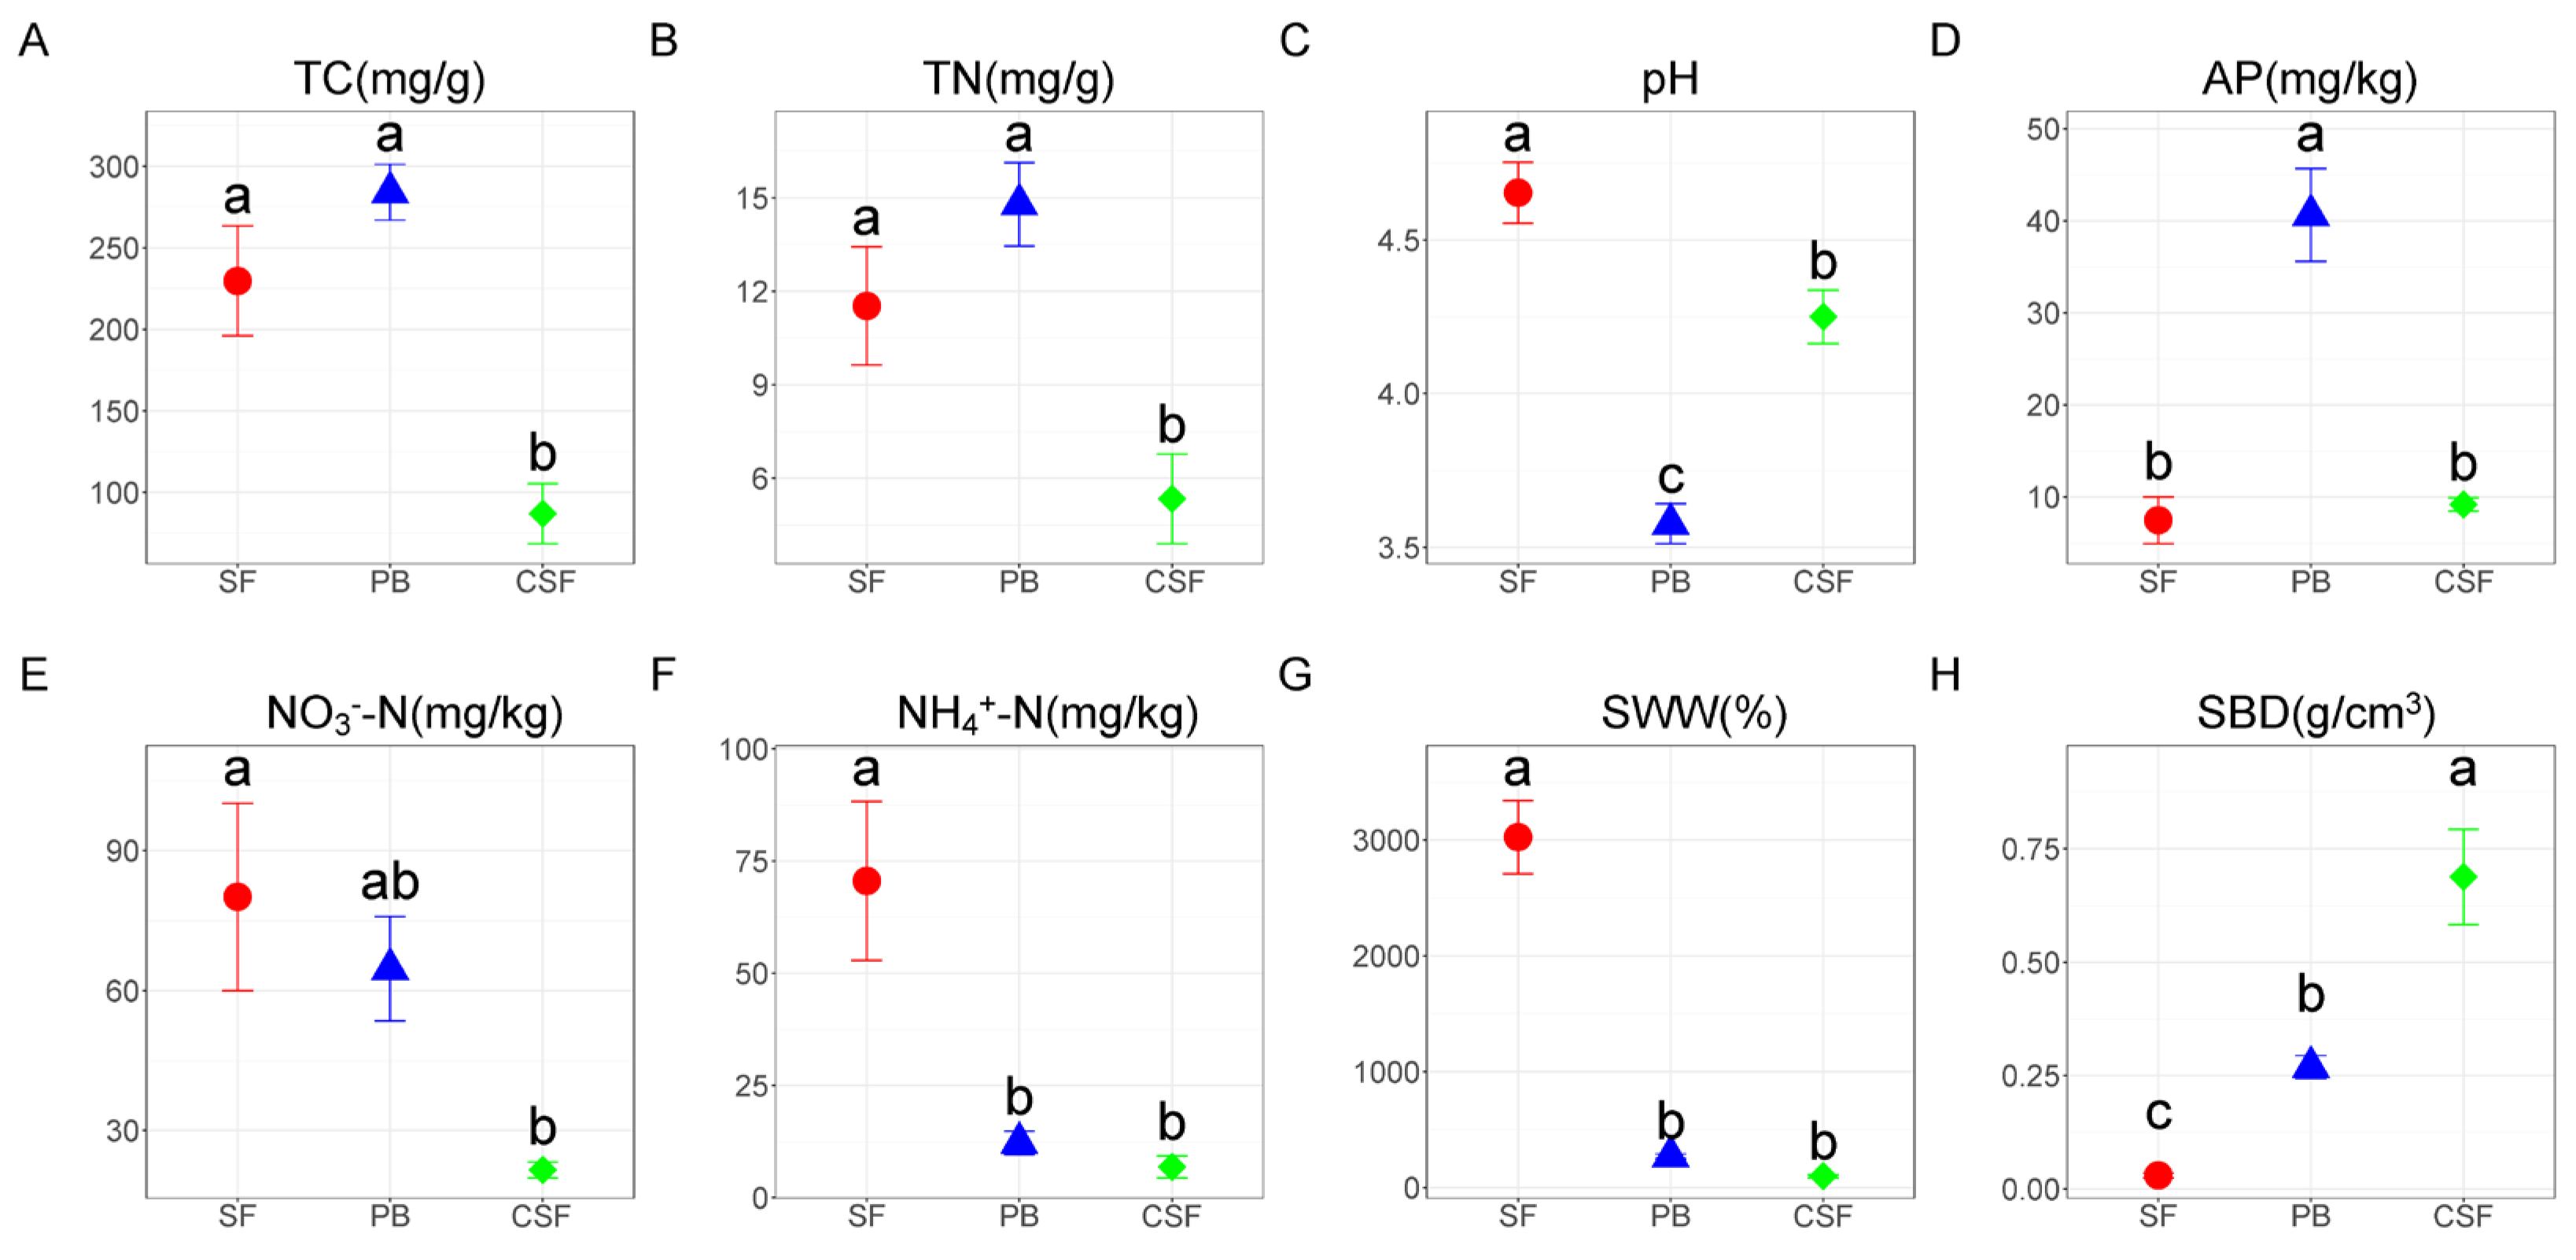
There was no significant difference in TC and TN between SF and PB, and the values in CSF were significantly lower than those in SF and PB (Figure 1A,B). Soil pH was all acidic, and the values in SF were significantly higher than those in PB, and the values in CSF were significantly lower than those in SF but significantly higher than those in PB (Figure 1C). AP in SF was significantly lower than that in PB, and that in CSF was significantly lower than that in PB, but there was no significant difference from that in SF (Figure 1D). NO3−-N and NH4+-N were the highest in SF, and NH4+-N was significantly higher than that in PB, but there was no significant difference in NO3−-N (Figure 1E,F). NO3−-N and NH4+-N in CSF were significantly lower than those in SF, but there was no significant difference between them and the values in PB. SWW in SF was significantly higher than that in PB, and its value in CSF was significantly lower than that in SF but had no significant difference from that in PB (Figure 1G). SBD in SF was significantly lower than that in PB, and its value in CSF was significantly higher than that in SF and PB (Figure 1H).
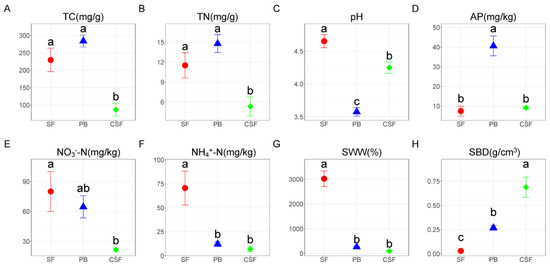
Figure 1.
Comparison of soil physicochemical properties among Sphagnum fen (SF), Polytrichum bog (PB), and Cryptomeria swamp forest (CSF). TC—soil total carbon content (A); TN—soil total nitrogen content (B); pH—soil pH (C); AP—soil available phosphorus content (D); NO3−-N—soil nitrate nitrogen content (E); NH4+-N—soil ammonium nitrogen content (F); SWW—soil weight water content (G); SBD—soil bulk density (H). Error bars indicate the standard errors (n = 3). Lowercase letters (a, b, c) represent significantly different values of the studied parameter with a 95% confidence interval, confirmed by ANOVA with subsequent LSD comparisons.
3.2. Soil Bacterial Community Diversity Indexes
The indices, Sobs, Chao, and ACE, which reflect the richness of the soil bacterial community, have the same rule: the value in SF is significantly higher than that in PB, and the value in CSF is significantly lower than that in SF but is significantly higher than that in PB (Figure 2A–C). The indices reflecting bacterial community diversity included Shannon, Simpson, and PD indices. The Shannon index in SF was significantly higher than that in PB, while the Shannon index in CSF was not significantly different from that in SF but was significantly higher than that in PB (Figure 2D). There was no significant difference in the Simpson index between SF, PB, and CSF (Figure 2E). Pd in SF was significantly higher than that in PB, and Pd in CSF was significantly lower than that in SF but significantly higher than that in PB (Figure 2F). The indices reflecting community evenness included Shannoneven and Simpsoneven indices, and Shannoneven in CSF was significantly higher than that in PB (Figure 2H,I). The index reflecting the community coverage was Coverage, and there was no significant difference in the value of SF, PB, and CSF, and the values were all close to 1 (Figure 2G).
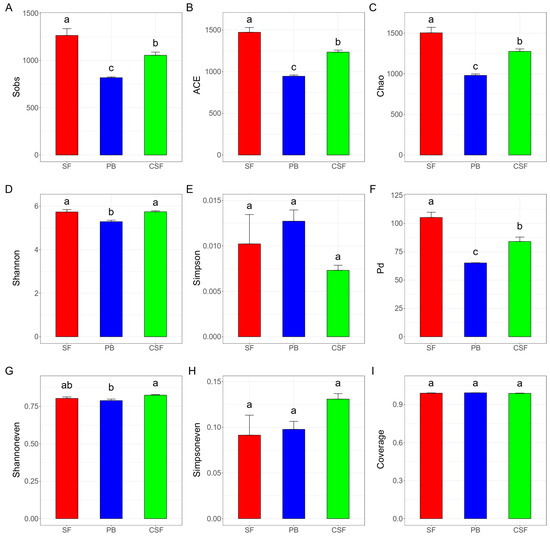
Figure 2.
Comparison of soil bacterial α diversity among Sphagnum fen (SF), Polytrichum bog (PB), and Cryptomeria swamp forest (CSF). Sobs—the observed richness (A); ACE—the ACE estimator (B); Chao—the Chao1 estimator (C); Shannon—the Shannon diversity index (D); Simpson—the Simpson diversity index (E); Pd—phylogenetic diversity (F); Shannoneven—a Shannon index-based measure of evenness (G); Simpsoneven—a Simpson index-based measure of evenness (H); Coverage—the Good’s coverage (I). Sobs, ACE, and Chao reflecting on community richness; Shannon, Simpson, and Pd reflecting on community diversity; Shannoneven and Simpsoneven reflecting on community evenness; and Coverage reflecting on community coverage. Error bars indicate the standard errors (n = 3). Lowercase letters (a, b, c) represent significantly different values of the studied parameter with a 95% confidence interval, confirmed by ANOVA with subsequent LSD comparisons.
3.3. Correlation between Soil Physicochemical Properties and Soil Bacterial Community Diversity Indexes
Sobs, Chao, and ACE were all significantly positively correlated with soil pH and SWW and significantly negatively correlated with AP (Table 1). The Shannon index was positively correlated with soil pH but significantly negatively correlated with TC, TN, and AP. Pd was significantly positively correlated with soil pH and SWW and significantly negatively correlated with AP. The Simpson index was significantly positively correlated with TC, TN, and AP. The Shannoneven index had a significant negative correlation with TC and TN, while the Simpsoneven index had a significant negative correlation with TC and NO3−-N.

Table 1.
Pearson correlation analysis between α diversity of soil bacteria and soil physicochemical properties.
3.4. Soil Bacterial Community β Diversity
The results of NMDS analysis based on Bray–Curtis showed that the soil bacterial communities at the genus, family, class, and phylum levels showed clear aggregation types in SF, PB, and CSF (Figure 3A,D,H,K). At the class and phylum levels, the distance between SF and PB was not significantly different from that between SF and CSF, both of which were significantly higher than that between PB and CSF (Figure 3C,F). At the genus and family levels, the Bray–Curtis distance between the soil bacterial communities of SF and PB was the largest, which was significantly greater than the distance between SF and CSF, and the distance between PB and CSF and the distance between CSF and SF were significantly higher than the distance between CSF and PB (Figure 3I,L).
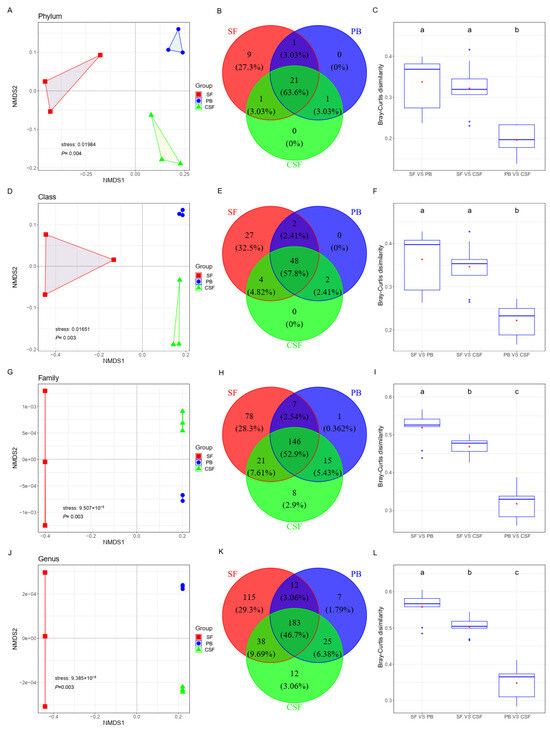
Figure 3.
Variations of soil bacterial composition among Sphagnum fen (SF), Polytrichum bog (PB), and Cryptomeria swamp forest (CSF) at phylum (A–C), class (D–F), family (G–I), and genus levels (J–L). (1) Comparison of soil bacterial composition among different types of sites by NMDS based on Bray–Curtis distance (A,D,G,J). (2) The number of shared and unique taxa across different types of sites (B,E,H,K). (3) Comparison of the dissimilarities of soil bacterial communities between different types of sites (C,F,I,L). Each box plot represents the maximum, minimum, 75th, and 25th quartiles, respectively; the line of each box plot represents the median, and the red point of each box plot represents the mean (n = 9). Lowercase letters (a, b, c) represent significantly different values of the studied parameter with a 95% confidence interval, confirmed by ANOVA with subsequent LSD comparisons.
3.5. Indicator Groups of Soil Bacterial Communities
A total of 33 phyla were found in the soil bacterial community of SF, PB, and CSF, of which 21 phyla (63.6%) were found to be common in all three; 22 phyla (66.63%) were found to be common in two of the three; 9 phyla (32.5%) were unique to SF; and neither PB nor CSF had unique phyla (Figure 3B).
A total of 83 classes were found in the soil bacterial communities of SF, PB, and CSF, among which 48 classes (52.9%) were found to be common in the three. There were 50 classes (60.21%) common in SF and PB; 52 classes (62.62%) common in CSF and SF; 50 classes (60.21%) common in CSF and PB; 27 classes (32.5%) unique to SF; and neither PB nor CSF had a unique class (Figure 3E).
A total of 276 families were found in the soil bacterial communities of SF, PB, and CSF, among which 146 families (52.9%) were found to be common in the three sites. There were 153 families (55.44%) common in SF and PB, 167 families (60.51%) common in CSF and SF, 161 families (58.33%) common in CSF and PB, 78 families (28.3%) unique to SF, 1 family (0.362%) unique to PB, and 8 families (2.9%) unique to CSF (Figure 3I).
A total of 392 genera were found in the soil bacterial communities of SF, PB, and CSF, among which 183 genera (46.7% of the total genera) were found to be common in the three (Figure 3C,F). There were 195 genera (49.76%) common in SF and PB, 221 genera (56.39%) common in CSF and SF, 208 genera (53.08%) common in CSF and PB, 115 genera (29.3%) unique to SF, 7 genera (1.79%) unique to PB, and 12 genera (3.06%) unique to CSF (Figure 3L).
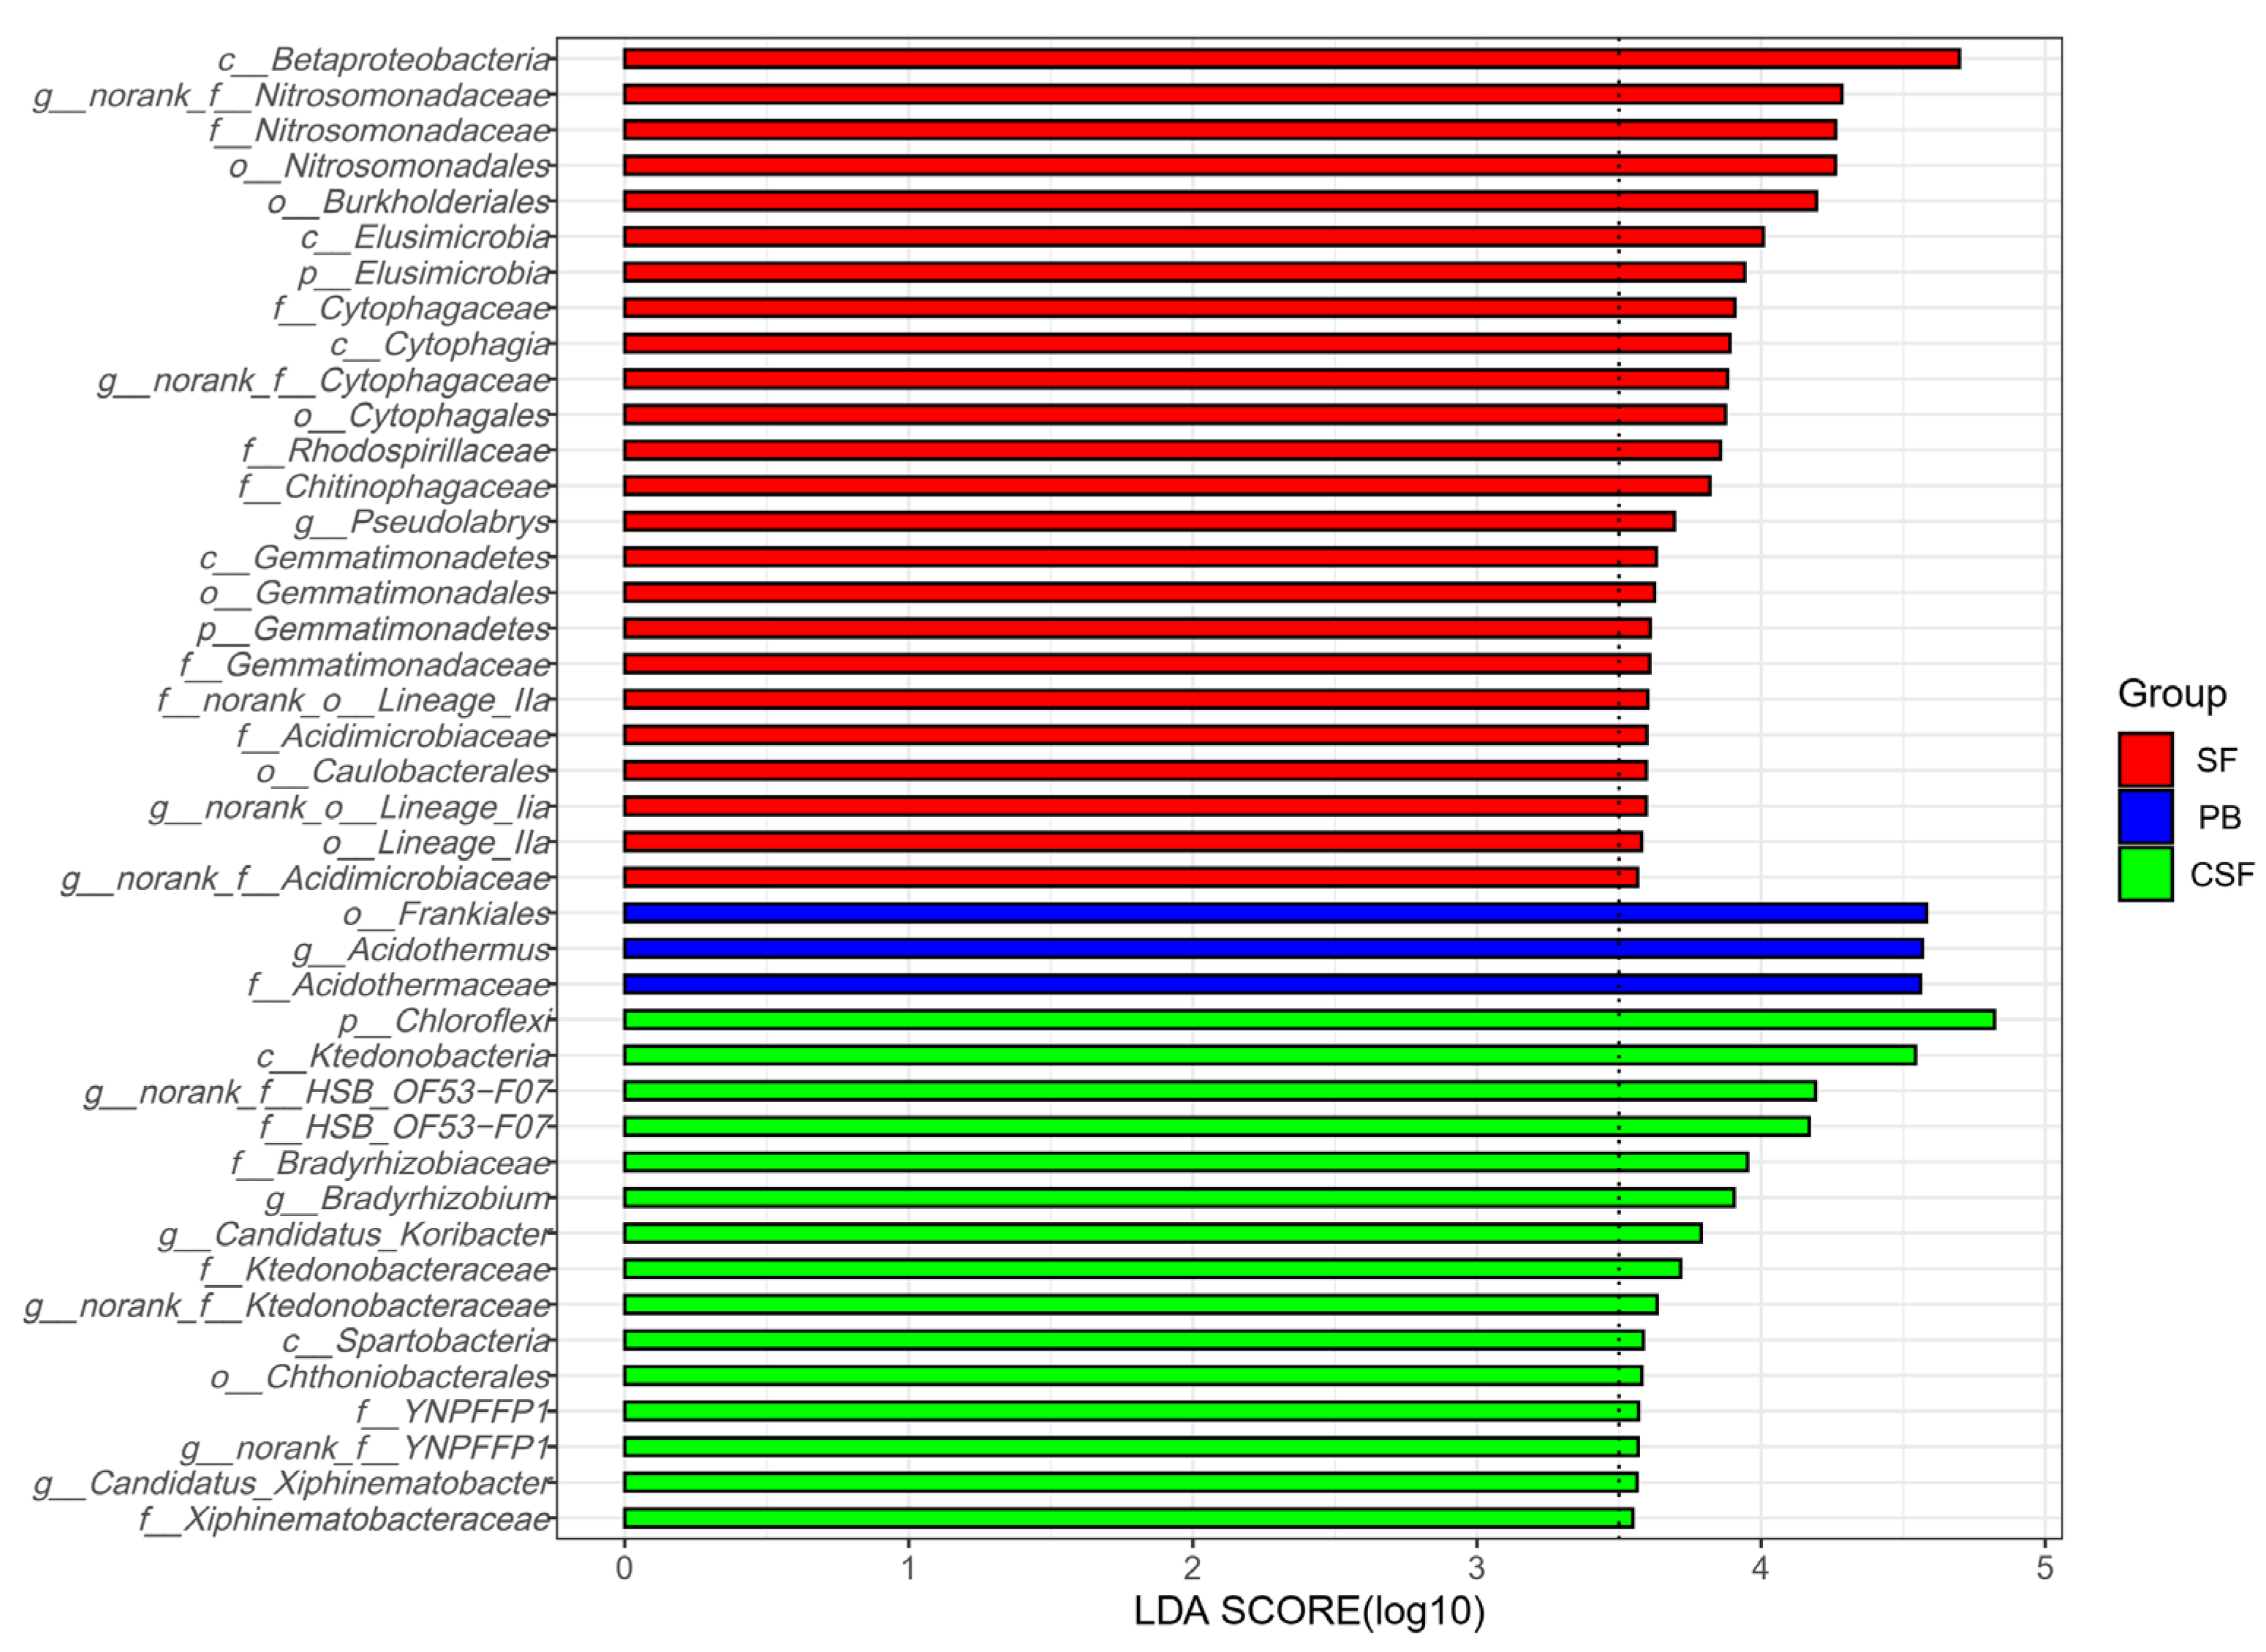
LEfSe analysis identified the indicator groups of soil bacterial communities for three types of sites (Figure 4). Twenty-four indicator species of SF were identified, which belong to two phyla, four classes, six orders, seven families, and five genera. Three indicator species of PB were identified, which belong to one order, one family, and one genus. Fifteen indicator species in CSF were identified, which belonged to one phylum, two classes, one order, five families, and six genera.

Figure 4.
Indicator group analysis of bacterial communities in Sphagnum fen (SF), Polytrichum bog (PB), and Cryptomeria swamp forest (CSF) with LDA SCORE > 3.5.
3.6. Composition of the Main Groups of Soil Bacterial Communities at Different Taxonomic Levels
Figure 5 reveals the differences in the relative abundance and ranking of major groups of soil bacterial communities at different taxonomic levels among the three types of sites. The top ten phyla with relative abundance ranking for each of the three types of sites were reserved, with a total of 14 phyla (Figure 5A). There were significant differences in the ranking and relative abundance of these phyla among the three types of sites. The relative abundances of Acidobacteria, Chloroflexi, Actinobacteria, and Firmicutes in CSF were significantly higher than those in SF, while the relative abundances of Proteobacteria, Bacteroidetes, Verrucomibia, Elusimicrobia, Parkubacteria, and Cyanobacteria in CSF were significantly lower than those in SF. The relative abundance of Chloroflexi in CSF was significantly higher than that in PB, while the relative abundances of unclassifiedd_k_nomank and Chlamydiae in CSF were significantly lower than that in PB. These microbial groups should be given priority attention in the restoration of moss peatlands affected by drainage and afforestation.
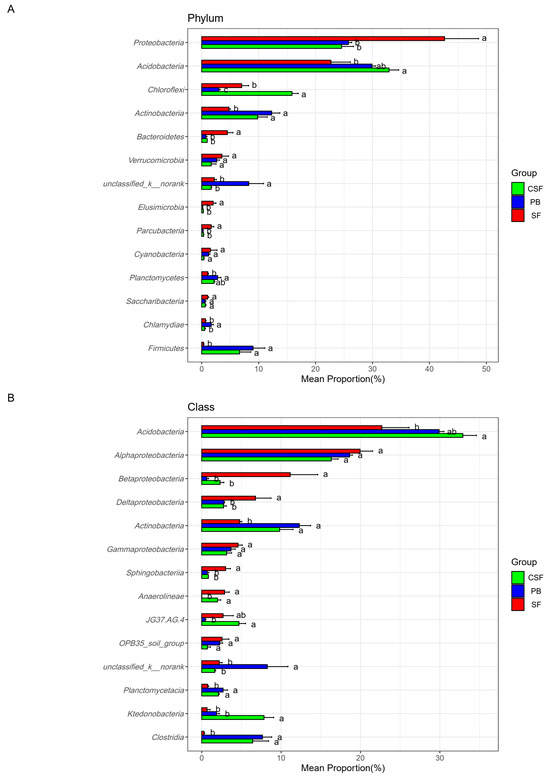
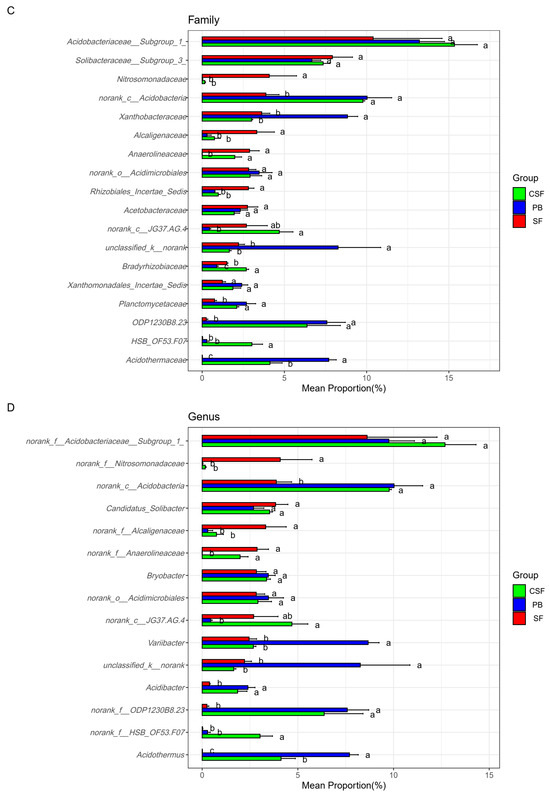
Figure 5.
Comparison of the relative abundance of major groups of soil bacteria in Sphagnum fen (SF), Polytrichum bog (PB), and Cryptomeria swamp forest (CSF) at phylum (A), class (B), family (C), and genus (D) levels. The main groups of soil bacteria were composed of the top ten groups in the relative abundance of each type of site. Error bars indicate the standard errors (n = 3). Lowercase letters (a, b, c) represent significantly different values of the studied parameter with a 95% confidence interval, confirmed by ANOVA with subsequent LSD comparisons.
3.7. Relationship between Soil Bacterial Community Composition and Soil Physicochemical Properties
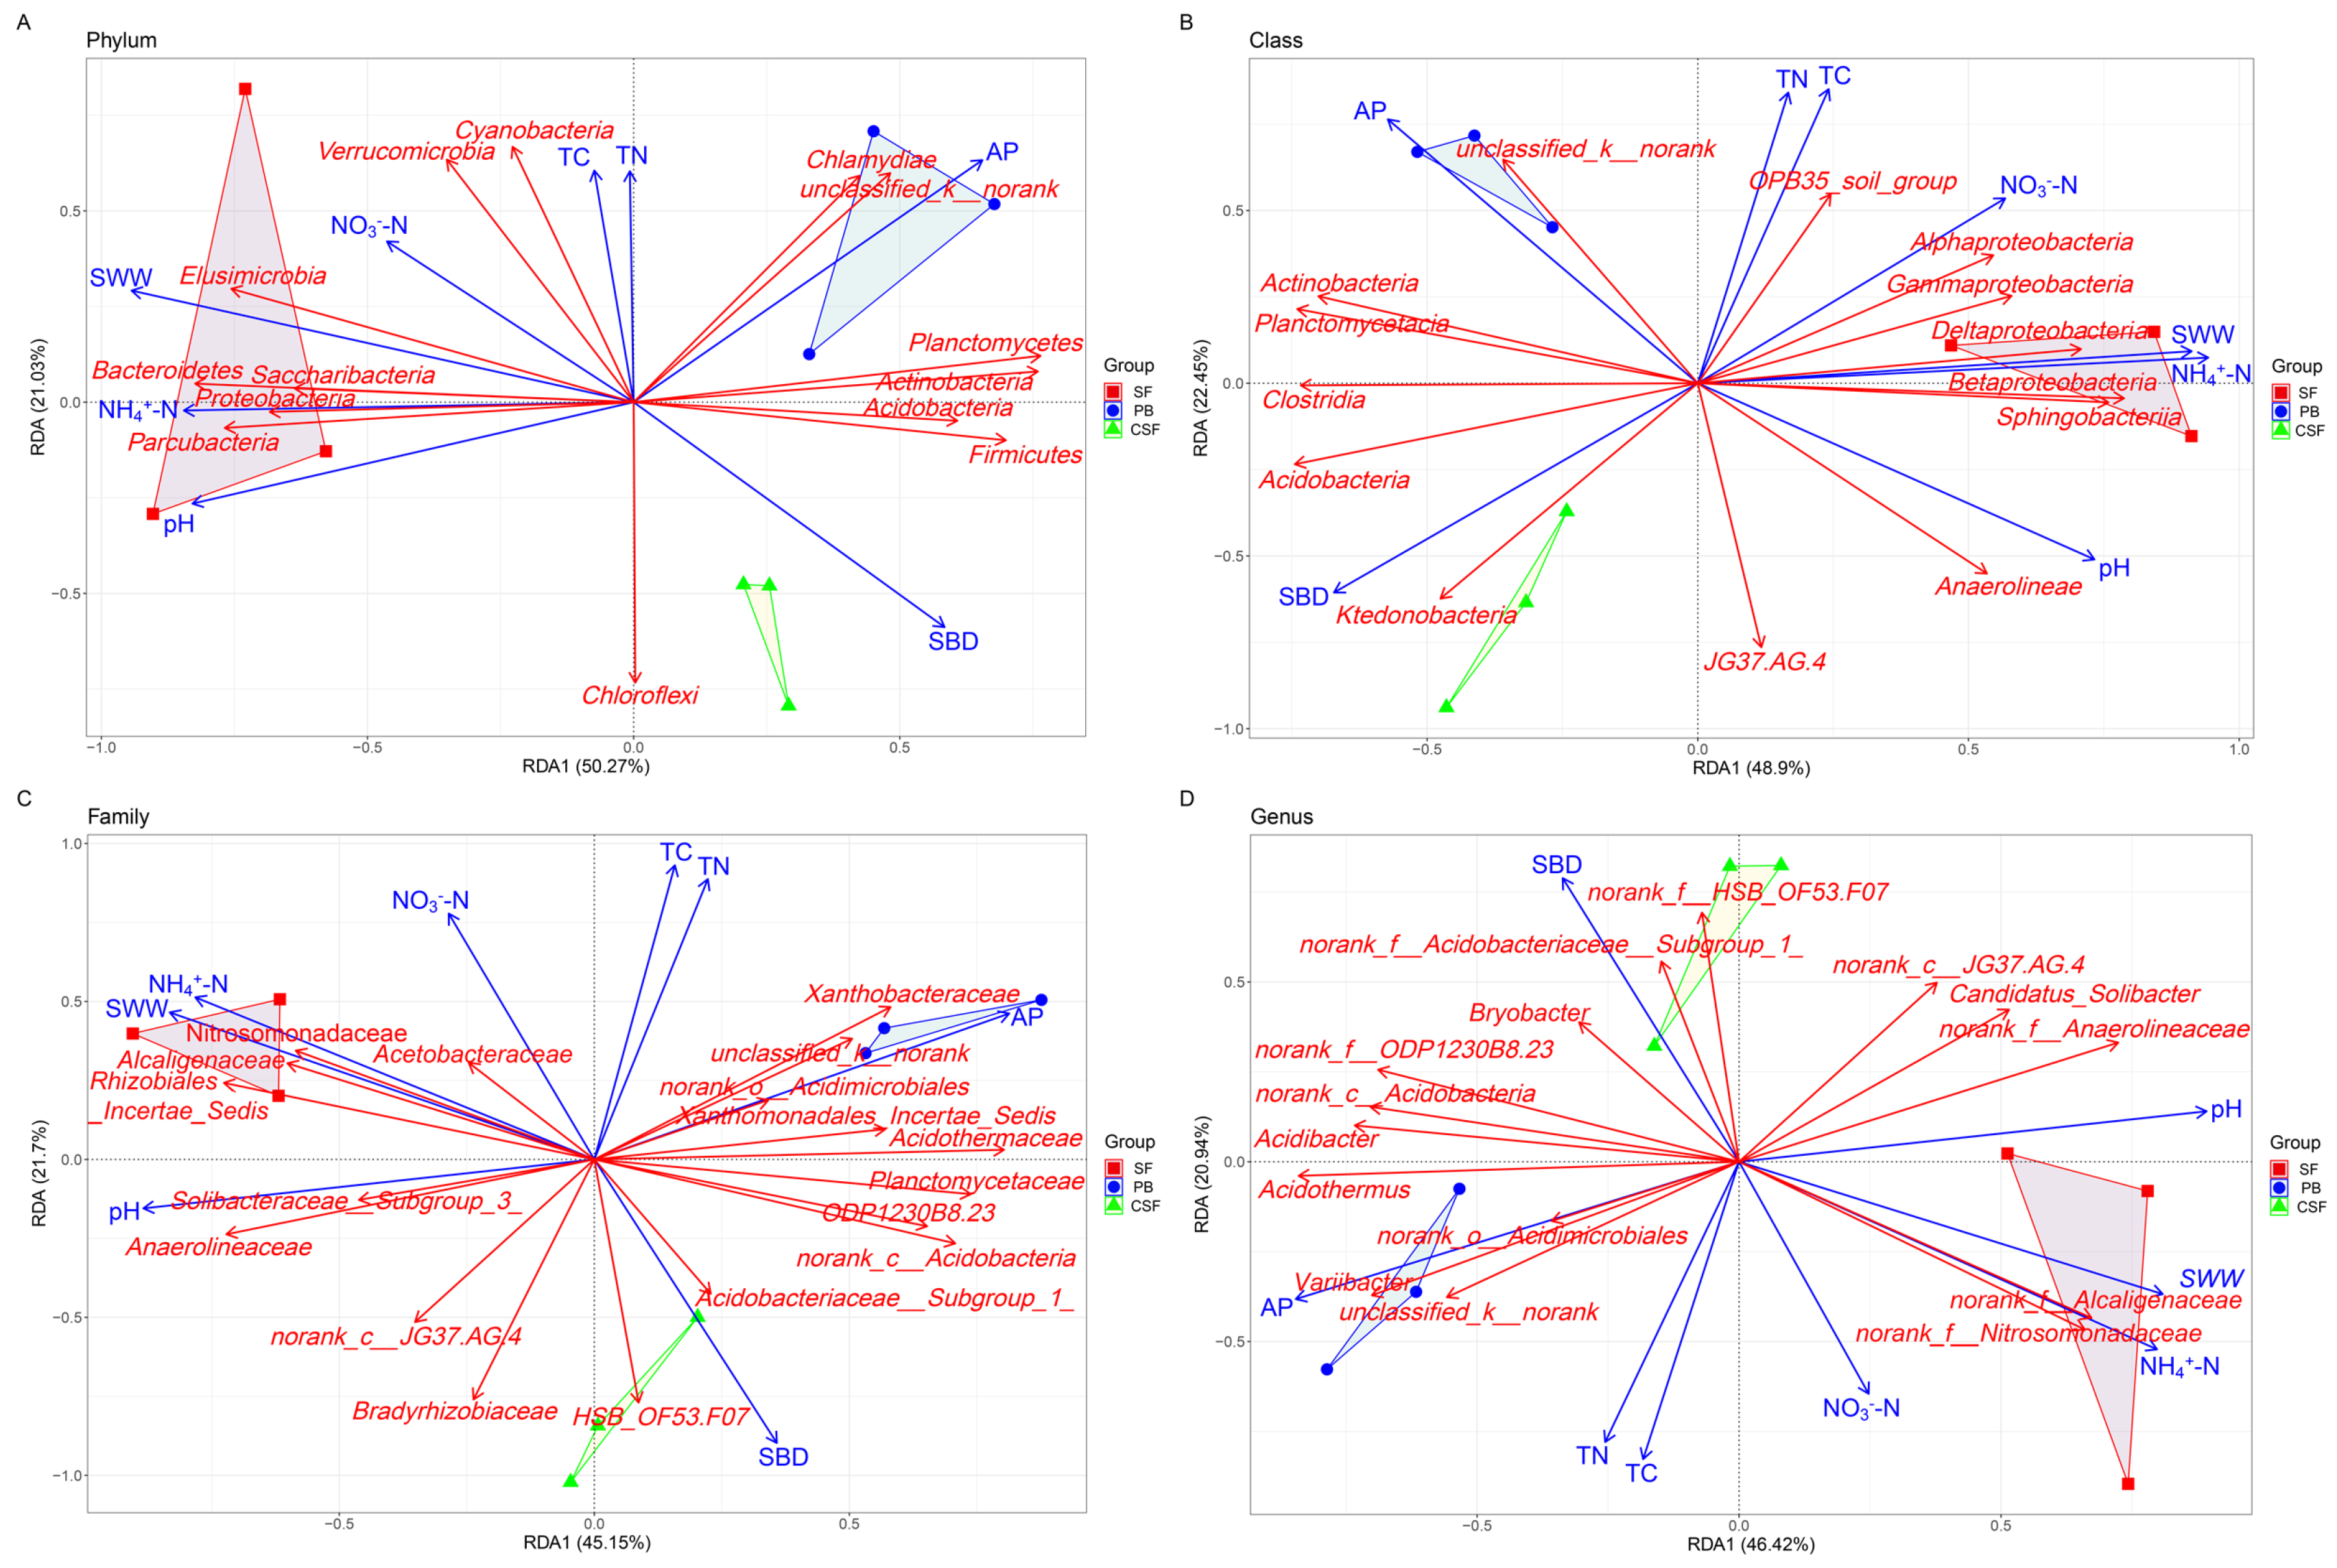
RDA revealed that soil pH, AP, NH4+-N, SWW, and SBD were significant factors driving the composition of major groups of soil bacterial communities at the phylum, class, family, and genus levels (p < 0.05) (Figure 6, Table 2). The relative abundances of Bacteroidetes and Elusimicrobia were significantly positively correlated with soil pH, while the relative abundances of Actinobacteria, Planctomycotes, Chlamydiae, and Firmicutes were significantly negatively correlated with soil pH (Figure 6A, Table S1). The relative abundances of Actinobacteria, unclassified_k__norank, Planctomycetes, and Chlamydiae were significantly positively correlated with AP. The relative abundance of Proteobacteria, Bacteroidetes, and Parcubacteria was significantly positively correlated with NH4+-N, while the relative abundance of Acidobacter, Actinobacteria, and Firmicutes was significantly negatively correlated with NH4+-N. The relative abundances of Proteobacteria, Bacteroidetes, Elusimicrobia, Parcubacteria, and Saccharibacteria were significantly positively correlated with SWW, while the relative abundances of Acidobacter, Actinobacteria, Planctomycotes, and Firmicutes were significantly negatively correlated with SWW. The relative abundances of Acidobacterium and Chloroflexi were significantly positively correlated with SBD.
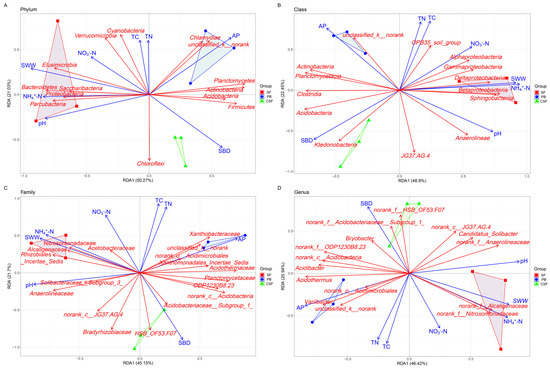
Figure 6.
Redundancy analysis showing the relationship between soil physicochemical properties and major groups of soil bacterial communities in all types of sites at phylum (A), class (B), family (C), and genus (D) levels. SF—Sphagnum fen; PB—Polytrichum bog; CSF—Cryptomeria swamp forest.
Table 2.
Monte Carlo permutation test between soil physicochemical properties and composition of main groups of soil bacteria at phylum, class, family, and genus levels.
4. Discussion
4.1. Soil Bacterial Community α Diversity and Its Influencing Factors
The results of this study support the first hypothesis that SF has higher soil bacterial community diversity than PB. The values of Sobs, Chao, and ACE, which reflect the richness of the soil bacterial community, and the values of the Shannon and Pd indices, which reflect the diversity of the community, in SF were significantly higher than those in PB, indicating that the diversity of the soil bacterial community in SF was significantly higher than that in PB (Figure 2). Our research also found that the values of Sobs, Chao, ACE, and Pd in CSF were significantly lower than those in SF and were significantly higher than those in PB. This shows that, in terms of soil bacterial community diversity, CSF is located between SF and PB. Long-term drainage and construction of the Cryptomeria fortunei forest significantly reduced the soil bacterial community diversity of SF and significantly increased the soil bacterial community diversity of PB. The number of bacterial taxa observed at the genus, family, class, and phylum levels in various types of sites also exhibited similar patterns. A total of 348 genera, 252 families, 81 classes, and 32 phyla were found in SF soil bacteria; 258 genera, 190 families, 54 classes, and 23 phyla were found in CSF soil bacteria; 227 genera, 169 families, 52 classes, and 23 phyla were found in PB soil bacteria; and SF soil bacteria had many unique groups at the genus, family, class, and phylum levels (Figure 3). The above analysis shows that, compared with PB and CSF, SF has rich soil bacterial diversity and high uniqueness, so it is very important to protect and restore this type of wetland.
The results of this study showed that most indices reflecting the richness and diversity of soil bacterial communities were significantly positively correlated with soil pH and SWW and negatively correlated with AP, suggesting that soil pH, SWW, and AP were important factors affecting the α diversity of soil bacterial communities (Table 1). Hartman et al. [14] conducted a comprehensive analysis of various types of wetlands in the United States and found that soil bacterial community diversity was closely related to soil pH, and soil pH predicted the diversity of phyla and species at all the sites they studied. Urbanová and Bárta [12] reported a significant increase in species richness and diversity from natural fen and spruce forest swamps to bogs, reflecting changes in peat pH, nutrient availability, and peat decomposition ability, and that the higher the pH, the higher the species richness and diversity. Urbanová and Bárta [25] found in their study of Czech peatlands that the pH values of fen and spruce forest swamps significantly decreased after long-term drainage and species richness and diversity significantly decreased. These studies all support that the pH value of peatland soil is an important factor affecting the diversity of soil bacterial communities. This study found that SWW and AP were significantly positively correlated and extremely significantly negatively correlated with the pH value, respectively, indicating that soil pH is the best predictor of soil bacterial community diversity (Figure S1) [14,38]. AP was significantly higher in PB (Figure 1D), which may be related to the Ericaceae plant Gaultheria hookeri. It is known that Ericaceae plants can form ericoid mycorrhizal symbionts with soil fungi. These symbionts can mobilize N and P complexes in recalcitrant organic matter, promote plant absorption, and lead to an increase in the concentration of phosphorus in soil solution [39,40]. This is also an important factor for Ericaceae plants to survive and even dominate in poor, acidic, and other harsh environments.
This study shows that long-term drainage and construction of the Cryptomeria fortunei forest significantly reduce the diversity of the soil bacterial community in SF and significantly increase the diversity of the soil bacterial community in PB. Therefore, restoring peatland to its natural SF state, which is affected by long-term drainage and afforestation, will increase soil microbial diversity, while restoring peatland to its natural PB state will reduce soil microbial diversity. Urbanová and Bárta [25] found similar results in their long-term drainage study of peatlands, where long-term drainage significantly reduced the diversity of soil bacteria in fens and significantly increased the diversity of soil bacteria in bogs. Hartman et al. [14] studied three types of wetlands in North Carolina, USA, and found that restoration of wetlands from agricultural use reduced soil bacterial diversity. This suggests that unlike terrestrial ecosystem restoration, which generally increases diversity [41,42], wetland restoration does not necessarily increase soil bacterial diversity, depending on the type of disturbance and the type of wetland.
4.2. Soil Bacterial Community Composition and Its Influencing Factors
The difference analysis of the soil bacterial community composition between the three types of sites showed that the soil bacterial community composition of SF and PB had the largest difference, and the difference in the soil bacterial community between CSF and SF was significantly greater than the difference in the soil bacterial community between CSF and PB (Figure 3). This suggests that the restoration of the soil bacterial community in SF affected by drainage and afforestation may be more difficult than that in PB.
The results of this study showed that the dominant groups of bacteria at the phylum level in the soil of SF, PB, and CSF were all Proteobacteria and Acidobacteria (Figure 5, Figure S2), which was consistent with the results of other peatlands [43,44,45,46,47,48,49,50]. However, the relative abundance of Proteobacteria was the highest in SF, and the relative abundance of Acidobacteriota was the highest in PB and CSF. The relative abundance of Proteobacteria in SF was significantly higher than that in PB and CSF, and the relative abundance of Acidobacteriota in PB and CSF was obviously higher than that in SF, reaching a significant level in CSF. There was no significant difference in the relative abundance of Proteobacteria and Acidobacteria in PB and CSF. Acidobacteria are known to prefer acidic environments and can grow under poor nutrient conditions [10,51,52], while Proteobacteria are associated with higher C availability [38,53]. Several studies have found a negative response of Acidobacteria relative abundance to pH [14,25]. This study found that the relative abundance of Proteobacteria was significantly positively correlated with NH4+-N and SWW, while the relative abundance of Acidobacteriota was significantly negatively correlated with NO3−-N, NH4+-N, and SWW and significantly positively correlated with SBD. The relative abundances of Proteobacteria and Acidobacteria were positively correlated and negatively correlated with soil pH, respectively, which did not reach a significant level. The difference in the relative abundance of Proteobacteria and Acidobacteria among the three types of sites may reflect their different environmental conditions, such as pH and nutrient status (substrate availability).
In addition, the ratio between Proteobacteria and Acidobacteria is considered to indicate the nutrient status of soil ecosystems and different peatlands, and the higher the ratio is, the richer the nutrient is, and vice versa [12,13,14]. In general, species richness and microbial diversity in peat sediments increase with the improvement in nutritional status [14]. In addition, differences in nutritional status may also lead to changes in the bacterial microbiome in different microhabitats [14,25]. In this study, the ratios of Proteobacteria and Acidobacteria were 2.02, 0.86, and 0.76 in SF, PB, and CSF, respectively, and the values in SF were significantly higher, while the values in PB and CSF had no significant difference (Figure S3). The results showed that the nutrient status of SF was significantly better than that of PB and CSF. Drainage construction of Cryptomeria fortuneana forest will significantly reduce the nutrient status in SF but has no significant impact on PB. The nutrient status may also be an important factor for the significant difference between the soil bacterial community diversity and composition of SF, PB, and CSF.
This study found that the relative abundance of Actinomycetota in PB and CSF was significantly higher than that in SF, but there was no significant difference between their values (Figure 5A). This study also found that the relative abundance of Actinomycetota was significantly negatively correlated with soil pH, NH4+-N, and SWW and was extremely significantly positively correlated with AP (Figure 6A, Table S1). Members of Actinomycetota can produce extracellular enzymes and have the same enzymatic ability as fungi [54]. Heterotrophic actinomycetes can degrade recalcitrant polymer substances such as lignin, chitin, pectin, aromatic hydrocarbons, and humic acids under aerobic conditions, so they thrive in the oxygen-bearing layer of acidic peatland [55]. Tian et al. [15] found that a decrease in water level increased the thickness of the aerobic layer of peat, leading to an increase in the abundance of actinomycetes, supporting our research findings. The relative abundance of Actinomycetota in PB and CSF was significantly higher, which may indirectly indicate that their soil carbon quality was significantly lower and their stable carbon or recalcitrant carbon components were significantly higher. Research has found that long-term drainage and tree growth lead to a decrease in the decomposability of peat and an increase in the content of recalcitrant compounds such as carboxylic acids, aromatics, and phenols [56,57,58]. Acidobacterium has been found to be a dominant phylum of bacteria under nutrient-poor conditions, and it is believed that it is involved in the degradation of cellulose and aromatic compounds [46,47]. Therefore, the higher abundance of Acidobacteriota in PB and CSF also indirectly supports this hypothesis (Figure 5A).
This study analyzed the differences in soil bacterial community composition among different treatments at the genus, family, class, and phylum levels using the top ten relative abundance rankings of various types of sites (Figure 5). This analysis method is superior to the analysis method of “using the top ten groups with relative abundance ranking of all samples” [11]. Because there may be significant differences in the dominant species of soil microbial communities among different treatments, the latter cannot clearly display the composition of dominant species in specific treatments and the relative abundance differences in dominant species among different treatments. The use of relative abundance thresholds also has drawbacks, as there may be significant differences in the dominance of soil microbial communities among different treatments [15,25]. As shown in the results of this study, Planctomycetes, Saccharibacteria, Chlamydiae, and Firmicutes were not the dominant groups in SF (relative abundance ranking is not in the top ten), but they were the dominant groups in PB or CSF (Figure 5A). The relative abundance of Planctomycetes ranked seventh and sixth in PB and CSF, respectively. The relative abundance of Saccharibacteria ranked 10th in CSF, the relative abundance of Chlamydiae ranked 9th in PB, and the relative abundance of Firmicutes ranked 4th and 5th in PB and CSF, respectively. The relative abundance of Firmicutes in PB and CSF was not significantly different but was significantly higher than that in SF.
The RDA results show that soil pH, AP, NH4+-N, SWW, and VW are all significant influencing factors for the composition of major groups of soil bacterial communities at the phylum, class, family, and genus levels (Figure 6, Table 2). This further demonstrates the important effects of pH, nutrient level, and water conditions on the composition of major groups of soil bacterial communities at different classification levels. In conclusion, this study shows that the diversity and composition of the soil bacterial community in CSF are in the middle of the corresponding values of SF and PB, and the difference between CSF and SF is significantly greater than that between CSF and PB, which is closely related to the soil pH, nutrient level, and water conditions of different types of peatlands. This supports our second hypothesis, that is, “Compared with that between CSF and PB, the difference in the soil bacterial community between CSF and SF is greater, which is caused by the difference in soil moisture and nutrients between different types of peatlands”. Urbanová and Bárta [12] found that the diversity and composition of soil bacterial communities in spruce swamp forests were between those of bogs and fens in their study of different types of peatlands. They believe that this reflects changes in soil pH, nutrient availability, and peat decomposition ability. Hartman et al. [14] found a strong correlation between soil bacterial composition and diversity and soil pH in swamps and bogs in North Carolina and fens in the Everglades in Florida. Tian et al. [15] studied the Sphagnum palustre peatlands in Dajiuhu Lake of Shennongjia, China, and found that the groundwater level and total nitrogen content had a significant impact on the soil microbial community of the Sphagnum palustre peatlands. The above studies all indicate that environmental conditions have a strong impact on the diversity and composition of soil microbial communities in peatlands, and significant environmental factors vary depending on the specific research system.
5. Conclusions
Long-term drainage and afforestation had a greater impact on the composition and diversity of soil bacterial communities in SF than in PB. The changes in relative abundance and percentage composition of specific soil microbial groups at different classification levels can be used to indicate the beginning and degree of restoration of moss peatlands affected by drainage and afforestation. Soil moisture content, available phosphorus content, and pH were key driving factors for changes in soil bacterial community composition and diversity. The restoration of soil bacterial community composition and diversity in moss peatlands affected by drainage and afforestation should not only focus on vegetation restoration but also on the restoration of soil moisture conditions for SF and nutrient conditions for PB.
Supplementary Materials
The following supporting information can be downloaded at: https://www.mdpi.com/article/10.3390/su16198621/s1, Figure S1: Pearson correlation analysis between soil physicochemical properties. TC—soil total carbon content, TN—soil total nitrogen content, AP—soil available phosphorus content, NO3−N—soil nitrate nitrogen content, NH4+-N—soil ammonium nitrogen content, SWW—soil weight water content, SBD—soil bulk; Figure S2: Comparison of the percentage composition of major groups of soil bacteria in Sphagnum fen (SF), Polytrichum bog (PB) and Cryptomeria swamp forest (CSF) at phylum, class, family and genus level. The main groups of soil bacteria were composed of the top ten groups in the relative abundance of each type of site; Figure S3: Comparison of the ratios of Proteobacteria and Acidobacteria in soil bacteria among Sphagnum fen (SF), Polytrichum bog (PB) and Cryptomeria swamp forest (CSF). Error bars indicate the standard error (n = 3). Lowercase letters (a, b, c) represent significantly different values of the studied parameter with a 95% confidence interval, confirmed by ANOVA with subsequent LSD comparisons; Table S1: Pearson correlation analysis between soil physicochemical properties and relative abundance of major groups of soil bacteria at phylum level; Table S2: Pearson correlation analysis between soil physicochemical properties and relative abundance of major groups of soil bacteria at class level; Table S3: Pearson correlation analysis between soil physicochemical properties and relative abundance of major groups of soil bacteria at family level.
Author Contributions
Software, P.Z., J.Y., Y.L., X.S., X.B. and S.Y.; formal analysis, Y.L., X.S., X.B. and S.Y.; investigation, P.Z., J.Y., Y.L., X.S., X.B. and S.Y.; data curation and writing—original draft, visualization, P.Z. and J.Y.; supervision, project administration, and writing—review and editing, H.C. and W.S.; funding acquisition, H.C. All authors have read and agreed to the published version of the manuscript.
Funding
This study is supported by the National Natural Science Foundation of China (32160272) and the subproject of Yunnan Province Key R&D Program (202203AC100002-03) and the Opening Foundation of Yunnan Key Laboratory of Plateau Wetland Conservation, Restoration, and Ecological Services (202105AG070002).
Institutional Review Board Statement
Not applicable.
Informed Consent Statement
Not applicable.
Data Availability Statement
The datasets generated for this study can be found in the Supplementary Materials.
Conflicts of Interest
The authors declare no conflicts of interest.
References
- Li, T.-T.; Lei, Y.; Dai, C.; Yang, L.-F.; Li, Z.-Q.; Wang, Z.-X. Effects of both substrate and nitrogen and phosphorus fertilizer on Sphagnum palustre growth in subtropical high-mountain regions and implications for peatland recovery. Wetl. Ecol. Manag. 2018, 26, 651–663. [Google Scholar] [CrossRef]
- Page, S.E.; Baird, A. Peatlands and Global Change: Response and Resilience. Annu. Rev. Environ. Resour. 2016, 41, 35–57. [Google Scholar] [CrossRef]
- Li, T.-T.; Wang, Z.-X.; Bu, G.-J.; Lin, L.-Q.; Lei, Y.; Liu, C.-Y.; Yang, L.-F.; Zheng, C.-L. Effects of microtopography and water table on Sphagnum palustre L. in subtropical high mountains and implications for peatland restoration. J. Bryol. 2019, 41, 121–134. [Google Scholar] [CrossRef]
- Kandel, T.P.; Lærke, P.E.; Elsgaard, L. Annual emissions of CO2, CH4 and N2O from a temperate peat bog: Comparison of an undrained and four drained sites under permanent grass and arable crop rotations with cereals and potato. Agric. For. Meteorol. 2018, 256, 470–481. [Google Scholar] [CrossRef]
- Sloan, T.; Payne, R.J.; Bain, C.; Chapman, S.; Cowie, N.; Gilbert, P.; Lindsay, R.; Mauquoy, D.; Newton, A.; Andersen, R. Peatland afforestation in the UK and consequences for carbon storage. Mires Peat 2018, 23, 1–17. [Google Scholar] [CrossRef]
- Vítovcová, K.; Lipárová, J.; Manukjanová, A.; Vašutová, M.; Vrba, P.; Prach, K. Biodiversity restoration of formerly extracted raised bogs: Vegetation succession and recovery of other trophic groups. Wetl. Ecol. Manag. 2022, 30, 207–237. [Google Scholar] [CrossRef]
- Pospíšilová, P.; Vítovcová, K.; Prach, K. Importance of repeated sampling: Vegetation analyses after 10 years revealed different restoration trends in formerly extracted peatlands. Restor. Ecol. 2023, 31, e13720. [Google Scholar] [CrossRef]
- Prior, L.D.; Nichols, S.C.; Williamson, G.J.; Bowman, D.M. Post-fire restoration of Sphagnum bogs in the Tasmanian Wilderness World Heritage Area, Australia. Restor. Ecol. 2023, 31, e13797. [Google Scholar] [CrossRef]
- Wang, H.; Li, T.-T.; Ran, N.; He, M.-Y.; Jiang, H.-Q.; Wang, Z.-X. Peat swamp biodiversity in the Qizimei Mountain National Nature Reserve, China. Mires Peat 2021, 27, 17–21. [Google Scholar] [CrossRef]
- Andersen, R.; Chapman, S.; Artz, R. Microbial communities in natural and disturbed peatlands: A review. Soil Biol. Biochem. 2013, 57, 979–994. [Google Scholar] [CrossRef]
- Lin, X.; Green, S.; Tfaily, M.; Prakash, O.; Konstantinidis, K.; Corbett, J.; Chanton, J.; Cooper, W.; Kostka, J. Microbial Community Structure and Activity Linked to Contrasting Biogeochemical Gradients in Bog and Fen Environments of the Glacial Lake Agassiz Peatland. Appl. Environ. Microbiol. 2012, 78, 7023–7031. [Google Scholar] [CrossRef] [PubMed]
- Urbanová, Z.; Bárta, J. Microbial community composition and in silico predicted metabolic potential reflect biogeochemical gradients between distinct peatland types. FEMS Microbiol. Ecol. 2014, 90, 633–646. [Google Scholar] [CrossRef] [PubMed]
- Smit, E.; Leeflang, P.; Gommans, S.; van den Broek, J.; van Mil, S.; Wernars, K. Diversity and Seasonal Fluctuations of the Dominant Members of the Bacterial Soil Community in a Wheat Field as Determined by Cultivation and Molecular Methods. Appl. Environ. Microbiol. 2001, 67, 2284–2291. [Google Scholar] [CrossRef] [PubMed]
- Hartman, W.H.; Richardson, C.J.; Vilgalys, R.; Bruland, G.L. Environmental and anthropogenic controls over bacterial communities in wetland soils. Proc. Natl. Acad. Sci. USA 2008, 105, 17842–17847. [Google Scholar] [CrossRef]
- Tian, W.; Wang, H.; Xiang, X.; Wang, R.; Xu, Y. Structural Variations of Bacterial Community Driven by Sphagnum Microhabitat Differentiation in a Subalpine Peatland. Front. Microbiol. 2019, 10, 1661. [Google Scholar] [CrossRef]
- Pankratov, T.A.; Serkebaeva, Y.M.; Kulichevskaya, I.S.; Liesack, W.; Dedysh, S.N. Substrate-induced growth and isolation of Acidobacteria from acidic Sphagnum peat. ISME J. 2008, 2, 551–560. [Google Scholar] [CrossRef]
- Elliott, D.R.; Caporn, S.J.; Nwaishi, F.; Nilsson, R.H.; Sen, R. Bacterial and Fungal Communities in a Degraded Ombrotrophic Peatland Undergoing Natural and Managed Re-Vegetation. PLoS ONE 2015, 10, e0124726. [Google Scholar] [CrossRef]
- Alam, M.J.; Rengasamy, N.; bin Dahalan, M.P.; Halim, S.A.; Nath, T.K. Socio-economic and ecological outcomes of a community-based restoration of peatland swamp forests in Peninsular Malaysia: A 5Rs approach. Land Use Policy 2022, 122, 106390. [Google Scholar] [CrossRef]
- Garcin, Y.; Schefuß, E.; Dargie, G.C.; Hawthorne, D.; Lawson, I.T.; Sebag, D.; Biddulph, G.E.; Crezee, B.; Bocko, Y.E.; Ifo, S.A.; et al. Hydroclimatic vulnerability of peat carbon in the central Congo Basin. Nature 2022, 612, 277–282. [Google Scholar] [CrossRef]
- Wilkinson, S.; Andersen, R.; Moore, P.; Davidson, S.J.; Granath, G.; Waddington, J. Wildfire and degradation accelerate northern peatland carbon release. Nat. Clim. Chang. 2023, 13, 456–461. [Google Scholar] [CrossRef]
- Galand, P.; Fritze, H.; Conrad, R.; Yrjala, K. Pathways for Methanogenesis and Diversity of Methanogenic Archaea in Three Boreal Peatland Ecosystems. Appl. Environ. Microbiol. 2005, 71, 2195–2198. [Google Scholar] [CrossRef] [PubMed]
- Kim, S.-Y.; Lee, S.-H.; Freeman, C.; Fenner, N.; Kang, H. Comparative analysis of soil microbial communities and their responses to the short-term drought in bog, fen, and riparian wetlands. Soil Biol. Biochem. 2008, 40, 2874–2880. [Google Scholar] [CrossRef]
- Urbanová, Z.; Picek, T.; Bárta, J. Effect of peat re-wetting on carbon and nutrient fluxes, greenhouse gas production and diversity of methanogenic archaeal community. Ecol. Eng. 2011, 37, 1017–1026. [Google Scholar] [CrossRef]
- Gupta, V.; Smemo, K.A.; Yavitt, J.B.; Basiliko, N. Active Methanotrophs in Two Contrasting North American Peatland Ecosystems Revealed Using DNA-SIP. Microb. Ecol. 2012, 63, 438–445. [Google Scholar] [CrossRef] [PubMed]
- Urbanová, Z.; Bárta, J. Effects of long-term drainage on microbial community composition vary between peatland types. Soil Biol. Biochem. 2016, 92, 16–26. [Google Scholar] [CrossRef]
- Cui, H.-J.; Zhang, Y.; Tian, K.; Xiao, D.-R.; Wang, K.; Guo, Y.; Li, L.-J. Characteristics of moss bog plant community and interspecific relationships of dominantspecies in Niangniang mountain wetland, Guizhou. Chin. J. Ecol. 2018, 37, 2619–2626. [Google Scholar] [CrossRef]
- Wang, J.; Li, W.; Cao, W.; Abalori, T.A.; Liu, Y.; Xin, Y.; Wang, S.; Zhang, D. Soil bacterial community responses to short-term grazing exclusion in a degraded alpine shrubland–grassland ecotone. Ecol. Indic. 2021, 130, 108043. [Google Scholar] [CrossRef]
- Wang, H.-C.; Qi, J.-F.; Xiao, D.-R.; Wang, Y.; Shi, W.-Y.; Wang, H. Bacterial community diversity and underlying assembly patterns along vertical soil profiles in wetland and meadow habitats on the Zoige Plateau, China. Soil Biol. Biochem. 2023, 184, 109076. [Google Scholar] [CrossRef]
- Shao, T.; Zhao, J.; Liu, A.; Long, X.; Rengel, Z. Effects of soil physicochemical properties on microbial communities in different ecological niches in coastal area. Appl. Soil Ecol. 2020, 150, 103486. [Google Scholar] [CrossRef]
- Fang, X.; Zheng, R.; Guo, X.; Fu, Q.; Fan, F.; Liu, S. Yak excreta-induced changes in soil microbial communities increased the denitrification rate of marsh soil under warming conditions. Ecology 2021, 165, 103935. [Google Scholar] [CrossRef]
- Qiang, W.; He, L.; Zhang, Y.; Liu, B.; Liu, Y.; Liu, Q.; Pang, X. Aboveground vegetation and soil physicochemical properties jointly drive the shift of soil microbial community during subalpine secondary succession in southwest China. Catena 2021, 202, 105251. [Google Scholar] [CrossRef]
- Segata, N.; Izard, J.; Waldron, L.; Gevers, D.; Miropolsky, L.; Garrett, W.S.; Huttenhower, C. Metagenomic biomarker discovery and explanation. Genome Biol. 2011, 12, R60. [Google Scholar] [CrossRef] [PubMed]
- R Core Team. R: A Language and Environment for Statistical Computing; R Foundation for Statistical Computing: Vienna, Austria, 2023; Available online: https://www.R-project.org/ (accessed on 16 June 2023).
- Oksanen, J.; Simpson, G.; Blanchet, F.; Kindt, R.; Legendre, P.; Minchin, P.; O’Hara, R.; Solymos, P.; Stevens, M.; Szoecs, E.; et al. vegan: Community Ecology Package. R package version 2.6-4. 2022. Available online: https://CRAN.R-project.org/package=vegan (accessed on 2 September 2023).
- de Mendiburu, F. Agricolae: Statistical Procedures for Agricultural Research. R Package Version 1.3-6. 2023. Available online: https://CRAN.R-project.org/package=agricolae (accessed on 2 September 2023).
- Wei, T.; Simko, V. R Package ’corrplot’: Visualization of a Correlation Matrix (Version 0.92). 2021. Available online: https://github.com/taiyun/corrplot (accessed on 25 September 2023).
- Wickam, H. ggplot2: Elegant graphics for data analysis. J. R. Stat. Soc. Ser. A Stat. Soc 2011, 174, 245–246. [Google Scholar] [CrossRef]
- Fierer, N.; Bradford, M.A.; Jackson, R.B. Toward an ecological classification of soil bacteria. Ecology 2007, 88, 1354–1364. [Google Scholar] [CrossRef] [PubMed]
- Kaštovská, E.; Straková, P.; Edwards, K.; Urbanová, Z.; Bárta, J.; Mastný, J.; Šantrůčková, H.; Picek, T. Cotton-Grass and Blueberry have Opposite Effect on Peat Characteristics and Nutrient Transformation in Peatland. Ecosystems 2018, 21, 443–458. [Google Scholar] [CrossRef]
- Perotto, S.; Daghino, S.; Martino, E. Ericoid mycorrhizal fungi and their genomes: Another side to the mycorrhizal symbiosis? New Phytol. 2018, 220, 1141–1147. [Google Scholar] [CrossRef]
- DeGrood, S.H.; Claassen, V.P.; Scow, K.M. Microbial community composition on native and drastically disturbed serpentine soils. Soil Biol. Biochem. 2005, 37, 1427–1435. [Google Scholar] [CrossRef]
- McKinley, V.; Peacock, A.; White, D. Microbial community PLFA and PHB responses to ecosystem restoration in tallgrass prairie soils. Soil Biol. Biochem. 2005, 37, 1946–1958. [Google Scholar] [CrossRef]
- Dedysh, S.N.; Pankratov, T.A.; Belova, S.E.; Kulichevskaya, I.S.; Liesack, W. Phylogenetic Analysis and In Situ Identification of Bacteria Community Composition in an Acidic Sphagnum peat bog. Appl. Environ. Microbiol. 2006, 72, 2110–2117. [Google Scholar] [CrossRef]
- Kraigher, B.; Stres, B.; Hacin, J.; Ausec, L.; Mahne, I.; van Elsas, J.D.; Mandic-Mulec, I. Microbial activity and community structure in two drained fen soils in the Ljubljana Marsh. Soil Biol. Biochem. 2006, 38, 2762–2771. [Google Scholar] [CrossRef]
- Morales, S.E.; Mouser, P.J.; Ward, N.; Hudman, S.P.; Gotelli, N.J.; Ross, D.S.; Lewis, T.A. Comparison of Bacterial Communities in New England Sphagnum Bogs Using Terminal Restriction Fragment Length Polymorphism (T-RFLP). Microb. Ecol. 2006, 52, 34–44. [Google Scholar] [CrossRef] [PubMed]
- Ausec, L.; Kraigher, B.; Mandic-Mulec, I. Differences in the activity and bacterial community structure of drained grassland and forest peat soils. Soil Biol. Biochem. 2009, 41, 1874–1881. [Google Scholar] [CrossRef]
- Pankratov, T.A.; Ivanova, A.O.; Dedysh, S.N.; Liesack, W. Bacterial populations and environmental factors controlling cellulose degradation in an acidic Sphagnum peat. Environ. Microbiol. 2011, 13, 1800–1814. [Google Scholar] [CrossRef] [PubMed]
- Serkebaeva, Y.M.; Kim, Y.; Liesack, W.; Dedysh, S.N. Pyrosequencing-Based Assessment of the Bacteria Diversity in Surface and Subsurface Peat Layers of a Northern Wetland, with Focus on Poorly Studied Phyla and Candidate Divisions. PLoS ONE 2013, 8, e63994. [Google Scholar] [CrossRef]
- Sun, H.; Terhonen, E.; Koskinen, K.; Paulin, L.; Kasanen, R.; Asiegbu, F.O. Bacterial diversity and community structure along different peat soils in boreal forest. Appl. Soil Ecol. 2014, 74, 37–45. [Google Scholar] [CrossRef]
- Danilova, O.; Belova, S.; Gagarinova, I.; Dedysh, S. Microbial Community Composition and Methanotroph Diversity of a Subarctic Wetland in Russia. Microbiology 2016, 85, 583–591. [Google Scholar] [CrossRef]
- Philippot, L.; Andersson, S.G.; Battin, T.J.; Prosser, J.I.; Schimel, J.P.; Whitman, W.B.; Hallin, S. The ecological coherence of high bacterial taxonomic ranks. Nat. Rev. Microbiol. 2010, 8, 523–529. [Google Scholar] [CrossRef] [PubMed]
- Dedysh, S.N. Cultivating uncultured bacteria from northern wetlands: Knowledge gained and remaining gaps. Front. Microbiol. 2011, 2, 184. [Google Scholar] [CrossRef]
- Leff, J.W.; Jones, S.E.; Prober, S.M.; Barberán, A.; Borer, E.T.; Firn, J.L.; Harpole, W.S.; Hobbie, S.E.; Hofmockel, K.S.; Knops, J.M. Consistent responses of soil microbial communities to elevated nutrient inputs in grasslands across the globe. Proc. Natl. Acad. Sci. USA 2015, 112, 10967–10972. [Google Scholar] [CrossRef]
- Le Roes-Hill, M.; Khan, N.; Burton, S.G. Actinobacterial Peroxidases: An Unexplored Resource for Biocatalysis. Appl. Biochem. Biotechnol. 2011, 164, 681–713. [Google Scholar] [CrossRef]
- Jaatinen, K.; Fritze, H.; Laine, J.; Laiho, R. Effects of short-and long-term water-level drawdown on the populations and activity of aerobic decomposers in a boreal peatland. Glob. Chang. Biol. 2007, 13, 491–510. [Google Scholar] [CrossRef]
- Blodau, C.; Siems, M. Drainage-induced forest growth alters belowground carbon biogeochemistry in the Mer Bleue bog, Canada. Biogeochemistry 2012, 107, 107–123. [Google Scholar] [CrossRef]
- Mastný, J.; Urbanová, Z.; Kaštovská, E.; Straková, P.; Šantrůčková, H.; Edwards, K.; Picek, T. Soil organic matter quality and microbial activities in spruce swamp forests affected by drainage and water regime restoration. Soil Use Manag. 2016, 32, 200–209. [Google Scholar] [CrossRef]
- Urbanová, Z.; Straková, P.; Kaštovská, E. Response of peat biogeochemistry and soil organic matter quality to rewetting in bogs and spruce swamp forests. Eur. J. Soil Biol. 2018, 85, 12–22. [Google Scholar] [CrossRef]


Disclaimer/Publisher’s Note: The statements, opinions and data contained in all publications are solely those of the individual author(s) and contributor(s) and not of MDPI and/or the editor(s). MDPI and/or the editor(s) disclaim responsibility for any injury to people or property resulting from any ideas, methods, instructions or products referred to in the content. |
© 2024 by the authors. Licensee MDPI, Basel, Switzerland. This article is an open access article distributed under the terms and conditions of the Creative Commons Attribution (CC BY) license (https://creativecommons.org/licenses/by/4.0/).