Article

Energy and Exergy Performance Analysis of Solar-Assisted Thermo-Mechanical Vapor Compression Cooling System

by
Hussein A. Al Khiro
* and
Rabah Boukhanouf
Faculty of Engineering, University of Nottingham, Nottingham NG7 2RD, UK
*
Author to whom correspondence should be addressed.
Sustainability 2024, 16(19), 8625; https://doi.org/10.3390/su16198625
Submission received: 2 September 2024 / Revised: 2 October 2024 / Accepted: 3 October 2024 / Published: 4 October 2024
(This article belongs to the Section Energy Sustainability)

Abstract

:
Air conditioning is vital for indoor comfort but traditionally relies on vapor compression systems, which raise electricity demand and carbon emissions. This study presents a novel thermo-mechanical vapor compression system that integrates an ejector with a conventional vapor compression cycle, incorporating a thermally driven second-stage compressor powered by solar energy. The goal is to reduce electricity consumption and enhance sustainability by leveraging renewable energy. A MATLAB® model was developed to analyze the energy and exergy performance using R1234yf refrigerant under steady-state conditions. This study compares four solar collectors—evacuated flat plate (EFPC), evacuated tube (ETC), basic flat plate (FPC), and compound parabolic (CPC) collectors—to identify the optimal configuration based on the collector area and costs. The results show a 31% reduction in mechanical compressor energy use and up to a 44% improvement in the coefficient of performance (COP) compared to conventional systems, with a condenser temperature of 65 °C, a thermal compression ratio of 0.8, and a heat source temperature of 150 °C. The evacuated flat plate collectors performed best, requiring 2 m2/kW of cooling capacity with a maximum exergy efficiency of 15% at 170 °C, while compound parabolic collectors offered the lowest initial costs. Overall, the proposed system shows significant potential for reducing energy costs and carbon emissions, particularly in hot climates.

1. Introduction

The increasing global demand for space cooling has become a significant concern, driven by rapid urbanization, population growth, and the rising temperatures associated with climate change. Since the 1990s, the demand for cooling in buildings has more than tripled, leading to severe strain on electricity systems and contributing to the global increase in CO2 emissions [1,2]. This growing demand not only raises overall power requirements but also necessitates expanded generation and distribution capacities to manage peak loads, further stressing power systems. In certain regions, such as the Middle East and parts of the United States, cooling can account for over 70% of the peak residential electricity demand on extremely hot summer days. Currently, air conditioners and ventilators for space cooling account for approximately 20% of the global total electrical energy used in buildings [3]. The air conditioner market is dominated by traditional mechanical vapor compression systems, which are highly effective at controlling indoor temperatures. However, they are energy-intensive and contribute to environmental degradation by increasing greenhouse gas emissions [4]. In response to these challenges, researchers have increasingly focused on alternative cooling technologies, particularly those harnessing solar energy. Solar cooling systems offer a promising solution to mitigate the reliance on fossil fuels and reduce greenhouse gas emissions. These systems use solar energy either through photovoltaic (PV) panels or solar thermal collectors to provide cooling in a more sustainable manner [5]. A study conducted by Bilgili [6] in Turkey demonstrated the effective use of a PV system with a panel area of 31.26 m2 to power a vapor compression refrigeration system, which required a peak compressor power of 2.53 kW. Nevertheless, PV systems face the challenge of low efficiency and high costs associated with battery storage [7]. Solar thermal cooling technologies present another viable approach, with several systems showing significant progress. These include absorption, adsorption, desiccant, and ejector cooling systems.
Absorption refrigeration systems use low-grade thermal energy to produce cooling. They consist of four main components: the generator, condenser, evaporator, and absorber [8]. Two common refrigerant/absorbent pairs are used: water/lithium bromide (H2O/LiBr) and ammonia/water (NH3/H2O). H2O/LiBr is preferred for cooling and air conditioning in buildings, while NH3/H2O is suited for industrial applications [9]. The COP of these systems varies with the type of technology and heat source temperature: a single-effect cycle at 85 °C offers a COP of up to 0.7, while a double-effect cycle can achieve a COP of 1.7 at 220 °C [10]. Studies have explored different solar thermal collectors for driving absorption systems. For example, a single-stage NH3/H2O system designed for a 120 m2 residence used various collectors: flat plate (FPC), evacuated tube (ETC), compound parabolic (CPC), and parabolic trough (PTC). The collector areas were 42 m2 (FPC), 17 m2 (ETC), 19 m2 (CPC), and 22 m2 (PTC), with 7.7 m3 of thermal storage across two tanks. The system had a maximum cooling capacity of 10 kW, with ETC achieving the highest exergy efficiency of 2.6% and a COP of 0.25 [11]. In another study, Al-Falahi et al. [12] examined a single-effect LiBr/H2O absorption system powered by an ETC for air conditioning in Baghdad’s hot and dry climate. The study found that using 35 m2 of ETC with a 2000 L storage tank could achieve a 70% solar fraction, meeting a maximum cooling load of 25 kW.
The adsorption cooling cycle comprises two sorption chambers, an evaporator, and a condenser. A common absorbent–adsorbate pair is silica gel/water, The system’s COP ranges from 0.3 to 0.7, depending on the driving heat temperature, typically between 60 and 95 °C [13]. Alahmer et al. [14] modeled a solar-driven silica gel/water adsorption system using a CPC in Perth, Australia. The system provided 9.2 kW of cooling, sufficient for the space cooling of a residential building with a 100–120 m2 floor area, with a COP of 0.27. Sim [15] optimized an ETC-driven system in Doha, Qatar, finding that a 4.5 kW system required 23.4 m2 of ETC and a 0.3 m3 water tank, cutting electricity use by 47%. Fasfous et al. [16] showed that a 40 m2 FPC could supply sufficient heat for an 8 kW solar air-conditioning system in Amman, Jordan.
Desiccant cooling systems could also play a prominent role in hot and humid climates, as they can remove both latent and sensible heat from the supply air. These systems consist of a dehumidifier and regenerator, which use desiccant materials to absorb and control the humidity. Solid desiccants like silica gel are common due to their low costs and effective performance at regeneration temperatures of between 50–80 °C, with a COP of around unity [9]. Liquid desiccants such as lithium chloride (LiCl) offer lower regeneration temperatures and improved efficiency. Angrisani et al. [17] tested a silica-gel-based desiccant wheel with an 8.5 kW cooling capacity. The authors found that replacing a natural gas boiler with a 16 m2 ETC for heating the desiccant wheel reduced the primary energy use by 50.2% and CO2 emissions by 49.8%. Bouzenada et al. [18] evaluated a liquid desiccant system in Kingston, Canada, using a 95 m2 ETC and an auxiliary boiler. Their simulations for Tunis, Toronto, and Calcutta showed that while ETCs provided the best performance, flat plate collectors (FPCs) needed an additional 15 m2 in Toronto and Tunis and 30 m2 more in Calcutta to match the solar fraction of ETC arrays. The hybrid system with 30% FPCs and 70% ETCs performed the best in Tunis.
Ejector cooling systems replace the compressor in traditional vapor compression cycles with a simpler, thermally driven process. The system includes a generator, condenser, evaporator, throttling valve, and ejector. The ejector is a static device that incorporates converging–diverging nozzle, suction chamber, mixing, and diffuser sections. The primary flow, pressurized refrigerant vapor discharged from the generator, accelerates and creates a low-pressure suction zone that entrains the portion of the refrigerant that flows through the evaporator (secondary flow). The mixed refrigerant then enters the diffuser, where the pressure is increased above the evaporator level. The combined flow is condensed and pumped back to the generator [19]. Although the COP is only 0.2, the system is simple, with no moving parts, and operates with heat sources above 80 °C. Vidal et al. [20] optimized an ejector cooling system in Florianopolis, Brazil, using R141b refrigerant. The study, targeting a 10.5 kW cooling capacity, found that the optimal setup required 80 m2 of FPC and a 4 m3 hot water storage tank, with solar energy covering 42% of the system’s total energy input.
Mechanical vapor compression technology is currently the preferred choice for meeting the full range of cooling and refrigeration demands across many sectors of the industry. The technology has benefitted from continuous advancements in compressor design, refrigerant selection, and system optimization, leading to improved cooling performance. One such design improvement is the use of an ejector as a substitute for the throttling device, which reduces irreversibility and increases the system’s COP by raising the compressor suction pressure above the evaporator pressure, thereby enhancing cooling capacity. Chen et al. [21] studied the performance of an integrated ejector–vapor compression refrigeration cycle using an R290/R600a refrigerant mixture for a domestic refrigerator. The cycle incorporated an internal heat exchanger and a phase separator to increase efficiency. The results demonstrated improvements of 13.5% in COP, 19.3% in cooling capacity, and 13.4% in exergy efficiency compared to a conventional vapor compression refrigerator. Elakhdar et al. [22] analyzed an ejector-integrated double evaporator vapor compression refrigerator using R290/R600a as an alternative to R134a. The ejector cycle improved the COP by 24%, with a 60% propane mass fraction being more efficient under similar conditions. Direk et al. [23] experimentally analyzed a dual evaporator ejector system with R134a. Their study showed a 13.24% COP improvement over the basic cycle by adjusting the condensing temperature and ejector entrainment ratio. Gullo et al. [24] conducted an experimental study on a small-capacity transcritical R744 vapor compression refrigeration unit with an innovative ejector under warm climate conditions. The pulse-width modulation ejector effectively controlled the high pressure, enabling overfeeding evaporator conditions and achieving energy savings of from 11.5% to 16.3% compared to the basic vapor compression cycle. Advancements in solar cooling technologies present new opportunities to integrate renewable energy with traditional vapor compression systems despite higher initial and installation costs, increased technological complexity, and greater maintenance requirements [25,26,27]. Moreover, many regions of the world with high cooling loads in buildings also benefit from abundant solar energy resources, which helps alleviate the issue of intermittency and enables a portion of the cooling to be powered by solar energy [9].
This study explores an innovative approach to enhance the energy efficiency of vapor compression systems by incorporating an ejector as a refrigerant expansion device and integrating a thermally driven refrigerant compression process. The resulting cooling system, referred to as the “thermo-mechanical vapor compression” (TMVC) system, has the potential to reduce the mechanical compressor workload, increase the compressor suction pressure, and minimize the irreversibility of the expansion process. The work presented in this paper is supported by a thorough review of recent advancements in hybrid vapor compression cooling technologies and a detailed description and explanation of the operation of the proposed thermo-mechanical vapor compression (TMVC) system. The research methodology involves formulating a validated mathematical model and developing MATLAB® code to analyze the corresponding thermodynamic cycle and identify the optimal operating parameters of the cooling system. Moreover, the results from the computer modelling of the thermodynamic cycle are discussed, highlighting various strategies for optimizing the design and energy performance parameters of the proposed cooling system.
The structure of this paper is organized as follows: Section 2 presents a comprehensive description of the hybrid cooling system. Section 3 details the research methodology adopted for this study. In Section 4, the mathematical model underpinning the system is introduced, followed by the simulation parameters outlined in Section 5. Section 6 focuses on the verification of the developed model. Section 7 offers an in-depth discussion of the simulation results and their implications. Finally, Section 8 provides a comparative analysis of the hybrid system against other solar cooling technologies.

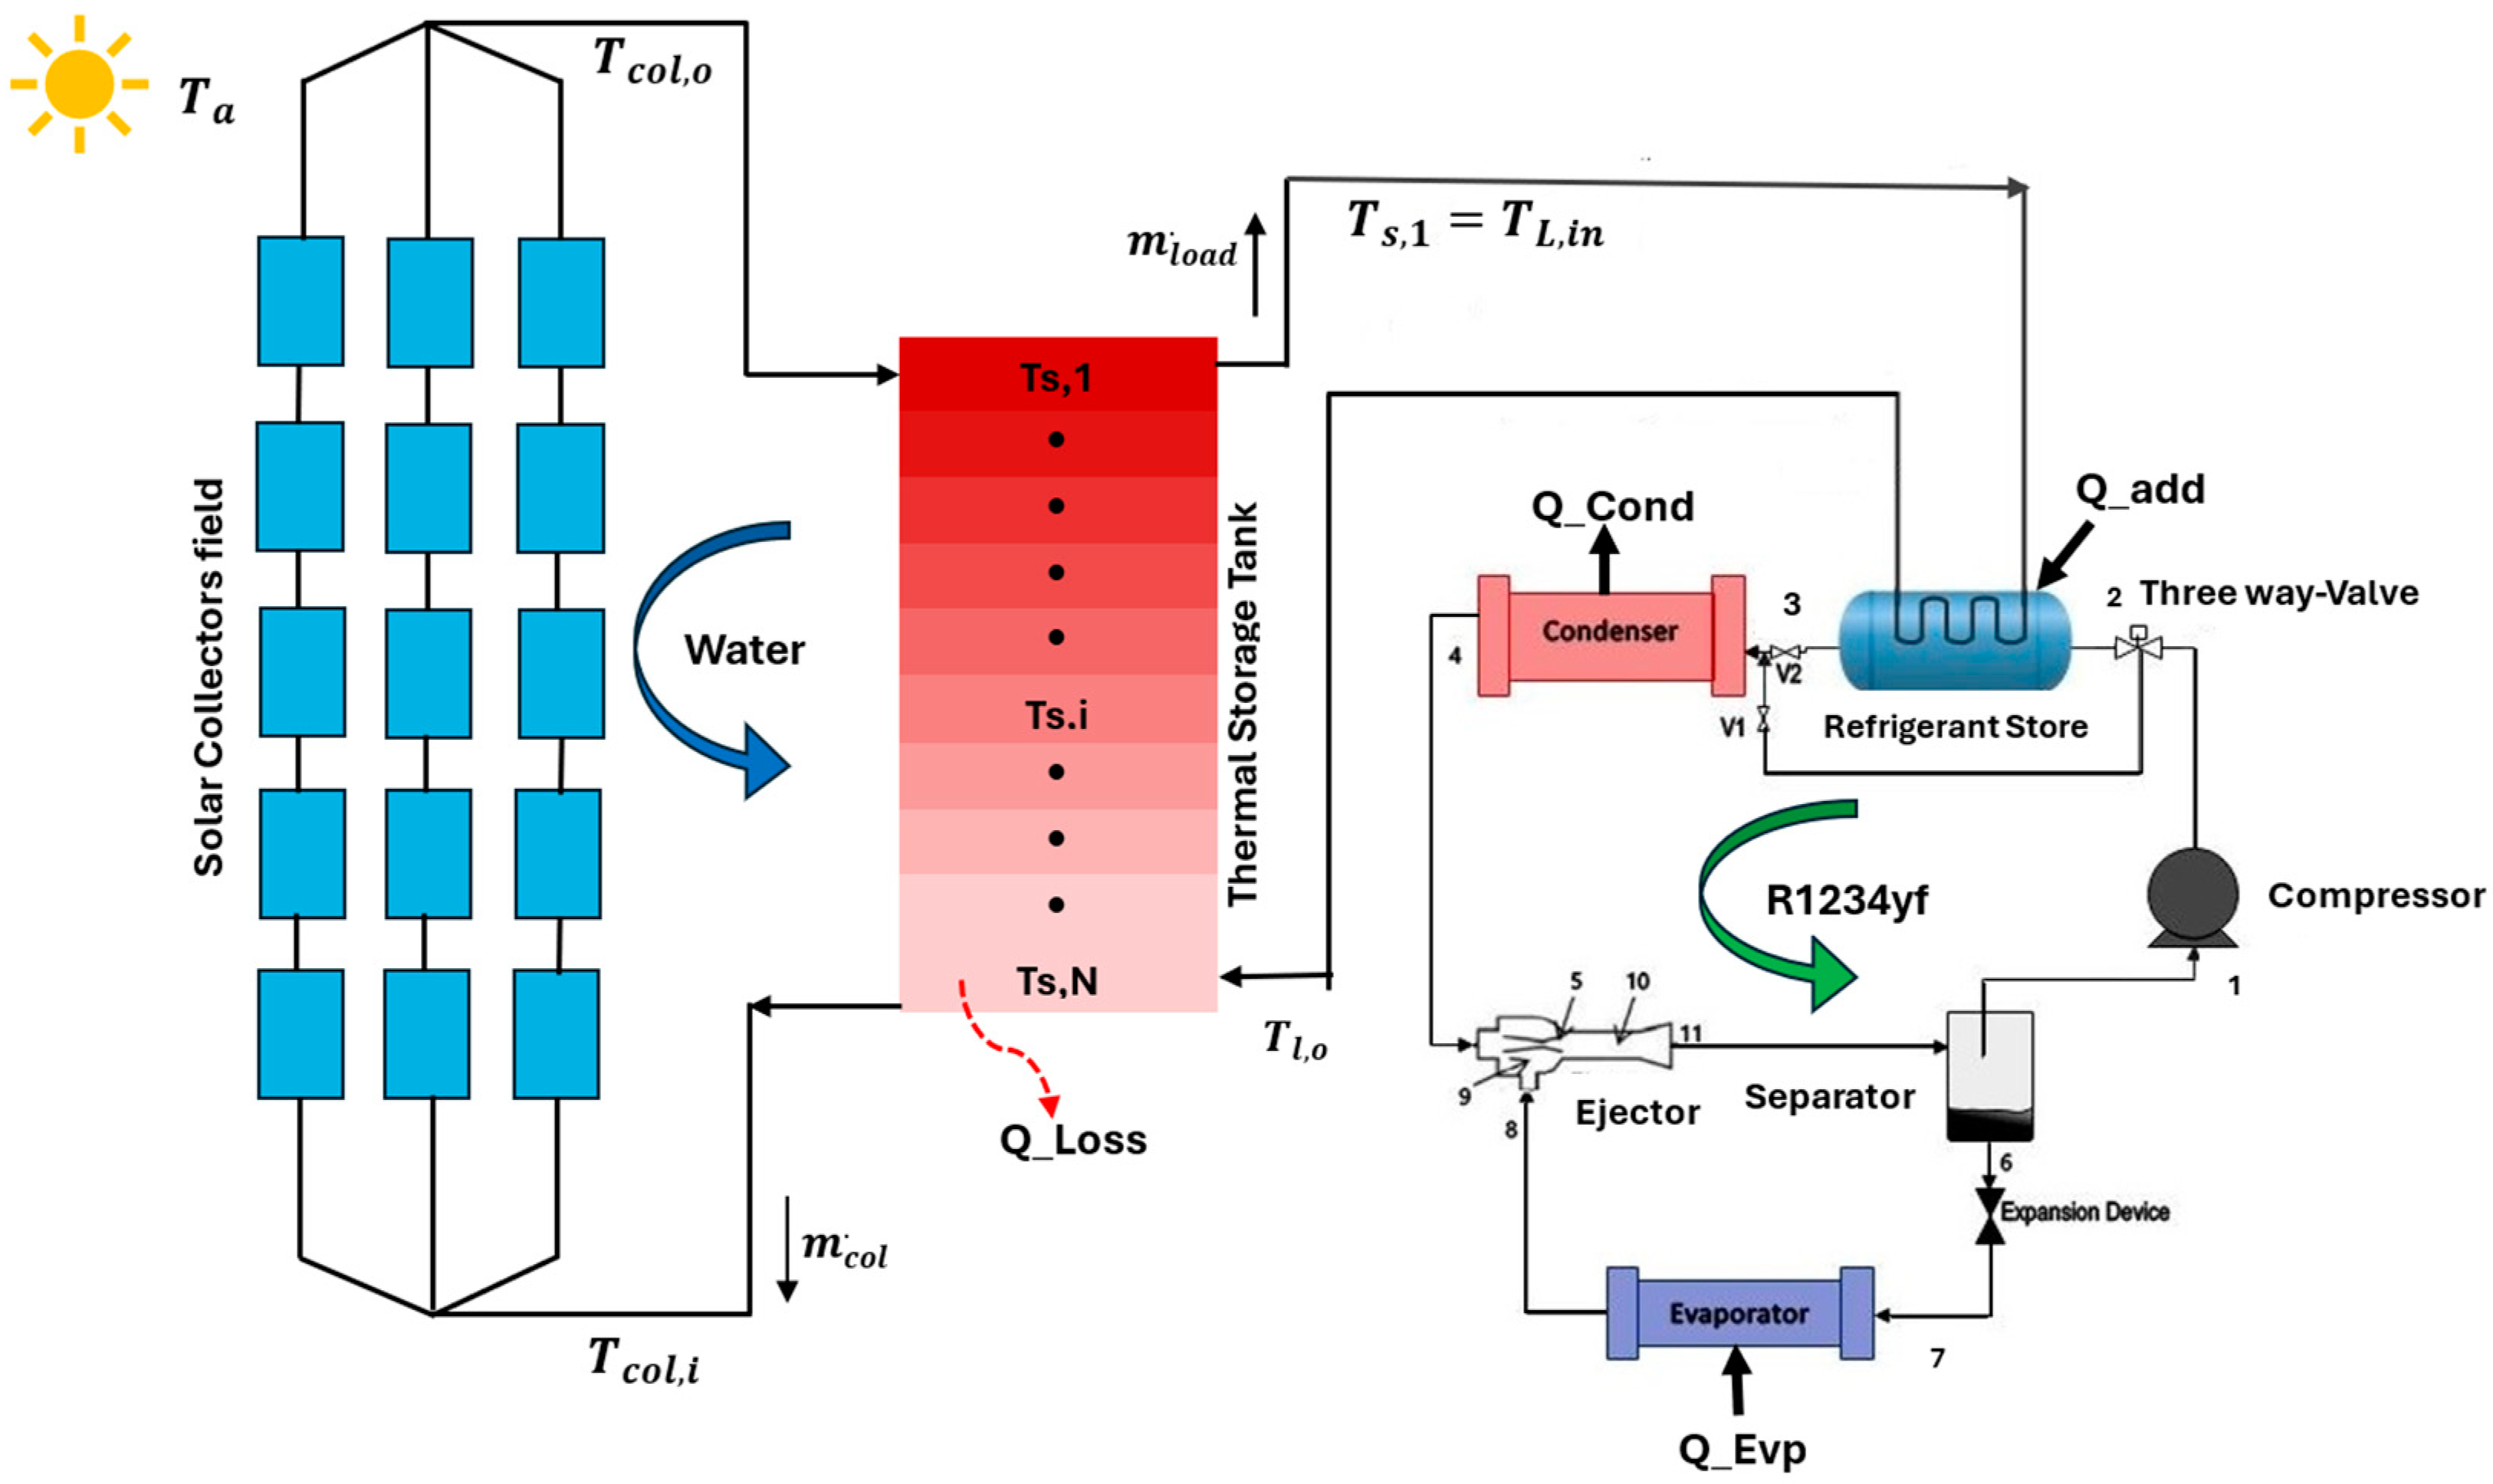
2. Description of the Hybrid Cooling System
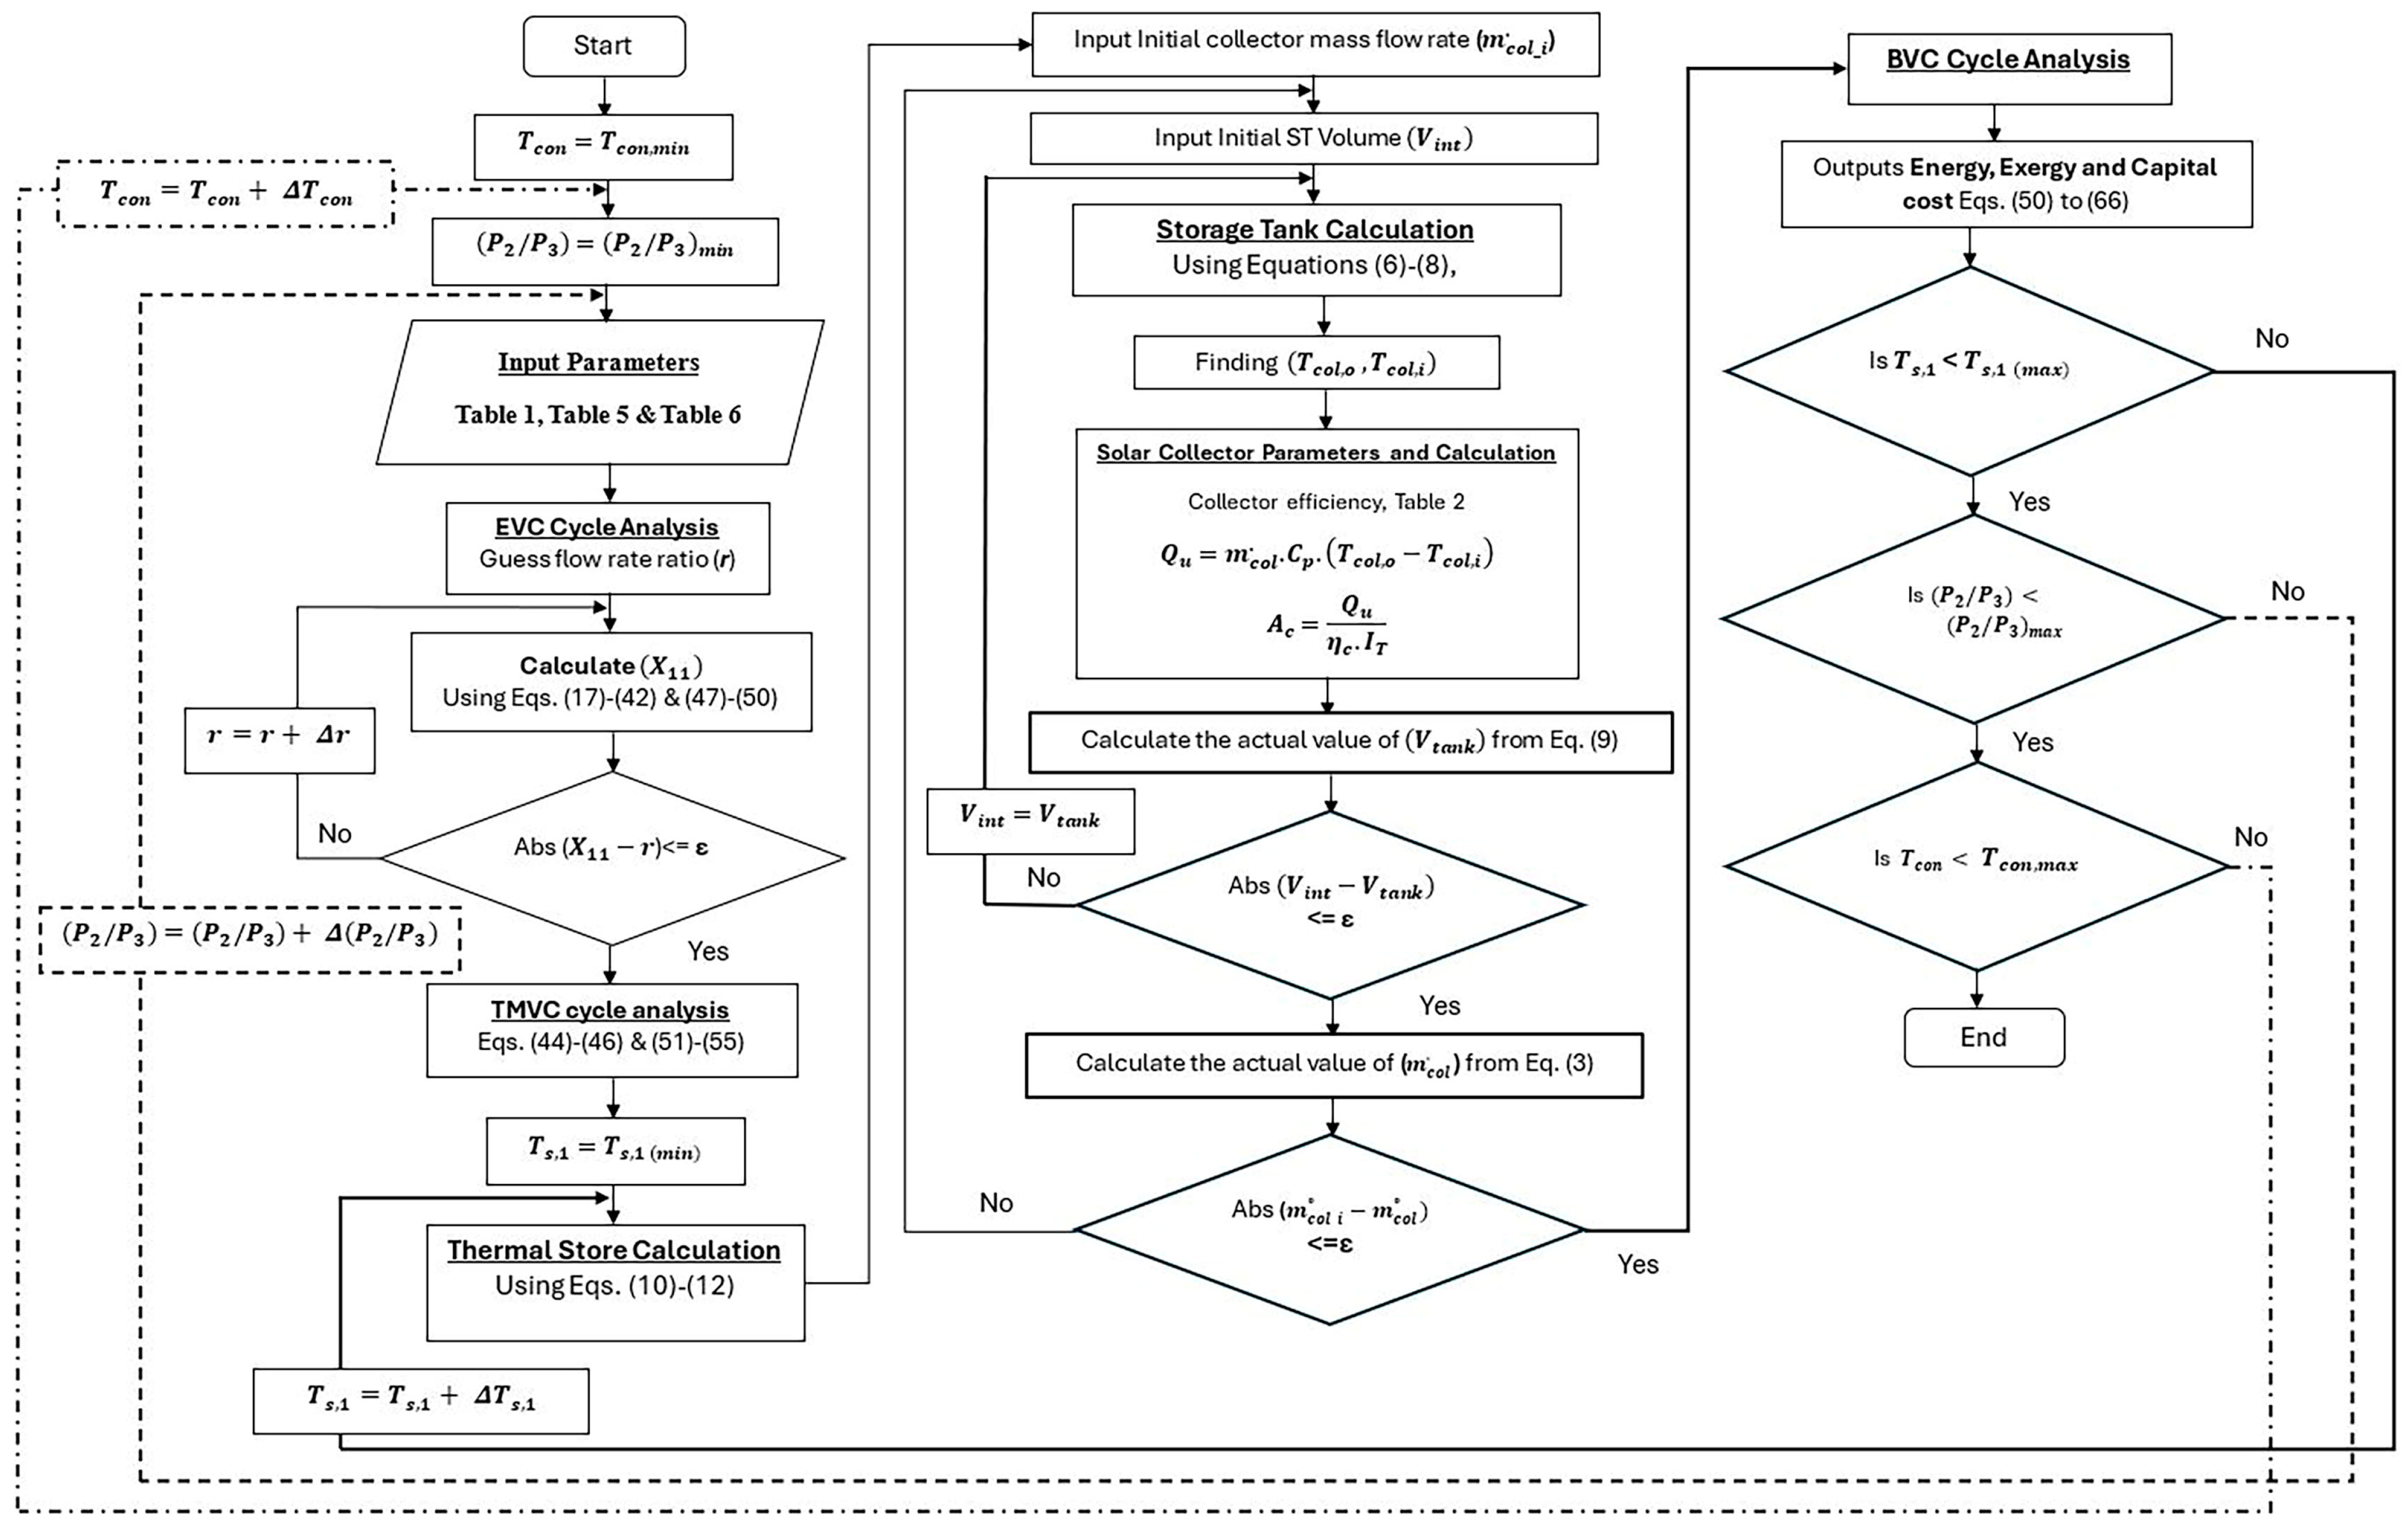
The hybrid solar thermo-mechanical vapor compression (TMVC) cooling system consists of a conventional mechanical vapor compression combined with an ejector and a thermal compressor. The thermal compressor is made of a solar thermal heat source collector, a stratified hot water heat storage tank, a refrigerant store, a heat exchanger, and a three-way valve. A schematic diagram depicting the mechanical arrangement of the main components of the air conditioning system is shown in Figure 1.
An illustration of the p-h thermodynamic cycle of the cooling system is presented in Figure 2. This shows that, initially, the mechanical compressor at point (1) sucks in the superheated refrigerant vapor that undergoes an isentropic compression process. At the compressor discharge port (point 2), the refrigerant enters the refrigerant store (second-stage thermal compression), where it is subjected to further pressure and temperature increases through a constant-volume compression process. The temperature-controlled three-way valve is positioned in the mechanical compressor refrigerant discharge line to direct the refrigerant vapor flow through the refrigerant store or bypass it, depending on the thermal properties of the refrigerant.
The high-pressure refrigerant enters the condenser at point 3, where its heat is rejected to the environment, and the refrigerant flow leaves the condenser at point 4 and provides the motive driving energy of the ejector (primary flow). The refrigerant then expands in the ejector is entropically through a convergent–divergent nozzle and exits it at point (5). A secondary flow is entrained into the suction chamber of the ejector (point 8, 9) and mixes with the primary flow in the constant area of the ejector (point 10) before exiting the ejector diffuser as a mixture of liquid and gas states at point 11. The refrigerant mixture is separated into vapor and liquid states in the separator, where the vapor refrigerant is directed to the mechanical compressor suction port (point 1) to repeat the cycle, and the liquid refrigerant expands through an expansion valve and enters the evaporator (point 7) to generate a cooling effect. It also worth noting that the addition of a thermally driven constant-volume compression process increases the temperature of the vapor refrigerant entering the condenser, which requires a larger condenser surface area.
The second-stage vapor compression operates at constant volume using thermal energy from a thermal solar collector. The heat generated by the solar collector is stored in a thermally stratified storage tank to extend the operation duration of the air conditioning systems during periods of insufficient solar radiation. The thermal energy from the stratified thermal store is then used to heat the superheated vapor refrigerant in the refrigerant pressure vessel through a heat exchanger.

3. Research Method

In this research, a steady-state computer simulation was employed to evaluate the energy performance of the cooling system and the effect of various design parameters. These include the condenser temperature, T c o n d , the refrigerant store heat transfer fluid inlet temperature (heat source temperature), T s , 1 , and the pressure ratio of the refrigerant store pressure to the mechanical compressor discharge pressure, P 2 / P 3 . In addition, four types of solar collectors were analyzed for heat generation and storage.
In this analysis, the cooling load of a block of flats was selected as a case study, located in the city of Baghdad, Iraq. The building consists of 10 floors, and each floor contains five flats, with a total floor area of 950 m2. The estimated peak cooling load of 473 kW occurs on July 17th at 3 pm. To determine the optimal solar collector tilt angle, Hassan et al. [28] analyzed Iraq’s solar energy potential and found the ideal south-facing tilt angles ranged from 0° to 64°. The optimal angles increased during winter, peaking in January and December, and decreased in summer, with the lowest value of 1.8° in July, aligning with the case study building’s highest cooling load. The solar energy resources for the location are listed in Table 1.

4. Mathematical Model

The mathematical model considered the formulation of the governing correlations of the cooling system’s thermodynamic cycle, the thermal energy storage, and the solar collectors. These were then solved iteratively using the MATLAB® software (R2023b). Additionally, it defined the evaluation indexes, encompassing energy, exergy, and financial aspects.

4.1. Solar Collector Field Performance

The instantaneous incident solar energy on the solar thermal collector depends on the collector aperture area, Ac, and the solar irradiance, (It). This is expressed as:
Q s = A c . I t
The incident solar energy on the collector is then transferred through a working fluid into useful thermal energy gain, which can be determined as follows:
Q u = m ˙ c o l . C p . T c o l , o T c o l , i
where m ˙ c o l is the mass flow rate of the heat transfer fluid, Cp is the specific heat capacity, and T c o l , o and T c o l , i are the outlet and inlet temperatures of the heat transfer fluid, respectively.
The collector mass flow rate can be calculated according to Equation (3), where S m is the required mass flow rate, and when one unit of collector is assigned, S m is assumed to be (0.02 Kg. s−1.m−2), [29].
m ˙ c o l = s m A c
The thermal performance of the solar collector is expressed by its efficiency, which is given as the ratio of the net heat gain to the incident solar energy, as given by the following equation:
ƞ c o l , t h = Q u Q s = m ˙ c o l . C p . T c o l , o T c o l , i A c   .   I t
The solar collector’s steady state is also expressed by its design parameters through a performance curve of the normalized temperature difference (TmTa)/It), which is a quadratic model. This is then improved to consider the effect of the solar rays’ incidence angle (θ) using the incident angle modifier (IAM), as presented by the following equation:
η θ = η o p t K θ c 1 T m T a I t c 2 T m T a 2 I t
where η o p t represents the optical efficiency, K θ is an incidence angle modifier, c 1 is the global heat loss coefficient, c 2 is the temperature dependence of the global heat loss coefficient, I t is the solar radiation on the titled surface, and ( T m T a ) is the difference between the arithmetic average of inlet and outlet temperatures of the solar collector fluid ( T c o l , i + T c o l , o ) / 2 and the ambient temperature [29].
For a comparative analysis, four types of solar collectors were assessed. The specific efficiency of each type, selected from the manufacturers’ data sheets as certified by European Keymark, is given in Table 2.

4.2. Thermal Storage Tank

Thermal energy storage (TES) allows for accommodating for the variable nature of the solar energy source with fluctuating energy demands [31]. The energy storage capacity of a TES system is chiefly dependent on its volume, operating temperature, level of insulation, and thermal inertia [32]. In this analysis, the heat transfer fluid in the thermal storage was considered thermally stratified, and a multi-node computer simulation approach was adopted. The thermal store volume is divided into (N) identical and well-mixed isothermal horizontal layers of temperature, T s , i [33]. In this simulation, it is essential to state that the bottom node (i = N) temperature T s , N is equal to T c o l , i , while the water temperature flowing to the load (refrigerant store) T L , i n is equal to the thermal storage fluid temperature of the top layer (1st layer), T s , 1 . Energy and mass conservation laws were then applied systematically to each thermal layer as follows [34]:
The energy balance for the first node is given below:
M s , 1   .   c p   .   d T s , 1 d t = m ˙ c o l   .   C p   .   T c o l , o T s , 1 + m ˙ l o a d   .   C p   .   T s , 2 T s , 1 U l   .   A s , 1   .   ( T s , 1 T a )
The energy balance for nodes two through nine is as follows:
M s , i   .   c p   .   d T s , i d t = m ˙ c o l   .   C p   .   T s , i 1 T s , i + m ˙ l o a d   .   C p   .   T s , i + 1 T s , i U l   .   A s , i   .   ( T s , i T a )
The energy balance for the final node is as follows:
M s , N   .   c p   .   d T s , N d t = m ˙ c o l   .   C p   .   T s , N 1 T s , N + m ˙ l o a d   .   C p   .   T L , o T s , N U l   .   A s , N   .   ( T s , N T a )
where Ms,i, is the mass of the heat transfer fluid of ith layer of the thermal storage ( ρ . V t a n k / N ), m ˙ c o l is the mass flow rate of the heat transfer fluid of the solar collector, m ˙ l o a d is the mass flow rate of the load heat transfer fluid, and U l   and A s , i are the overall heat loss heat transfer coefficient and heat transfer surface area of the thermal storage layer. The required hot water storage tank volume can be determined using the following equation:
V t a n k = S v . A c
where, S v is assumed to be 0.033 m3/m2 for one solar collector unit [35].

4.3. Refrigerant Vessel

The refrigerant store is a pressurized container that forms part of the cooling system thermodynamic cycle. It houses the heat exchanger that supplies heat from the heat source (thermal storage) to the constant-volume superheated refrigerant. The heat transfer duty of the heat exchanger can be calculated as:
Q L o a d = m ˙ c o l   C p , l   T L , i n T L , o
where T L , i n and T L , o are the heat exchanger fluid inlet and outlet temperature. To maintain the superheated state of the refrigerant at the exit of the heat exchanger, a 5 °C temperature difference is maintained between the heat exchanger fluid outlet temperature and the refrigerant temperature ( T L , o T 3 ≥ 5 °C) [36]. Similarly, the heat transfer rate to the refrigerant is determined as follows:
Q H S = m ˙ c o n h 3 h 2
In this study, the refrigerant store efficiency ( η R S ) is assumed to be (0.8), and the mass flow rate of the heat source fluid ( m ˙ c o l ) is a function of the other design and operating parameters of the system. This is expressed as:
m ˙ c o l = m ˙ c o n h 3 h 2 η T S   C p , l   T L , i n T L , o  

4.4. TMVC System Mathematical Model Formulation

The thermodynamic mathematical model of the TMVC system was developed by applying fundamental thermo-fluid principles to the conventional vapor compression cycle, ejector, and heat transfer from the solar thermal system. In developing the model, the following assumptions were made:
  • The system operates under fully established steady-state conditions.
  • Heat losses and pressure drops in the system’s components are negligible.
  • The refrigerant at the suction line (point 1) and (point 8) is superheated, and in the discharge line (point 4), it is supercooled.
  • The refrigerant in the ejector is considered a one-dimensional homogeneous equilibrium flow and undergoes constant-pressure mixing at point (10).
The thermodynamic cycle of the basic mechanical vapor compression cycle is presented by the refrigerant state points 2′, 4, 7′, and 8 in Figure 2. The main governing relationships of the basic cycle are given in Table 3.
The thermodynamic analysis of the TMVC system examines the refrigerant’s characteristics at each refrigerant state point on the cycle, as described in Table 4. Initially, it is assumed that the refrigerant exits the condenser at high pressure and temperature (point 4).
At the mixing section of the ejector (point 10), the liquid- and vapor-phase refrigerant streams coexist in a mixed state. The velocity of the resulting mixture can be determined using the conservation of momentum equation as follows:
m ˙ c o n V m n + m ˙ e v V s n = m ˙ c o n + m ˙ e v V m i x
Similarly, the mass flow rate ratio, r, which is expressed as the ratio of the primary flow entering the ejector from the condenser liquid line to the total flow entering the ejector, including the primary and the secondary flow entering the ejector suction chamber, is given by:
r = m ˙ c o n m ˙ c o n + m ˙ e v
Therefore, the refrigerant flow mixture velocity in the ejector mixing area (point 10) can be written as:
V m i x = η m i x ( r V m n + 1 r V s n )
An important characteristic of the ejector is the pressure lift created between the suction line and the diffuser, which can be expressed as:
P l i f t = P 11 P 8

4.5. System Energy Performance Parameters

The energy balance at the evaporator and condenser can be expressed as follows:
Q e v , T M V C = m ˙ e v ( h 8 h 7 )
Q c o n , T M V C = m ˙ c o n ( h 3 h 4 )
The mechanical work required by the mechanical compressor to perform refrigerant vapor compression in the first stage can be determined as:
W c o m p , T M V C = m ˙ c o n ( h 2 , i s h 1 ) η i s η m e c h
where the compressor isentropic efficiency is expressed by (Brunin, 1997) [39]:
η i s = 0.874 0.0135 P d i s c P s u c
The electrical coefficient of performance (COP) of the cycle is then determined as:
C O P T M V C = Q e v , T M V C W c o m p , T M V C
The effectiveness of TMVC compared to BVC in improving the system performance can be determined by:
C O P i m p , m e c h = C O P T M V C C O P B V C C O P B V C
The percentage electricity saving by the TMVC system compared to the BVC can be calculated as follows:
E S = W c o m p ,   T M V C W c o m p , B V C W c o m p , B V C

4.6. Exergy Performance Analysis

Thermodynamic processes in cooling systems involve large amounts of heat exchange with the environment at a finite temperature difference, which is one of the main energy irreversibility that cause performance degradation. Exergy analysis is a robust tool in the design, optimization, and performance evaluation of complex energy systems and is a well-established technique that aims to determine the maximum performance of the system. In this paper, exergy analysis was applied to the TMVC cooling cycle and associated thermal store and heat exchangers. The thermal exergy associated with a quantity of heat, Q, transferring into or out of a process at an absolute temperature, T, in an environment having a dead-state temperature, To, can be expressed as follows.
E = Q . 1 T o T
The exergy flow of the cooling load at the evaporator, given by Equation (59) [40], considers the ambient temperature T a as T o , and T r represents the indoor room temperature, assumed to be 23 °C.
E e v p = Q e v p . 1 T a T r
The exergy flow of the heat supplied by the solar thermal collectors is calculated by Equation (60) [41]:
E H S = Q H S . 1 T a T 3
The useful exergy output from the solar thermal collector is given by Equation (61) [42]:
E Q u = Q u m ˙ c o l . C p . T o . l n T c o l , o T c o l , i
The exergy flow of solar energy is calculated on the basis that the Sun is a radiation reservoir. According to Petela [43], this can be presented as Equation (62).
E s = Q s . 1 4 3 . T a T s u n + 1 3 . T a T s u n 4
where the apparent Sun temperature, T s u n , is taken as 4350 K, which is approximately 75% of the Sun’s apparent black body temperature [44].
The exergy efficiency represents the ratio of the useful exergy output to the exergy input. The exergy efficiency of the solar collector, cooling system (TMVC), and overall system are given by Equations (63)–(65), respectively.
η e x , c o l = E Q u E s
η e x , c s = E e v p W c o m p , T M V C + E H S
η e x , s y s = E e v p W c o m p , T M V C + E s

5. Simulation Parameters

Table 5 summarizes the main parameters employed in analyzing the steady-state operation conditions of the cooling system.
The computer model of the thermodynamic cycle of the cooling system and associated solar collector required area is outlined in the flowchart shown in Figure 3. The governing mathematical relationships of the design of the system are included for clarity.
The data for the four types of solar collectors (EFPC, CPC, ETC, and FPC) and the storage tank costs used in the comparative cost analysis are presented in Table 6.
The cost analysis scenarios for each design variant include the costs of the solar collectors required for each type and the storage tank, while the costs of the other equipment are assumed to be the same across all cases and were therefore excluded from the comparison.
The capital cost, CC, is therefore calculated as follows:
C C = K C . A c + K V . V
where K C is the cost of a solar collector per square meter, and K V is the cost of a storage tank per cubic meter.

6. Model Verification

The accuracy of the computational model for both the basic mechanical vapor compression cycle with and without the integrated second-stage thermal compression assisted by solar energy was verified by comparing the results with those presented by Bellos et al., 2017 [41]. Bellos et al. [41] studied a single-stage mechanical vapor compression system integrated with an evacuated-tube solar collector and a three-layer temperature-stratified hot water storage tank. Their setup featured a refrigerant pressure vessel that was heated by an immersed heat exchanger coil, transferring heat from the hot water fluid to the refrigerant in the vessel for constant-volume compression. The pressure vessel served as a second-stage thermal compressor, facilitating thermal compression through an isochoric process. The pressure in the vessel was controlled through a valve which opened when the condenser pressure was reached and discharged the refrigerant to the condenser.
In this comparative analysis, five condenser and evaporator temperatures were selected for the basic vapor compression cycle to compare the COP and exergy efficiency η e x , c s of the cooling system. For the mechanical vapor compression cycle integrated with solar thermal energy, the solar collector area per kW of cooling capacity was used as a key metric for comparison between the present study and the reference above. The validation of the model results, summarized in Table 7, showed a strong agreement and high accuracy between the current computer model and the reference data.

7. Results and Discussion

The impact of the condenser temperature T c o n d , pressure ratio P 2 / P 3 , and the inlet temperature of the refrigerant store T s , 1 on the cooling system energy and exergy performance is explained in detail in this section. Additionally, the critical surface area and thermal performance of the different types of solar thermal collectors are examined.

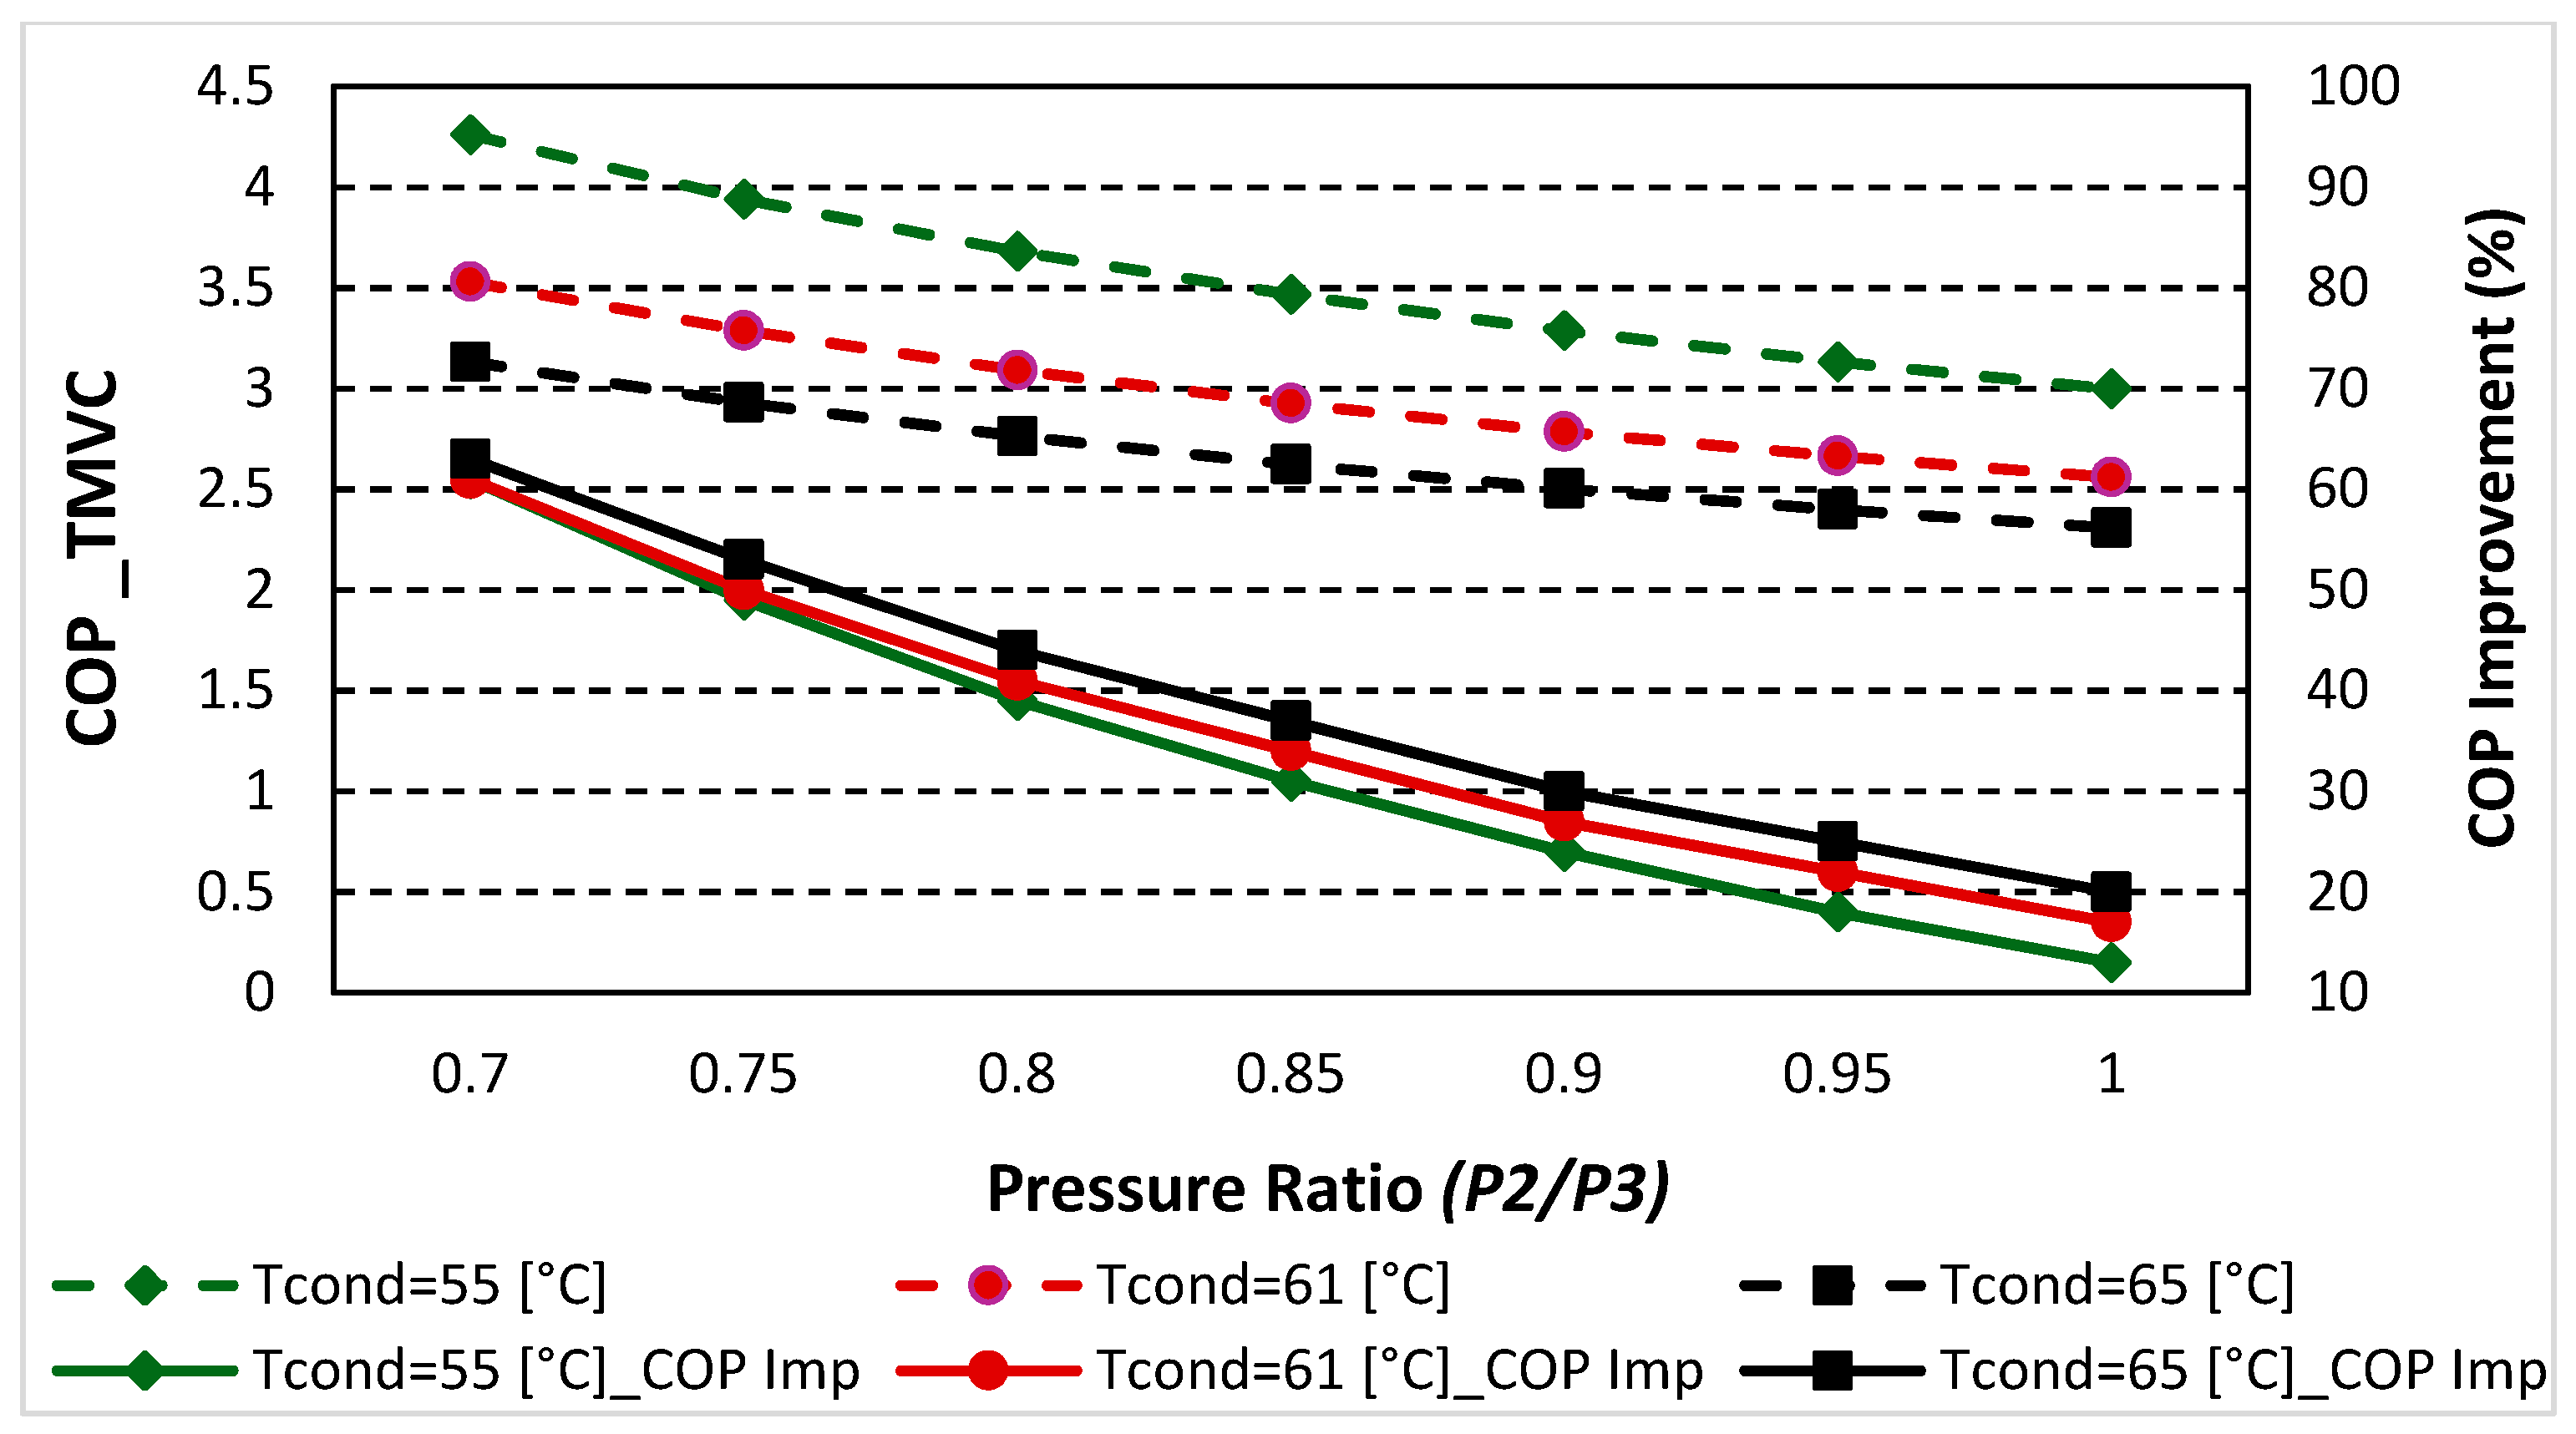
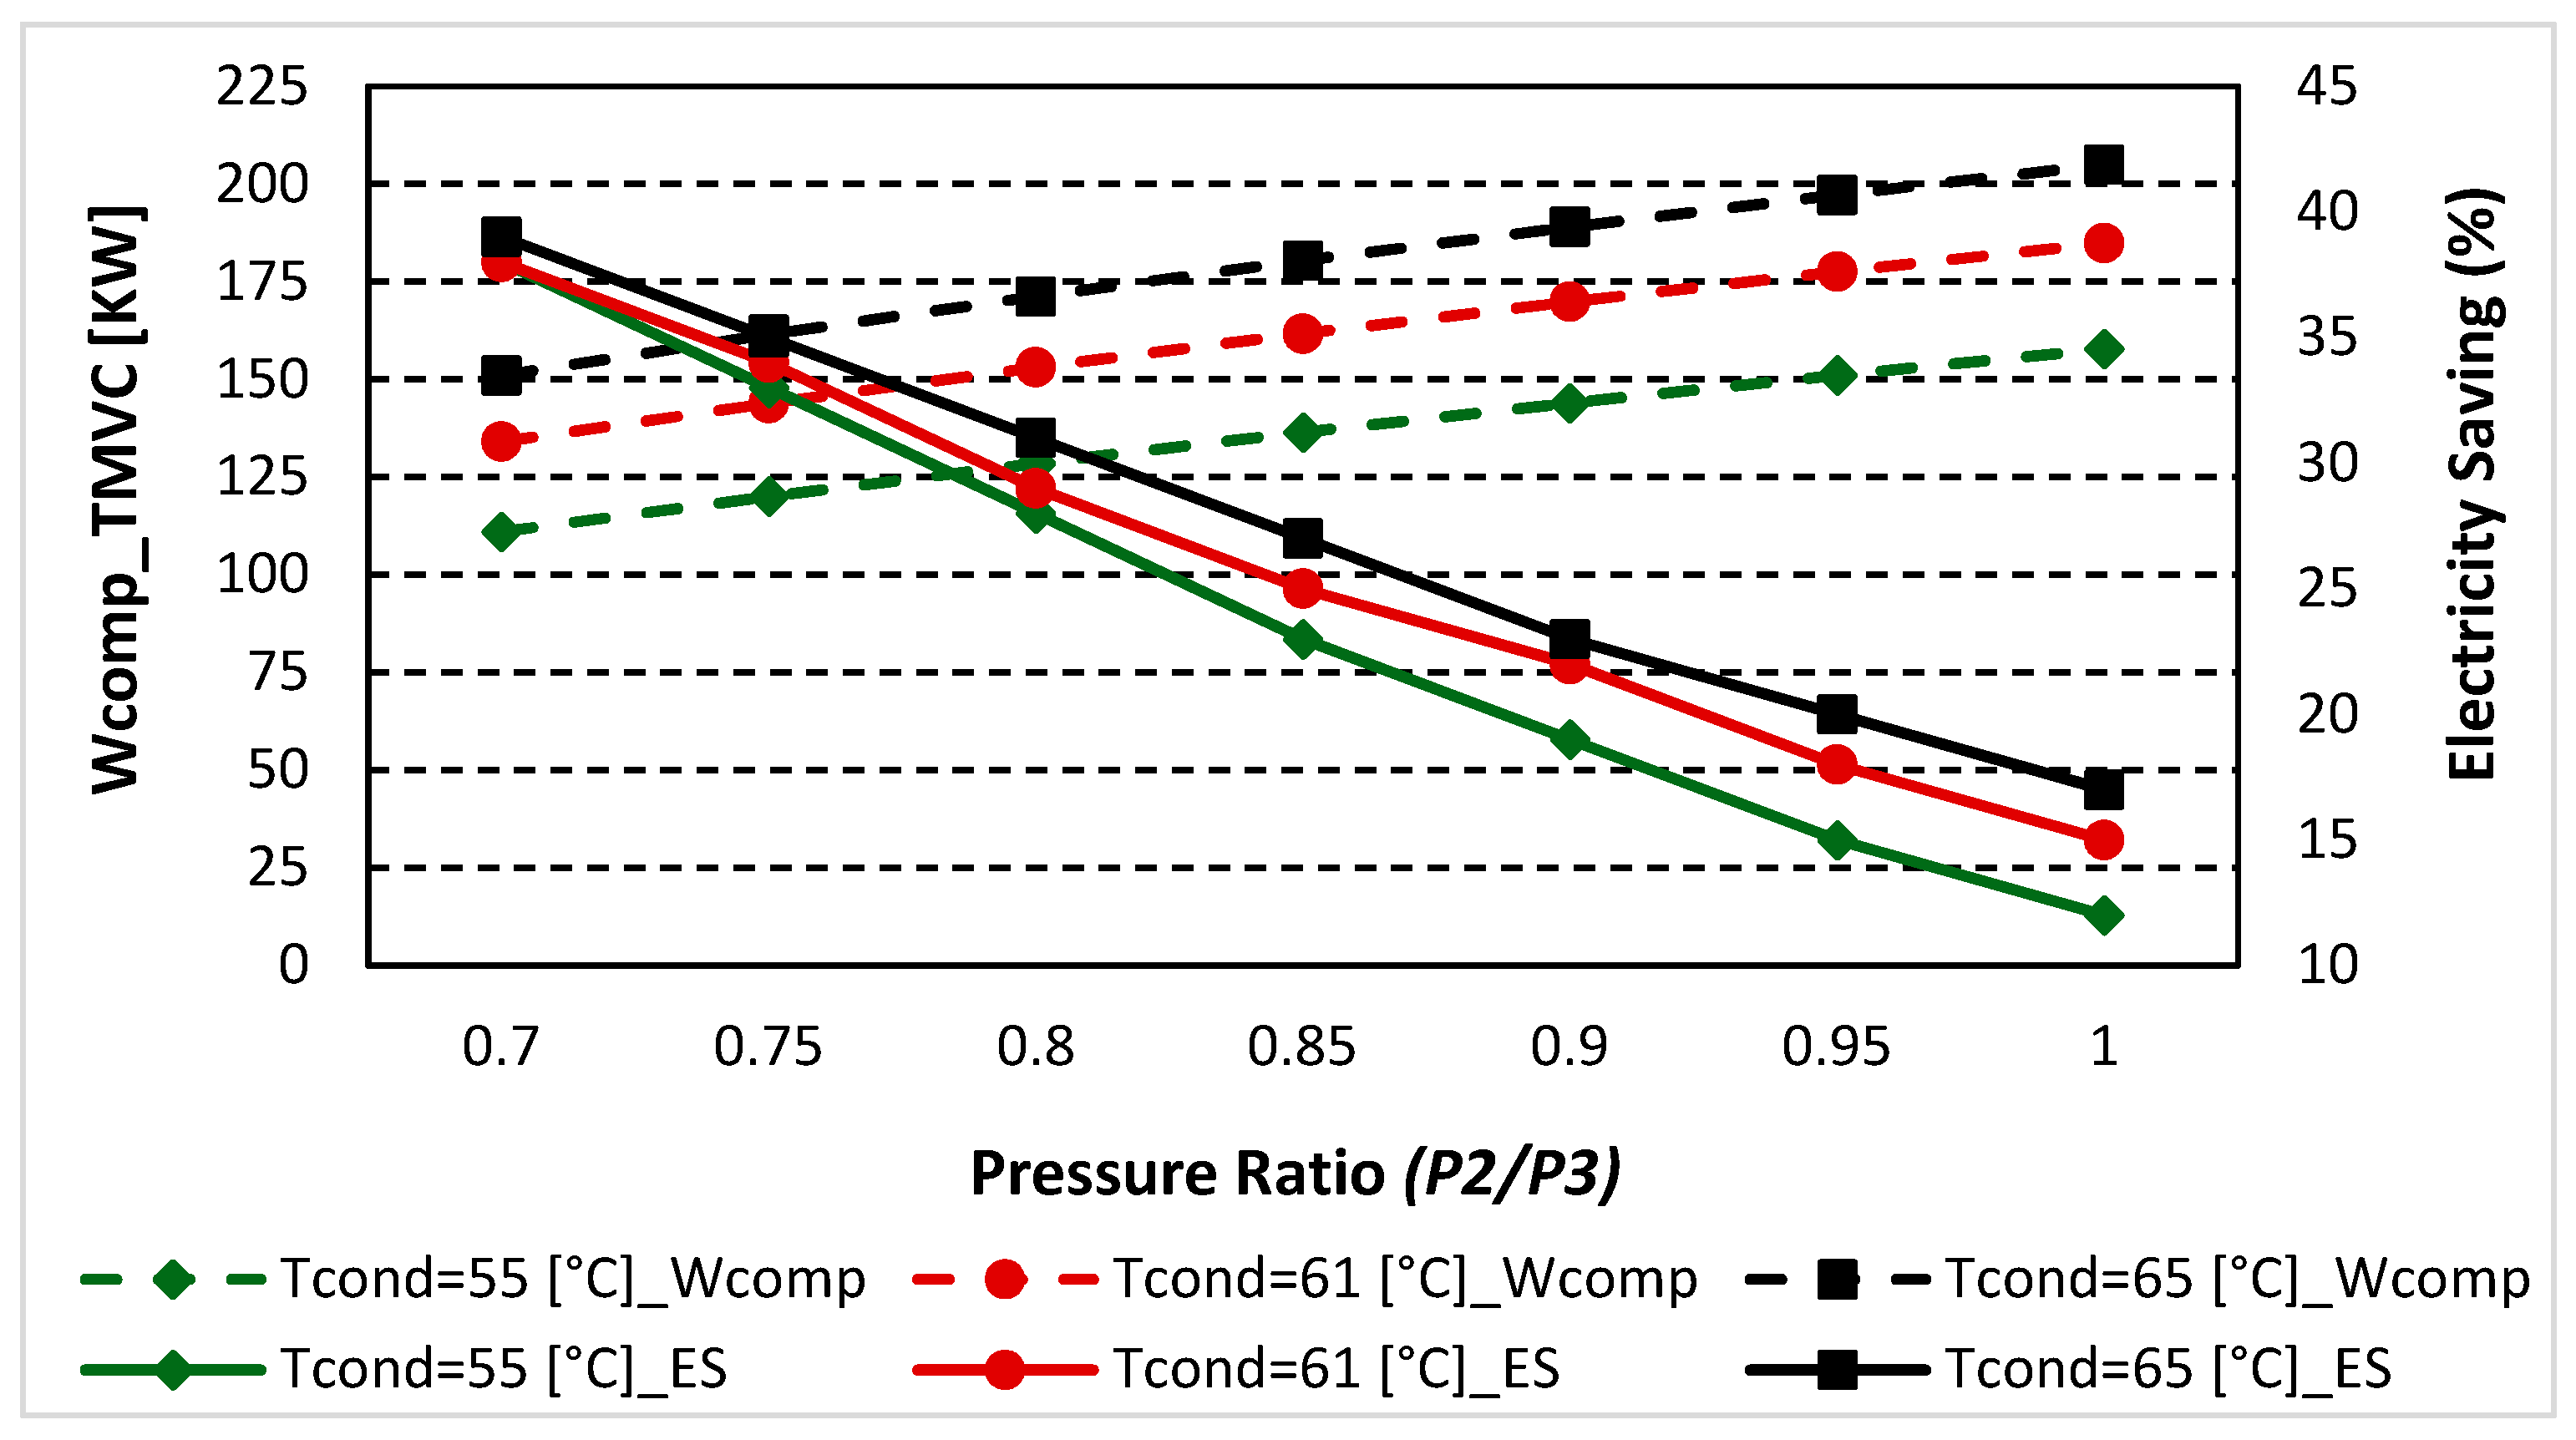
7.1. Effect of Condenser Temperatures and Thermal Pressure Ratio

The effect of the pressure ratio P 2 / P 3 and condenser temperature on the TMVC performance is shown in Figure 4. It can be seen that the COP of the cooling system was highest at low pressure ratios. This can be explained by the effective use of available external solar energy for the refrigerant thermal compression process, which, in turn, improved the COP of the cycle. It can also be seen that the COP improvement decreased from 61.4% to 17.08% as the pressure ratio increased from 0.7 to 1.0 at a condenser temperature of 61 °C. This indicates that at a higher pressure ratio, the compressor work was increased to satisfy the required cooling load. Equally, increasing the condenser temperature from 55 to 65 °C improved the COP, as this led to an increased ejector pressure lift ratio (p11/p8).
Furthermore, Figure 5 highlights that the mechanical work of the compressor decreased as the pressure ratio P 2 / P 3 decreased, which, in turn, was translated into increased electricity consumption savings from 15% to 38% when the pressure ratio decreased from 1.0 to 0.7.
Figure 6 illustrates the exergy performance of the TMVC system, showing that increasing the pressure ratio increased the system’s exergy efficiency. Conversely, increasing the condenser temperature led to a decrease in the system’s exergy efficiency, as part of the refrigerant compression was achieved thermally by the heat supplied by the solar collector. For example, a high exergy efficiency of 45% was achieved for a condenser temperature of 55 °C and a pressure ratio of 1.
The thermal compression of the refrigerant in the refrigerant vessel can only be initiated when the heat transfer fluid from the thermal storage tank is above a threshold temperature. The threshold temperature of the heat transfer fluid depends on the pressure ratio, as shown in Figure 7. The threshold temperature decreased from 140 °C to 90 °C as the pressure ratio increased from 0.7 to 095. The specific solar thermal collector area required to supply the needed thermal energy also depends on the pressure ratio and the type of collector. For example, at a pressure ratio of 0.8, the solar collector was required to supply heat at a minimum temperature of 110 °C, while the solar collector area was 3.8, 2.87, 2.27, and 1.7 m2 per kW of cooling capacity for FPC, ETC, CPC, and EFPC, respectively.

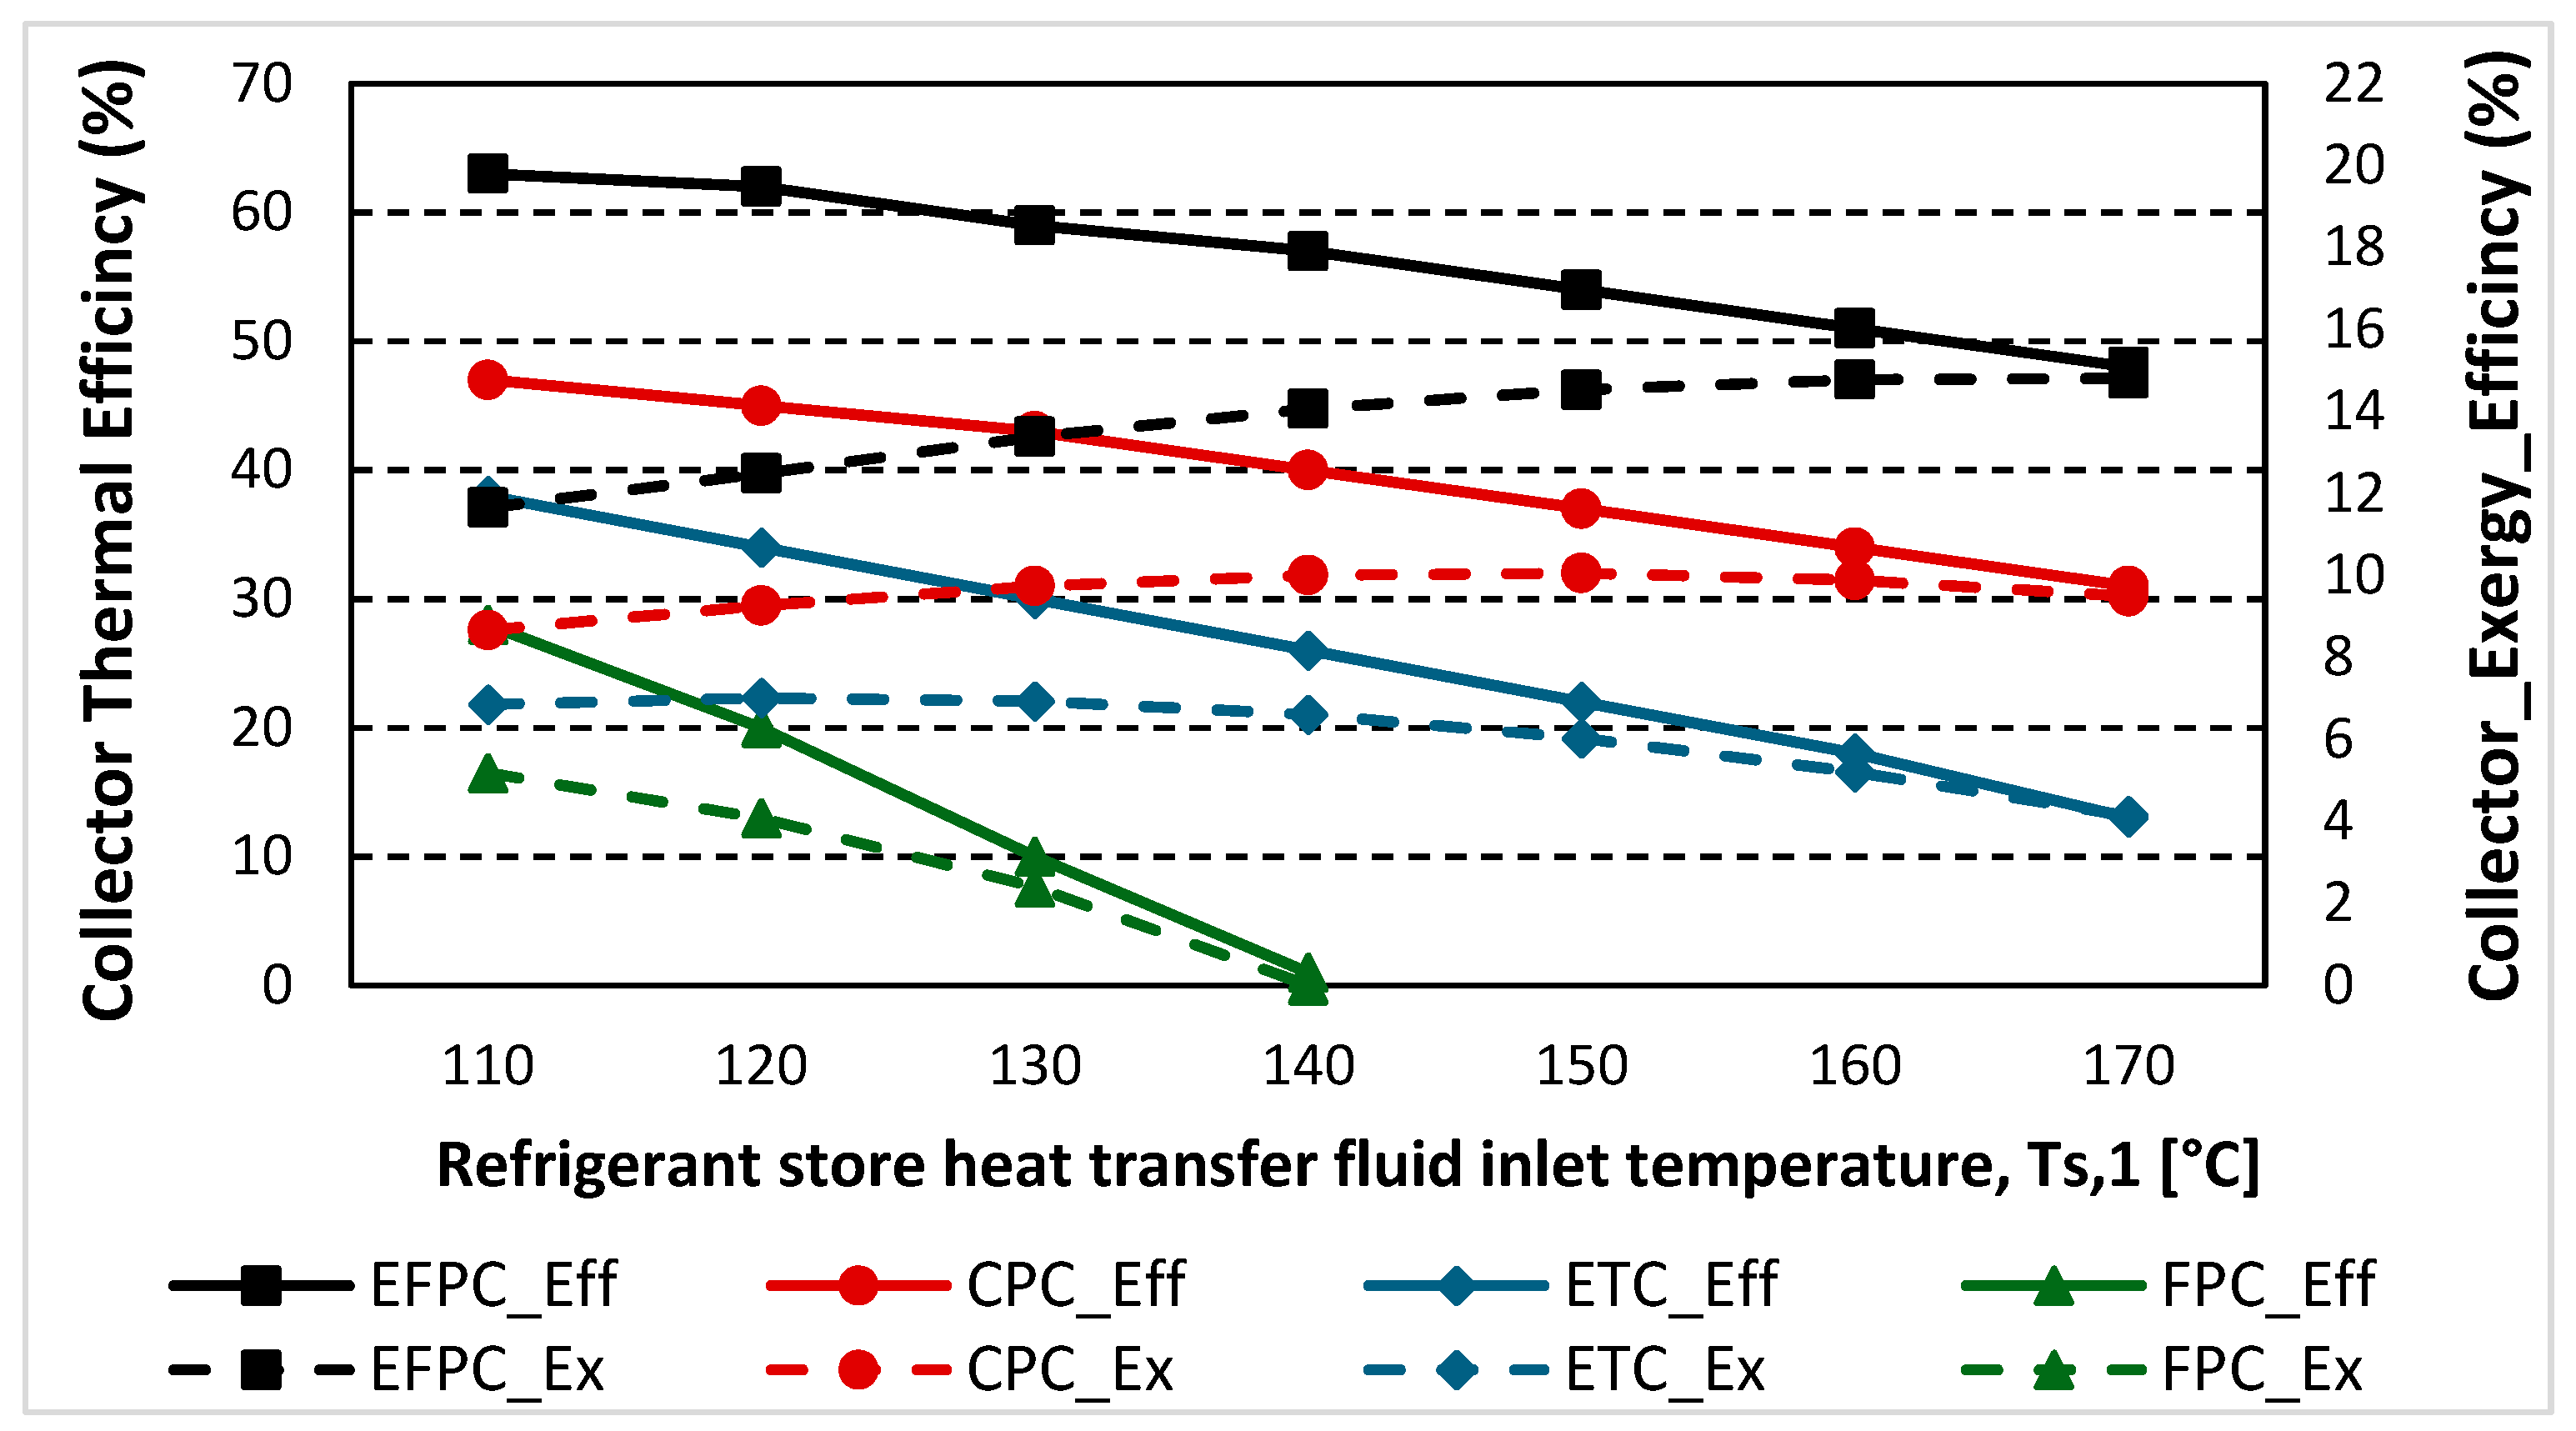
7.2. Effect of the Refrigerant Store Heat Transfer Fluid Inlet Temperature on the Solar Collector Efficiency and Exergy

Figure 8 illustrates the impact of the refrigerant store heat transfer fluid inlet temperature T s , 1 on the efficiency and exergy of the different types of solar collectors. As has been commonly established, the efficiency of solar collectors decreases with increasing heat transfer fluid inlet temperatures. The evacuated flat plate collector (EFPC) and the compound parabolic collector (CPC) exhibited better efficiency trends compared to the flat plate collector (FPC) and evacuated tube collector (ETC), particularly at high temperatures.
However, the exergy efficiency of solar collectors is a better indicator in the selection of the type of solar collector and a suitable heat transfer fluid inlet temperature. From Figure 8, it can be inferred that the evacuated flat plate collector (EFPC) exhibited the highest exergy efficiency of 15% at a heat transfer fluid inlet temperature of 170 °C. The compound parabolic collector (CPC) achieved a maximum exergy efficiency of 10% at a collector inlet temperature of around 150 °C. In contrast, the flat plate collector (FPC) and the evacuated tube collector (ETC) reached their peak exergy efficiency at lower collector inlet temperatures of around 110 °C and 120 °C, respectively. The selection of the optimum heat transfer fluid inlet temperature of the refrigerant store is important to maximize the daily amount of heat stored and to extend the number of operating hours of the cooling system when direct solar energy is not available.

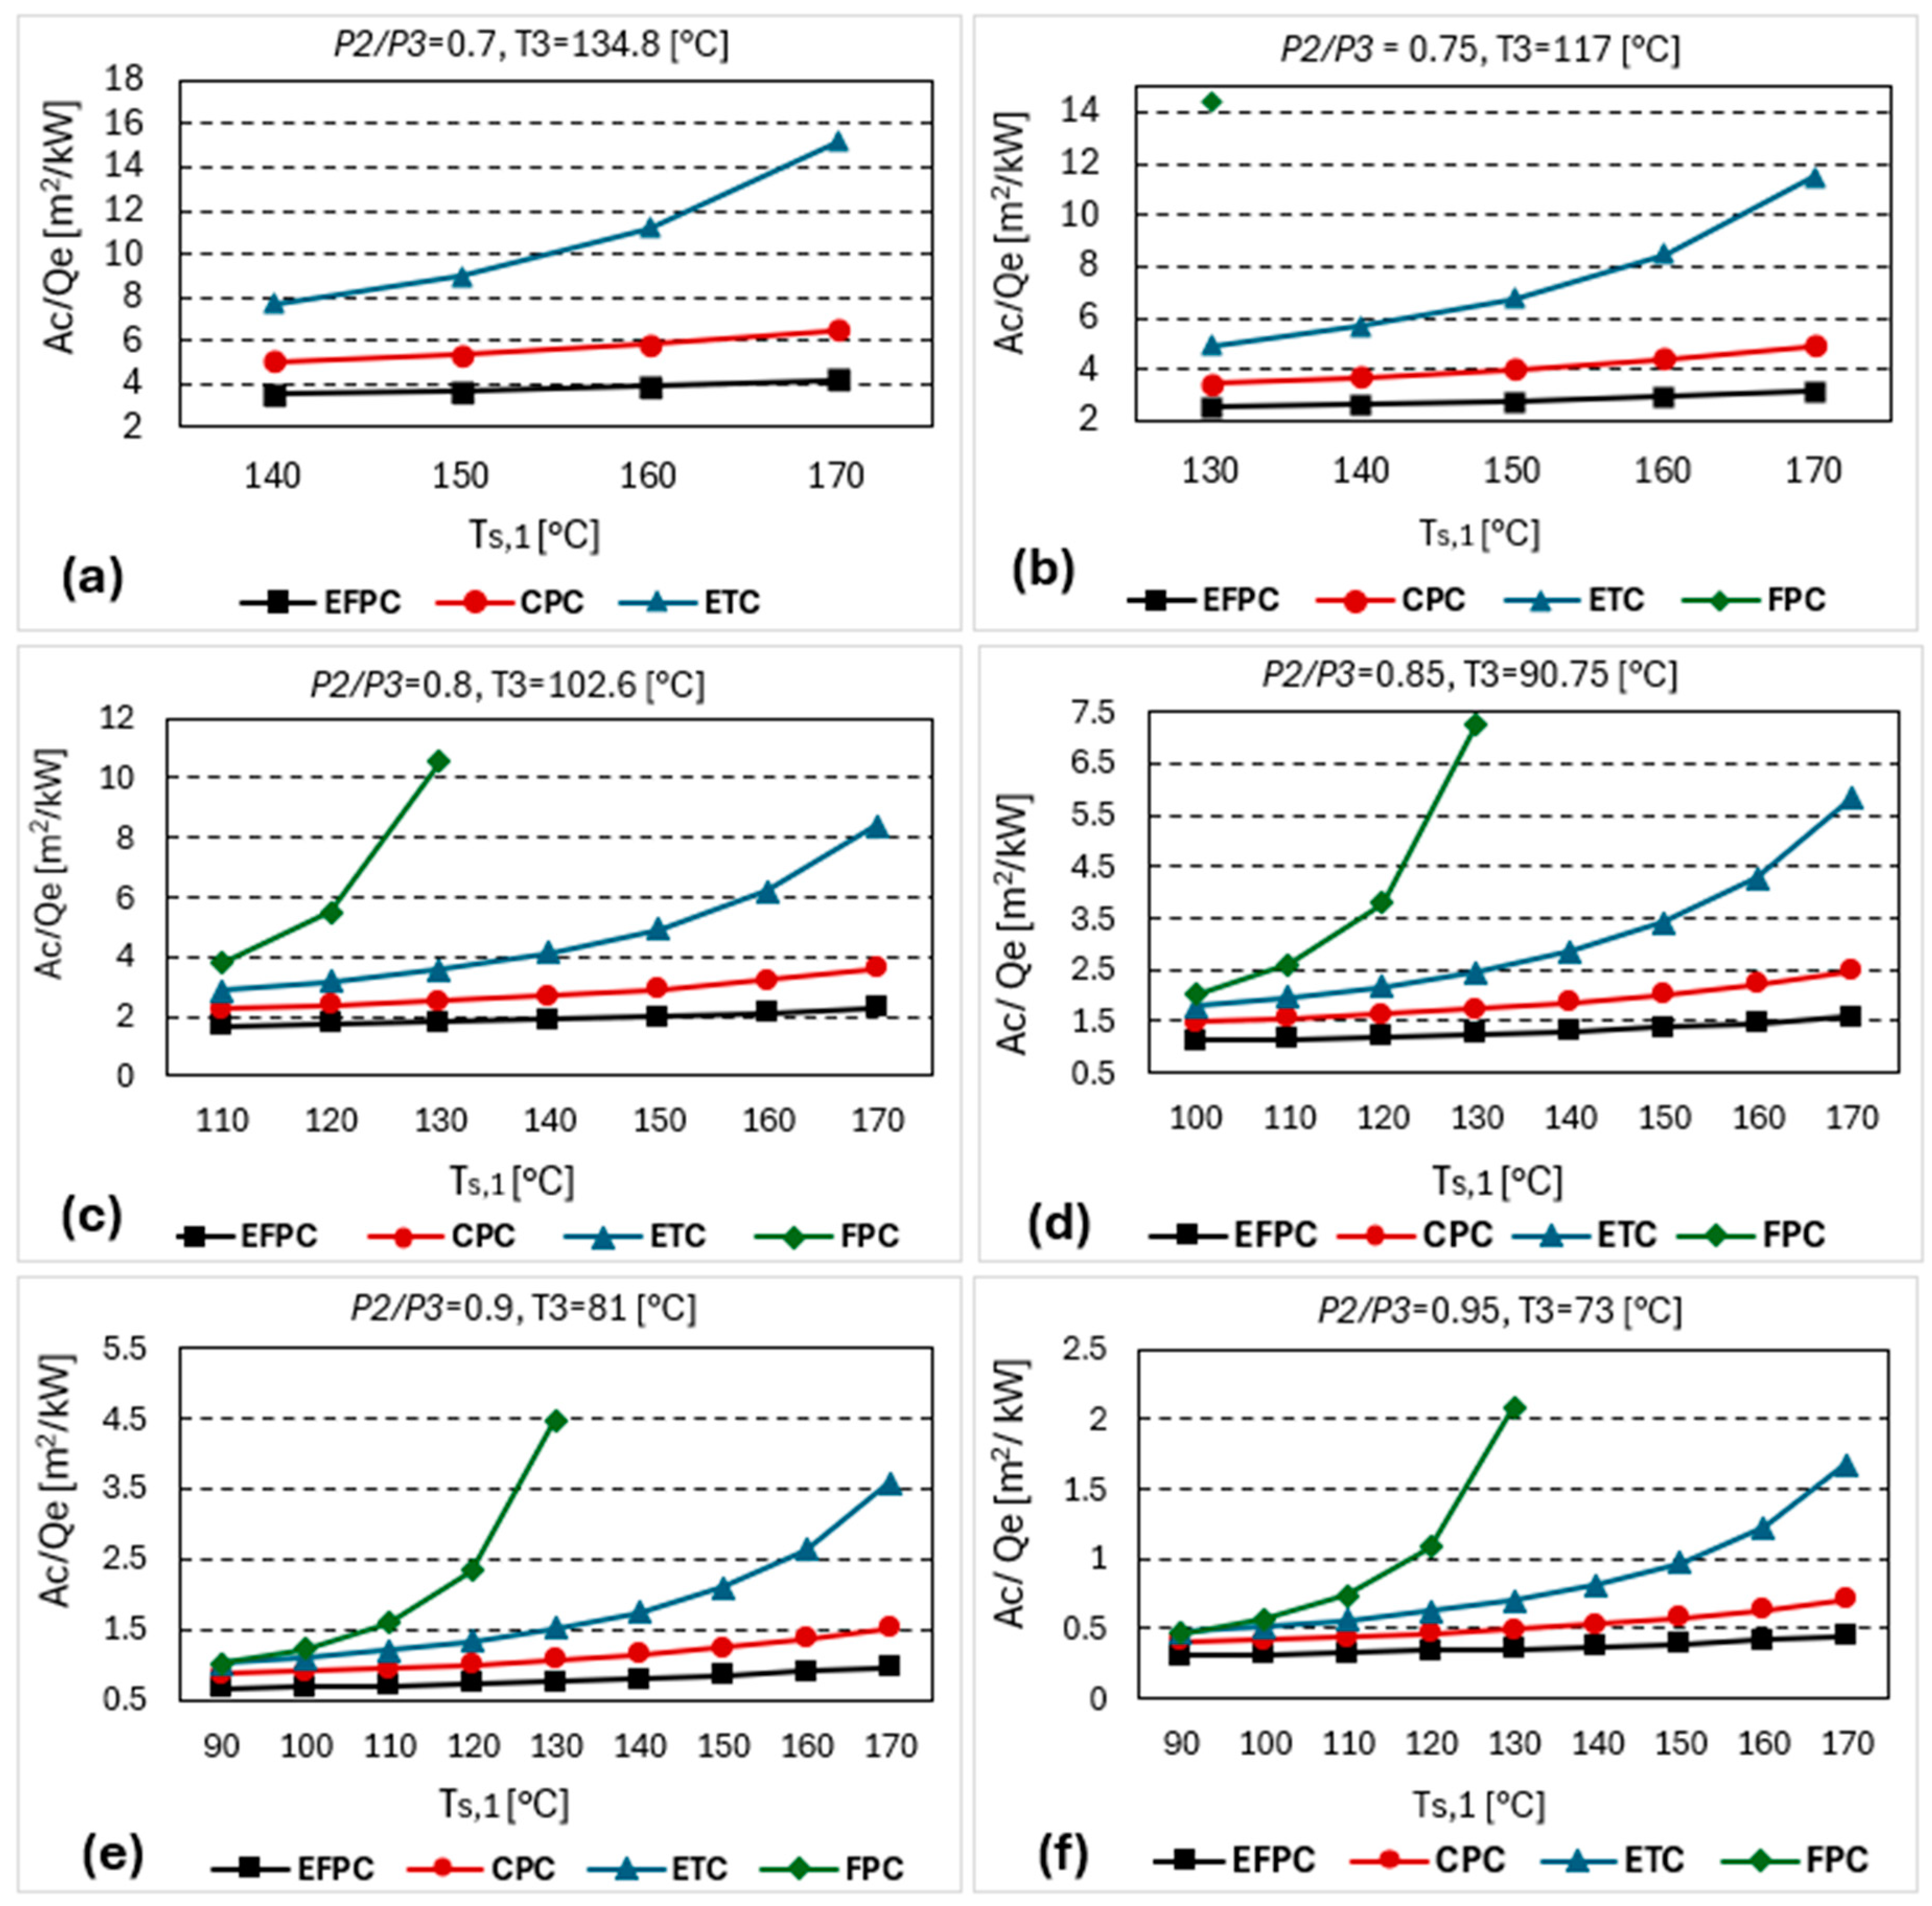
7.3. Effect of Thermal Pressure Ratio and the Refrigerant Store Heat Transfer Fluid Inlet Temperature on the Specific Collector Area

The required solar thermal collector area is expressed as a ratio of the cooling load for the evaluation of the cost effectiveness of the system. Figure 9 shows the effect of the refrigerant store heat transfer fluid inlet temperature T s , 1 on the solar collector specific area for different pressure ratios. It is worth noting that a lower pressure ratio means a higher utilization factor of the solar thermal energy and a reduced compressor mechanical work. From Figure 9, it can be observed that at a low pressure ratio and heat transfer fluid inlet temperature, a smaller specific solar collector area was required for all collector types. For example, for pressure ratio of 0.8, the evacuated flat plate collector (EFPC) required the smallest specific collector area, ranging from 2.0 m2 to 2.3 m2 per kW for cooling capacity and with heat transfer inlet temperatures of from 150 °C to 170 °C. In comparison, the compound parabolic collector (CPC) required a specific collector area ranging from 2.9 m2 to 3.6 m2, and the evacuated tube collector (ETC) required areas ranging from 4.9 m2 to 8.4 m2 under the same conditions. The flat plate collector (FPC), however, could only support a maximum inlet temperature of 135 °C, resulting in a specific collector area of 10.5 m2. Beyond this temperature, the required area for the FPC became excessively large and impractical.

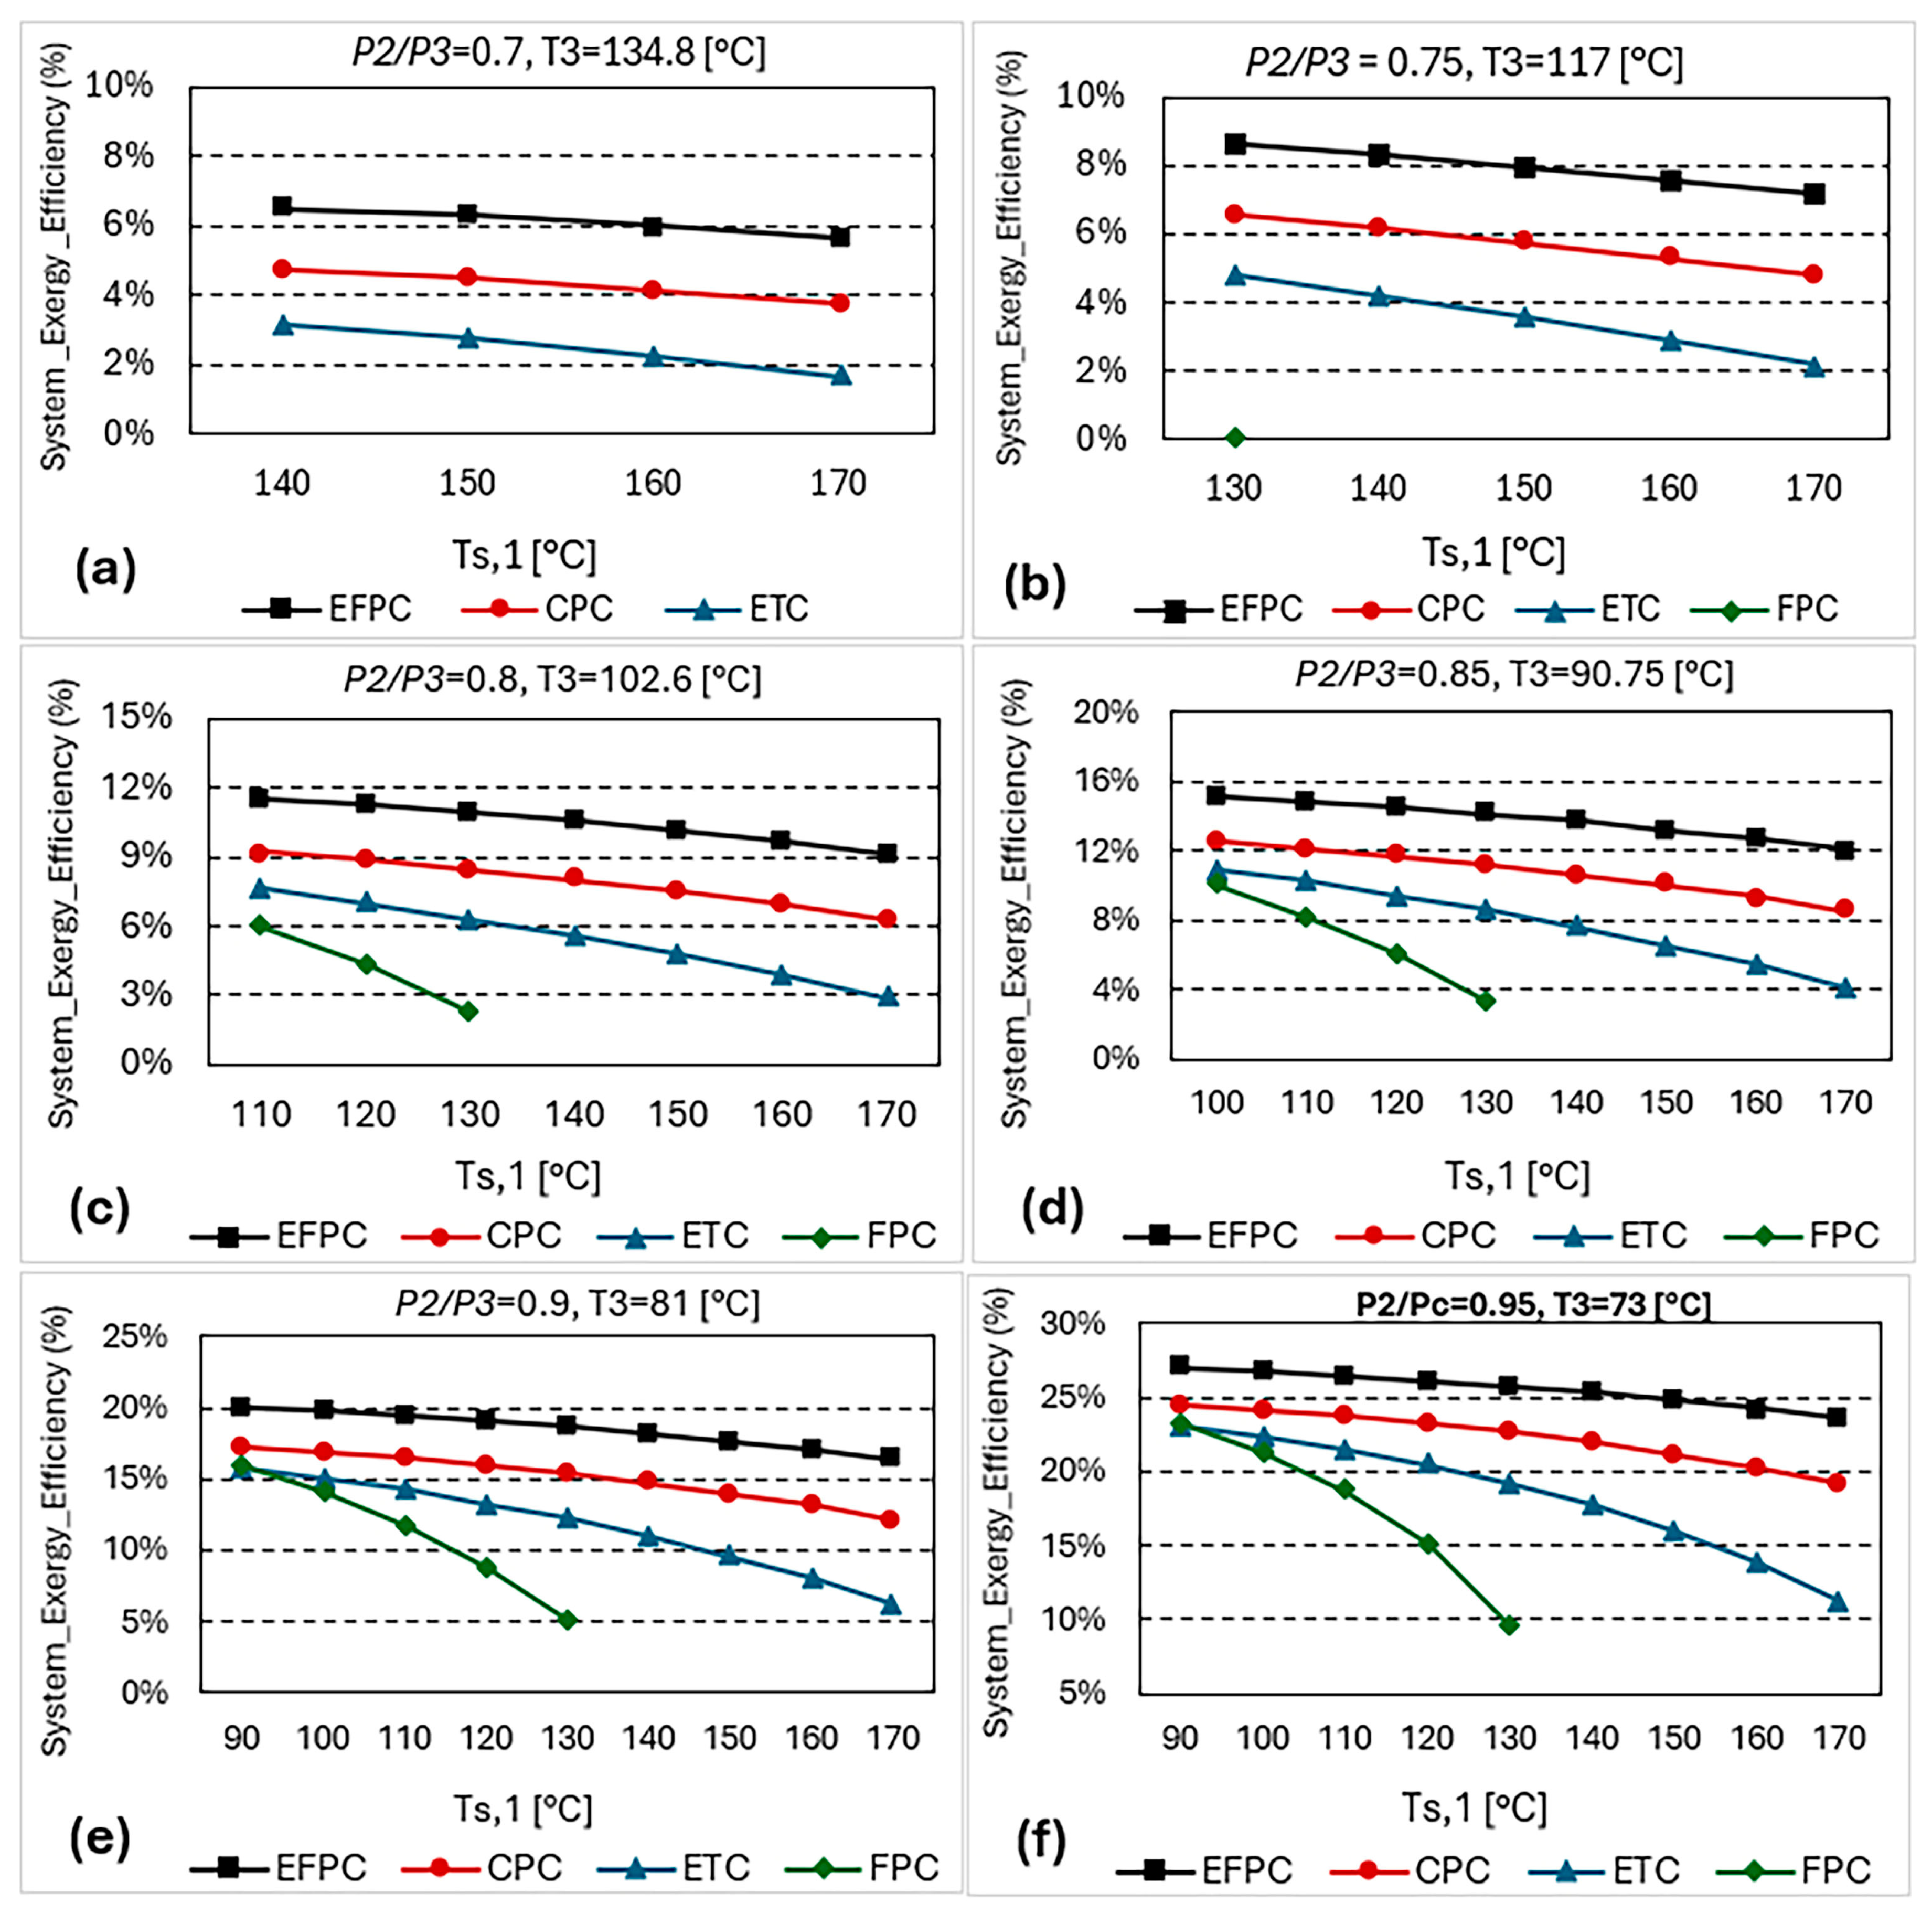
7.4. Effect of Thermal Pressure Ratio and the Refrigerant Store Heat Transfer Fluid Inlet Temperature on the Overall System Exergy Efficiency

Figure 10 shows the exergy efficiency of the total system (TMVC and the solar thermal system), which includes both the cooling and solar thermal systems. Each subfigure corresponds to different inlet hot water temperatures, from Figure 10a to Figure 10f. The exergy efficiency of the system decreased as the inlet temperature increased, primarily due to increased thermal losses from the solar collector and storage tank. This explains why the exergy efficiency of the total system was less than the product of the collector and cooling system exergy efficiencies. Among all the operating conditions, the EFPC consistently exhibited the lowest exergy destruction and highest exergy efficiency due to its lower thermal losses compared to other collector types under study. Additionally, a high pressure ratio led to an increase in the exergy efficiency of the system, reaching 24% at a pressure ratio of 0.95 and an inlet temperature of 170 °C. However, a high pressure ratio leads to lower utilization of solar energy, which is not preferred in this study. Therefore, the exergy efficiency is not a suitable index for evaluating the TMVC system’s performance because it showed a significant increase with high electricity utilization. Instead, other indexes, such as COP improvement, electricity savings, and specific collector area, should be preferred for evaluating TMVC systems.

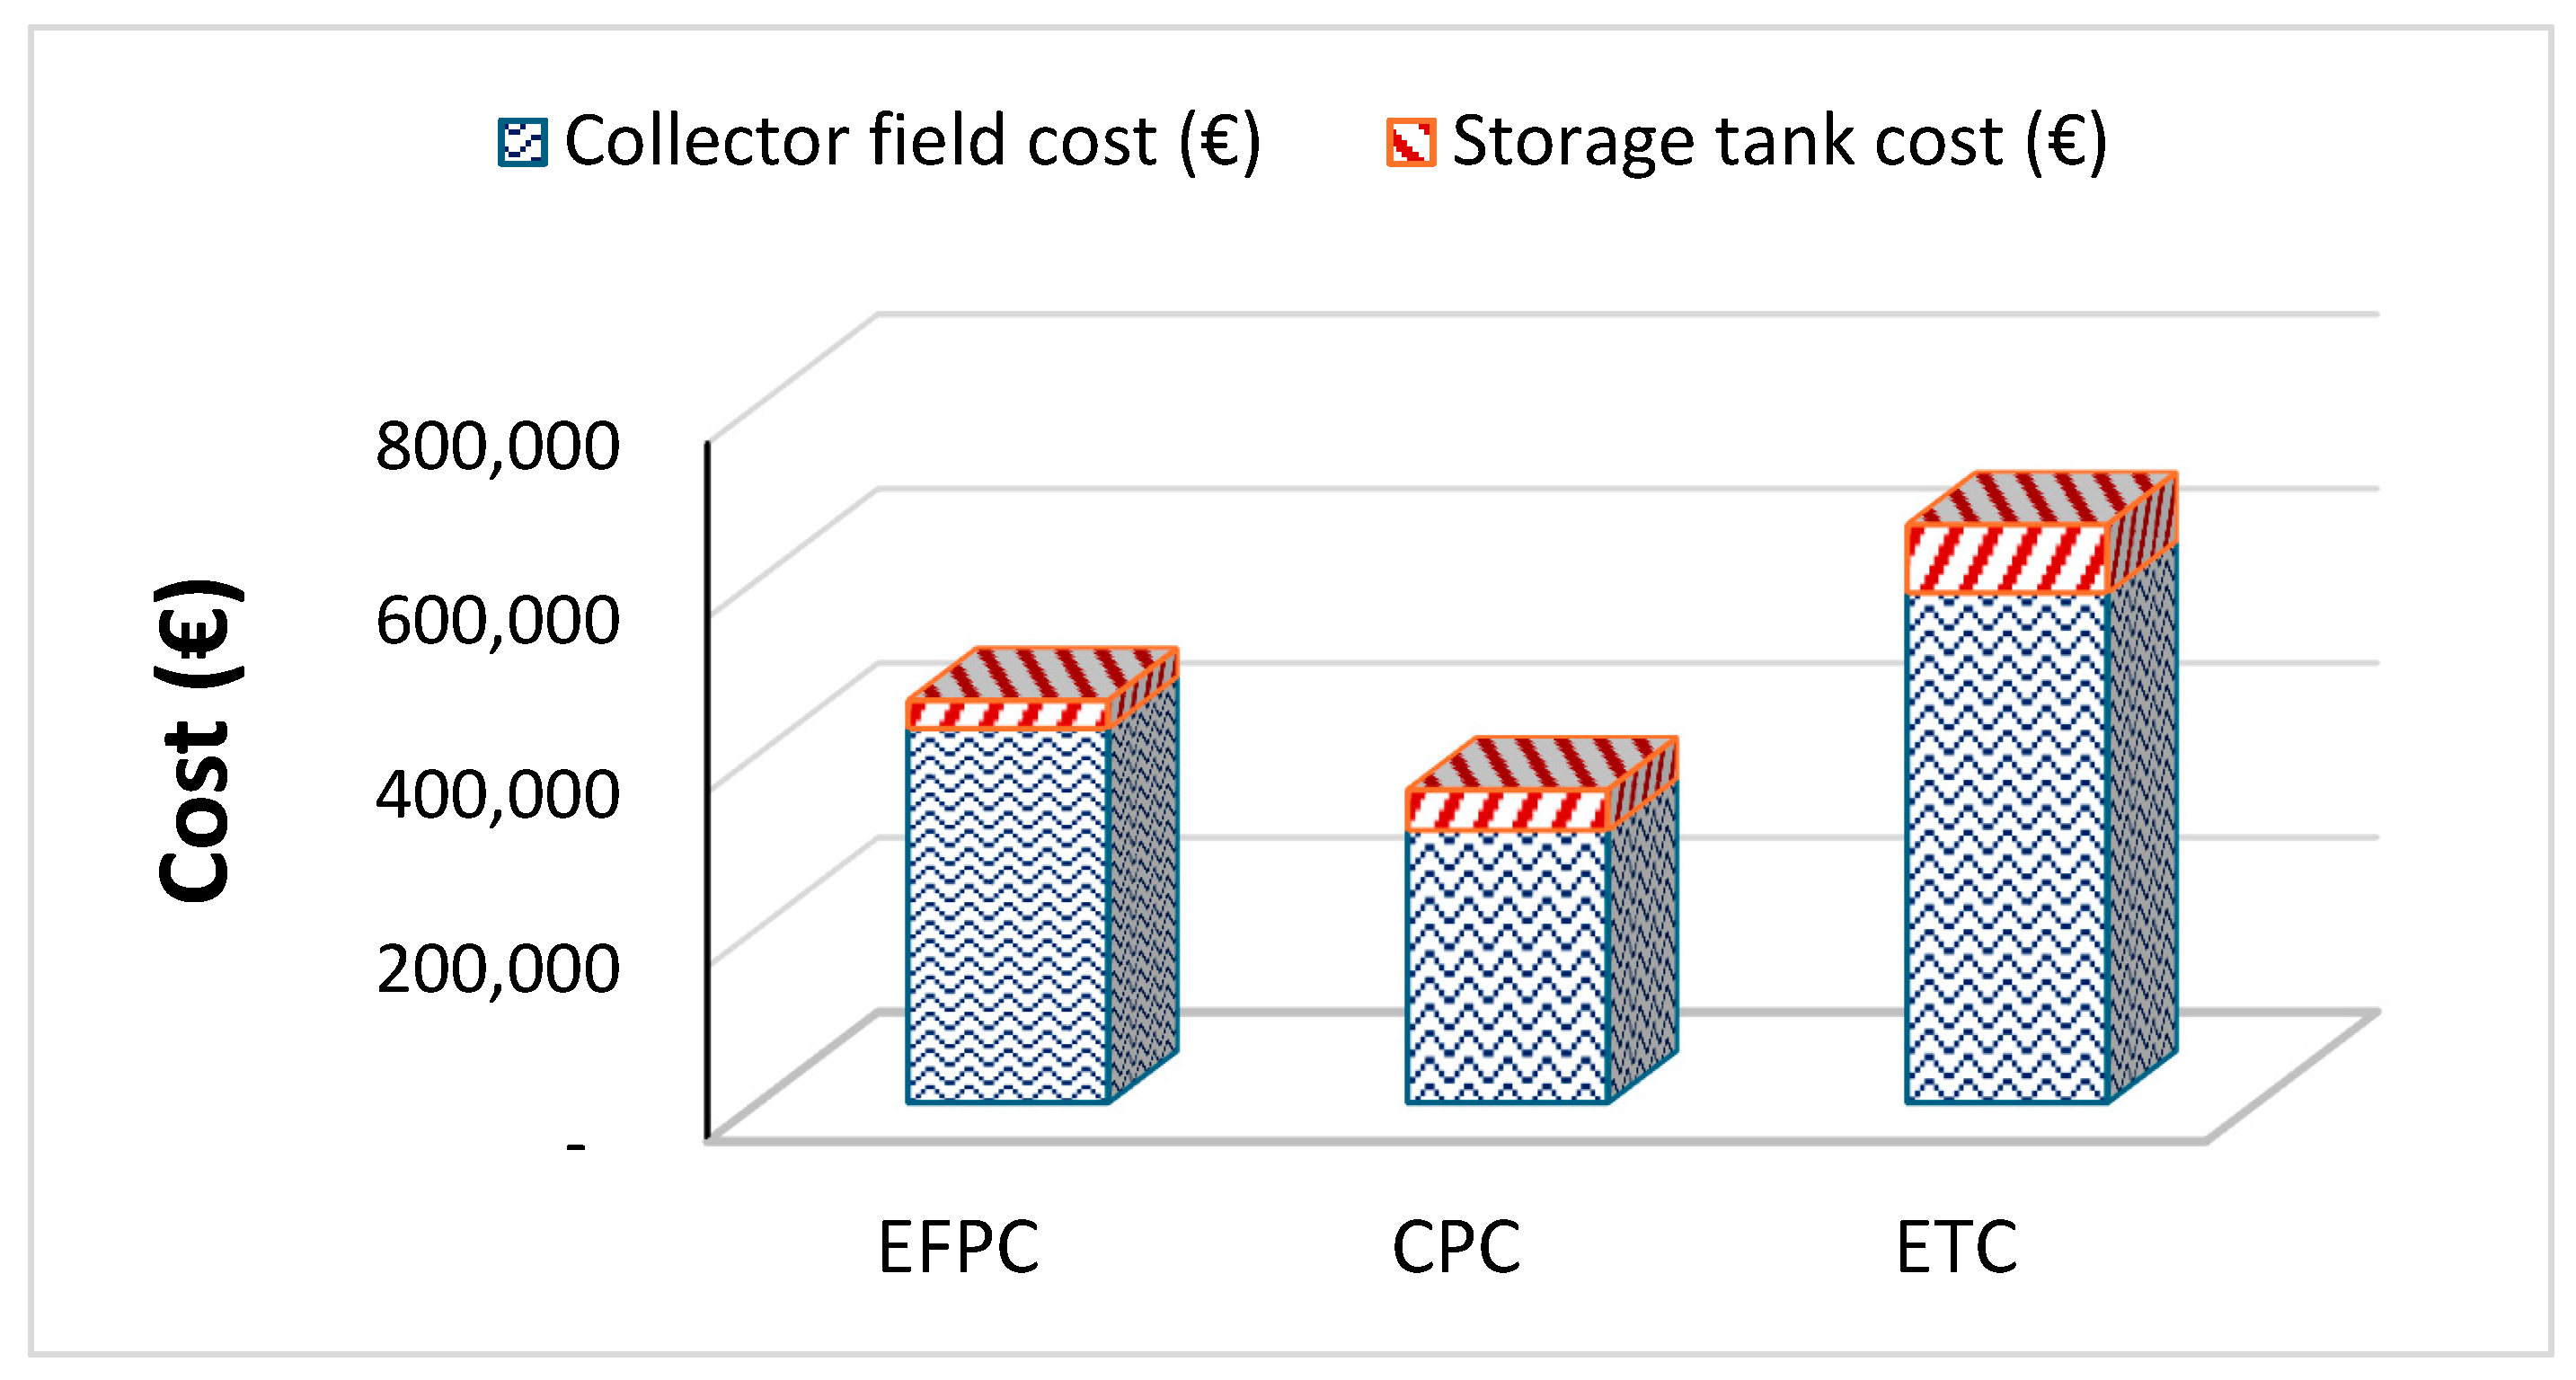
7.5. Cost of Integration of Solar Collectors

A cost analysis of integrating the three types of solar collectors was carried out to identify a cost-effective technology for operating the TMVC system. The main design factors considered included the following:
  • Solar collector thermal and exergy efficiency
  • Operating temperature
  • Solar collector area
  • Capital and maintenance cost
Based on the previous results, it was determined that for a system with operating parameters of a pressure ratio of 0.8 and a heat transfer fluid inlet temperature of 150 °C, an EFPC with a specific area of 2 m2/kW can be selected. Alternatively, CPC and ETC solar collectors may also be considered, requiring specific areas of 3 m2/kW and 5 m2/kW, respectively. The full details of the parameters of the analysis is given in Table 8.
A comparative cost analysis of the solar collectors is shown in Figure 11. The CPC collector system had the lowest initial cost at EUR 358K. However, the EFPC system offers a more cost-competitive solution at EUR 460K, followed by the ETC system at EUR 662K. The EFPC system has an additional advantage in that it offers a smaller footprint.

8. Comparison of Solar Cooling Technology

Table 9 provides an overview of various solar cooling systems implemented in different regions globally, highlighting the diversity of solar collectors employed and comparing them with the proposed (TMVC) systems integrated with evacuated flat plate collectors (EFPCs). The data clearly indicate that the TMVC system, when operated with an EFPC at a thermal pressure ratio of 0.8 and a hot water inlet temperature T s , 1 ranging from 110 °C to 170 °C, exhibits a competitive specific collector area compared to other solar cooling technologies. These findings underscore the sustainability and efficiency of the proposed TMVC system in solar cooling applications.

9. Conclusions

This study presented a solar-assisted hybrid cooling system for air conditioning applications in buildings. The hybrid cooling system consists of two vapor compression stages: a mechanically driven vapor isentropic compression process and a constant-volume thermally driven process. Three solar thermal collectors and a thermal store were considered for thermal energy supply and storage. The main goal was to maximize the use of solar energy to reduce the compressor mechanical work. Compared to the basic vapor compression cycle, the proposed TMVC cooling system demonstrates a coefficient of performance (COP) improvement of up to 44% and electricity savings of up to 31% at a condenser temperature range of from 55 °C to 65° C. Furthermore, the analysis showed that there was a close correlation between the solar collector specific area, the minimum thermal store temperature, and the thermodynamic cycle refrigerant vapor pressure ratio. For example, increasing the pressure ratio led to a decrease in the required collector specific area and heat transfer fluid threshold temperature. This study also investigated four types of solar thermal collectors, with EFPC emerging as the most suitable solution for minimizing the required collector area per kW of the cooling system capacity, while the CPC collector presented a more cost-effective alternative.

Author Contributions

Conceptualization, H.A.A.K. and R.B.; methodology, H.A.A.K. and R.B.; software, H.A.A.K.; validation, H.A.A.K.; formal analysis, H.A.A.K.; data curation, H.A.A.K.; writing—original draft preparation, H.A.A.K.; writing—review and editing, H.A.A.K. and R.B.; visualization, H.A.A.K.; supervision, R.B. All authors have read and agreed to the published version of the manuscript.

Funding

This research received no external funding.

Data Availability Statement

Data available upon request.

Acknowledgments

The authors would like to acknowledge “The Higher Committee for Education Development in Iraq” for providing financial support through a student scholarship.

Conflicts of Interest

The authors declare no conflict of interest.

Nomenclature

VariableDescription/Unit
C O P Coefficient of performance
h Refrigerant specific enthalpy (kJ/kg)
m ˙ Working fluid mass flow rate (kg/s)
P Pressure (kPa)
Q c o n Condenser heat (W)
Q e v Cooling capacity (W)
S Entropy (kJ/kg.K)
T Temperature (°C)
V Velocity (m/s)
W c o m p Compressor work (W)
x Vapor quality
Symbols
ƞ Efficiency
μ Entrainment ratio
v Specific volume (m3/kg)
Subscripts
B V C Basic vapor compression cycle
c o n Condenser
d i f f Diffuser
d i s c Discharge
e v p Evaporator
HSHeat source
i n t e r m Intermediate pressure
i s Isentropic
m e c h Mechanical
mnMotive nozzle
s Storage tank
S u b Subcooled
S u p Superheated
s n Suction nozzle
ueUseful
EsExergy
csCooling system
ColCollector
syssystem

References

  1. Bandyopadhyay, B.; Banerjee, M. Decarbonization of Cooling of Buildings. Sol. Compass 2022, 2, 100025. [Google Scholar] [CrossRef]
  2. Parkinson, T.; Schiavon, S.; de Dear, R.; Brager, G. Overcooling of Offices Reveals Gender Inequity in Thermal Comfort. Sci. Rep. 2021, 11, 23684. [Google Scholar] [CrossRef] [PubMed]
  3. International Energy Agency. The Future of Cooling: Opportunities for Energy-Efficient Air Conditioning. Together Secure Sustainable. 2018. Available online: https://www.iea.org/reports/the-future-of-cooling (accessed on 15 August 2024).
  4. Mastrucci, A.; van Ruijven, B.; Byers, E.; Poblete-Cazenave, M.; Pachauri, S. Global Scenarios of Residential Heating and Cooling Energy Demand and CO2 Emissions. Clim. Change 2021, 168, 14. [Google Scholar] [CrossRef]
  5. Mathur, D. A Review on Solar Cooling Technologies. Int. J. Mech. Eng. Technol. 2020, 11, 12–21. Available online: https://iaeme.com/MasterAdmin/Journal_uploads/IJMET/VOLUME_11_ISSUE_5/IJMET_11_05_002.pdf (accessed on 15 August 2024). [CrossRef]
  6. Bilgili, M. Hourly Simulation and Performance of Solar Electric-Vapor Compression Refrigeration System. Sol. Energy 2011, 85, 2720–2731. [Google Scholar] [CrossRef]
  7. Kumar Sahu, B. A Study on Global Solar PV Energy Developments and Policies with Special Focus on the Top Ten Solar PV Power Producing Countries. Renew. Sustain. Energy Rev. 2015, 43, 621–634. [Google Scholar] [CrossRef]
  8. Nikbakhti, R.; Wang, X.; Hussein, A.K.; Iranmanesh, A. Absorption Cooling Systems—Review of Various Techniques for Energy Performance Enhancement. Alex. Eng. J. 2020, 59, 707–738. [Google Scholar] [CrossRef]
  9. Al-Yasiri, Q.; Szabó, M.; Arıcı, M. A Review on Solar-Powered Cooling and Air-Conditioning Systems for Building Applications. Energy Rep. 2022, 8, 2888–2907. [Google Scholar] [CrossRef]
  10. Hwang, Y.; Radermacher, R.; Alili, A.A.; Kubo, I. Review of Solar Cooling Technologies. HVACR Res. 2008, 14, 507–528. [Google Scholar] [CrossRef]
  11. Gündüz Altiokka, A.B.; Arslan, O. Design and Optimization of Absorption Cooling System Operating under Low Solar Radiation for Residential Use. J. Build. Eng. 2023, 73, 106697. [Google Scholar] [CrossRef]
  12. Al-Falahi, A.; Alobaid, F.; Epple, B. A New Design of an Integrated Solar Absorption Cooling System Driven by an Evacuated Tube Collector: A Case Study for Baghdad, Iraq. Appl. Sci. 2020, 10, 3622. [Google Scholar] [CrossRef]
  13. Sapienza, A.; Santamaria, S.; Frazzica, A.; Freni, A. Influence of the Management Strategy and Operating Conditions on the Performance of an Adsorption Chiller. Energy 2011, 36, 5532–5538. [Google Scholar] [CrossRef]
  14. Alahmer, A.; Ajib, S. Solar Cooling Technologies: State of Art and Perspectives. Energy Convers. Manag. 2020, 214, 112896. [Google Scholar] [CrossRef]
  15. Sim, L.F. Numerical Modelling of a Solar Thermal Cooling System under Arid Weather Conditions. Renew. Energy 2014, 67, 186–191. [Google Scholar] [CrossRef]
  16. Fasfous, A.; Asfar, J.; Al-Salaymeh, A.; Sakhrieh, A.; Al-Hamamre, Z.; Al-Bawwab, A.; Hamdan, M. Potential of Utilizing Solar Cooling in the University of Jordan. Energy Convers. Manag. 2013, 65, 729–735. [Google Scholar] [CrossRef]
  17. Angrisani, G.; Roselli, C.; Sasso, M.; Tariello, F. Assessment of Energy, Environmental and Economic Performance of a Solar Desiccant Cooling System with Different Collector Types. Energies 2014, 7, 6741–6764. [Google Scholar] [CrossRef]
  18. Bouzenada, S.; McNevin, C.; Harrison, S.; Kaabi, A. Performance of a Liquid Desiccant Air-Conditioner Driven by Evacuated-Tube, Flat-Plate, or Hybrid Solar Thermal Arrays. Energy Build. 2016, 117, 53–62. [Google Scholar] [CrossRef]
  19. Banasiak, K.; Hafner, A.; Andresen, T. Experimental and Numerical Investigation of the Influence of the Two-Phase Ejector Geometry on the Performance of the R744 Heat Pump. Int. J. Refrig. 2012, 35, 1617–1625. [Google Scholar] [CrossRef]
  20. Vidal, H.; Colle, S.; Pereira, G.D.S. Modelling and Hourly Simulation of a Solar Ejector Cooling System. Appl. Therm. Eng. 2006, 26, 663–672. [Google Scholar] [CrossRef]
  21. Chen, Q.; Hwang, Y.; Yan, G.; Yu, J. Theoretical Investigation on the Performance of an Ejector Enhanced Refrigeration Cycle Using Hydrocarbon Mixture R290/R600a. Appl. Therm. Eng. 2020, 164, 114456. [Google Scholar] [CrossRef]
  22. Elakhdar, M.; Tashtoush, B.M.; Nehdi, E.; Kairouani, L. Thermodynamic Analysis of a Novel Ejector Enhanced Vapor Compression Refrigeration (EEVCR) Cycle. Energy 2018, 163, 1217–1230. [Google Scholar] [CrossRef]
  23. Direk, M.; İşkan, Ü.; Tunçkal, C.; Mert, M.S.; Yüksel, F. An Experimental Investigation of Ejector Employed in a Dual-Evaporator Vapor Compression Refrigeration System under Various Entrainment Ratios Using R134a as the Refrigerant. Sustain. Energy Technol. Assess. 2022, 52, 102293. [Google Scholar] [CrossRef]
  24. Gullo, P.; Birkelund, M.; Kriezi, E.E.; Kærn, M.R. Comprehensive Experimental Performance Study on a Small-Capacity Transcritical R744 Vapour-Compression Refrigeration Unit Equipped with an Innovative Ejector. Int. J. Refrig. 2023, 152, 192–203. [Google Scholar] [CrossRef]
  25. Al-Yasiri, Q.; Szabó, M.; Szabo, M. Solar Absorption Cooling Systems Versus Traditional Air-Conditioning in Hot Climate. 2016. Available online: https://www.researchgate.net/publication/327781210 (accessed on 30 September 2024).
  26. Albatayneh, A.; Jaradat, M.; Al-Omary, M.; Zaquot, M. Evaluation of Coupling PV and Air Conditioning vs. Solar Cooling Systems—Case Study from Jordan. Appl. Sci. 2021, 11, 511. [Google Scholar] [CrossRef]
  27. Palomba, V.; Wittstadt, U.; Bonanno, A.; Tanne, M.; Harborth, N.; Vasta, S. Components and Design Guidelines for Solar Cooling Systems: The Experience of ZEOSOL. Renew. Energy 2019, 141, 678–692. [Google Scholar] [CrossRef]
  28. Hassan, Q.; Abbas, M.K.; Abdulateef, A.M.; Abulateef, J.; Mohamad, A. Assessment of the Potential Solar Energy with the Models for Optimum Tilt Angles of Maximum Solar Irradiance for Iraq. Case Stud. Chem. Environ. Eng. 2021, 4, 100140. [Google Scholar] [CrossRef]
  29. Duffie, J.A.; Beckman, W.A. Solar Engineering of Thermal Processes, 4th ed.; Wiley: Hoboken, NJ, USA, 2013. [Google Scholar]
  30. The Solar Keymark/CEN Keymark Scheme. Available online: https://solarkeymark.eu/database/ (accessed on 26 August 2024).
  31. Saloux, E.; Candanedo, J.A. Control-Oriented Modelling of Stratified Storage Tanks: An Enhanced Approach. Energy Procedia 2018, 193, 193–201. [Google Scholar]
  32. Bellos, E.; Tzivanidis, C.; Symeou, C.; Antonopoulos, K.A. Energetic, Exergetic and Financial Evaluation of a Solar Driven Absorption Chiller—A Dynamic Approach. Energy Convers. Manag. 2017, 137, 34–48. [Google Scholar] [CrossRef]
  33. Kleinbach, E.M. Performance Study of One-Dimensional Models for Stratified Thermal Storage Tank. Sol. Energy 1990, 50, 155–166. [Google Scholar] [CrossRef]
  34. Kutlu, C.; Li, J.; Su, Y.; Pei, G.; Riffat, S. Off-Design Performance Modelling of a Solar Organic Rankine Cycle Integrated with Pressurized Hot Water Storage Unit for Community Level Application. Energy Convers. Manag. 2018, 166, 132–145. [Google Scholar] [CrossRef]
  35. Li, T.; Liu, Y.; Wang, D.; Shang, K.; Liu, J. Optimization Analysis on Storage Tank Volume in Solar Heating System. Procedia Eng. 2015, 121, 1356–1364. [Google Scholar] [CrossRef]
  36. Kilic, M.; Kaynakli, O. Second Law-Based Thermodynamic Analysis of Water-Lithium Bromide Absorption Refrigeration System. Energy 2007, 32, 1505–1512. [Google Scholar] [CrossRef]
  37. Özgür, A.E.; Kabul, A.; Kizilkan, Ö. Exergy Analysis of Refrigeration Systems Using an Alternative Refrigerant (HFO-1234yf) to R-134a. Int. J. Low-Carbon Technol. 2014, 9, 56–62. [Google Scholar] [CrossRef]
  38. Li, H.; Cao, F.; Bu, X.; Wang, L.; Wang, X. Performance Characteristics of R1234yf Ejector-Expansion Refrigeration Cycle. Appl. Energy 2014, 121, 96–103. [Google Scholar] [CrossRef]
  39. Brunin, O.; Feidt, M.; Hivet, B. Comparison of the Working Domains of Some Compression Heat Pumps and a Compression-Absorption Heat Pump. Int. J. Refrig. 1997, 20, 97. [Google Scholar] [CrossRef]
  40. Lateef Tarish, A.; Talib Hamzah, M.; Assad Jwad, W. Thermal and Exergy Analysis of Optimal Performance and Refrigerant for an Air Conditioner Split Unit Under Different Iraq Climatic Conditions. Therm. Sci. Eng. Prog. 2020, 19, 100595. [Google Scholar] [CrossRef]
  41. Bellos, E.; Vrachopoulos, M.G.; Tzivanidis, C. Energetic and Exergetic Investigation of a Novel Solar-Assisted Mechanical Compression Refrigeration System. Energy Convers. Manag. 2017, 147, 1–18. [Google Scholar] [CrossRef]
  42. Ge, Z.; Wang, H.; Wang, H.; Zhang, S.; Guan, X. Exergy Analysis of Flat Plate Solar Collectors. Entropy 2014, 16, 2549–2567. [Google Scholar] [CrossRef]
  43. Petela, R. Exergy of Undiluted Thermal Radiation. Sol. Energy 2003, 74, 469–488. [Google Scholar] [CrossRef]
  44. Kalogirou, S.A. Solar Thermal Collectors and Applications. Prog. Energy Combust. Sci. 2004, 30, 231–295. [Google Scholar] [CrossRef]
  45. Bellos, E.; Tzivanidis, C.; Antonopoulos, K.A. Exergetic, Energetic and Financial Evaluation of a Solar Driven Absorption Cooling System with Various Collector Types. Appl. Therm. Eng. 2016, 102, 749–759. [Google Scholar] [CrossRef]
  46. Bellos, E.; Tzivanidis, C. A Detailed Investigation of an Evacuated Flat Plate Solar Collector. Appl. Therm. Eng. 2023, 234, 121334. [Google Scholar] [CrossRef]
  47. Shirazi, A.; Taylor, R.A.; Morrison, G.L.; White, S.D. Solar-Powered Absorption Chillers: A Comprehensive and Critical Review. Energy Convers. Manag. 2018, 171, 59–81. [Google Scholar] [CrossRef]
  48. Hasan, A.A.; Juaidi, A.; Abdallah, R.; Salameh, T.; Ayadi, O.; Jaradat, M.; Hammad, R.E.; Campana, P.E.; Aqel, O.A. A Review of Solar Thermal Cooling Technologies in Selected Middle East and North African Countries. Sustain. Energy Technol. Assess. 2022, 54, 102871. [Google Scholar] [CrossRef]
Figure 1. Schematic diagram of the TMVC system.
Sustainability 16 08625 g001
Figure 2. TMVC system p-h thermodynamic cycle: 1–2 isentropic mechanical compression, 2–3 constant-volume thermal compression, 3–4 constant-pressure heat rejection in the condenser, 4–5 isentropic expansion through the ejector, 5–10 primary and secondary flow mixing, 10–11 refrigerant pressure recovery, 7–8 constant-pressure expansion in the evaporator.
Sustainability 16 08625 g002
Figure 3. Flow chart of the computational algorithm for each collector type.
Sustainability 16 08625 g003
Figure 4. Effect of the thermal pressure ratio and condenser temperatures on TMVC COP and COP improvement.
Sustainability 16 08625 g004
Figure 5. Effect of the thermal pressure ratio and condenser temperatures on TMVC compressor work and electricity saving.
Sustainability 16 08625 g005
Figure 6. Effect of the thermal pressure ratio and condenser temperatures on TMVC exergy efficiency.
Sustainability 16 08625 g006
Figure 7. Solar collector threshold temperature and specific area.
Sustainability 16 08625 g007
Figure 8. Solar collector thermal efficiency and exergy efficiency.
Sustainability 16 08625 g008
Figure 9. Solar collector specific area.
Sustainability 16 08625 g009
Figure 10. Overall system exergy efficiency.
Sustainability 16 08625 g010
Figure 11. Additional cost of integrating solar collector system.
Sustainability 16 08625 g011
Table 1. Solar energy resources and system parameters.
ParametersValue
Radiation on the tilted angle (It)629 W/m2
Beam radiation component (Ib)434.35 W/m2
Diffuse radiation component (Id)208.34 W/m2
Ground reflected value (ρ)0.2
Ambient temperature ( T a ) 46 °C
Latitude angle Φ33°
Declination angle 21.18°
Tilt angle1.8
K θ E F P C (incident angle modifier (IAM))0.98
K θ C P C 1.006
K θ E T C 1.19
K θ F P C 0.98
Storage tank heat transfer coefficient0.5 W.m−2. K−1
Number of storage tank nodes10
Solar thermal system working fluidWater
Table 2. Efficiency formula coefficients of solar collectors (The Solar Keymark) [30].
Solar CollectorAcronymηoptc1c2Manufacturer
Basic flat plate collectorsFPC0.7253.330.015Solarbayer GmbH
Evacuated flat plate collectorsEFPC0.7370.5040.006TVP Solar SA
Evacuated tube collectorsETC0.4661.410.006ONOSI
Compound parabolic collectorsCPC0.5560.450.007CMG Solari SRL
Table 3. Basic vapor compression cycle design parameters [37].
Key ParameterEquation
Compressor work W c o m p , B V C = ( h 2 h 8 ) (13)
Cooling capacity Q e v , B V C = ( h 8 h 7 ) (14)
Condenser heat rejection Q c o n , B V C = ( h 2 h 4 ) (15)
COP C O P B V C = Q e v , B V C W c o m p ,   B V C = h 8 h 7 h 2 h 8 (16)
Table 4. TMVC thermodynamic cycle refrigerant properties [38].
Thermodynamic StateRefrigerant PropertyRelationshipEquation
Condenser discharge line (point 4)Pressure
Enthalpy
Entropy
P 4 = P c o n = P T c o n , x 4 = 0
h 4 = h P c o n , T s u b  
S 4 = s P c o n , T s u b  
(17)
(18)
(19)
Ejector discharge (point 5)Pressure
Enthalpy (iso)
Entropy
Enthalpy (actual)
Refrigerant velocity
P 5 = P 9
h 5 , i s = h ( P 5   ,   S 5 )
S 4 = S 5
h 5 = h 4 + ƞ m n h 5 , i s h 4
V m n = 2 ( h 4 h 5 )
(20)
(21)
(22)
(23)
(24)
Separator liquid line
(point 6)
Enthalpy h 6 = h P 11 , x = 0   (25)
Evaporator inlet
(point 7)
Enthalpy h 7 = h 6 (26)
Ejector suction line
(point 8)
Pressure
Enthalpy
Entropy
P 8 = P e v p = P T e v p , x = 1
h 8 = h T e v p , x = 1
S 8 = s T e v p ,   x = 1
(27)
(28)
(29)
Ejector suction chamber (point 9)Entropy
Enthalpy (iso)
Enthalpy (actual)
Refrigerant velocity
S 9 = S 8
h 9 , i s = h ( P 9   ,   S 5 )
h 9 = h 8 + η s n h 9 , i s h 8
V s n = 2 ( h 8 h 9 )
(30)
(31)
(32)
(33)
Constant area of the ejector (point 10)Enthalpy
Entropy
h 10 = r ( h 5 + V m n 2 2 ) + 1 r ( h 8 + V s n 2 2 ) 0.5 V m i x 2
S 10 = S ( h 10 , P 10 )
(34)
(35)
Ejector diffuser exit
(point 11)
Pressure
Enthalpy
Enthalpy (iso)
Entropy
Vapor quality
P 11 = P ( S 10 , h 11 , i s )
h 11 = h 10 + 0.5 V m i x 2
h 11 , i s = h 10 + η d i f f ( 0.5 V m i x 2 )
S 10 = S 11
x 11 = x ( p 11 , h 11 ) ,   x 11 = m ˙ c o n m ˙ c o n + m ˙ e v
(36)
(37)
(38)
(39)
(40)
Compressor suction line (point 1)Enthalpy h 1 = h P 11 , T s u p   (41)
Compressor discharge line (point 2)Enthalpy h 2 = h 1 + ( h 2 , i s h 1 ) η i s
h 2 , i s = h P I n t e r m , S 1  
(42)
(43)
Thermal store vapor line (point 3)Specific volume
Enthalpy
Temperature
v 3 = v 2 ,   v 3 = v ( P c o n , T s )
h 3 = h P c o n , v 3  
T 3 = T P C , h 3  
(44)
(45)
(46)
Table 5. TMVC system parameters.
List of ParametersValue
Pressure ratio P 2 / P c 0.7–0.95
Heat transfer fluid supply temperature ( T s , 1 ) 90 °C–170 °C
Condenser temperature55 °C–65 °C
Superheated temperature 5 °C
Subcooled temperature 5 °C
Evaporator temperature5 °C
Ambient temperature at 3:00 PM46.38 °C
Refrigerant store efficiency0.8
Compressor mechanical efficiency0.8
Ejector suction nozzle pressure drop20 Kpa
Motive nozzle efficiency ( ƞ m n ) 0.85
Suction nozzle efficiency ( η s n ) 0.85
Diffuser efficiency ( η d i f f ) 0.85
Cooling load473 kW
Refrigerant working fluidR1234yf
Table 6. Solar collector and storage tank unit cost.
Collector TypeFPCCPCETCEFPCStorage Tank
Cost (EUR/m2)1502252504501000 (EUR/m3)
Reference[45][45][45][46][32]
Table 7. Computational model data verification.
Basic Vapor Compression CycleTcon (°C)3540455055
Tev (°C)5−5−10−10−15
η e x , c s [41]0.36390.30330.25670.21720.1820
η e x , c s (Present study)0.36520.30450.25760.21770.182
Deviation (%)0.360.400.350.230.0
COP [41]4.0462.3231.6881.4281.044
COP (Present study)4.06122.33171.69361.43151.0437
Deviation (%)0.380.370.330.25−0.03
Basic Vapor Compression with Solar EnergyTcon (°C)3540455055
Tev (°C)55555
Ac (m2/kW) [41] 1.1771.2781.3941.5321.704
Ac (m2/kW) (Present study)1.1871.2671.4141.53231.681
Deviation (%)0.85−0.861.430.02−1.35
Table 8. Optimum operation for every collector type.
Solar Thermal Collector Parameters at Optimum Ts,1
Collector TypeEFPCCPCETCFPC
| T s , 1 | o p t 170 150120110
| ƞ e x , C o l | m a x 14.8%10%7%5.20%
ƞ t h , c o l 48.4%37.40%34.20%28.50%
Collector Operation Parameters
P2/P3 = 0.8, Ts,1 = 150 °C and Tcond = 61 °C
A c  (m2)953.513872338-
V t a n k  (m3)31.7846.2677.93-
m ˙ c o l  (kg/s)1927.7546.76-
m ˙ l o a d  (kg/s)1.771.771.77-
ƞ t h , c o l 54%37%22%-
ƞ e x , C o l 14.5%10%6%-
A c /Qe (m2/kW)2.012.934.94-
Table 9. Comparison of TMVC with some of the solar cooling systems installed around the world.
Cooling SystemLocationApplicationCollector Type Specific Collector Area (m2/kW)Reference
TMVC (Present Study) Baghdad, IraqResidential BuildingEFPC1.7–2.28Present Study
Absorption, Double-EffectDelhi IndiaSwiss Embassy CPC3[14]
Absorption, Double-EffectDammam, Saudi ArabiaDemonstrationEFPC2.28[47]
Absorption, Single-EffectDead Sea, JordanHotelETC9.7[47]
Absorption, Single-EffectFirenze, ItalyHealth FacilityETC6.3[47]
Absorption, Single-EffectAssiut, EgyptUniversity- German/Egyptian DemonstrationETC5.3[48]
Absorption, Single-EffectCasablanca, MoroccoHospitalFPC8.3[47]
Absorption, Single-EffectJordanUniversity Research Experimental Project FPC7.3[48]
AdsorptionFreiburg, GermanyKitchenFPC4[14]
AdsorptionPerpignan, FranceResearch Center OfficeFPC3.33[14]
DesiccantAbu Dhabi, UAEResidential HomeFPC2–3.33[48]
Desiccant, LiquidFreiburg, GermanySolar Info CenterFPC1.68[14]
Desiccant, SolidGleisdorf, AustriaOffice BuildingFPC8.6[14]
Disclaimer/Publisher’s Note: The statements, opinions and data contained in all publications are solely those of the individual author(s) and contributor(s) and not of MDPI and/or the editor(s). MDPI and/or the editor(s) disclaim responsibility for any injury to people or property resulting from any ideas, methods, instructions or products referred to in the content.

