Article

Perceptions of Women’s Safety in Transient Environments and the Potential Role of AI in Enhancing Safety: An Inclusive Mobility Study in India

College of Engineering and Physical Sciences, Aston University, Birmingham B4 7E, UK
*
Author to whom correspondence should be addressed.
Sustainability 2024, 16(19), 8631; https://doi.org/10.3390/su16198631 (registering DOI)
Submission received: 31 July 2024 / Revised: 23 September 2024 / Accepted: 26 September 2024 / Published: 5 October 2024
(This article belongs to the Special Issue Sustainable Urban Transport Planning)

Abstract

:
Travel safety for women is a concern, particularly in India, where gender-based violence and harassment are significant issues. This study examines how the perception of safety influences women’s travel behaviour and assesses the potential of technology solutions to ensure their safety. Additionally, it explores how AI and machine learning techniques may be leveraged to enhance women’s travel safety. A comprehensive mobility survey was designed to uncover the complex relationship between travel behaviour, reasons for mode choice, built environment, feelings, future mobility, and technological solutions. The responses revealed that security and safety are the most critical factors affecting women’s travel mode choices, with 54% and 41%, respectively. Moreover, over 80% of women indicated a willingness to change their travel behaviour after experiencing fear, anxiety, or danger during their everyday journeys. Participants were 24% less willing to use ride-sharing services than ride-hailing services, which could affect the transition towards more sustainable transportation options. Furthermore, AI-based sentiment analysis revealed that 46% of the respondents exhibited signs of ‘anger’ regarding what could help women feel safer in transient environments. The practical implications of this study’s findings are discussed, highlighting the potential of AI to enhance travel safety and optimise future sustainable transport planning.

1. Introduction

1.1. Safety Issues Faced by Women While Traveling

Globally, there is a growing recognition of the importance of promoting sustainable travel behaviour. However, shifting towards more sustainable transportation modes may face challenges if people do not perceive travelling as safe. Governments worldwide are debating the global challenge of transport planning for climate neutrality, with the initiative to reduce greenhouse gas (GHG) emissions fostering sustainable transitions towards net-zero and future shared mobility being a key focus. For urban centres, a crucial element in creating sustainable, healthy, and liveable cities is to increase active travel (such as walking and cycling), along with the adoption of public transport and shared mobility services. Active travel benefits the environment and significantly enhances personal health by promoting physical activity and reducing traffic emissions. Still, travel behaviour varies widely both geographically and by gender, which shows differences in the types of trips made and the modes of travel used by men and women. Women and caregivers make 50% more trips than men and non-caregivers, and they also travel more often on foot [1]. Women use cars less frequently than men, rely more on public transport, and have more daily destinations [2,3]. In the UK in 2021, a national travel survey revealed that women made more trips but travelled shorter distances by car (14%), made fewer trips by cycling (308% less), and longer and more trips by walking (7%) than men [4]. In India, women mostly walk (57%) compared to men (22%), while men use more motorised vehicles (43%) compared to women (12%) [5]. Beyond the gender differences in travel behaviour, there is a critical need for gender-sensitive planning to ensure more equitable and sustainable transportation systems.
Safety, observed or perceived, is a fundamental aspect that often determines how people travel. While women use cars less often, use public transport more frequently, and walk to more destinations per day than men, they also face higher risks than men in transit environments while walking, and waiting for and using public transportation [6,7]. Furthermore, women are more vulnerable to transportation-related risks due to unequal access to resources, education, and job opportunities. This inequality can be attributed to factors such as societal norms that limit women’s mobility, a lack of safe and affordable transportation options, and the gender pay gap, which affects women’s ability to afford private transportation [8]. Furthermore, around the world, women face issues related to gender-based violence during their daily travel. In the UK, women, ethnic minorities, and individuals with disabilities are more likely to experience harassment while walking (42%) and on public transport (28%) [9]. This issue is further aggravated in developing economies, as detailed below.
Several studies have used questionnaires to explore the issue of gender-based violence and women’s mobility [10,11,12,13]. In Colombia, 73% of women claim to have experienced some gender-based violence, though 93% of incidents go unreported [11]. In this Latin American country, women account for over 50% of public transport users, and they were are afraid of sexual harassment—a type of crime they are more likely to experience than men—which often goes unreported [11]. Fear and perception of safety while travelling are also of concern in emerging economies. In India, a staggering 91% of women feel that public transport is unsafe [14]. This is not a minor issue, but a widespread problem that affects a significant portion of the population. A comprehensive study across India’s major cities, including Bangalore, Chennai, Delhi, Hazaribagh, Mumbai, Pune, Ranchi, and Visakhapatnam, revealed that 60% of women feel insecure while travelling to work by public transportation [12]. Another study in India found that 33% of women feel unsafe during the entire bus commute, while 80% feel unsafe specifically when boarding and getting off buses [15].
Safety concerns affect how women travel. A study in Austria reported that women who experience frightening situations during everyday mobility adopt various precautions: 64% avoid certain routes or destinations, 30% avoid some modes of transport, and 24% carry repellents [16]. Another study in Colombia revealed that 55% of women changed their travel mobility choices or behaviour following a gender-based violence incident; 14% avoided using public transport or shifted to taxis, 12% decided to travel accompanied, and 2% started carrying a non-lethal weapon [12]. Consequently, women’s travel behaviour is constrained by security concerns, and they may be forced to use undesirable transport options when they cannot change their route or travel time [16].

1.2. Shared Mobility with the Intersectionality of Gender

Worldwide, new forms of mobility are emerging, and the surge in on-demand ride services, such as Uber and Lyft, where individuals can book their rides, is transforming transportation provision. This shift could significantly reduce private car ownership and congestion, offering opportunities to reduce air pollution and promote more efficient mobility. Frequent long-distance travellers, individuals with a higher degree of familiarity with modern technologies, and those with stronger pro-environmental attitudes are likelier to adopt on-demand ride services [17]. However, there are factors affecting the adoption of these services, such as safety and security risks. A study in Ghana, Sub-Saharan Africa revealed that 56% of participants indicated that they would feel unsafe travelling with strangers in a ride-sharing vehicle, suggesting a lack of trust in internet-based ride-sharing mobility services [18]. A study in India that assessed the service quality of ride-sourcing services using an online survey found that the most impactful factor regarding ride-sharing services was security [19]. Additionally, the perception of security has dropped significantly for ride-sharing services due to the presence of unknown co-passengers during the ride [19]. However, this study was focused on the factors affecting the service quality of ride-hailing and ride-sharing services, rather than women’s safety or security perceptions.
According to an online survey on Indian women’s perceived safety and comfort during ride-sharing services [20], unemployed young women have less trust in ride-sharing services, and women generally feel less safe and uncomfortable when sharing a ride with unknown men, particularly at night [20]. Although this study focused on women’s safety while using ride-sourcing services, it did not address how travel behaviour and the built environment, such as the safety of ride-sharing service waiting areas, may influence women’s experiences. In India, the government’s unregulated taxi services (e.g., Uber) often operate with insufficient attention to women’s safety [21]. These unregulated services aggravate feelings of fear while women are considering booking them, highlighting the urgent need for policy changes.

1.3. Influence of Environment on Women’s Travel Safety

It is important to note that beyond the choice of transport mode, the built environment and temporal factors significantly influence women’s everyday travel experiences, feelings, and safety (both perceived and observed). For this study, the built environment is defined as the human-made or human-altered space where individuals live their daily lives [22]. Factors such as residential density, land use mix-access, street connectivity, aesthetics, and safety have all been identified as having a significant positive effect on active travel for women [23,24,25,26]. Similarly, it has been found that women with access to safe and convenient infrastructure tend to cycle more [27].
Negative environmental characteristics include street isolation, poor lighting, poor visibility, confined spaces, and insufficient maintenance (e.g., litter and vandalism). On the other hand, positive environmental characteristics include good lighting, good visibility, maintenance/cleanliness, active surveillance through closed-circuit television (CCTV), and the presence of people [13]. However, there are issues regarding the level of CCTV monitoring. Some studies suggest controversy over whether CCTV is effective in reducing the fear of crime [7,28].
Nevertheless, assessing mobility safety in the transit environment is challenging due to the complex interactions between the individual and other users of the public space, the built environment, and temporal factors, which are difficult to predict due to the transient nature of the environment itself. In recent decades, many research studies in transportation safety have employed machine learning models (e.g., logistic regression) to predict risk factors associated with motor vehicle crashes [29]. Other efforts have been made to improve crime prevention using machine learning techniques and training models on extensive datasets of crime reports. Some of these efforts have successfully identified crime hotspots and tracked the evolution of crime activity, providing law enforcement with insights for resource allocation and promoting community involvement in these crime areas [30]. From a different perspective, a surveillance system combining camera sensors and advanced machine learning technologies (e.g., Hybrid LSTM Classifier) on buses has been proposed to enhance both perceived and actual security on buses [31]. The system is designed to detect unusual behaviours, such as vandalism and accidents, while also improving safety by identifying minor crimes like aggression and bag-snatching. This work [31], along with that of many others [32,33], highlights significant advancements in computer vision and CCTV image analysis over the past decade. These advancements have enabled technology to replace human supervision in numerous areas, including abnormal behaviour detection. However, no academic studies have yet proposed a machine learning-based model specifically designed to detect anti-social behaviours towards women commuters [34].
Additionally, the application of machine learning techniques, such as logistic regression models, in developing safety-tracking solutions has been observed. For instance, Akram et al. [35] have developed a prototype Smart Safety Device for Women using IoT, specifically targeting safety concerns in India [35]. This device aimed to identify threatening situations and automatically alert nearby individuals and law enforcement. However, it is essential to note that these solutions would benefit from further research and evaluation regarding user acceptance and device performance. While these solutions still need refinement, the rapid evolution of machine learning and artificial intelligence (AI) is offering new avenues to enhance transport systems. The complexity of the interplay between the characteristics of travel mode users and the spatial and temporal characteristics of the transit environment—varying across individuals, cultures, and spatial orientations—uncovers the potential for AI to enhance predictive analytics for safer mobility.
In the literature, several studies have investigated women’s safety in transport mobility, and some have explored the influence of the built environment on women’s perception of safety. However, one area that has not received sufficient attention is how temporal factors may influence women’s perception of safety while travelling, beyond the characteristics of built environments. This is a unique aspect that previous studies have not explored. The intersectionality between women’s travel safety, the built environment, and the transient nature of the mobility environment is a complex, yet crucial, aspect that requires attention. Moreover, identifying potential solutions to enhance women’s safety in transient environments is a pressing need that will aid in promoting gender inclusivity in transport planning.

1.4. Study Aims

India has been ranked as the most dangerous country for women due to the alarming prevalence of sexual and non-sexual violence, especially in public transportation and on the streets [36]. In India, gender-based violence against women and harassment in public transport or mobility environments are issues of significant concern. These issues often gain widespread attention and occasionally lead to public protests. Unfortunately, a large portion of these incidents goes unreported, particularly those occurring during travel, which poses a challenge for victims seeking to report such offenses [12]. Understanding the impact of women’s fear on their travel behaviour is essential for developing effective policies and interventions.
This comprehensive study takes a unique approach to explore individuals’ attitudes towards women’s safety while traveling in India. It aims to understand how the perception of women’s feelings and their interconnectivity with the built environment can impact their travel behaviour and overall experience. To better understand the survey participants’ responses, we have applied AI-based sentiment analysis to uncover the hidden emotions in the responses. The study also assesses various technological solutions to improve safety through a travel mobility survey. By analysing data related to environmental safety and emotional responses, AI can help identify risks and improve safety measures, ultimately making transit environments safer and more responsive to women’s safety needs.

2. Materials and Methods

This study aims to understand individual’s perceptions of women’s safety while travelling in India and how their feelings and interconnectivity with the built environment may affect their travel behaviour and experience. For this study, the built environment is defined as the human-made or human-altered space where individuals live their daily lives [22]. Women’s travel safety is investigated by exploring how individuals perceive safety, or their real experiences if they have suffered threatening situations. In the literature, several studies [26,37,38,39] have used the term ‘safety’ to encompass traffic safety and personal safety. In line with this, our study defines ‘safety’ broadly, not limited to traffic safety, but also personal safety and security in public spaces and transport systems.
In the context of women’s safety during travel, it is fundamental to understand that it is not just about the mode of travel. The safety of women, their everyday travel experiences, and their feelings, even if they have not encountered serious threats, are shaped not only by the mode of travel and the built environment, but also by temporal factors. These factors, such as the time of day and how crowded or deserted the street, bus stop, or train platform is, significantly influence travelling safety. Hence, we propose the term ‘transient environment’ to better capture this influence, not only on the built environment, but also on the ever-changing nature of the mobility environment.
This paper is a survey-based study. We adopt a comprehensive approach by analysing the survey data using both traditional descriptive statistics and innovative AI-based sentiment analysis. The details of the research methodology, statistics, and sentiment analysis methods follow.

2.1. Travel Mobility Questionnaire Design

A mobility survey was designed to address interactions across seven components that are relevant in understanding perception towards women’s safety in transient environments:
  • Mode choice,
  • Reasons linked to mode choice,
  • Built environment,
  • Impact of fear and feelings,
  • Future mobility,
  • Technology, and
  • Socio-demographics.
The survey gathered participants’ opinions across five groups:
  • Group 1: Travel behaviour, which included questions about mode choice and reasons associated with this choice;
  • Group 2: Impact on travel behaviour, which included questions about the influence of the built environment on the travel experience and impact of these feelings on travel behaviour;
  • Group 3: Future mobility options, which included questions about participants’ willingness to adopt future travel options related to ride sources (e.g., ride-hailing and ride-sharing services);
  • Group 4: Technology solutions, which presented potential solutions to reduce gender-based violence in transient environments;
  • Group 5: Socio-demographic characteristics (e.g., questions about participants’ gender and age).
For multiple choice questions where multiple answer choices may apply, e.g., frequency of use of different travel modes (in Group 1), the participants had the option to select all that could apply. Characteristics of the built environment that could influence perception of safety and impact of women’s fear and feeling on everyday journeys were assessed (Questionnaire items in Group 2). Additionally, in Group 1, the questionnaire also presented Likert-type statements using measures of participants’ reasons behind travel mode choice using a five-point scale ranging from 1 (Strongly disagree) to 5 (Strongly agree). Technical solutions to enhance women’s safety while travelling (i.e., Group 3) were presented to the respondents to evaluate their effectiveness using a five-point scale ranging from 1 (Not at all effective) to 5 (Extremely effective). Other questionnaire items regarding willingness to use future transport options (ride-hailing and ride-sharing services) in Group 4 were presented as binary, i.e., ‘yes’ or ‘no’.
Lastly, an open-ended question was used to collect participants’ valuables opinions about what, in their view, could help women feel safer when travelling using public transport or walking as part of everyday journeys. Additionally, this question aimed to reveal the participants’ underlying emotions and feelings about safety issues, which may be reflected in their responses. This includes identifying sentiments such as negative, neutral, and positive, and emotions such as anger, sadness, joy, and optimism. The length of each response ranged from 1 to 50 words.
The survey was in the English language. Carefully crafted questions were designed to gather valuable insights while ensuring the safety and comfort of the participants. Sensitive questions about being a victim of gender-based violence during travel (e.g., being exposed to verbal or physical sexual harassment) were excluded to prevent any discomfort. The electronic copy of the survey was implemented as a Google Form. Email invitations to participate in the online survey were sent via colleagues at the Symbiosis Institute of Technology, India, for dissemination within their community and via the social network LinkedIn.
To participate, individuals had to meet the eligibility criteria approved by Aston University Ethical Approval and regulations, which included being at least 18 years old, having sufficient knowledge of the English language, and living in India. The questionnaire was expected to take about 10 min to complete. Participation was voluntary, and no reward or compensation was offered to the participants.
This study originated from a mini-project conducted as part of the British Council-funded Going Global Partnerships Exploratory Grant Top-Up project (Ref: 877629610) at Aston University in collaboration with Symbiosis Institute of Technology (SIT) in Pune, India. Prior to conducting the survey, this study was reviewed by the Research Ethics Committee at the College of Engineering and Physical Sciences at Aston University via delegated approval authority for the CS4700/CS4705 Dissertation module. Approval was received on 16 June 2023 (Ref: 23MINIPRJ_2).

2.2. Data

The UK researchers administered the survey online to gather responses from participants living in India. Data collection spanned from June to September 2023. Fifty-five participants consented to participate, and following a data quality check, 14 observations were excluded.
The study comprised responses from 41 participants with 33 women (accounting for 81% of the participants), seven men, and one individual identifying with the gender category “other”. The original aim of this study was to examine the differences in safety perception between men and women living in India to understand better how their daily travel experiences could shape safety perception. However, due to the limited number of responses, non-binary individuals were also included in the analysis, and data were analysed for the overall sample.

2.3. Data Analysis

The analysis was performed for the overall sample without gender stratification due to the low response rate (Section 2.2). Given the high prevalence of gender-based violence in India, it is reasonable to assume that the “non-female” participants were sensitive to women’s safety risk exposure while travelling in India. The analyses were conducted using IBM SPSS Statistics version 26. Non-parametric methods were applied to explore potential relationships across the seven constructs (i.e., mode choice, reasons, built environment, the impact of feelings, future options, technology, and socio-demographics, Section 2.1). Spearman correlation rank-order correlation coefficients (ρ) were calculated between respondents’ travel mode choice, the reason for mode choice, the influence of the built environment, and travel safety perception impact on travel behaviour.
Furthermore, AI-based sentimental analysis and emotion detection were applied to textual answers to further analyse answers to an open-ended question from the participants and help uncover potential hidden emotions. This was crucial to identifying underlying feelings, such as anger, joy, or optimism, which can inform improvements, refine strategies, and ensure that questionnaire analysis is accurately interpreted for more effective decision-making. To detect sentiment and emotions in the responses, we employed a RoBERTa-based model [40]. RoBERTa is essentially an enhanced version of the BERT (Bidirectional Encoder Representations from Transformers) model, which has been trained by Liu et al. [41] on a much larger dataset, resulting in a more robust model with significantly improved performance.
BERT and RoBERTa, both encoder-only models, have been designed for understanding text, not for generating it. They employ a ‘self-attention’ mechanism, which processes the input sequence (text) by creating three components: query, key, and value. The mechanism calculates the similarity between the queries and keys, and this similarity determines the relevance of the values, thereby helping the model to highlight important information. The combined information, along with the original input, is then passed through a neural network to determine the hidden sentiment in the input text. Mathematically, this involves assigning importance (also called attention) scores to tokens based on their relevance to each other. The equation for calculating attention scores is as follows, with ‘Q’ as the query, ‘K’ as the key, ‘V’ as the value, dk as keys of dimensions, and ‘QKT’ as the scalar product between the query and key [42]:
A t t e n t i o n Q , K , V   =   s o f t max Q K T d k V
The RoBERTa-based model by Barbieri et al. [40] is employed in this work. It is built upon RoBERTa by optimising and refining its training procedure. It was pre-trained on approximately 124 million tweets [43] and fine-tuned for two tasks: sentiment analysis with three labels: positive, neutral, and negative, and emotion classification with four labels: anger, joy, sadness, and optimism.

3. Results and Discussion

This section presents the results from the comprehensive travel mobility survey in India. First, it presents exploratory data analysis for participants’ socio-demographic and travel behaviour and the influence of the built environment on safety perception while travelling. Second, it highlights the key interactions based on the correlation analysis across travel behaviour, built environments, and technology for women’s safety in transient environments, showcasing potential solutions. Lastly, this section presents the results of our AI-based sentiment analysis and emotion detection on the open-ended question about what measures could enhance women’s safety in public transport or while walking.

3.1. Participants Socio-Demographics

On average, the participants in the study were 27.9 years old (SD = 9.3), indicating that they were young adults. Although all the questionnaire items related to socio-demographics were optional, the participants were required to provide their age and gender information to comply with the study design. According to the results, most participants were either full-time employed or students (46.3% and 39.0% respectively). While 4.8% were homemakers or stayed at home, 2.4% were retired, and 2.4% preferred not to say. The study also revealed a high level of education among the participants, with 80.49% holding a university degree and 2.44% having technical/vocational training. Regarding total annual gross income, only 18 participants responded. Amongst the respondents, 19.5% were at the very high income level (above Rs 5–8 lakh per annum), 4.8% had high income (between Rs 5–8 lakh per annum), 7.32% had medium income (between Rs 3–5 lakh per annum), 2.44% had low income (Between Rs 1–3 lakh per annum), and 9.76% were at the very low-income level (less than Rs 1–3 lakh per annum). Though it is questionable as to how the most significant proportion of respondents would fit into the highest income level (19.5%), in particular given that the average participant was a young adult, it is worth noting that the response rate for the annual gross income question was very low: 56% of respondents chose ‘prefer not to say’.

3.2. Travel Behaviour and Perceptions towards Women’s Safety in Transient Environments

This section presents the means, standard deviation, and frequency distributions for the travel mobility survey.

3.2.1. Travel Behaviour

Table 1 displays questionnaire items for travel mode (Q1_1–Q1_8) and reasons behind travel mode choice (Q2_1–Q2_7), mean standard deviation, and frequency distributions. Regarding the travel mode, the most used modes were walking, followed by public transport use and motorcycle (or moped), as shown in Table 1 by the highest mean values for the M = 3.8, SD = 1.3; M = 3.2, SD = 1.4; and M = 3.1, SD = 1.6, respectively. Additionally, walking was the most popular option for everyday travel, with 42% of participants choosing this mode, while 29% used motorcycles, and 20% used public transport. This would be expected as the average participant was young (~28 years old), and they were mostly full-time employed or students. Various factors influenced the participants’ travel mode choices; for example, these options are deemed more suitable for commuting to the university or workplaces for their daily travel. Additionally, these modes of transport are easy and affordable, catering to the lifestyle of young adults.
As evidenced by the data in Table 1, travel security and safety were the most important factors for choosing a travel mode, as shown by the highest means ratings: M = 4.3, SD = 1.9 and M = 4.2, SD = 0.9, respectively, with 54% and 46% of respondents rating them highly. Among the respondents, 54% strongly agreed with choosing the most secure travel mode to avoid crime/violence/harassment, while 46% strongly agreed with choosing the safest travel mode to avoid traffic accidents. On the other hand, according to Figure 1, among the seven factors influencing travel mode selection, the preference for the most eco-friendly travel mode (green category) was surprisingly the least important factor, as indicated by the high number of “strongly disagree” and “disagree” responses, shown by the brown and orange bar series in the graph. Ultimately, it is essential to prioritise safety and security when selecting a travel mode while also considering other factors relevant to individual preferences, women’s needs, and comfort. These results highlight the need for providing secure and safe travel modes for women in India, and the importance of identifying means to do so.

3.2.2. Perceptions towards Women’s Safety during Travelling

The travel mobility survey asked the participants to select all the attributes of the built environment that could influence perceptions towards women’s safety during travel (questionnaire items Q3_1–Q3_7) in the context of transient environments, meaning not only while walking or using public transport, but also while waiting for a bus or for the train. The results revealed that all attributes related to built environment factors that could impact women’s perception of fear or discomfort were considered relevant. Most participants, 76%, believed that suspicious individuals in a public space would increase the risk of danger and make women feel fear or discomfort (Table 2). Poor street lighting and being in lonely bus stops without surveillance were also relevant factors identified by 66% of the respondents. Additionally, 61% of participants pointed out that deserted streets or roads and deserted train stations influenced women’s perception of safety. These findings are in alignment with the positive environmental characteristics (e.g., good lighting, maintenance/cleanliness, surveillance) and negative environmental characteristics (e.g., poor lighting/darkness, confined spaces, and poor maintenance) identified by Ding et al.’s [13] review study.
This study also investigated the potential impacts on women’s travel behaviour as related to the possibility of experiencing gender-based violence incidents or situations during their daily journeys (questionnaire items Q4_1–Q4_7). According to the respondents’ perceptions, among women who have felt fear or anxiety during their travel, women would avoid walking at night (66%), prefer to travel with a companion (63%), and take a different route (51%), as shown in Table 2. This impact of women’s fear and feelings on change in travel behaviour aligns with a study in Colombia, which found that 47% of women altered their mobility travel choice when a gender-based violence incident occurred [10]. Not going out for a while was only reported by 44%; however, a significant proportion of participants viewed this as a negative impact of fear during everyday travelling. Women chose longer walking routes, where they felt safer, avoiding public transit when it was empty or full [10].
It is worth noting that only 12% of the respondents considered that even though women could have been exposed to such uncomfortable travel experiences, they would not change their travel (Table 2). Based on the results presented in this study, it is suggested that 88% of the respondents understood that women would change their travel behaviour due to feelings of fear. This finding corroborates with the claim that women, have constrained travel behaviours because of fear about their security, and they can be captive to using unwanted transport options when it is not feasible to change route or travel time [16].
However, when investigating the responses reporting no change in travel behaviour (12%) further, it was found that three of them also chose other responses (e.g., “Travelling accompanied” or “Using taxicabs or private vehicles”). This indicates an incoherent response from those three participants, as if they had chosen “No change”, no other option should have been chosen. The participants’ contact information (e.g., email) was not available, and hence prevented further clarification. This inconsistency could potentially impact the accuracy of our data, as we were unable to determine whether this contradiction was a typo or a misunderstanding of the change or no change in travel behaviour. Our finding highlights one potential issue with survey-based perception studies on travel safety. As such studies rely on participants’ ability to recall and/or summarise past experiences, the participants’ answers could be somewhat distorted by their mental state or simply by failure to recall at the time of completion. We should highlight that AI could also be employed to identify and analyse incoherent responses by using advanced natural language processing techniques. These techniques, which detect inconsistencies, errors in reasoning, and deviations from expected patterns in responses, are key features we plan to integrate into any subsequent activities within this project. Furthermore, perception-based studies may also be enriched with virtual reality-based everyday travel scenarios to help gauge the respondents’ reactions.

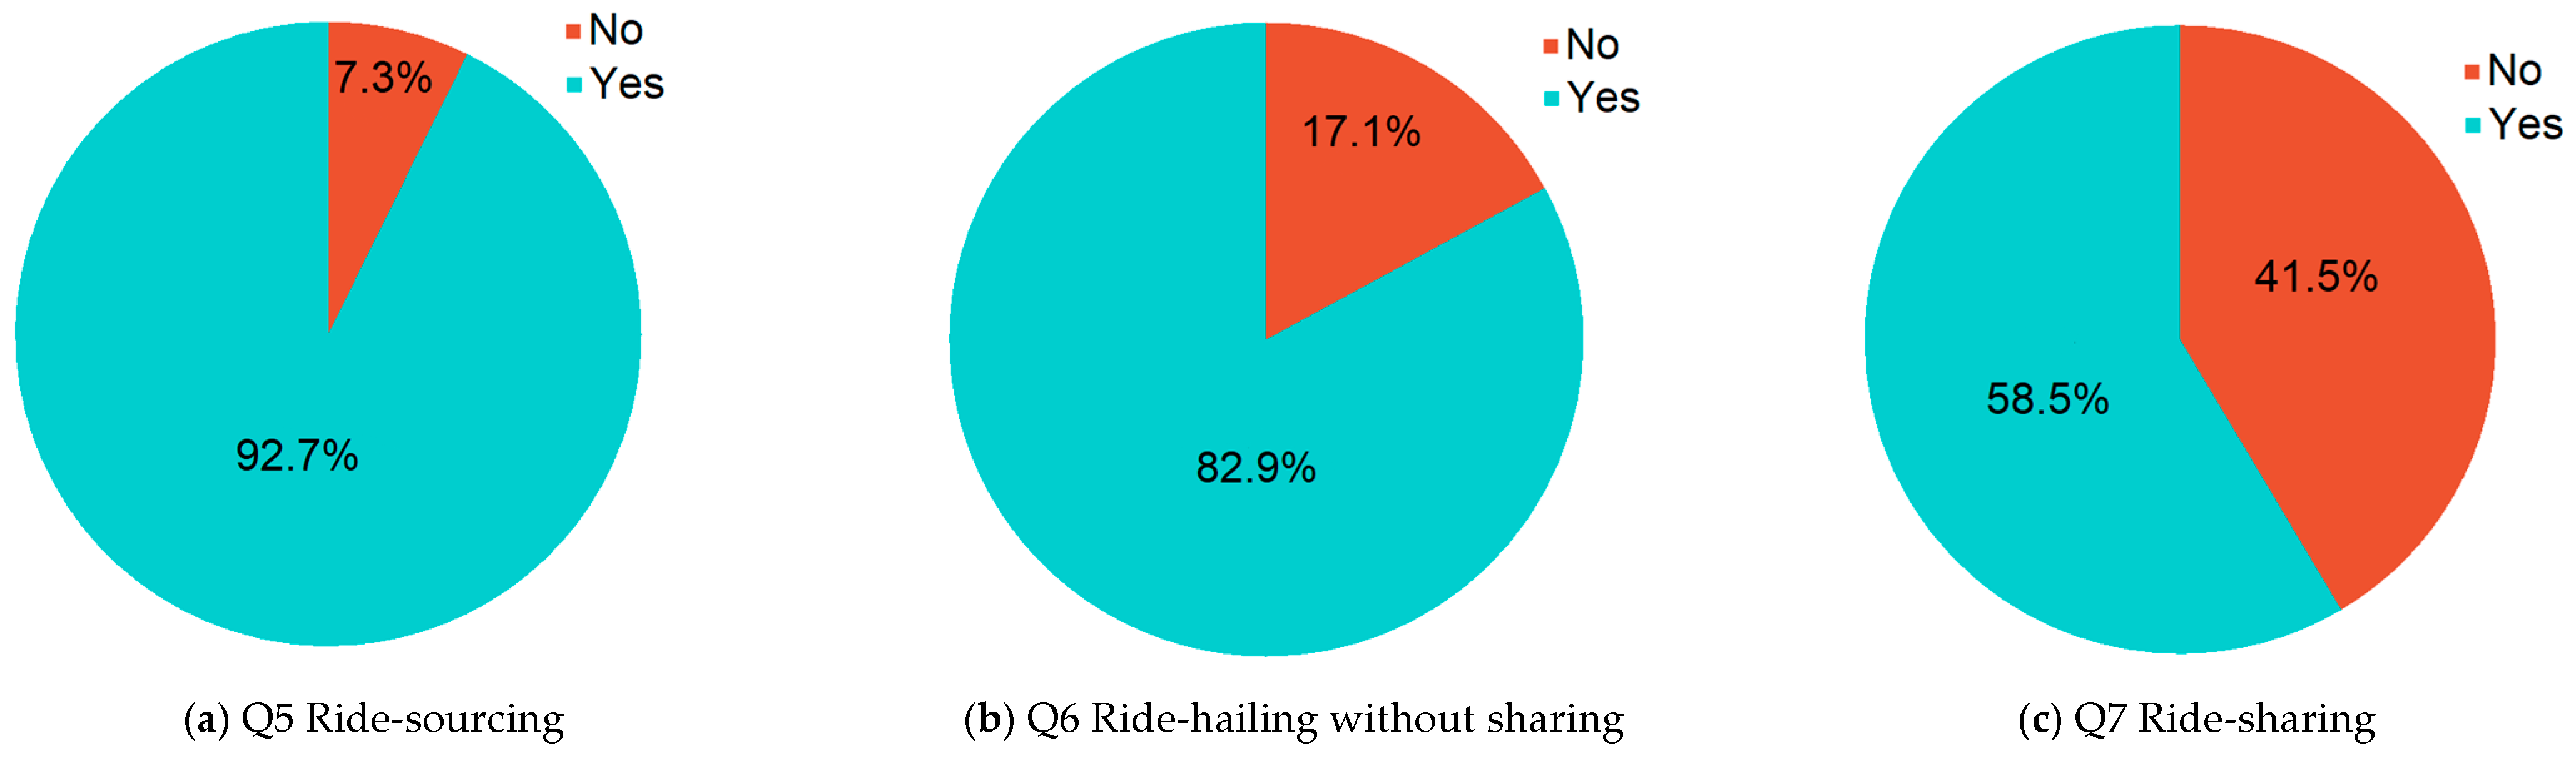
3.2.3. Future Travel Options

As the availability and popularity of on-demand ride services are growing, the travel mobility survey included questions about participants’ willingness to use these services to explore how comfortable they would feel and potential implications regarding safety perception while using them. The questionnaire items Q5 (focused on booking ride-sourcing services), Q6 (focused on ride-hailing services), and Q7 (focused on ride-sharing services) were all designed with binary responses (‘yes’ or ‘no’) and were used to gather participants’ opinions about these options. For these questionnaire items, participants were given the following explanation: ride-hailing services provide access to only an individual during the ride, while ride-sharing services allow more than one passenger to book the same vehicle for different destinations. Thus, unknown co-passengers can join during the use of a ride-sharing service, for the entire or part of the journey.
Figure 2 shows the frequencies for participants’ willingness to use ride-source services. Most participants generally seem optimistic about new mobility options and technologies, such as using a mobile app to adopt these services (93%). This makes sense as the average participants were young adults (about 28 years old on average, as presented in Section 3.1). This finding is in line with existing literature, which suggests that younger individuals are more inclined to experiment with new technologies during their early stages of introduction [44,45]. Moreover, 89% of the participants expressed comfort in utilising ride-hailing services. This favourable adoption of on-demand service booking is conditional on not sharing the ride with a stranger. It is important to notice that this acceptance diminishes significantly when considering the possibility of an unknown co-passenger (i.e., a stranger) booking the same cab for part or the entire journey, with only 42% of participants responding positively. These findings suggest that the comfort level of participants with the interplay of safety perception imposes barriers to using ride-sharing services in the future, as evidenced by the notable 24% decrease in positive responses, from 83% to 59%, as shown in Figure 2b and Figure 2c, respectively.
These findings corroborate with other research studies identifying issues of perceived safety while using ride-sharing services. Another online survey study in India found that the perception of security dropped significantly for ride-sharing services, related to the presence of other unknown co-passengers during the ride [19]. However, the study focused on the service quality of ride-hailing and ride-sharing services and did not focus on women’s safety as in our study. Our study results also align with another study in India, which reported that women feel less safe and comfortable when sharing a ride with unknown males or travelling at night [20]. Furthermore, noting that 42% of the respondents in this study were not willing to use ride-sharing services (Figure 2), it is essential to reflect that amongst those participants who would change their travel behaviour to using taxicabs (44% as presented previously, Table 2) to cope with potential feelings of fear while travelling, in the future, new ride-sharing services are unlikely to offer an efficient means to reduce GHG emissions, as participants seem to be reluctant to use those services. Although ride-sharing services represent environmental and traffic benefits that contribute to reducing emissions and congestion, there is a critical need to explore potential solutions to enhance comfort and safety while travelling, particularly for women, which will be explored next.

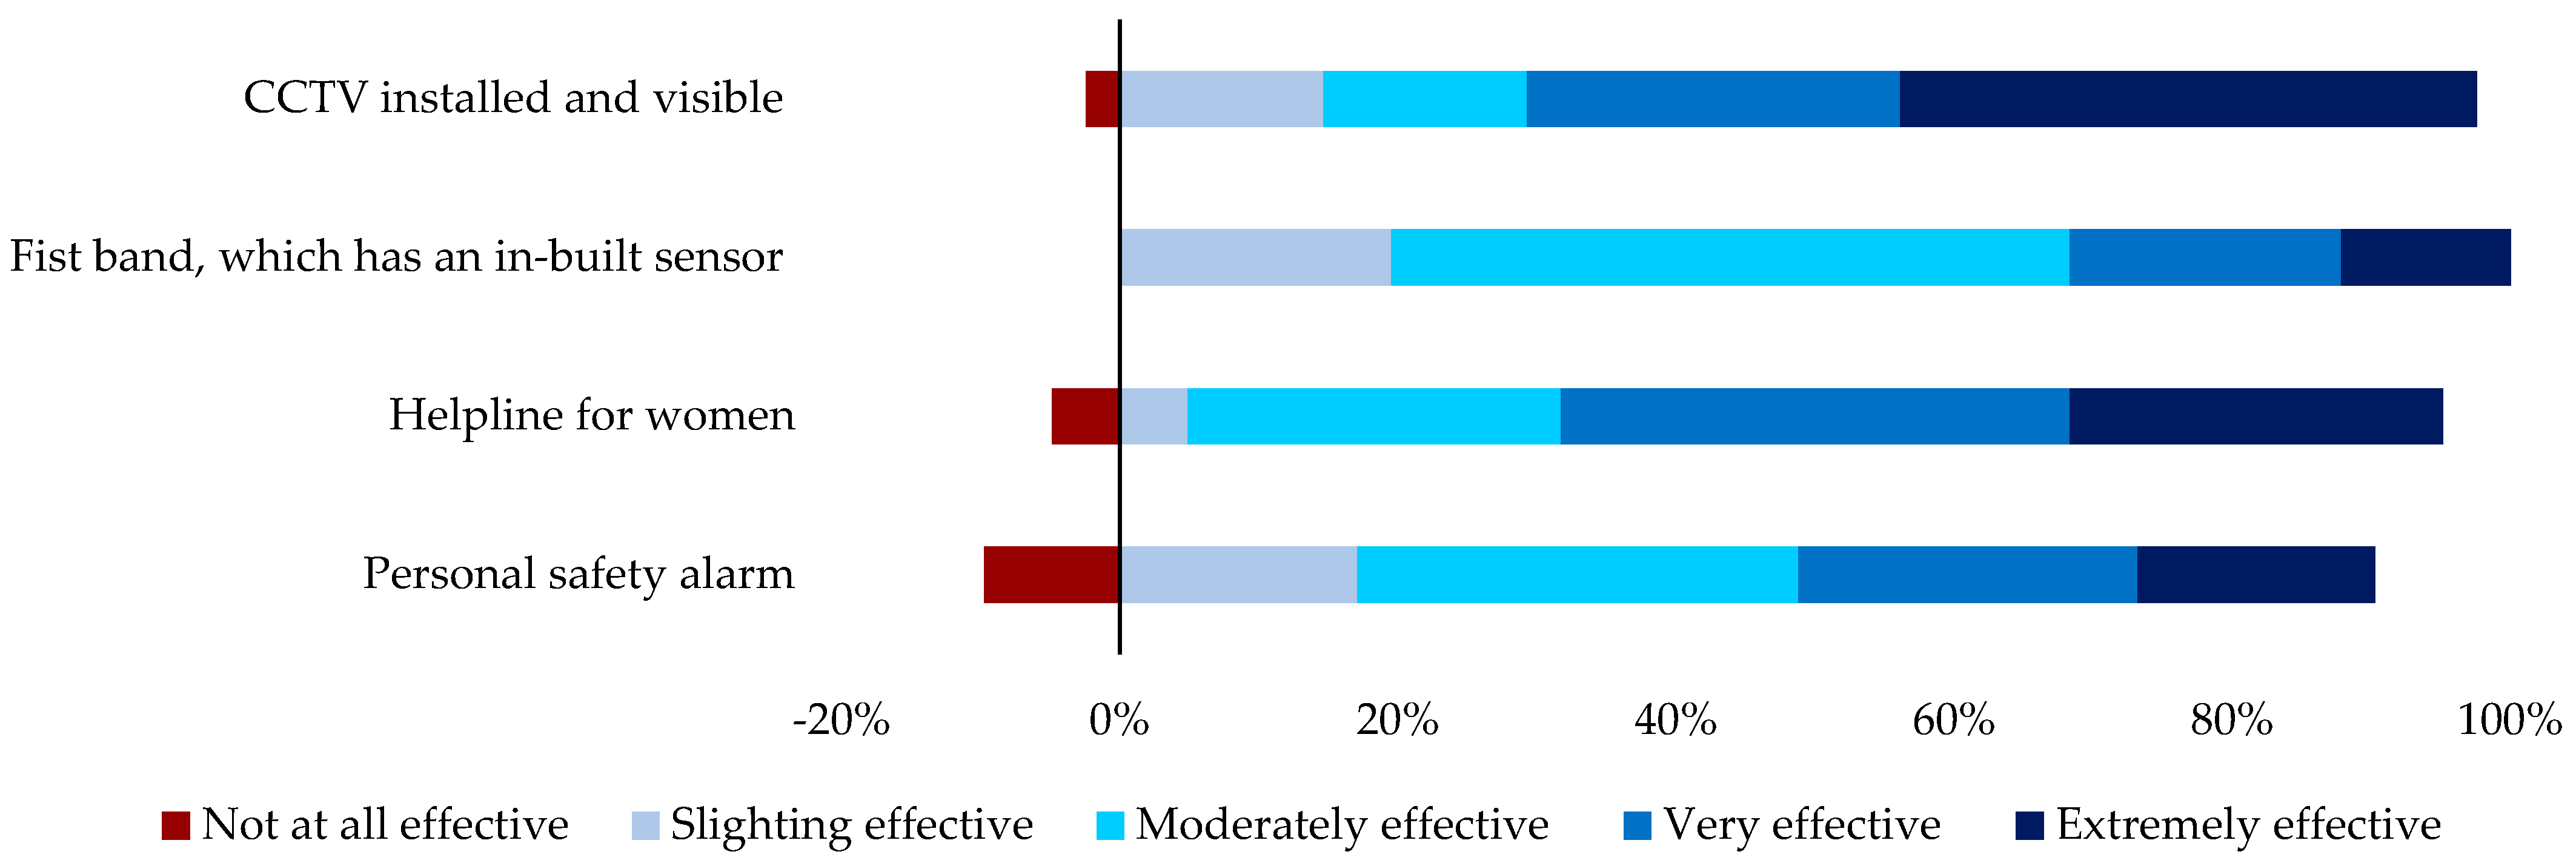
3.2.4. Technical Solutions to Enhance Women’s Safety on Transient Environments

The transient nature of travel environments can significantly impact safety perceptions, especially for women. Inadequate or poor street lighting, empty streets, bus stops, and train platforms all contribute to increased risks for gender-based violence and crime. Given these risks, our travel mobility survey focused on identifying potential technical solutions to enhance women’s safety in transient environments (Questionnaire items Q8_1 to Q8_4). Participants were requested to rate these solutions on a five-point scale, ranging from ‘Not at all effective (1)’ to ‘Extremely effective (5)’.
Results show that current solutions, such as carrying a personal safety alarm and calling the helpline for women, were not perceived as being as effective as they should be. The lowest scores for technical solution effectiveness were M = 3.2, SD = 1.2 and M = 3.2, SD = 0.9, respectively, as shown in Table A1 in Appendix A. Additionally, as shown in Figure 3, the respondents rated carrying a personal safety alarm as the least effective solution, with the highest rating for “Not effective at all” at 10%. Some personal safety devices have been used for a long time worldwide, such as women carrying repellents in Austria [16]; these could, to some extent, help some women to feel more protected. However, there is an urgent need for more robust solutions. Participants identified “Using a fist band which has an in-built sensor that tracks the heart rate and body temperature allowing it to detect an emergency and send an alert signal along with GPS location to the nearby police station and family members” and CCTV cameras installed and visible in the transit spaces as the most effective technical solutions as evidenced by the highest means ratings of M = 3.8, SD = 1.1 and M = 3.9, SD = 1.2, respectively, (Table A1, Appendix A). It is interesting to note that although “Using the helpline for women” and “Carrying a personal safety alarm” have been used for many years in different countries, those showed the lowest ‘Extremely effective’ scores of 12% and 17%, respectively, and had low scores compared to the perceived effectiveness attributed to wearing a fist band (27%) and CCTV (42%) solutions, as shown in Figure 3. This suggests that some current worldwide-established means to enhance travel safety for women are not perceived as being as effective as they need to be for women travelling in India. A focussed review on why there is a lack of confidence in the effectiveness of such worldwide-established solutions would help identify potential improvements. New means and measures to promote travel safety for women may be needed to alleviate concerns surrounding travel safety for Indian women.
It is worth noting that based on this study’s results, the use of CCTV was identified as the most effective technical solution (rated by 42% of the participants), which corroborates with other research arguing that women consistently see CCTV as effective [13]. However, although some public spaces, such as streets, bus stops, train stations and train platforms, may already have visible CCTV systems installed, sometimes these need to be more consistently monitored. This could be especially aggravated in some developing economies with resource constraints. Additionally, the literature reveals that there is also some controversy as to whether CCTV is truly recognised as effective in reducing fear of crime [7,28].

3.3. Relationship between Responders Rating for Travel Behaviour, Influence of the Built Environment, and Safety Perception

Spearman correlation rank-order correlation coefficients (ρ) were run to determine potential relationships across respondents’ ratings throughout the seven components of the travel mobility survey: mode, reasons linked to mode choice, built environment, impact of fear and feelings, future mobility, technology, and socio-demographics. Table A2 (Appendix B) shows the correlation matrix across these components (37 × 37 matrix). This section highlights the most relevant components in the context of women’s travel safety. It is known that, in general, safety and security are strongly correlated, and this is also evidenced in this study. Although the discussion of the results is centred on perceived safety, it is also related to comfort, safety, and security, as these three elements are intertwined. Here, ρ represents the Spearman correlation coefficient, a measure of the strength and direction of the relationship between two variables, and p < 0.01 and p < 0.05 indicate the level of statistical significance.
Results show a strong statistically significant correlation between prioritising affordability (Q2_1, choosing the cheapest travel mode) and walking (ρ = 0.432, p < 0.01). On the other hand, affordability was negatively correlated with the presence of suspicious people in the transient environment (ρ = −0.34, p < 0.05), (Table A2 in Appendix B). This suggests that those who tend to choose the cheapest travel modes (either voluntarily or due to financial constraints) do not consider that the presence of suspicious people would influence the perception of women’s safety during travelling. Comfort (Q2_3) strongly but negatively correlates with bus stops in lonely places (ρ = −0.31, p < 0.05). This would be expected, as being at a bus stop in a lonely place may make women and other travellers uncomfortable. Regarding the impact of feelings and fear on changes in women’s travel behaviour, travelling accompanied (Q4_1) showed a strong statistically significant correlation with being in public spaces occupied by suspicious people (ρ = 0.39, p < 0.05).
Regarding future mobility options, the responders’ ratings regarding willingness to use ride-sourcing services (Q5) was strongly negatively correlated with using a bike or a motorcycle (ρ = −0.31 and ρ = −0.35), respectively, both p < 0.05 (Table A2, Appendix B). This suggests that participants who cycle and use motorcycles for their everyday travel may be more reluctant to adopt ride-sourcing services in the future. Interestingly, ride-hailing services (Q6) were strongly negatively correlated with avoiding walking at night (ρ = −0.33, p < 0.05). As previously presented in Section 3.2.2, the likelihood of using ride-sourcing services drops significantly by 24% when moving from willingness to use ride-hailing services (83%) compared to ride-sharing services (59%). This finding prompts us to consider potential impacts on future transportation choices. Participants with a higher willingness to use ride-hailing services may consider it safe, and thus avoiding travelling at night may be considered unnecessary. A possible reason for feeling comfortable to do so could be the assurance that no unknown co-passenger will join the ride during ride-hailing services.
Regarding technological solutions to enhance safety for women in transient environments, respondents’ ratings for personal safety alarm (Q8_1) were statistically negatively correlated with travelling accompanied (ρ = −0.42, p < 0.01) and travelling by car as a driver (ρ = −0.34, p < 0.05) (Table A2, Appendix B). These results could be explained by the fact that if women travel accompanied or are driving a private car, using such a device may be unnecessary as women would be in the presence of a friend or relative, or they would be ‘shielded’ by their own vehicle. On the other hand, respondents’ ratings for personal safety alarms were statistically significantly correlated with prioritising travel modes that enhance exercise or are eco-friendly (greener travel options) (both ρ = −0.34, p < 0.05, in Table A2, Appendix B). It is known that women have constrained travel behaviour because of fear about their security, which may lead them to use unwanted transport options [16]. Thus, using a personal safety alarm seems to provide those who prioritise active travel modes (walking and cycling) to exercise and that value eco-friendly mobility with the perception that this solution gives freedom of mobility to women without restricting their mobility preferences. Even so, as presented in Section 3.3, only 17% of responders rated the personal safety alarm as extremely effective. Additionally, respondents’ ratings showed a positive statistically significant correlation between using the helpline for women (Q8_2) and choosing a travel mode that provides the opportunity to exercise and willingness to use ride-hailing services (ρ = 0.36, and ρ = 0.35, respectively, both p < 0.05). This suggests that if a helpline is available, women’s perception of safety while walking, cycling, or running and using a ride-hailing service could increase. As presented in Section 3.3, none of the participants rated this option as ‘Not at all effective’ (0%, Table A1, Appendix A). Still, only 12% of participants considered this solution to be extremely effective.
Participants’ ratings for using a fist band, which would include an in-built sensor that tracks the heart rate and body temperature, allowing it to detect an emergency and send an alert signal along with global positioning system (GPS) location to the nearby police station and family members (Q8_3) was strongly statistically negatively correlated with travelling by car (as passengers) (ρ = −0.40, p < 0.01; Table A2, Appendix B). This is sensible because those respondents travelling by car could feel that such a solution may not be needed, as they are used to travelling in private cars. However, using a fist band with in-built sensors to detect emergency situations was strongly correlated with participants’ ratings for those prioritising safety while choosing their travel mode (ρ = 0.38, p < 0.05). A total of 27% of participants considered this solution as extremely effective in enhancing women’s safety in transient spaces. This solution could be further investigated, because perceived safety and security are statistically strongly correlated, as our study shows (ρ = 0.69, p < 0.01, Table A2).
As an initial investigation, we found that advancements in AI have enabled the successful development of Internet of Things (IoT)-based health-monitoring wristbands and systems that are user-friendly, accurate, and easy to operate. For instance, Zhang et al. [46] worked on a system designed to monitor key health parameters, including blood pressure, blood oxygen, pulse, and exercise metrics. This intelligent health service system’s design integrated key health metrics and was able to successfully provide effective monitoring. Such systems can be further adapted to detect fear, discomfort, and panic in women based on these key health metrics, to then send alerts to designated personnel for assistance. However, more research is required to bring about such adaptations before the effectiveness of such IoT technology in promoting travel safety for women could be assessed.
Further, respondent ratings for ‘Feeling safer if CCTV cameras will be installed and visible in the transit spaces’, Q8_4, were strongly negatively correlated with prioritising the cheapest travel mode (ρ = −0.36, p < 0.05; Table A2, Appendix B). This could indicate that those who do not value transport affordability as a primary criterion in choosing their travel mode may consider that CCTV in buses, the metro, or trains, or in transient spaces, could be regarded as necessary. A total of 42% of participants rated CCTV as highly effective. Finally, the participant age was negatively correlated with participant ratings regarding prioritising an eco-friendly travel mode (ρ = −0.36, p < 0.05). This could be explained by the fact that younger people are more aware of environmental issues and have stronger pro-environmental attitudes. It would be interesting to explore other socio-demographic variables, such as participants’ incomes and gender differences. However, the response rate for this online survey was very small, resulting in a sample size of 41 valid responses.
Many other scholars also face the challenge of small-N. We have reflected on the challenges of actual techniques of causal inference in small-N and whether the interpretation of the data can be based on p values. We did not acquire the minimum sample size acceptable for an online survey gathering quantitative (e.g., ordinary and binary responses) and qualitative data (open responses). However, a recent publication by Lakens [47] about sample size justification provided the following example: when performing a power analysis based on a two-sided test, with “α = 0.05, and N = 30, only effects larger than r = 0.361 or smaller than r = −0.361 can be statistically significant”. Lakens [47] claimed that when the sample size is relatively small, “the observed effect needs to be quite substantial to be statistically significant”. Firstly, with N = 41, our sample was slightly larger than N = 30. Furthermore, as presented in Section 3.3 and evidenced in Table A2 (in the Appendix B), most of the correlation coefficients were ≥0.36 and ≤−0.36, and therefore can be considered statistically significant, meaning that they are unlikely to have occurred by chance. Furthermore, our results also echo the findings of other established studies, such as [6,7,10,13,20].
Secondly, other scholars have presented considerations beyond statistical power [48,49]. We recognise that the answers provided by a larger sample could be different. Still, we recall the work by Fugard & Potts [48], who stated: “‘N of 1’ quantitative studies are also run, so ‘quantitative’ need not imply ‘large sample’. However, the questions answered by a single case study differ from those answered by a large-scale probability sample”. Thirdly, small sample research is critically important as it often represents serious concerns in vulnerable and underrepresented populations [49]. In India, women and girls are particularly vulnerable to gender-based violence and harassment in their everyday journeys. In this study, we focused on complex interactions across multiple factors (e.g., travel mode choice, built environment, and influence of feelings and fear) and how these interactions may impact travel behaviour, and explored potential solutions to enhance women’s safety while travelling. Etz & Arroyo [49] wrote: “We must remain open to how this work has the potential to be highly valuable despite recognising that not all aspects will generalise”, and we share the same view. Therefore, while we recognise the challenges posed by the small sample size used in this study, our findings capture the interplay between travel behaviour, built environment, and user feelings. We have also explored the use of AI-based sentiment analysis on textual answers from the participants to help uncover potential hidden emotions. Our findings highlight the potential of applying AI techniques to analyse survey data and offer insights into potential ways to advance the development of AI-based solutions for promoting transport safety and inclusivity.

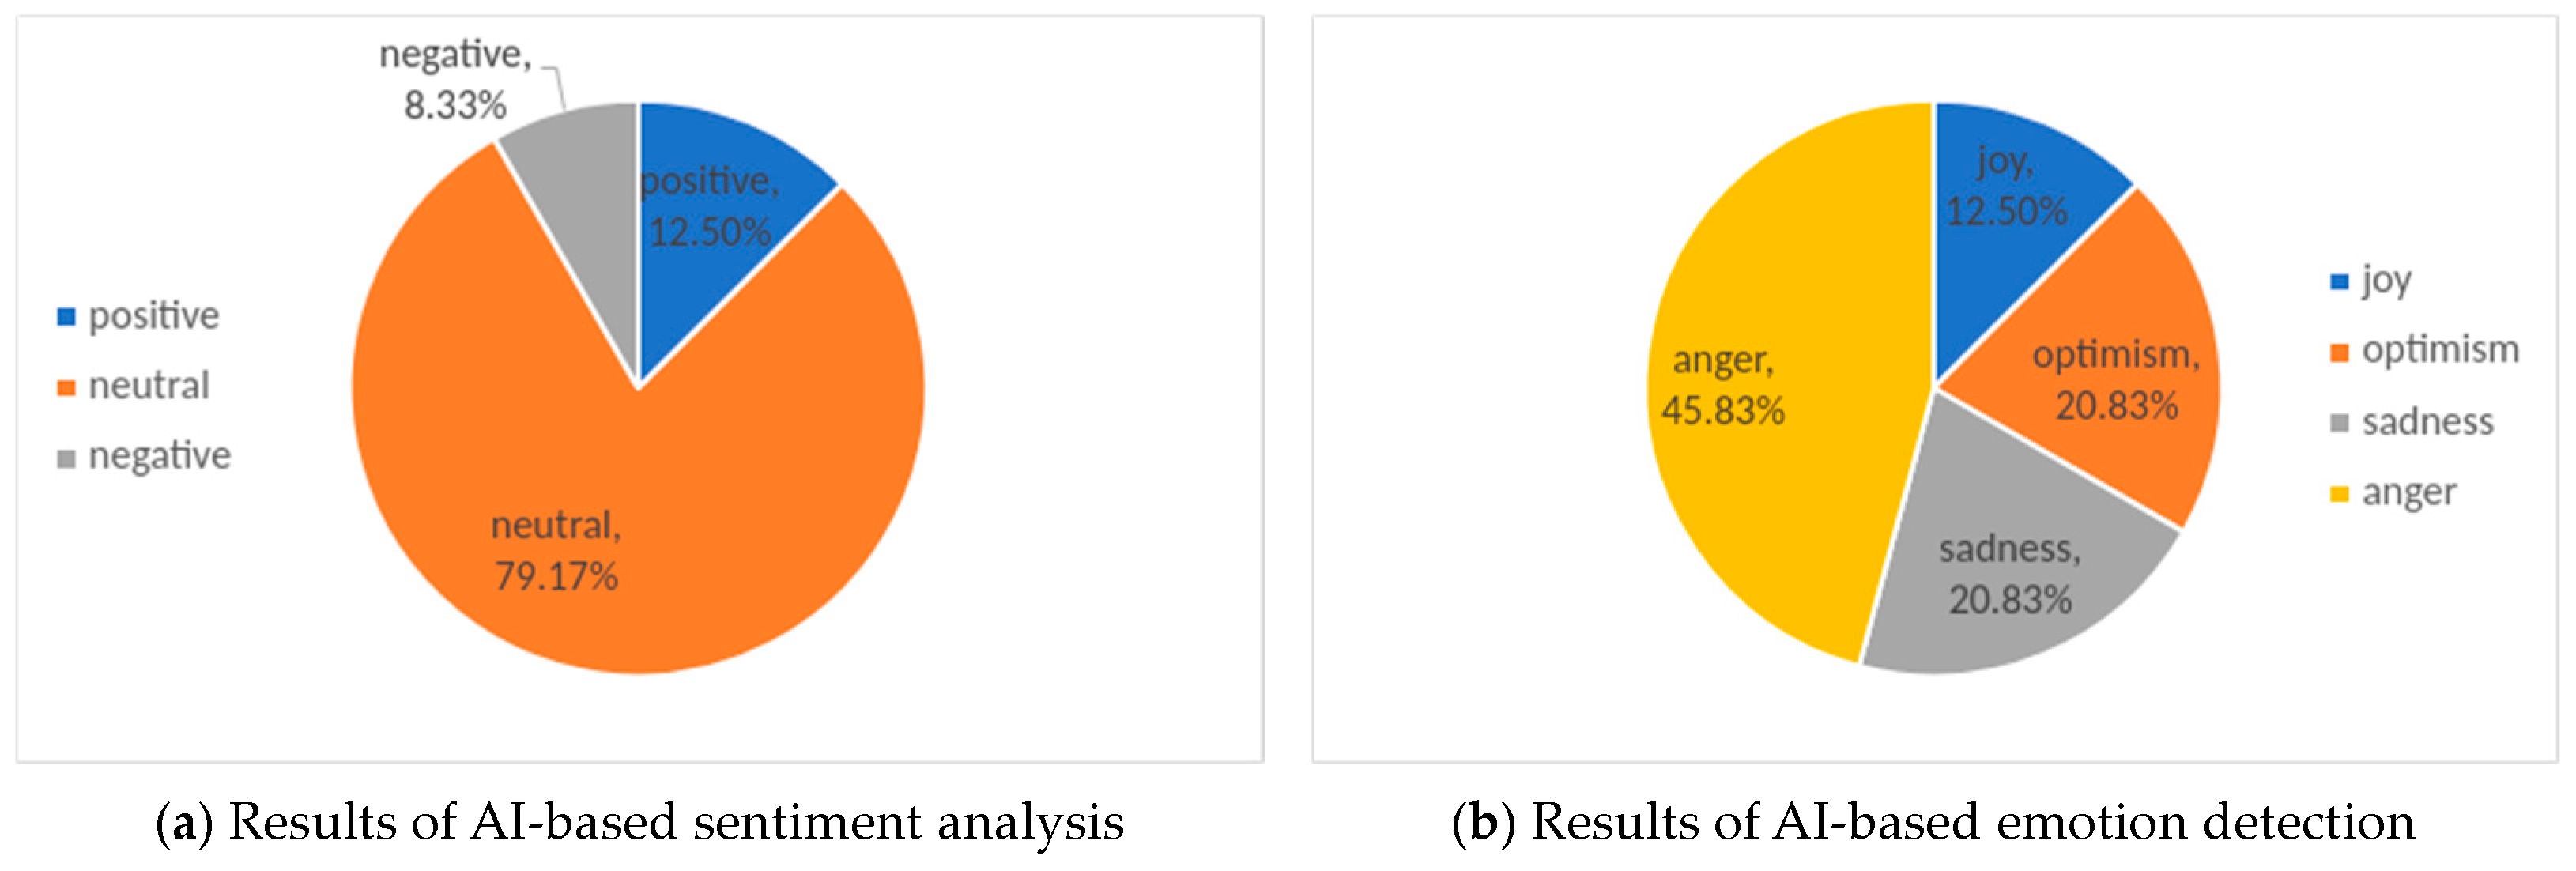
3.4. Sentiment Analysis

The travel mobility questionnaire also featured an open-ended question to further explore the factors that can contribute to improving women’s safety in transient environments, as follows: “Q9. Regarding safety and the risk of violence or harassment, what do you think it could help women feeling safer when using public transport or walking as part of everyday journeys?” This question aimed to gather qualitative insights on what could help women feel safer when using public transport or walking as part of their daily journeys, particularly in terms of safety and the risk of violence or harassment. This open question was intended to provide a more comprehensive understanding of influences on women’s safety in transient environments.
Furthermore, AI-based sentimental analysis and emotion detection were applied to textual answers to further analyse the open-ended question answers from the participants and help uncover potential hidden emotions. This was crucial to identifying underlying feelings, such as anger, joy, or optimism, which can inform improvements, refine strategies, and ensure that questionnaire analysis is accurately interpreted for more effective decision-making.
Of the total survey participants, 59% (N = 24) responded that they completed the above open-ended question. Our sentiment analysis, which classified the answers into three categories (i.e., positive, neutral, and negative), revealed that 79% of the responses showed neutral sentiment, with only 13% of the responses showing positive sentiment and 8% showing negative sentiment, as shown in Figure 4. These results aligned with expectations, as the participants were asked to suggest potential solutions to an identified issue, which was the main purpose of the open-ended question.
Nevertheless, it is important to point out that our results of emotion analysis were more surprising, with 46% of the responses showing ‘anger’, 13% showing ‘joy’, and the remaining responses showing equal amounts of ‘sadness’ and ‘optimism’ (i.e., 21% each). While only 8% of the responses showed negative sentiment, two-thirds of the responses showed negative emotions, and only 21% showed optimism. Considering the fact that the participants were asked what they think “could help women feeling safer when using public transport or walking as part of everyday journeys”, an answer showing ‘anger’ suggests that the participants may either have had unpleasant experiences during their travel in the past or be aware of someone who had such an experience. The lack of optimism shown in the answers also indicates the urgent need to restore confidence in using public transport and walking as part of everyday journeys amongst women in India through improved means to promote travel safety.

3.5. Limitations

Due to a low number of responses (N = 41) and the relatively small number of male and female participants, i.e., 7 and 33, respectively, the planned gender-stratified analysis on the travel behaviour mobility needs and differences between females and males could not be carried out. It has been reported that survey samples from lower-income countries tend to contain a higher proportion of males [50]. Therefore, it is reasonable to conclude that Indian men perceived this study as women-focused and did not prioritise participating. This could have contributed to the low response rate for male participants. Additionally, there is evidence that some gender-based violence incidents go unreported [12]. This could explain why, although the topic of women’s transport safety is important, Indian women may consider that there is a lack of appropriate governance and, thus, chose not to engage in this online survey. It is crucial to note that this study did not have the benefit of external funding, which would have allowed for participant rewards or compensation. This financial constraint, as pointed out by Lakens [47], is a common challenge faced by many scholars and can significantly impact the sample size of a study.
It is important to note that while this study’s findings may not be universally transferable to the Indian population, even with a larger sample size, the key factors influencing travel experience, including safety, security, and the built environment, may remain consistent. As mentioned in Section 3.3, despite the limitations posed by this study’s small sample size, our findings emphasise the complex interrelationships between travel behaviour, the built environment, and respondents’ sentiments. However, due to the limited responses from individuals, the findings may not be universally transferable to the Indian population. Despite the sample size constraints, the insights from this study reveal the potential for AI techniques to expand the range of preventive measures for improving future transportation safety and inclusivity.

4. Implications

In emerging economies, perceptions of fear and safety while travelling are relevant. India has been ranked as the most dangerous country for women due to alarming rates of gender-based violence, especially in public transportation and transit environments [36]. This study emphasises this sensitive issue by addressing how individuals perceive women’s feelings of safety while travelling in India, which may influence travel behaviour. Recognising the influence of women’s fear on their travel patterns is crucial to crafting impactful policies and initiatives and promoting shifts to more sustainable modes of travel. The practical implications of the findings presented in this study for policymakers and professionals in transportation, urban planning, and gender studies are significant. These implications can directly contribute to improving the understanding of key factors influencing the perception of travel safety and expand the understanding of the complex interrelationships between travel behaviour, the built environment, and user sentiments.
Governments worldwide are developing strategies for achieving climate neutrality and net zero mobility. This includes a strong focus on promoting active travel, such as walking and cycling, and reducing private car dependency in favour of public transport and shared mobility services. However, these initiatives will be inadequate if they ignore the safety and security needs of women, potentially exposing them to gender-based violence or providing services that they are not comfortable using.
Our study in India has uncovered significant insights that have practical implications for travel mode choice. We found that concerns about security and safety, which appeared in 57% and 46% of responses, respectively, play a crucial role. Moreover, our research has brought to the forefront the impact of the built environment, the transient nature of its surroundings, and the influence of women’s feelings, such as fear, on travel behaviour. These elements (built environment, feelings, and transient spaces) can lead to car dependency (44% of participants) or even avoidance of travel due to feelings of fear (27% of participants). This impact on travel behaviour creates barriers to sustainable mobility. It constrains women’s mobility, possibly leading them to use unwanted transport options, corroborating the claim by Stark & Meschik [16] about women with feelings of fear being prisoners or using unwanted transport options.
Furthermore, the influence of human feelings on safety perceptions needs to be acknowledged in urban and transport planning and provision. This is evident in the reduced acceptance of ride-sharing services (59%) compared to ride-hailing services (83%), which impedes a sustainable transition towards future mobility options. These findings stress the urgent and immediate need to integrate safety perceptions into sustainable mobility planning, prompting swift action from policymakers and ride-sourcing providers (e.g., Uber and Lyft).
To enhance travel safety for all individuals, particularly women and vulnerable groups such as the elderly and the disabled, it is crucial to incorporate innovative approaches. These approaches are necessary for more effective identification of risks and predictability of emergencies. Hence, it is essential to develop solutions with a human-centred design approach, which requires a deep understanding of how safety is perceived and what factors may influence this perception. This understanding is a key part of our research study. Due to its subjective nature, ‘perception’ should be further investigated. On the other hand, most studies considering the issue of gender-based violence and women’s mobility are based on questionnaires, such as [10,11,12,13]. Survey data relies on participants to accurately record their experiences or perform self-assessment. However, participants may not accurately recall previous experiences, and their opinions may be subject to unconscious bias. Beyond the traditional questionnaire data analysis, there is the opportunity to explore new techniques, such as AI and machine learning, to uncover what is crucial to providing unique insights into subjective data analysis, as demonstrated in this study. Our results based on the application of AI and emotion analysis were particularly revealing in uncovering potential hidden emotions, showing that 46% of participants expressed ‘anger’. In comparison, 13% showed ‘joy’ when discussing what could help women feel safer when using public transport or walking as part of their everyday journeys.
Perception, by nature, is somewhat subjective. To help policymakers and relevant professionals develop effective and sustainable interventions to promote travel safety for women, it is essential to understand the built environment and its transient nature that evokes insecurity or even fear. For example, our participants expressed that “public spaces occupied by suspicious people” (76% of participants) and “bus stops in a lonely place or without surveillance” (66% of participants) are the top two influential built environments for women’s perception of safety. It is unclear what “suspicious people” and “lonely place” entail for different individuals and whether the notion of “suspicious people” and “lonely place” have been affected by unconscious bias to some extent. A better understanding of what “suspicious people” and “lonely place” mean would help policymakers, government, and other relevant professionals to develop appropriate interventions for the community concerned, e.g., improved CCTV provision and monitoring, increased availability of homeless shelters, unconscious bias, etc. Future research could supplement subjective data (e.g., questionnaires) with other objective data or subjective data to gain a better understanding. More recently, researchers have acknowledged the benefits of augmenting questionnaire data with additional sources of information. For instance, a study examining gender differences in the adoption of future mobility options between men and women by surveying 8412 participants across eight European countries has taken a similar approach [51]. Despite the extensive sample size, the study revealed that integrating country-level economic indicators such as gross development product (GDP) and social equality indicators as the gender equality index equality can be a valuable method for forecasting gender-based variations in the acceptance of future mobility options [51]. Likewise, other data such as social media posts with AI-supported sentiment analysis can be used to analyse the meaning behind terms such as ‘safety’, ‘security’, ‘lonely’, and ‘suspicious people’. Additionally, travel diaries and location trackers could be used to collect objective data on travel patterns and route changes to analyse potential root causes of travel safety concerns among women. This will then help inform policymakers to implement appropriate interventions to promote safer and more gender-inclusive travel for women.
Finally, based on our study findings, it is clear that participants preferred technological solutions, such as wearing a wristband or spaces monitored with CCTV, over using a personal safety alarm or the women’s helpline to increase their safety while travelling. These preferences must be considered, and further research is crucial to enhance the effectiveness of these technological options. Recent advancements in AI offer a range of services that can significantly enhance women’s safety on public transport and in transient environments through various applications, as follows:
-
Smart CCTV/AI-powered CCTV [31] systems can monitor public transport for suspicious activities or unusual behaviour. They can alert security personnel in real time if they detect potential threats or harassment. Additionally, AI-driven facial recognition [52] enhances these systems by identifying known offenders or tracking suspicious individuals, aiding authorities in taking preventive action.
-
Crime hotspot prediction [30]: AI can analyse historical data and current trends to forecast high-risk areas and times for incidents, enabling authorities to allocate resources more effectively. Additionally, AI can recommend safer routes based on real-time data, historical patterns, and predictive insights, which could help women avoid potentially dangerous areas.
-
Personal safety [53]: AI-enhanced safety apps can enable women to send instant alerts to emergency contacts or authorities if they feel threatened. These apps can include features such as location tracking and automatic notifications. Additionally, AI can support voice-activated safety functions, allowing users to send alerts or request help without manual interaction, or even through health metrics monitoring.
-
Sentiment analysis [54]: AI can efficiently analyse passenger feedback and reports to identify common safety issues and emerging trends, providing valuable and quick insights to transport authorities to enhance safety measures, without the need for manual, time-consuming review.
The AI applications mentioned above are not specifically geared towards addressing women’s safety concerns, despite their contribution to general public safety. They lack features tailored to the unique safety needs of women. Developing specialised AI solutions aimed at women’s safety is crucial to significantly improve their effectiveness and provide more personalised protection in transient environments, influenced by both the built environment and temporal factors, such as the time of day and crowd levels in public spaces. Moreover, it is imperative to recognise the intricate relationship between travel behaviour, the built environment, and the sentiments of travellers. These relationships can significantly impact individuals’ readiness and willingness to adopt future mobility solutions, contributing to reduced GHG emissions, traffic noise, congestion, and need for allocated car parking. Understanding these complex connections is vital to comprehending how they can influence individuals’ trust in safety interventions such as CCTV or intelligent wristbands. An in-depth understanding of these factors is crucial to maximising the adoption of sustainable transportation solutions such as active travel and shared mobility and ensuring safer gender inclusivity.

Author Contributions

G.T.: Conceptualization, Survey design, Methodology, Formal analysis, Investigation, Writing—original draft, Review and editing. A.H.: AI-sentiment analysis application. Writing, Review and editing. S.H.S.W.: Writing, Review and editing. All authors have read and agreed to the published version of the manuscript.

Funding

This research received no external funding.

Institutional Review Board Statement

The study was conducted in accordance with the Declaration of Helsinki, and approved by the Institutional Review Board (or Ethics Committee) of Aston University. This study originated from a mini-project conducted as part of the British Council-funded Going Global Partnerships Exploratory Grant Top-Up project (Ref: 877629610) at Aston University in collaboration with Symbiosis Institute of Technology (SIT) in Pune, India. The mini-project did not involve any interventionary study involving humans or animals. Prior to conducting the survey, this study was reviewed by the Research Ethics Committee at the College of Engineering and Physical Sciences at Aston University via delegated approval authority for the CS4700/CS4705 Dissertation module. Approval was received on 16 June 2023 (Ref: 23MINIPRJ_2).

Informed Consent Statement

Informed consent was obtained from all subjects involved in the study.

Data Availability Statement

The data presented in this study are available on request from the corresponding author.

Acknowledgments

This work was part of the project titled “Industry-inspired Transnational Education in Artificial Intelligence/Machine Learning” (Project ID 877629610) under the British Council-funded Going Global Partnerships Programme. This British Council project was supported by a Going Global Partnerships—Top-up Exploratory Grant from the British Council. The first author and PI of this project acknowledge the support provided by Shivali Wagle, Simita Mahajan, and the contributions from students Anchal Pathak, Lavanya Sehgal, Ravi Goyani, and Smita Vidhate to the early stages of this project.

Conflicts of Interest

The authors declare no conflicts of interest.

Appendix A

Table A1. Potential technical solutions to increase women’s safety in transient environments.
Technical Solutions (Q8_1–Q8_4) MSDRelative Frequencies
Not at All Effective (1)Slightly (2)Moderately (3)Very Effective (4)Extremely Effective (5)
Q8_1: Carrying a personal safety alarm.3.221.229.7617.0731.7124.3917.07
Q8_2: Using the helpline for women.3.240.920.0019.5148.7819.5112.20
Q8_3: Using a fist band, (in-built sensor for heart rate and body temperature, to detect an emergency and send an alert signal along with GPS location to police and family members.3.761.074.884.8826.8336.5926.83
Q8_4: CCTV cameras will be installed and visible in the transit spaces.3.901.182.4414.6314.6326.8341.46

Appendix B

Table A2. Spearman rank-order correlations (ρ) matrix between.
Q1_1Q1_2Q1_3Q1_4Q1_5Q1_6Q1_7Q1_8Q2_1Q2_2Q2_3Q2_4Q2_5Q2_6Q2_7Q3_1Q3_2Q3_3Q3_4Q3_5Q3_6Q3_7Q4_1Q4_2Q4_3Q4_4Q4_5Q4_6Q4_7Q5Q6Q7 Q8_1 Q8_2 Q8_3 Q8_4 Age
Q1_11.000
Q1_20.0211.000
Q1_3−0.1150.635 **1.000
Q1_4−0.1650.434 **0.667 **1.000
Q1_50.1390.2330.0890.0911.000
Q1_6−0.3380.323 *0.475 **0.291−0.0241.000
Q1_70.0080.2900.405 **0.471 **0.0770.1981.000
Q1_80.397 *0.2600.402 **0.365 *0.080−0.1040.447 **1.000
Q2_10.432 **−0.143−0.123−0.1250.054−0.313 *−0.2970.0431.000
Q2_2−0.038−0.373 *−0.500 **−0.424 **0.111−0.020−0.157−0.250−0.0271.000
Q2_3−0.079−0.088−0.254−0.140−0.041−0.022−0.022−0.262−0.1220.417 **1.000
Q2_4−0.1170.051−0.0430.066−0.0790.186−0.054−0.096−0.0030.2000.493 **1.000
Q2_5−0.1300.0360.0130.072−0.0220.158−0.071−0.0850.0610.1570.559 **0.693 **1.000
Q2_60.329 *0.351 *0.2470.2460.053−0.257−0.0530.2630.223−0.109−0.1100.1910.0121.000
Q2_70.1850.1430.1190.280−0.146−0.242−0.0320.2100.156−0.0630.1650.1830.2250.653 **1.000
Q3_10.089−0.227−0.061−0.1000.1720.0460.0000.1110.040−0.014−0.175−0.0860.084−0.233−0.0871.000
Q3_20.277−0.282−0.305−0.2920.134−0.012−0.002−0.0540.1700.246−0.054−0.0480.009−0.239−0.2310.478 **1.000
Q3_30.196−0.078−0.190−0.1760.479 **−0.211−0.152−0.0470.1440.004−0.136−0.083−0.067−0.090−0.2720.533 **0.3051.000
Q3_40.1790.0780.030−0.1320.005−0.0130.0870.056−0.342 *−0.035−0.076−0.072−0.133−0.012−0.1680.1900.1280.2741.000
Q3_5−0.0980.084−0.0040.0530.2900.1500.083−0.1790.0480.2290.089−0.0270.049−0.146−0.1390.1620.488 **0.2040.0111.000
Q3_60.091−0.227−0.061−0.0540.185−0.070−0.1140.0690.2250.041−0.313 *−0.280−0.084−0.0690.0040.566 **0.373 *0.430 **0.0700.373 *1.000
Q3_70.248−0.208−0.1220.113−0.139−0.0880.050−0.0390.2010.102−0.1620.0190.0230.0610.0680.2370.2630.2060.1870.2630.2371.000
Q4_10.198−0.211−0.185−0.3070.0940.085−0.130−0.1090.0620.223−0.159−0.391−0.178−0.443 **−0.555 **0.3070.327 *0.2640.394 *0.1190.2010.2501.000
Q4_2−0.023−0.227−0.207−0.344−0.1360.113−0.296−0.1240.0400.084−0.0140.0980.060−0.013−0.0490.0240.1620.119−0.050−0.049−0.0850.0630.0941.000
Q4_30.236−0.048−0.068−0.268−0.0160.065−0.0260.0760.0890.048−0.077−0.197−0.085−0.1000.0140.1240.2950.079−0.0090.0750.0110.1500.0430.463 **1.000
Q4_4−0.1620.018−0.069−0.121−0.0170.135−0.102−0.0800.0300.1620.074−0.0580.222−0.234−0.1000.1200.1200.0770.1270.2200.1200.1560.2720.0180.3061.000
Q4_5−0.247−0.2120.1240.1840.0170.1260.036−0.017−0.107−0.072−0.106−0.020−0.113−0.229−0.0810.2220.204−0.089−0.0700.1030.1190.2060.060−0.088−0.0290.0771.000
Q4_60.093−0.171−0.070−0.049−0.1840.0880.0500.024−0.017−0.103−0.172−0.165−0.075−0.276−0.3660.2040.1460.1300.088−0.306−0.0280.1720.346 *0.0880.0940.0400.0191.000
Q4_70.013−0.106−0.139−0.2360.165−0.3140.091−0.1640.0070.010−0.033−0.190−0.217−0.091−0.1170.1110.1450.1210.0380.2980.268−0.123−0.026−0.360−0.240−0.382−0.179−0.2261.000
Q5−0.079−0.311 *0.105−0.025−0.353 *0.1090.0370.045−0.0820.1120.0750.072−0.0970.0690.053−0.005−0.033−0.1290.059−0.225−0.0050.092−0.019−0.005−0.231−0.2740.2490.1700.1051.000
Q60.1240.1260.1690.287−0.1040.0580.2370.157−0.2040.0660.1510.130−0.0330.2770.138−0.1900.036−0.1210.1950.036−0.1900.149−0.210−0.327 *0.007−0.1830.010−0.018−0.029.370 *1.000
Q70.1740.1020.1550.1040.234−0.009−0.0190.139−0.050−0.112−0.151−0.304−0.1720.1080.1920.125−0.0640.146−0.0170.1390.2290.1100.0800.0200.106−0.2270.146−0.1610.1620.1440.0131.000
Q8_1 0.062−0.144−0.074−0.002−0.198−0.335 *−0.1220.1500.200−0.2300.0710.195−0.0220.341 *0.385 *0.090−0.1720.1690.012−0.085−0.0180.068−0.421 **0.217−0.019−0.251−0.098−0.2040.0620.1550.0450.1421.000
Q8_2 0.0740.061−0.0090.166−0.046−0.0210.0480.1740.018−0.063−0.0380.2130.1040.362 *0.214−0.124−0.1610.016−0.227−0.039−0.1890.183−0.3030.229−0.083−0.175−0.205−0.067−0.1790.1830.350 *0.2540.314 *1.000
Q8_3 0.114−0.194−0.248−0.142−0.087−0.052−0.403 **−0.0600.006−0.0070.1600.378 *0.1930.0920.0770.059−0.0750.241−0.003−0.0270.020−0.098−0.1640.237−0.019−0.052−0.107−0.083−0.204−0.1570.069−0.1490.350 *0.2531.000
Q8_4 −0.292−0.131−0.288−0.0420.125−0.121−0.168−0.250−0.358 *0.0990.2050.1850.1910.0290.0250.103−0.0710.214−0.1240.1820.0000.044−0.1510.231−0.041−0.1110.131−0.1350.063−0.0620.0520.2640.2410.361 *0.375 *1.000
Age−0.251−0.042−0.130−0.0530.2490.272−0.101−0.278−0.2870.1970.0270.2110.005−0.178−0.357 *0.1070.2520.394 *0.1010.1480.031−0.003−0.0260.1900.0840.0140.1100.044−0.089−0.0320.137−0.193−0.190−0.0470.2390.2021
* Correlation is significant at the 0.05 level (2-tailed). ** Correlation is significant at the 0.01 level (2-tailed).

References

  1. Tovaas, K.; Govender, S.; Brand, R.; Masnata, M.; Melchiorre, C.; Lorenzini, A.; Sala, L.; Brooke, S.; Cottrill, C.; Wright, S.; et al. Compilation of 51 Case Study Profiles; Overviews and In-Depth Investigations; Report to the European Union’s Horizon Research and Innovation Programme Funded INCLUSION Project. 2019. Available online: https://www.rupprecht-consult.eu/fileadmin/migratedRupprechtAssets/Documents/INC_D3.3_51-case-study-profiles_pending-EU-approval.pdf (accessed on 23 December 2022).
  2. Kawgan-Kagan, I.; Popp, M. Sustainability and Gender: A mixed-method analysis of urban women’s mode choice with particular consideration of e-carsharing. Transp. Res. Procedia 2018, 31, 146–159. [Google Scholar] [CrossRef]
  3. Sovacool, B.K.; Kester, J.; Noel, L.; de Rubens, G.Z. The demographics of decarbonizing transport: The influence of gender, education, occupation, age, and household size on electric mobility preferences in the Nordic region. Glob. Environ. Chang. 2018, 52, 86–100. [Google Scholar] [CrossRef]
  4. DfT. National Travel Survey 2021: Trips by Purpose, Age and Sex. Department for Transport, UK Government. 2022. Available online: https://www.gov.uk/government/statistics/national-travel-survey-2021/national-travel-survey-2021-trips-by-purpose-age-and-sex (accessed on 7 September 2024).
  5. Saigal, T.; Vaish, A.K.; Rao, N.V.M. Gender and class distinction in travel behavior: Evidence from India. Ecofeminism Clim. Chang. 2021, 2, 42–48. [Google Scholar] [CrossRef]
  6. Loukaitou-Sideris, A. Fear and safety in transit environments from the women’s perspective. Secur. J. 2014, 27, 242–256. [Google Scholar] [CrossRef]
  7. Gardner, N.; Cui, J.; Coiacetto, E. Harassment on public transport and its impacts on women’s travel behaviour. Aust. Plan. 2017, 54, 8–15. [Google Scholar] [CrossRef]
  8. Rosenbloom, S. Women’s Travel Patterns, Attitudes, and Constraints Around the World. Int. Encycl. Transp. 2021, 193–202. [Google Scholar] [CrossRef]
  9. Adams, L.; Hilger, L.; Moselen, E.; Basi, T.; Gooding, O.; Hull, J. 2020 Sexual Harassment Survey; Government Equalities Office, UK Government. 2021. Available online: https://assets.publishing.service.gov.uk/media/60f03e068fa8f50c77458285/2021-07-12_Sexual_Harassment_Report_FINAL.pdf (accessed on 7 September 2024).
  10. del Mar Rodas-Zuleta, M.; Cardona, S.; Escobar, D.A. Gender-based violence and Women’s mobility, findings from a medium-sized Colombian city: A quantitative approach. J. Transp. Health 2022, 25, 101376. [Google Scholar] [CrossRef]
  11. Quinones, L.M. Sexual harassment in public transport in Bogotá. Transp. Res. Part A Policy Pract. 2020, 139, 54–69. [Google Scholar] [CrossRef]
  12. Shah, S.; Viswanath, K.; Vyas, S.; Gadepalli, S. Women and Transport in Indian Cities; Institute for Transportation & Development Policy (ITDP) and Safeipin: New Delhi. 2017. Available online: https://www.itdp.in/wp-content/uploads/2018/01/181202_Women-and-Transport-in-Indian-Cities.pdf (accessed on 7 September 2024).
  13. Ding, H.; Loukaitou-Sideris, A.; Agrawal, A.W. Sexual Harassment and Assault in Transit Environments: A Review of the English-language Literature. J. Plan. Lit. 2020, 35, 267–280. [Google Scholar] [CrossRef]
  14. Kumar, D.; Aggarwal, S. Analysis of Women Safety in Indian Cities Using Machine Learning on Tweets. In Proceedings of the Amity International Conference on Artificial Intelligence (AICAI), Dubai, United Arab Emirates, 4–6 February 2019; pp. 159–162. [Google Scholar] [CrossRef]
  15. Choudhary, M.; Dube, S.; Verma, R. Women Safety in Public Transport. Int. J. Manag. Technol. Eng. 2018, 8, 162–170. [Google Scholar]
  16. Stark, J.; Meschik, M. Women’s everyday mobility: Frightening situations and their impacts on travel behaviour. Transp. Res. Part F Traffic Psychol. Behav. 2018, 54, 311–323. [Google Scholar] [CrossRef]
  17. Alemi, F.; Circella, G.; Handy, S.; Mokhtarian, P. What influences travelers to use Uber? Exploring the factors affecting the adoption of on-demand ride services in California. Travel. Behav. Soc. 2018, 13, 88–104. [Google Scholar] [CrossRef]
  18. Acheampong, R.A.; Siiba, A.; Okyere, D.K.; Tuffour, J.P. Mobility-on-demand: An empirical study of internet-based ride-hailing adoption factors, travel characteristics and mode substitution effects. Transp. Res. Part C Emerg. Technol. 2020, 115, 102638. [Google Scholar] [CrossRef]
  19. Kumar, A.; Gupta, A.; Parida, M.; Chauhan, V. Service quality assessment of ride-sourcing services: A distinction between ride-hailing and ride-sharing services. Transp. Policy 2022, 127, 61–79. [Google Scholar] [CrossRef]
  20. Meshram, A.; Choudhary, P.; Velaga, N.R. Assessing and Modelling Perceived Safety and Comfort of Women during Ridesharing. Transp. Res. Procedia 2020, 48, 2852–2869. [Google Scholar] [CrossRef]
  21. Mukerjee, N. Investigating women’s safety in New Delhi’s urban transport systems. Int. J. Soc. Sci. Econ. Res. 2019, 4, 3876–3886. [Google Scholar]
  22. Renalds, A.; Smith, T.H.; Hale, P.J. A systematic review of built environment and health. Fam. Community Health 2010, 33, 68–78. [Google Scholar] [CrossRef]
  23. Basu, N.; Oviedo-Trespalacios, O.; King, M.; Kamruzzaman, M.; Haque, M.M. The influence of the built environment on pedestrians’ perceptions of attractiveness, safety and security. Transp. Res. Part F Traffic Psychol. Behav. 2022, 87, 203–218. [Google Scholar] [CrossRef]
  24. Brüchert, T.; Quentin, P.; Bolte, G. The relationship between perceived built environment and cycling or e-biking for transport among older adults–a cross-sectional study. PLoS ONE 2022, 17, e0267314. [Google Scholar] [CrossRef]
  25. Adlakha, D.; Hipp, J.A.; Sallis, J.F.; Brownson, R.C. Exploring Neighborhood Environments and Active Commuting in Chennai, India. Int. J. Environ. Res. Public Health 2018, 15, 1840. [Google Scholar] [CrossRef]
  26. Cerin, E.; Conway, T.L.; Adams, M.A.; Barnett, A.; Cain, K.L.; Owen, N.; Christiansen, L.B.; van Dyck, D.; Mitáš, J.; Sarmiento, O.L.; et al. Objectively-assessed neighbourhood destination accessibility and physical activity in adults from 10 countries: An analysis of moderators and perceptions as mediators. Soc. Sci. Med. 2018, 211, 282–293. [Google Scholar] [CrossRef] [PubMed]
  27. Yuan, Y.; Masud, M.; Chan, H.; Chan, W.; Brubacher, J.R. Intersectionality and urban mobility: A systematic review on gender differences in active transport uptake. J. Transp. Health 2023, 29, 101572. [Google Scholar] [CrossRef]
  28. Lorenc, T.; Petticrew, M.; Whitehead, M.; Neary, D.; Clayton, S.; Wright, K.; Thomson, H.; Cummins, S.; Sowden, A.; Renton, A. Environmental interventions to reduce fear of crime: Systematic review of effectiveness. Syst. Rev. 2013, 2, 30. [Google Scholar] [CrossRef] [PubMed]
  29. Torrao, G. Speed related variables for crash injury risk analysis: What has been used? Int. J. Crashworthiness 2021, 27, 1560–1567. [Google Scholar] [CrossRef]
  30. Kumar, J.S.; Amiruzzaman, M.; Bhuiyan, A.A.; Bhati, D. Predictive Analytics in Law Enforcement: Unveiling Patterns in NYPD Crime through Machine Learning and Data Mining. Res. Briefs Inf. Commun. Technol. Evol. 2024, 10, 36–59. [Google Scholar]
  31. Tsiktsiris, D.; Dimitriou, N.; Lalas, A.; Dasygenis, M.; Votis, K.; Tzovaras, D. Real-time abnormal event detection for enhanced security in autonomous shuttles mobility infrastructures. Sensors 2020, 20, 4943. [Google Scholar] [CrossRef]
  32. Zhang, M.; Li, T.; Yu, Y.; Li, Y.; Hui, P.; Zheng, Y. Urban Anomaly Analytics: Description, Detection, and Prediction. IEEE Trans. Big Data 2020, 8, 809–826. [Google Scholar] [CrossRef]
  33. Affonso, G.A.; De Menezes, A.L.; Nunes, R.B.; Almonfrey, D. Using Artificial Intelligence for Anomaly Detection Using Security Cameras. In Proceedings of the 2021 International Conference on Electrical, Computer, Communications and Mechatronics Engineering (ICECCME), Mauritius, 7–8 October 2021. [Google Scholar] [CrossRef]
  34. Papini, M.; Iqbal, U.; Barthelemy, J.; Ritz, C. The Role of Deep Learning Models in the Detection of Anti-Social Behaviours towards Women in Public Transport from Surveillance Videos: A Scoping Review. Safety 2023, 9, 91. [Google Scholar] [CrossRef]
  35. Akram, W.; Jain, M.; Hemalatha, C. Design of a Smart Safety Device for Women using IoT. Procedia Comput. Sci. 2019, 165, 656–662. [Google Scholar] [CrossRef]
  36. Huang, X.Y.; West, E.; Pinnelli, S.S.K. Crowdsourcing Data for Safer Travel Experiences for Women in India. In Proceedings of the Extended Abstracts of the 2023 CHI Conference on Human Factors in Computing Systems, Hamburg, Germany, 23–28 April 2023; pp. 1–6. [Google Scholar] [CrossRef]
  37. Adlakha, D.; Parra, D.C. Mind the gap: Gender differences in walkability, transportation and physical activity in urban India. J. Transp. Health 2020, 18, 100875. [Google Scholar] [CrossRef]
  38. Carlson, J.A.; Frank, L.D.; Ulmer, J.; Conway, T.L.; Saelens, B.E.; Cain, K.L.; Sallis, J.F. Work and Home Neighborhood Design and Physical Activity. Am. J. Health Promot. 2018, 32, 1723–1729. [Google Scholar] [CrossRef] [PubMed]
  39. Salvo, G.; Lashewicz, B.M.; Doyle-Baker, P.K.; McCormack, G.R. A Mixed Methods Study on the Barriers and Facilitators of Physical Activity Associated with Residential Relocation. J. Environ. Public Health 2018, 2018, 1094812. [Google Scholar] [CrossRef] [PubMed]
  40. Barbieri, F.; Camacho-Collados, J.; Neves, L.; Espinosa-Anke, L. TweetEval: Unified Benchmark and Comparative Evaluation for Tweet Classification. arXiv 2020, arXiv:2010.12421. [Google Scholar]
  41. Liu, Y.; Ott, M.; Goyal, N.; Du, J.; Joshi, M.; Chen, D.; Levy, O.; Lewis, M.; Zettlemoyer, L.; Stoyanov, V. RoBERTa: A Robustly Optimized BERT Pretraining Approach. 2019. Available online: https://arxiv.org/abs/1907.11692 (accessed on 20 September 2024).
  42. Vaswani, A.; Shazeer, N.; Jones, L.; Gomez, A.; Kaiser, L.; Polo, I.N.; Parmar, N.; Uszkoreit, J. The Annotated Transformer. Available online: https://nlp.seas.harvard.edu/2018/04/03/attention.html (accessed on 20 September 2024).
  43. Camacho-Collados, J.; Rezaee, K.; Riahi, T.; Ushio, A.; Loureiro, D.; Antypas, D.; Boisson, J.; Espinosa-Anke, L.E.; Liu, F.; Martínez-Cámara, E.; et al. TweetNLP: Cutting-edge Natural Language Processing for Social Media. arXiv 2022, arXiv:2206.14774. [Google Scholar]
  44. Abay, K.A.; Mannering, F.L. An empirical analysis of risk-taking in car driving and other aspects of life. Accid. Anal. Prev. 2016, 97, 57–68. [Google Scholar] [CrossRef]
  45. Venkatesh, V.; Thong, J.Y.; Xu, X. Consumer Acceptance and Use of Information Technology: Extending the Unified Theory of Acceptance and Use of Technology. MIS Q. 2012, 36, 157–178. [Google Scholar] [CrossRef]
  46. Zhang, Y.; Cui, J.; Ma, K.; Chen, H.; Zhang, J. A wristband device for detecting human pulse and motion based on the Internet of Things. Measurement 2020, 163, 108036. [Google Scholar] [CrossRef]
  47. Lakens, D. Sample size justification. Collabra Psychol. 2022, 8, 33267. [Google Scholar] [CrossRef]
  48. Fugard, A.J.B.; Potts, H.W.W. Supporting thinking on sample sizes for thematic analyses: A quantitative tool. Int. J. Soc. Res. Methodol. 2015, 18, 669–684. [Google Scholar] [CrossRef]
  49. Etz, K.E.; Arroyo, J.A. Small Sample Research: Considerations Beyond Statistical Power. Prev. Sci. 2015, 16, 1033–1036. [Google Scholar] [CrossRef]
  50. Nordhoff, S.; de Winter, J.; Kyriakidis, M.; van Arem, B.; Happee, R. Acceptance of Driverless Vehicles: Results from a Large Cross-National Questionnaire Study. J. Adv. Transp. 2018, 2018, 5382192. [Google Scholar] [CrossRef]
  51. Torrao, G.; Lehtonen, E.; Innamaa, S. The gender gap in the acceptance of automated vehicles in Europe. Transp. Res. Part F Traffic Psychol. Behav. 2024, 101, 199–217. [Google Scholar] [CrossRef]
  52. Coşkun, M.; Uçar, A.; Yildirim, Ö.; Demir, Y. Face recognition based on convolutional neural network. In Proceedings of the 2017 International Conference on Modern Electrical and Energy Systems (MEES), Kremenchuk, Ukraine, 15–17 November 2017; pp. 376–379. [Google Scholar] [CrossRef]
  53. Uma, J.; Suguna, S. IoT and AI Based Android App for Safety Assistance and Recommendation. In Proceedings of the 2024 5th International Conference on Intelligent Communication Technologies and Virtual Mobile Networks (ICICV), Tirunelveli, India, 11–12 March 2024; pp. 741–746. [Google Scholar]
  54. Qi, B.; Costin, A.; Jia, M. A framework with efficient extraction and analysis of Twitter data for evaluating public opinions on transportation services. Travel. Behav. Soc. 2020, 21, 10–23. [Google Scholar] [CrossRef]
Figure 1. Reasons associated with travel mode choice based on participants’ ratings.
Sustainability 16 08631 g001
Figure 2. Participants’ willingness to use ride source services. (a) Q5: In the future, would you feel comfortable using ride-sourcing services?; (b) Q6: In the future, would you feel comfortable using ride-hailing services, which provide access to only an individual, and no other unknown co-passengers can join that particular ride (e.g., Uber)?; and (c) Q7: In the future, would you feel comfortable using ride-sharing services (or shared cabs), where more than one passenger can book the same cab for different destinations?
Sustainability 16 08631 g002
Figure 3. Technical solutions to increase women’s safety in transient environments: Q8_1: Carrying a personal safety alarm; Q8_2: Using the helpline for women; Q8_3: Using a fist band, which has an in-built sensor that tracks the heart rate and body temperature, allowing it to detect an emergency and send an alert signal along with GPS location to the nearby police station and family members; and Q8_4: Feeling safer if CCTV cameras are installed and visible in transit spaces.
Sustainability 16 08631 g003
Figure 4. AI-based text analyses on answers to participants’ views on what could help women feel safer when using public transport or walking: (a) sentiment analysis; (b) emotion detection.
Sustainability 16 08631 g004
Table 1. Frequencies for the travel mode and reasons linked to travel mode choice.
Questionnaire Item MSDRelative Frequencies (%)
Travel mode (Q1_1–Q1_8) Never or on rare occasions1 to 3 days a monthFew days a weekSeveral days a weekEveryday
Q1_1: Walking more than 500 metres per trip. 3.81.39.89.812.226.841.5
Q1_2: Bicycle. 1.61.470.79.87.39.82.4
Q1_3: Electric bike.1.30.987.804.97.30
Q1_4: Electric shared scooter (e.g., rental or chartered electric scooter/motorcycle).1.61.070.79.89.89.80
Q1_5: Motorcycle or moped. 3.11.622.019.512.217.129.3
Q1_6: Car (as the driver). 1.91.356.114.69.814.64.9
Q1_7: Car (as a passenger of private cars/taxis). 2.91.212.231.722.024.49.8
Q1_8: Public transport (buses/trains/metro). 3.21.417.117.119.526.819.5
Reason (Q2_1–Q2_7) Strongly disagree (1)Disagree (2)Neutral (3)Agree (4)Strongly agree (5)
Q2_1: Choosing the most low-cost travel mode.3.31.12.424.426.829.317.1
Q2_2: Choosing the fastest travel mode.3.91.02.44.924.434.134.1
Q2_3: Choosing the most comfortable travel mode.4.01.12.47.317.131.741.5
Q2_4: Choosing the safest travel mode to avoid traffic accidents.4.20.90.07.314.631.746.3
Q2_5: Choosing the securest travel mode to avoid crime/violence/harassment.4.31.92.42.49.831.753.7
Q2_6: Choosing an active travel mode to physically exercise (walking/cycling).3.31.24.924.426.826.817.1
Q2_7: Choosing the most environmentally friendly travel mode.3.21.37.329.317.126.819.5
Table 2. Perceptions of women’s safety in transient environments: influence of the built environment and impact of feelings on travel behaviour.
Questionnaire Item Relative Frequencies (%)
How may the built environment influence the women’s perception of safety during travel? (Q3_1–Q3_7)
Q3_1: Poor street lighting.65.9
Q3_2: Deserted streets or roads.61.0
Q3_3: Characteristics of sidewalks (e.g., poor line of sight due to walls/trees).43.9
Q3_4: Public space occupied by suspicious people.75.6
Q3_5: Stations/train platforms deserted or without surveillance.61.0
Q3_6: Bus stop in lonely place or without surveillance.65.9
Q3_7: Other9.8
How would feelings of fear during everyday journeys change women’s travel? (Q4_1–Q4_7)
Q4_1: Travelling accompanied.63.4
Q4_2: Avoiding walking at night.65.9
Q4_3: Avoiding cycling at night.29.3
Q4_4: Change route.51.2
Q4_5: Using taxicabs or private vehicles.43.9
Q4_6: Not going out for a while.26.8
Q4_7: No change, keeping the same travelling habits.12.2
Disclaimer/Publisher’s Note: The statements, opinions and data contained in all publications are solely those of the individual author(s) and contributor(s) and not of MDPI and/or the editor(s). MDPI and/or the editor(s) disclaim responsibility for any injury to people or property resulting from any ideas, methods, instructions or products referred to in the content.

