Article

Patterns of Soil Stoichiometry Driven by Mixed Tree Species Proportions in Boreal Forest

1
Research Center for Engineering Ecology and Nonlinear Science, North China Electric Power University, Beijing 071003, China
2
Theoretical Ecology and Engineering Ecology Research Group, School of Life Sciences, Shandong University, Qingdao 266237, China
*
Author to whom correspondence should be addressed.
Sustainability 2024, 16(19), 8646; https://doi.org/10.3390/su16198646 (registering DOI)
Submission received: 8 July 2024 / Revised: 25 September 2024 / Accepted: 30 September 2024 / Published: 6 October 2024
(This article belongs to the Section Environmental Sustainability and Applications)

Abstract

:
Soil stoichiometry is essential for determining the ecological functioning of terrestrial ecosystems. Understanding the stoichiometric relationships in mixed forests could enhance our knowledge of nutrient cycling. In a mixed forest zone of Larix principis-rupprechtii (LP) and Betula Platyphylla (BP) in Hebei China, we conducted a study at six different sites with varying levels of tree species mixing. The proportion of L. principis-rupprechtii ranged from 0% to 100%, with intermediate values of 8.58%, 10.44%, 18.62%, and 38.32%. We compared soil stoichiometry, including carbon (C), nitrogen (N), and phosphorus (P), as well as chemical and physical properties across these sites. Piecewise structural equation modeling (piecewiseSEM) was used to assess the direct and indirect links between key ecosystem factors and their effects on soil stoichiometry. In mixed forests, the soil exhibited higher contents of soil organic matter (SOM), total nitrogen (TN), and total phosphorus (TP) compared to those in pure LP forests. Additionally, the soil C: N ratio in the 8.58% and 18.62% mixed forests as well as pure BP forests was significantly higher than that in LP forests. Structural equation modeling (SEM) revealed that the contents and ratios of soil C, N, and P exhibited different responses to mixed species proportions. The effect of mixed species proportions on soil nutrients was predominantly indirect, mediated primarily by variations in soil-available nutrients and, to a lesser extent, by physical properties and pH. Specifically, an increase in the proportion of LP in mixed forests had a direct negative effect on soil-available nutrients, which in turn had a positive effect on the content of SOM, TN, and TP and their respective ratios. Based on these findings, we can predict that soil nutrient limitation becomes more pronounced with increasing proportions of Larix principis-rupprechtii in the mixed forest. Our results emphasized the significance of changes in mixed species proportions on soil stoichiometry, providing valuable references for the sustainable development of forests.

1. Introduction

To understand biogeochemical cycles, ecological stoichiometry examines the balance and ratios of multiple chemical elements within ecosystems. [1]. Carbon (C), nitrogen (N), and phosphorus (P) in soil play a vital role in supporting plant growth and development, which largely determine plant physiology, nutrient cycling, and ecosystem productivity [2,3]. The soil C:N ratio serves as a sensitive indicator of soil quality by indicating the balance between carbon and nitrogen nutrients in the soil [4]. Previous studies have shown that there is a positive relationship between the soil C:N ratio and the rate of decomposition, indicating that soils with a higher C:N ratio tend to have a faster mineralization rate. [5]. The soil C:P ratio serves as an indicator of soil P mineralization and organic matter decomposition rate. As P primarily originates from weathering and leaching of rocks, in forest ecosystems, the uptake of P by plants gradually increases, resulting in an increasing limitation of P availability [4]. In general, the soil N:P ratio is related to nutrient limitations in ecosystems [6] and can indicate nitrogen saturation [7]. Strengthening the study of forest soil nutrient stoichiometry is crucial for achieving a deeper understanding of the carbon, nitrogen, and phosphorus cycles and their balance mechanisms [8,9].
Among forest ecosystems, soil ecology communities exhibit significant variation due to spatial heterogeneity resulting from different influencing factors [1,10,11]. Soil C, N, and P contents, as well as their ratios, are significantly influenced by both biotic and abiotic factors [5,12]. There have been several studies investigating the biogeographical patterns of soil nutrient stoichiometry in recent decades. For example, studies on the stoichiometry of C, N, and P in Mediterranean forest soils have shown that vegetation and soil depth simultaneously influence the C:N:P ratios [13]. It has been reported that the soil C:N (11.9), C:P (61), and N:P (5.2) ratios particularly the C:N ratios, demonstrated a relatively consistent pattern in the topsoil in China [14]. In subtropical plantations in Fujian Province, China, soil carbon and phosphorus levels decrease with the age of the plantation, and there was a close relationship between plant N:P ratios and soil N:P ratios [15]. Hui et al. conducted a study on soil C:N:P stoichiometry in tropical forests in Hainan, China [16]. In addition to soil C and N concentrations, as well as C:P and N:P ratios, they found significant vertical heterogeneity, but relatively little variation in soil P concentration and C:N ratio across depths. The study suggested that environmental factors influence soil element stoichiometry more than vegetation cover and tree height.
Tree species have a significant influence on nutrient cycling and soil biota. Numerous studies have highlighted the advantages of mixed plantations across various conditions [17,18,19]. Mixed forests have been recognized for their potential to enhance ecosystem C storage, with evidence of increased aboveground C levels [20,21]. Tree roots play a crucial role not only in water and nutrient uptake but also in nutrient cycling and accumulation. Mixing tree species with diverse root characteristics can lead to more efficient utilization of soil space, and temporal or spatial niche partitioning in the soil can increase root biomass [22]. Previous studies have confirmed that mixed forests can enhance soil properties and nutrient concentrations [23]. However, there is limited understanding of how different mixing patterns impact soil properties. Soil C, N, and P concentrations and stoichiometric ratios can be affected by soil physicochemical properties (e.g., pH, bulk density, and porosity) [24,25]. Investigating the patterns and mechanisms of soil carbon (C), nitrogen (N), and phosphorus (P) contents and their stoichiometry in forests is crucial for enhancing our understanding and predicting biogeochemical cycling processes.
The boreal forest system holds significant importance as a forest resource in China. However, due to historical unsustainable exploitation and the fragile ecological environment, the boreal forest ecosystem has suffered severely [26]. The study area is dominated by forest vegetation, with succession mainly focused on Betula Platyphylla. This species typically serves as pioneer trees in secondary successional sequences after disturbances such as fires, quickly establishing pure Betula Platyphylla forests [27,28]. In addition, the area also includes a substantial presence of planted Larix principis-rupprechtii, which exhibit varying degrees of mixed coniferous composition with Betula Platyphylla. Consequently, the distribution of forests in the region is crucial for studying soil stoichiometry patterns and understanding their driving mechanisms in cold temperate forest systems. In this study, our main objective was to examine the changes in soil C, N, and P concentrations, as well as their ratios, in the core area of the Winter Olympics, China. We specifically focus on different mixed species proportions and soil depths. Additionally, we aim to investigate the influence of environmental variables on soil nutrient stoichiometry by piecewise structural equation modeling (piecewiseSEM). Our specific hypotheses were as follows: (1) we hypothesized that soil C, N, and P contents, as well as their ratios (C:N, C:P, and N:P) would be significantly affected by soil layers and mixed species proportions, and (2) we hypothesized that the responses of soil C, N, and P contents and ratios to mixed species proportions would differ, and we expected soil nutrient limitation to intensify with increasing Larix principis-rupprechtii mixing ratios.

2. Materials and Methods
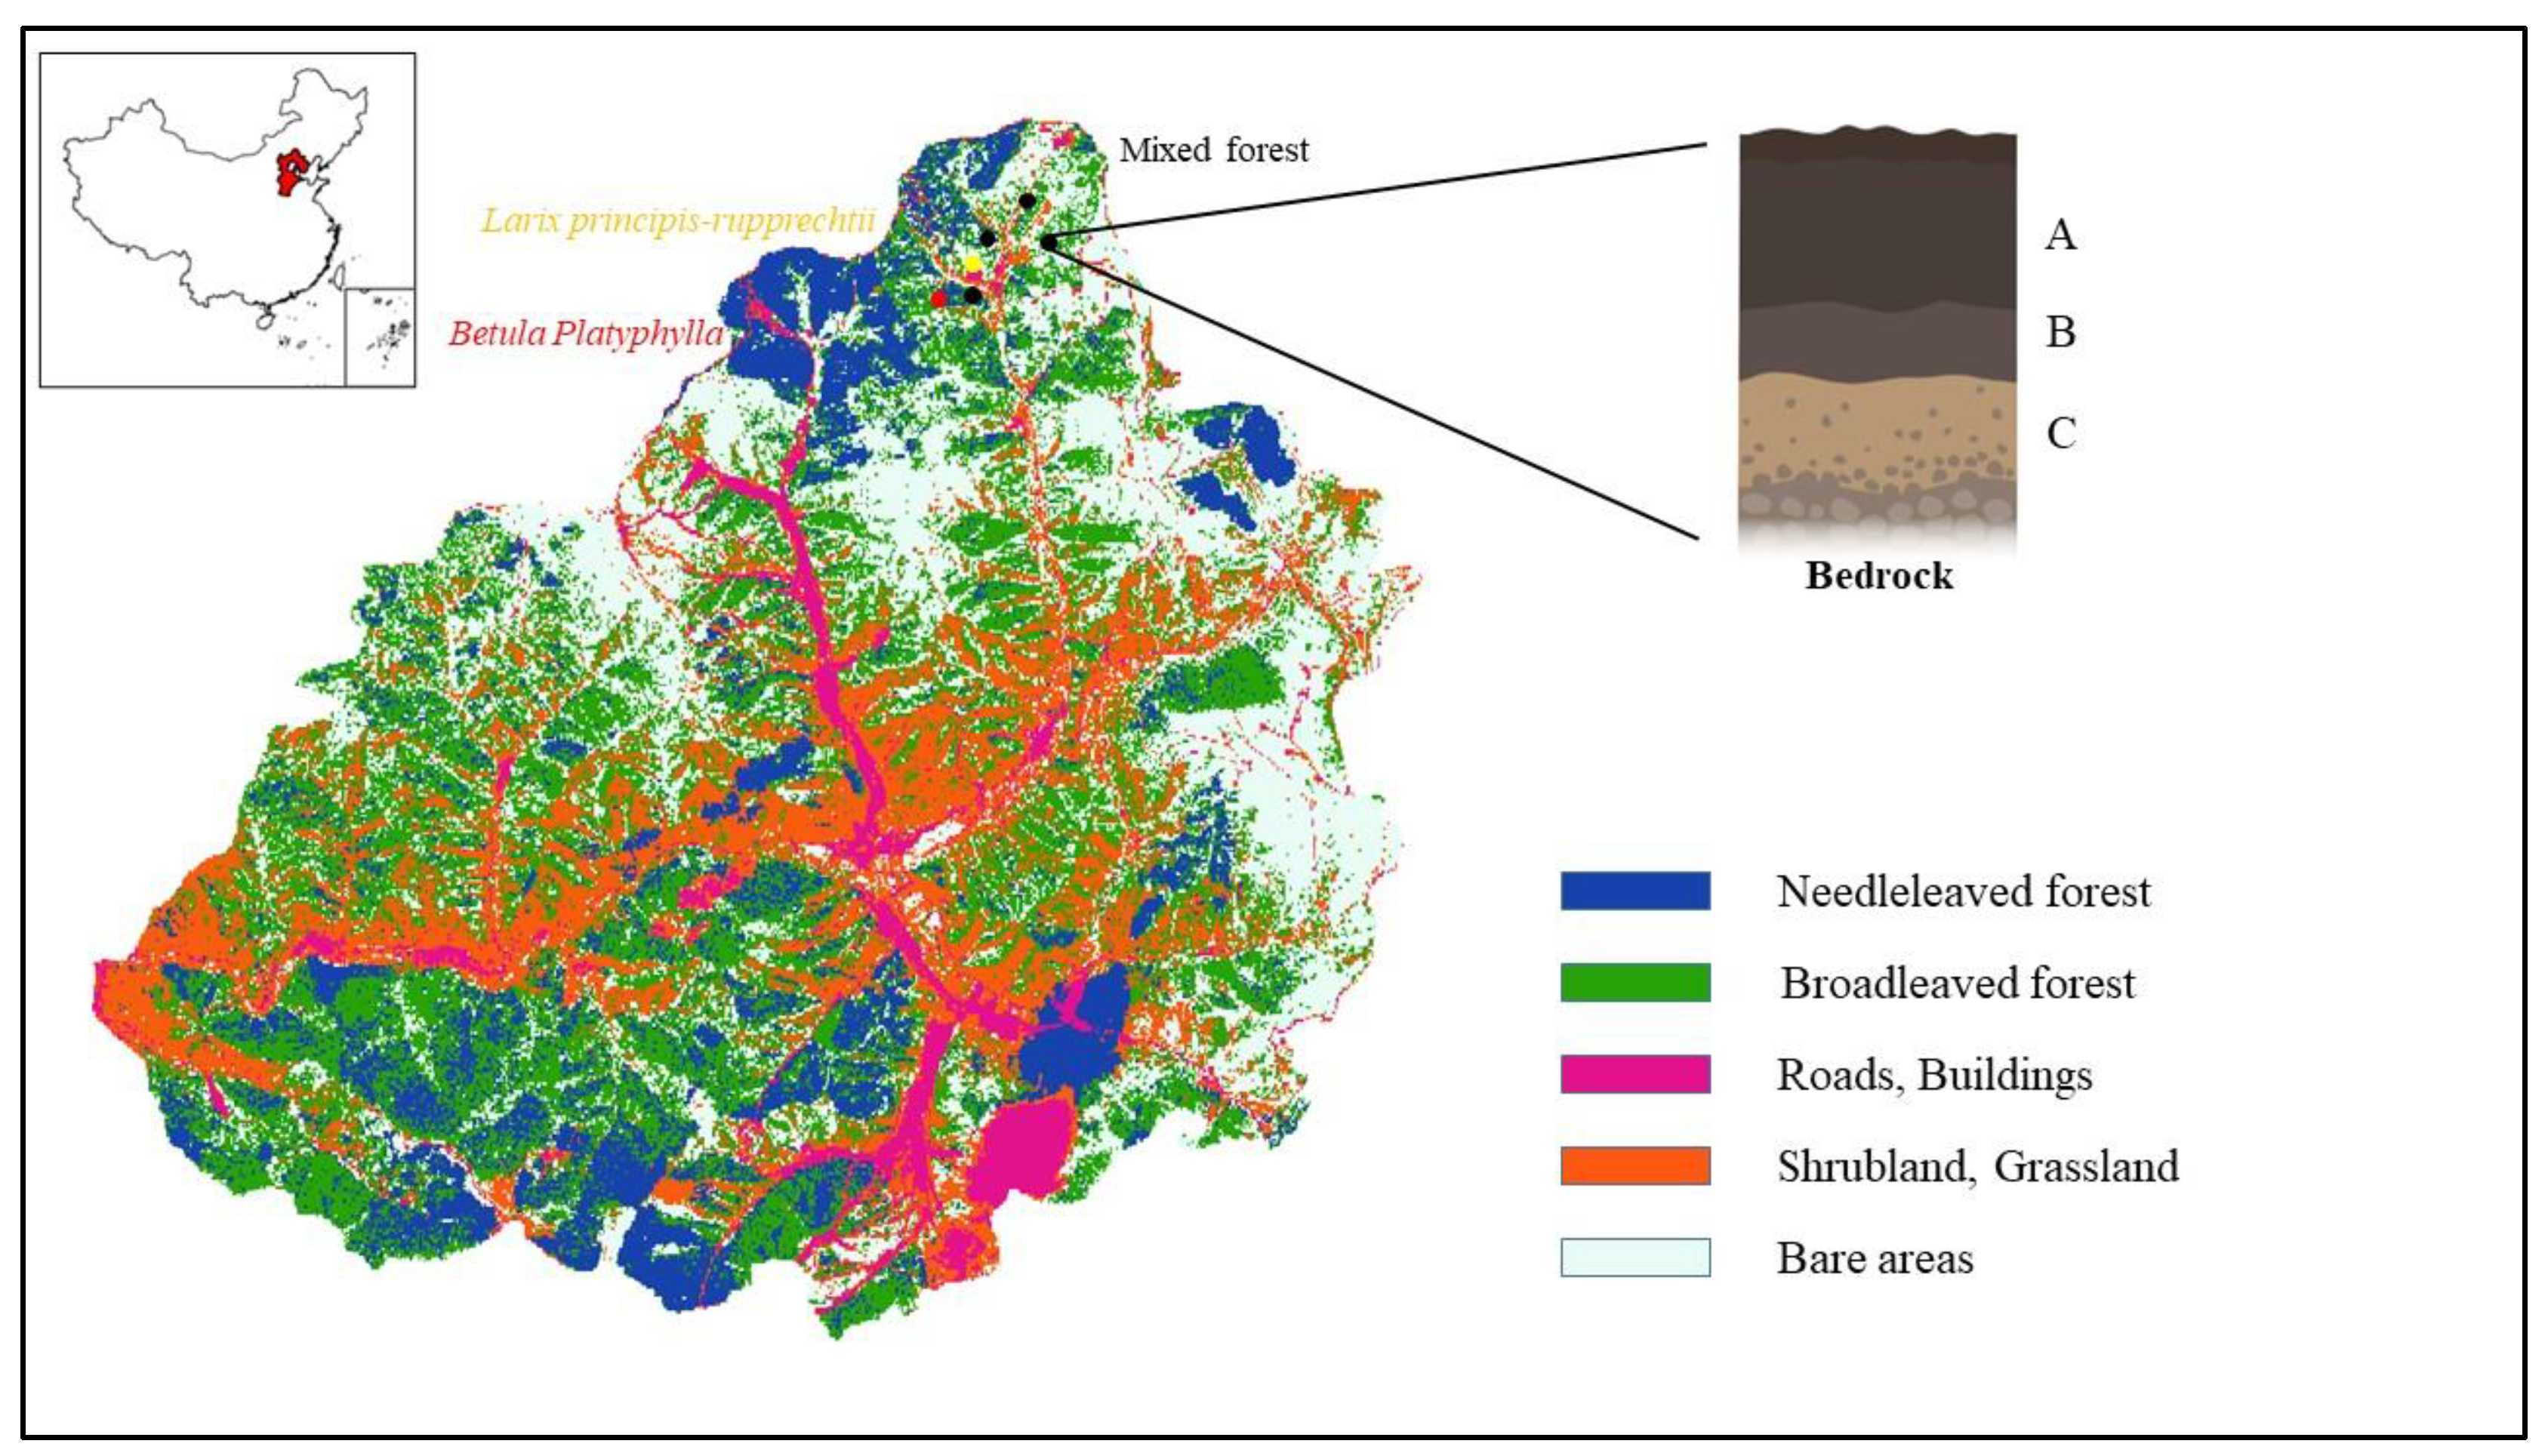
2.1. Study Area

This study was conducted in the core area of the Winter Olympics (Figure 1), located approximately 22 km northeast of Chongli District, in Hebei Province, China (40°47′ N to 41°17′ N and 114°17′ E to 115°34′ E). The altitude of this area ranges from 1797 m to 2003 m. This region experiences a typical East Asian continental monsoon climate, characterized by cool, humid summers and cold winters. The average annual temperature ranges from 3.7 °C to 19 °C, and the annual precipitation is approximately 483.3 mm. The forest coverage rate in the study area reached 67% in 2021, indicating a significant presence of forests. However, the forest structure in this region is relatively simple. Within the forests of Chongli, there are as many as 553 species of terrestrial wild plants belonging to 301 genera and 80 families (Chongli District of Zhangjiakou Municipal People’s Government; www.zjkcl.gov.cn) (accessed on 26 August 2021). Apart from the 70% primary Betula Platyphylla forests, which make up 70% of the forested area, there are several other tree species present, such as Larix principis-rupprechtii, Picea asperata, and Pinus sylvestris var. mongolica. The forest soil consists mainly of chestnut soil with a small amount of black soil.

2.2. Experimental Design

We conducted sampling in six forest types including pure Betula Platyphylla forests (BP), pure Larix principis-rupprechtii forests (LP), and four mixed forests with varying Larix principis-rupprechtii proportions: 8.58% (LB1), 10.44% (LB2), 18.62% (LB3), and 38.32% (LB4). The sampling was carried out between July and September 2018. In each forest, we established a large 100 m × 100 m sample plot. Within each quadrat, three soil profiles were sampled at equal intervals from the bottom to the top of the slope. Each profile was divided into three soil formation layers: A (leached horizon), B (illuvial horizon), and C (c-horizon).

2.3. Soil Sample Collection and Chemical Analyses

During the sampling process, the surface covering of litter and other debris was removed first. Following this, a 1 m depth soil profile was excavated with a shovel, and the soil layers were sampled using a ring knife. In each plot, two ring knife samples were collected, and mixed soil samples were analyzed for physical and chemical properties.
We sieved the soil samples with a 2 mm sieve to remove coarse materials. In order to determine the soil bulk density (g/cm3), the natural state soil samples taken by the ring knife were dried in an oven at 105 °C for 48 h to obtain a constant weight. To determine the total porosity, the soil was saturated with water, and the saturated soil was then weighted. Total porosity was calculated as saturated soil weight divided by oven-dried soil weight. The pH of the soil was measured using a pH meter (type: PHS-3C by China) with soil and water mixed in a ratio of 2.5:1. An external heating method employing potassium dichromate and concentrated sulfuric acid was used to determine the soil organic matter (SOM) content [29]. Purging and trapping techniques were used to determine the concentrations of alkali-hydrolyzable nitrogen (AHN) and total nitrogen (TN) by an elemental analyzer (type: Elementar Vario Macro cube by Germany). The total phosphorus (TP) and available phosphorus (AP) were determined by inductively coupled plasma−optical emission spectrometry (type: Agilent 5110 ICP–OES by the USA) [30].

2.4. Statistical Analysis

Due to significant variations in the chemical composition of soil nutrients across different soil layers within the same forest (Table S1), each soil sample at different depths was assigned a weighted average value to represent its unique value in the subsequent analysis. [31,32]. The depth-weighted value of the soil profile was calculated as follows:
d e p t h w e i g h t e d = i = 1 n A i × B D i × D i i = 1 n B D i × D i
where i , represents different soil layers, and n represents the total number of soil layers. A i indicates the specific content in the i soil layer, and B D i and D i represent the soil bulk density and depth of the i soil layer, respectively.
The concentrations of SOM, AHN, AP, TN, and TP were reported as mass content. The values of C:N, C:P, and N:P were reported as mass ratios. Soil properties of mixed layers of different tree species were compared using an analysis of variance (ANOVA) and Duncan’s test. Normality and homogeneity of variance will be assessed before analyses are performed. If these assumptions were not met, data would be rank transformed. The significance level was set as α = 0.05. A Pearson correlation analysis and redundancy analysis (RDA) were conducted to explore the associations between SOM, TN, and TP stoichiometry, as well as environmental drivers. The objective was to identify the primary factors affecting the characteristics of soil ecological chemometrics.
In order to explore the mechanisms underlying soil C, N, and P stoichiometry responses to the mixed species proportions, piecewise structural equation modeling (piecewiseSEM) was utilized. This modeling approach makes it possible to assess the direct and indirect relationships between key ecosystem factors and their impact on soil stoichiometry. According to prior knowledge and theoretical frameworks [31], several variables were selected to be included in the models. The selected variables included mixed species proportions, bulk density (BD), soil porosity (SP), pH, alkali-hydrolyzable nitrogen (AHN), and available phosphorus (AP) (Table S2). To streamline the analysis and ensure computational feasibility, composite variables were used to represent soil physical properties and available nutrients. These composite variables allowed for a more concise evaluation of multiple pathways within the model. Additionally, we constructed a full model that incorporated all reasonable pathways (Table S3). Where a variable directly affects another variable, that is, where there is a causal relationship between the two variables, we refer to this as a direct effect, and where one variable affects another variable through a mediating variable, we refer to this as an indirect effect. Direct and indirect paths with low path coefficients were removed by sequentially deleting them, and the a priori model was ultimately refined to improve its accuracy and interpretability. A piecewise SEM analysis was performed using the “piecewiseSEM” package [33]. We used Fisher’s C test to evaluate the goodness-of-fit characteristic of the modeling results [34]. The models were iteratively modified and refined based on the significance of pathways (p < 0.05) and the goodness of fit (0 ≤ Fisher’s C/df ≤ 2 and 0.05 < p ≤ 1.00).
All statistical analyses were conducted using SPSS 25.0 Software (IBM, Armonk, New York, NY, USA) and R 4.0.5 (R Development Core Team 2021).

3. Results

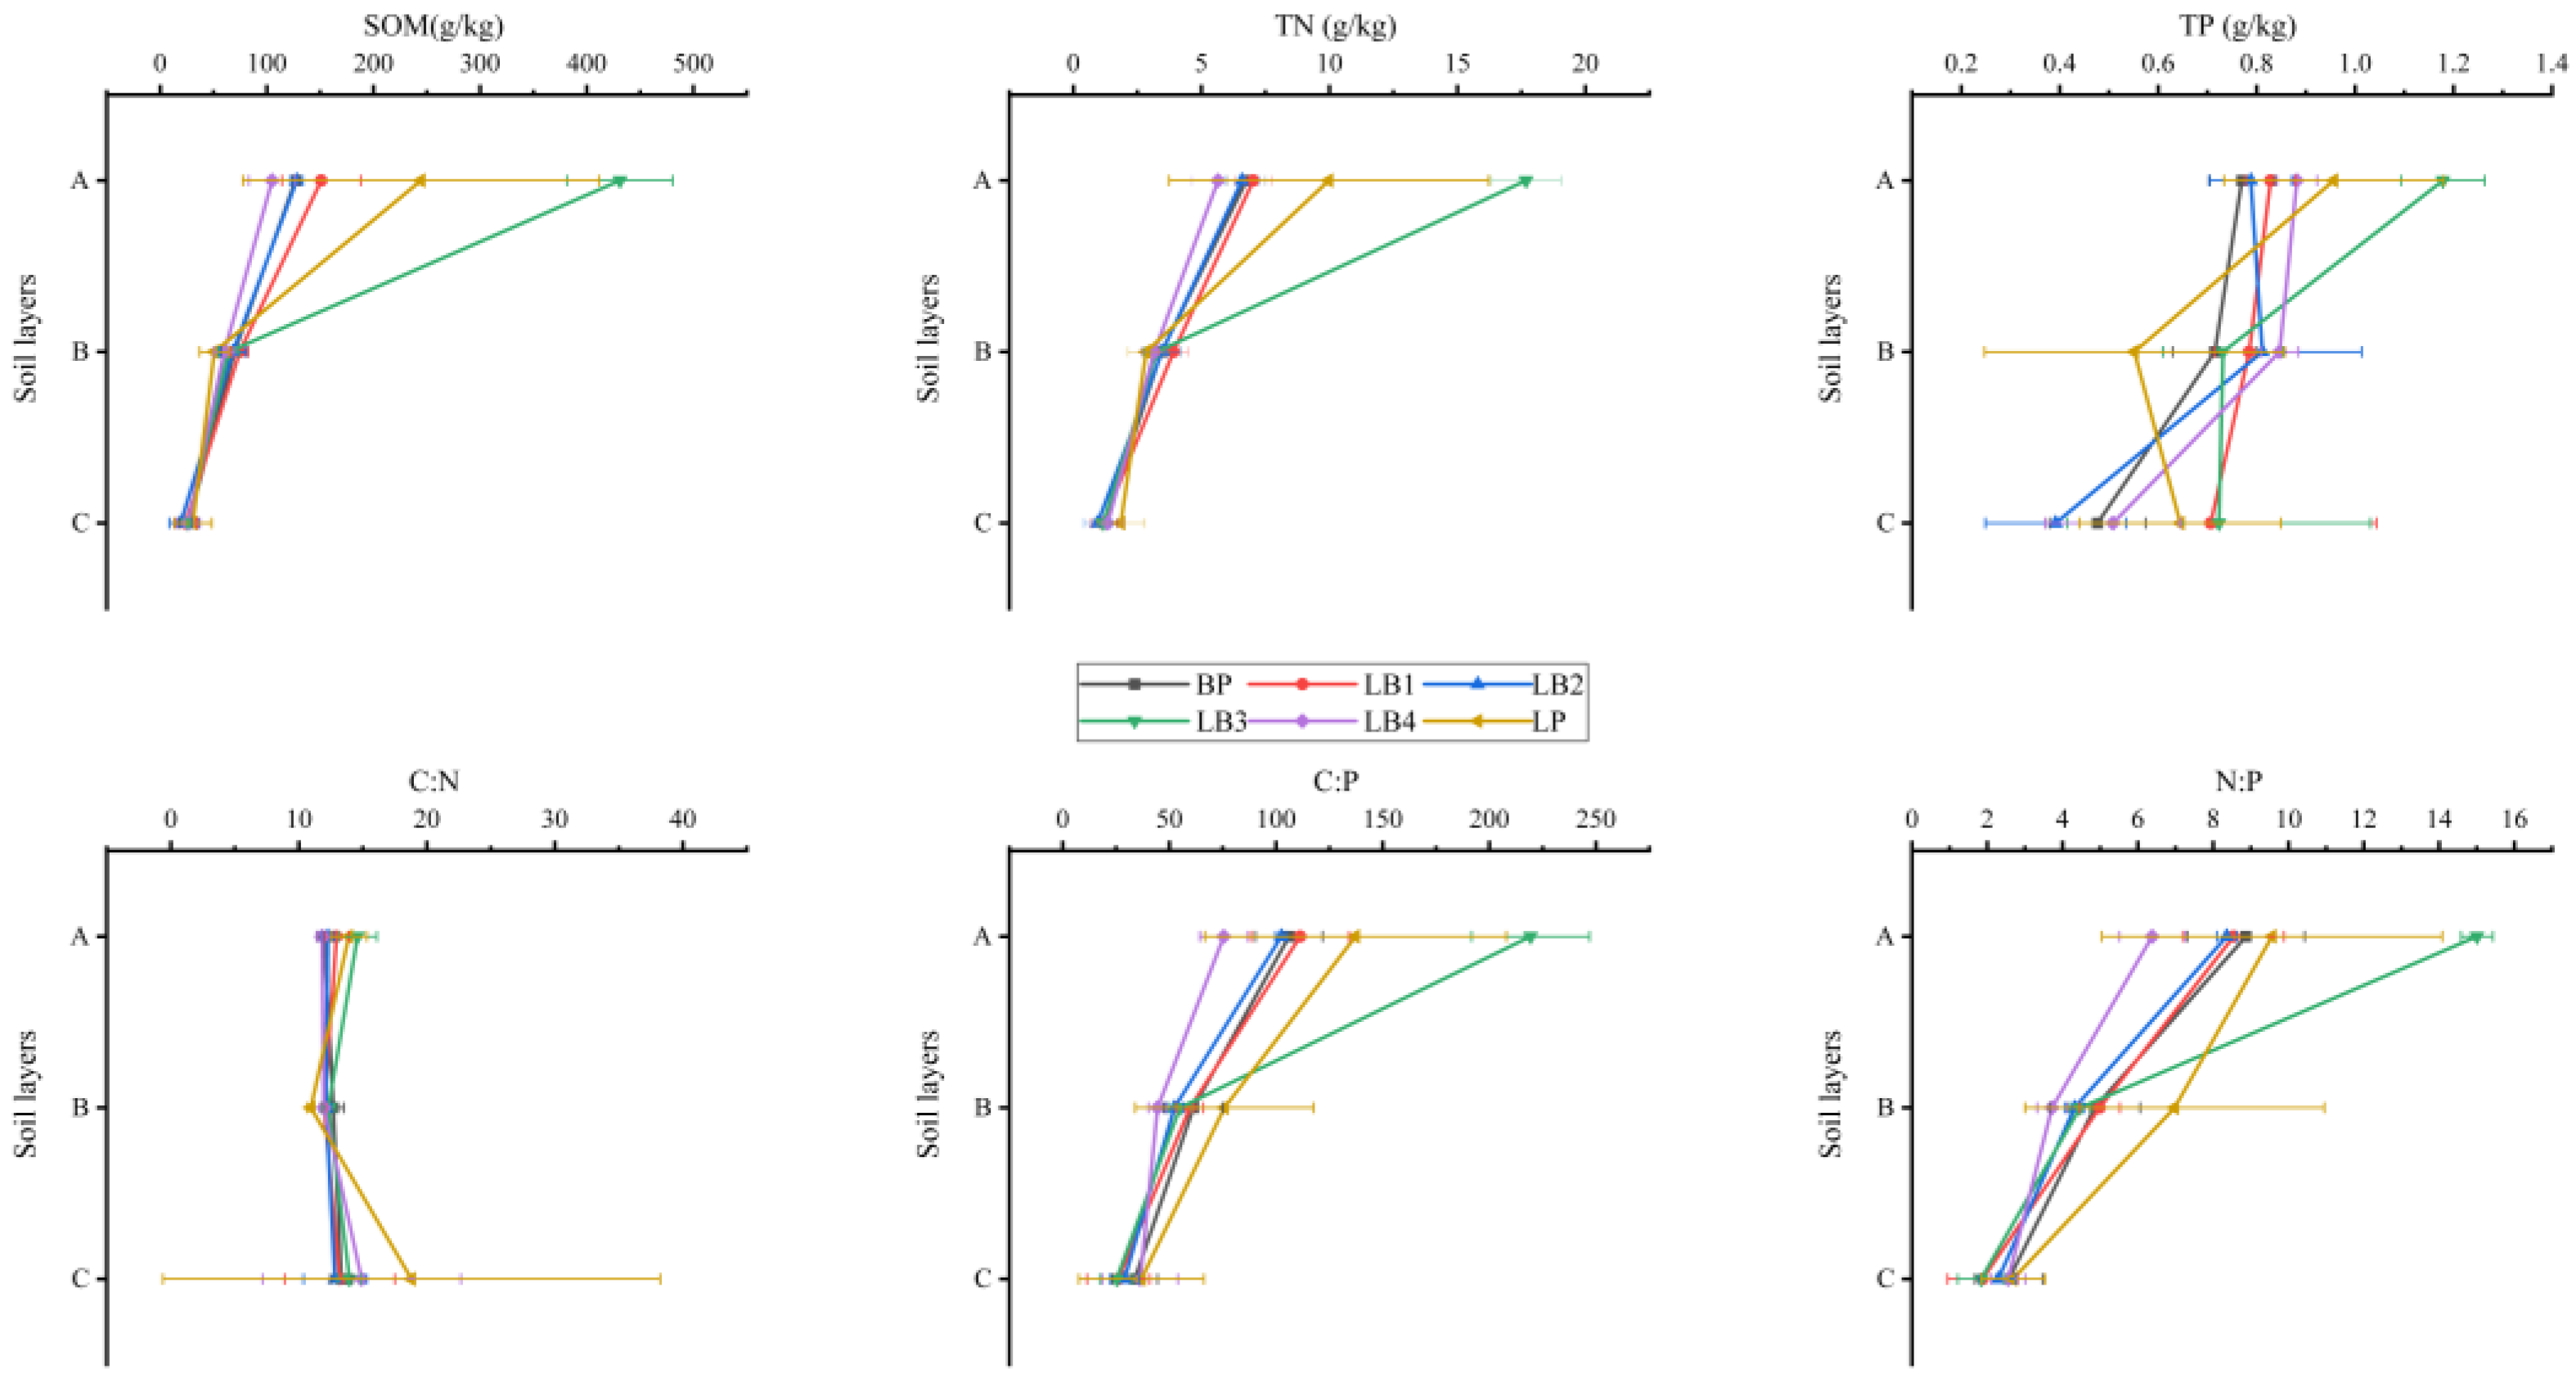
3.1. Variations of Soil C, N, and P Stoichiometry in Soil Profile

Throughout the entire profiles of BP, LB1, LB2, and LB4 forests, the content of SOM consistently decreased as soil depth increased (Figure 2). However, there were no significant differences in SOM content between B and C layers in LB3 and LP forests (Table S1). Similarly, TN content decreased with the increasing soil depth in all types of other forests (Table S1). Regarding the TP content, there was still a decreasing trend with increasing soil depth, although the trend was not as pronounced as that of SOM and TN (Figure 2). Significant differences in soil carbon-to-nitrogen ratios were observed only between different soil horizons in BP and LP 3 forests. Soil C:P and N:P ratios showed significant differences among the various soil layers and demonstrated a decreasing trend with increasing soil depth across the entire profiles (Table S1).
Overall, SOM, TN, and TP contents and their ratios varied mainly among different soil layers (Table S1). In LB3 mixed forests, the SOM, TN, and TP contents, as well as the C:P ratio, were higher than that in other types of forests. However, the soil C:N and N:P ratios were relatively stable in different forest soils.

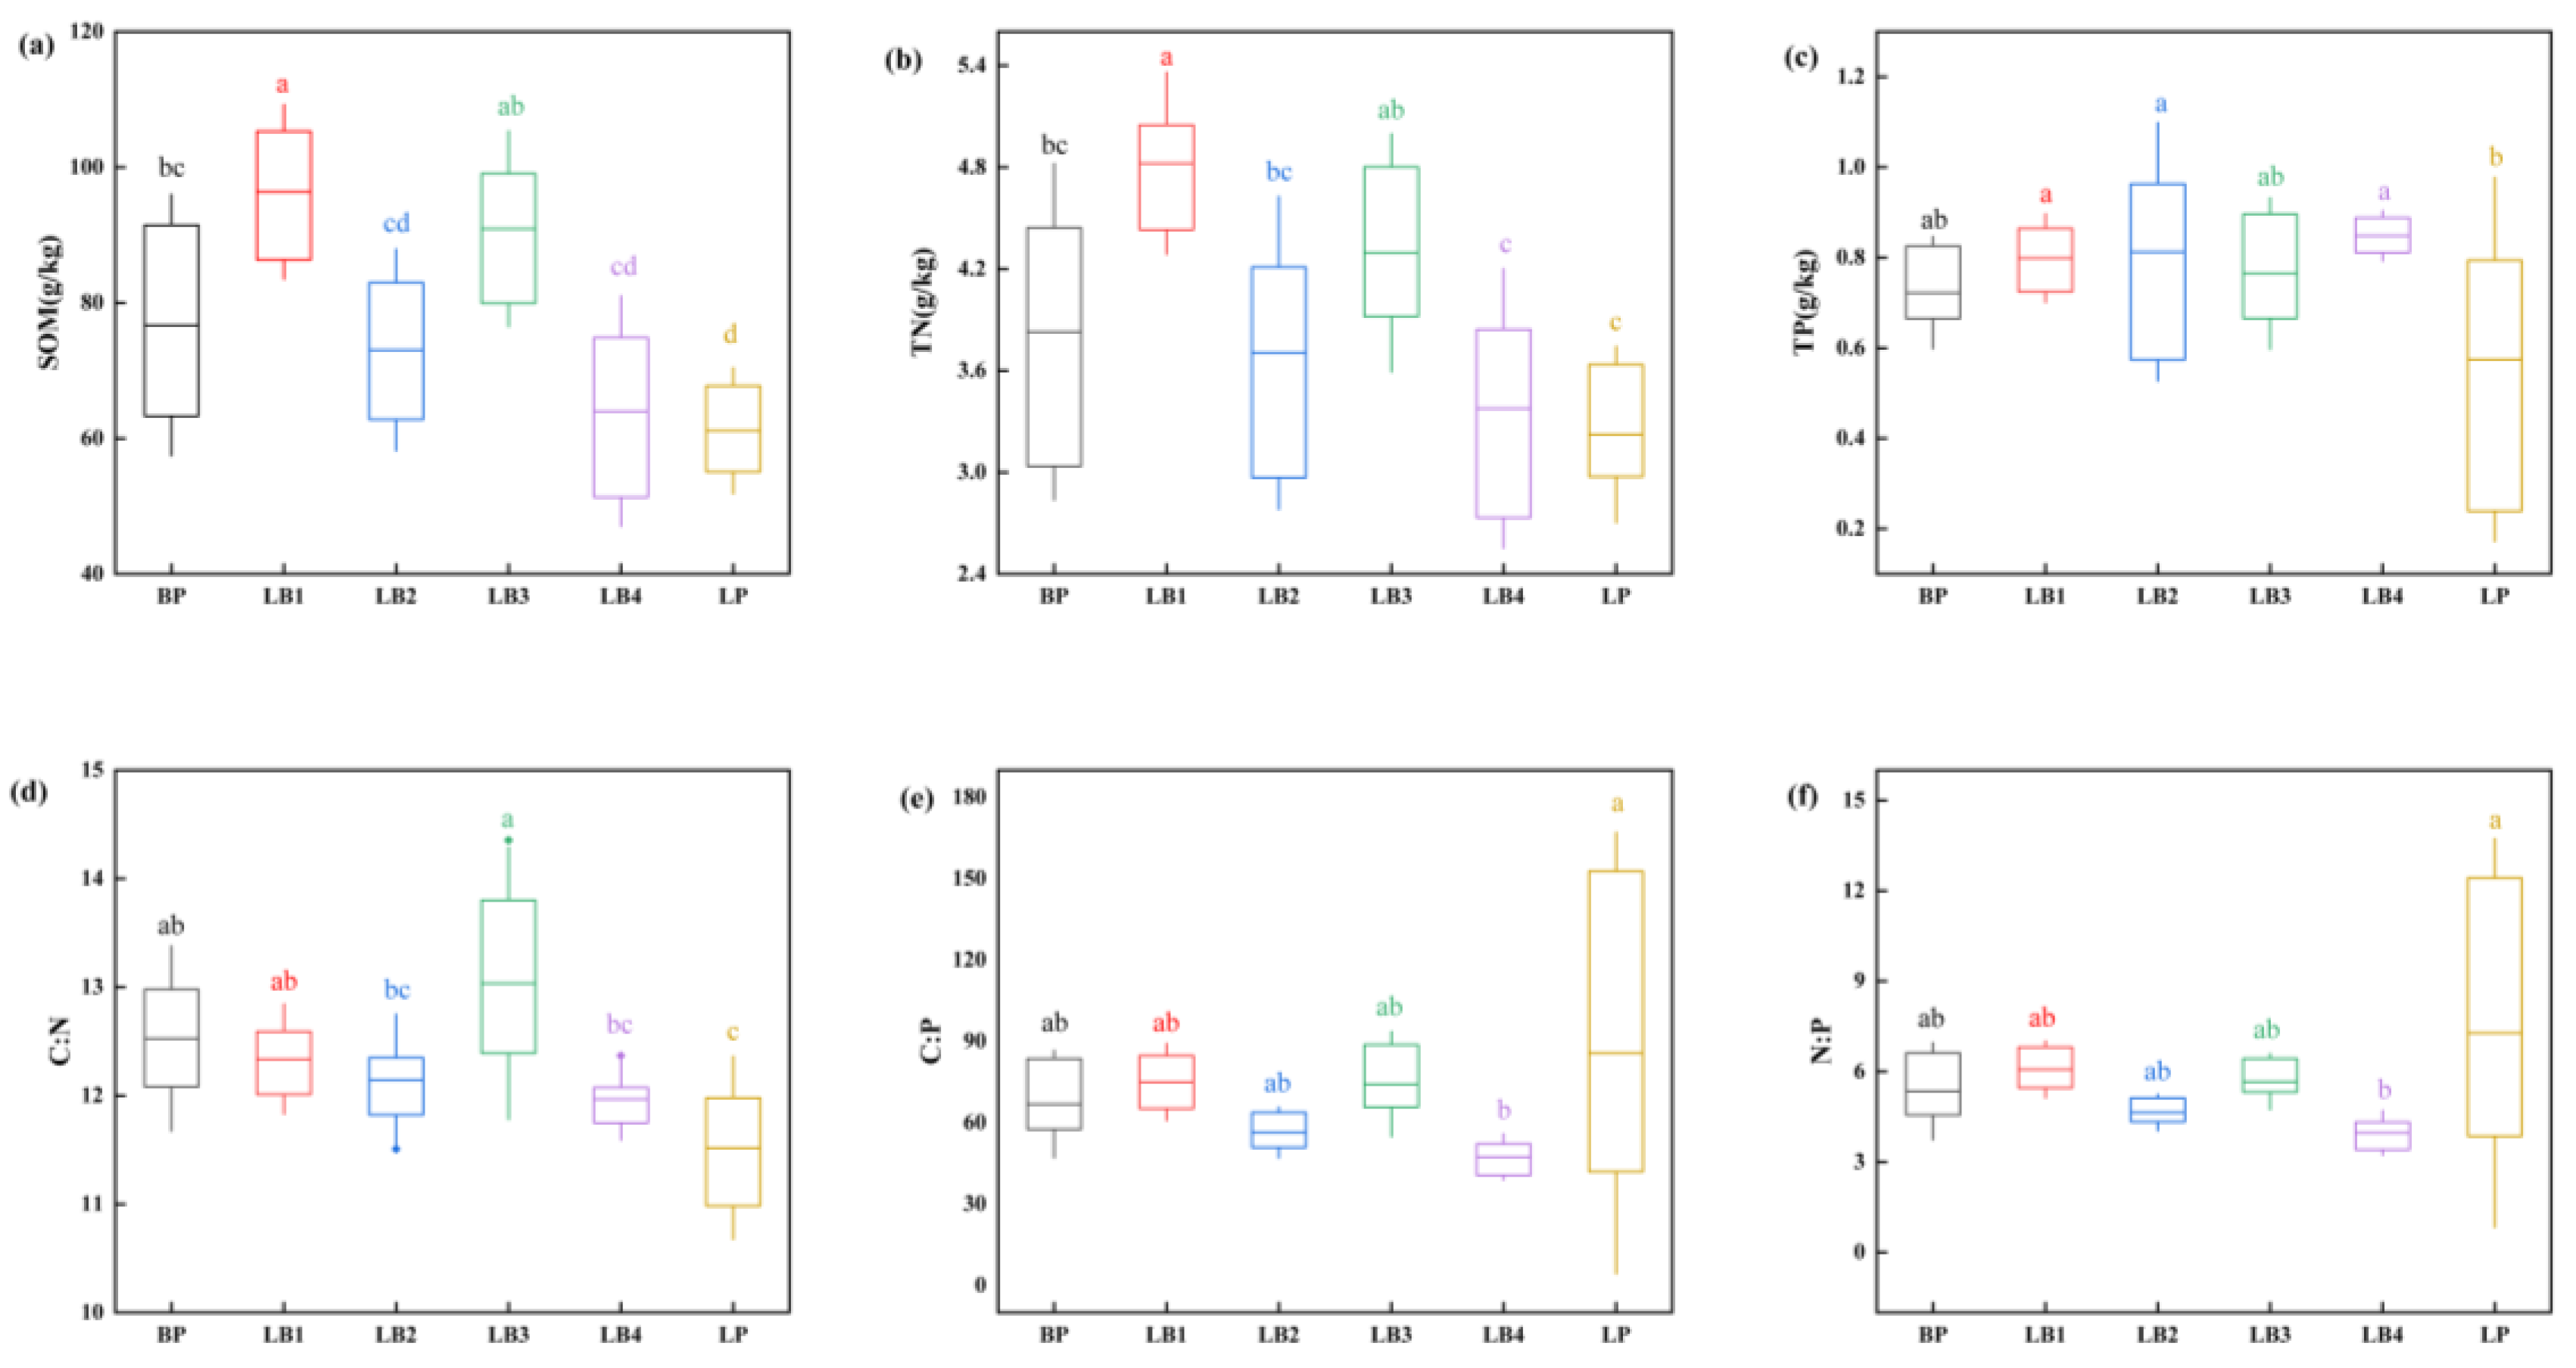
3.2. Patterns of Soil C, N, and P Stoichiometry in Different Mixed Species Proportions

Significant variations were observed in SOM, TN, and TP stoichiometry among different forests (Figure 3). The SOM and TN contents ranged from 53.84 to 105.47 g/kg and from 2.97 to 5.26 g/kg, respectively (Figure 3a,b). The soils of mixed forests (including LB1, LB2, LB3, and LB4) presented higher SOM and TN contents, compared to those in pure Larix principis-rupprechtii forests. LB1 forests with the lowest percentage of Larix principis-rupprechtii had the highest SOM and TN contents (96.35 ± 11.72 and 4.82 ± 0.33 g/kg), while the LB4 forests with the highest percentage had the lowest SOM and TN contents (64.00 ± 10.33 and 3.37 ± 0.50 g/kg) among all four mixed forests. Regarding TP content, there was no significant difference between mixed forests and pure Betula Platyphylla forests (Figure 3c). The TP content was the lowest in LP soils, measuring 0.57 ± 0.24 g/kg. The C: N ratios in LB1 and LB3 forests were significantly higher than that in LP forests, with the highest C: N ratio observed in LB3 forests (13.03 ± 0.71), and there were no significant differences between LB1, LB3, and BP forests (Figure 3d). Regarding the C:P and N:P ratio, there was a significant difference only between LB4 and LP (Figure 3e,f).

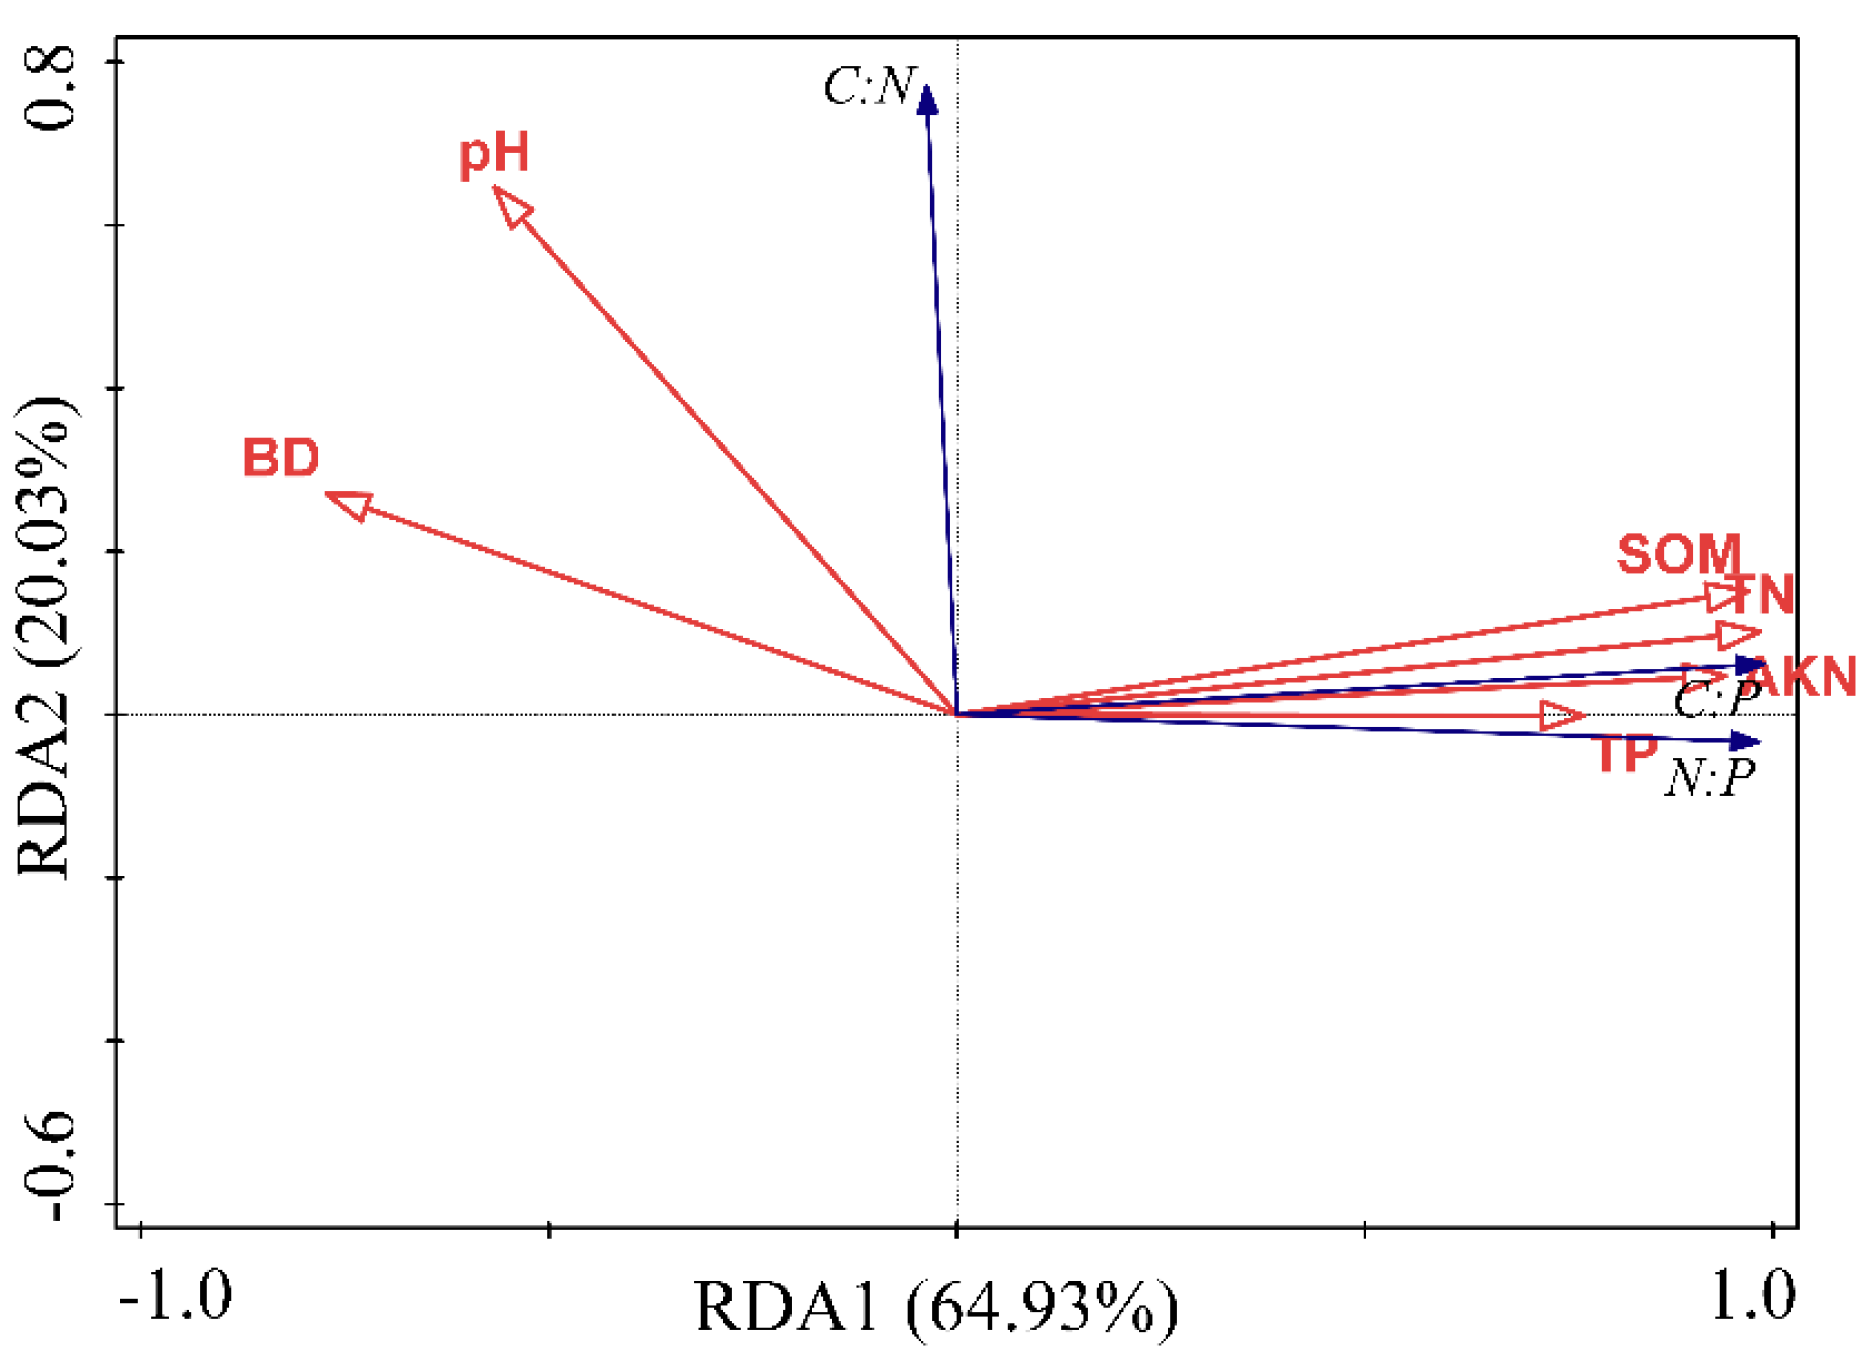
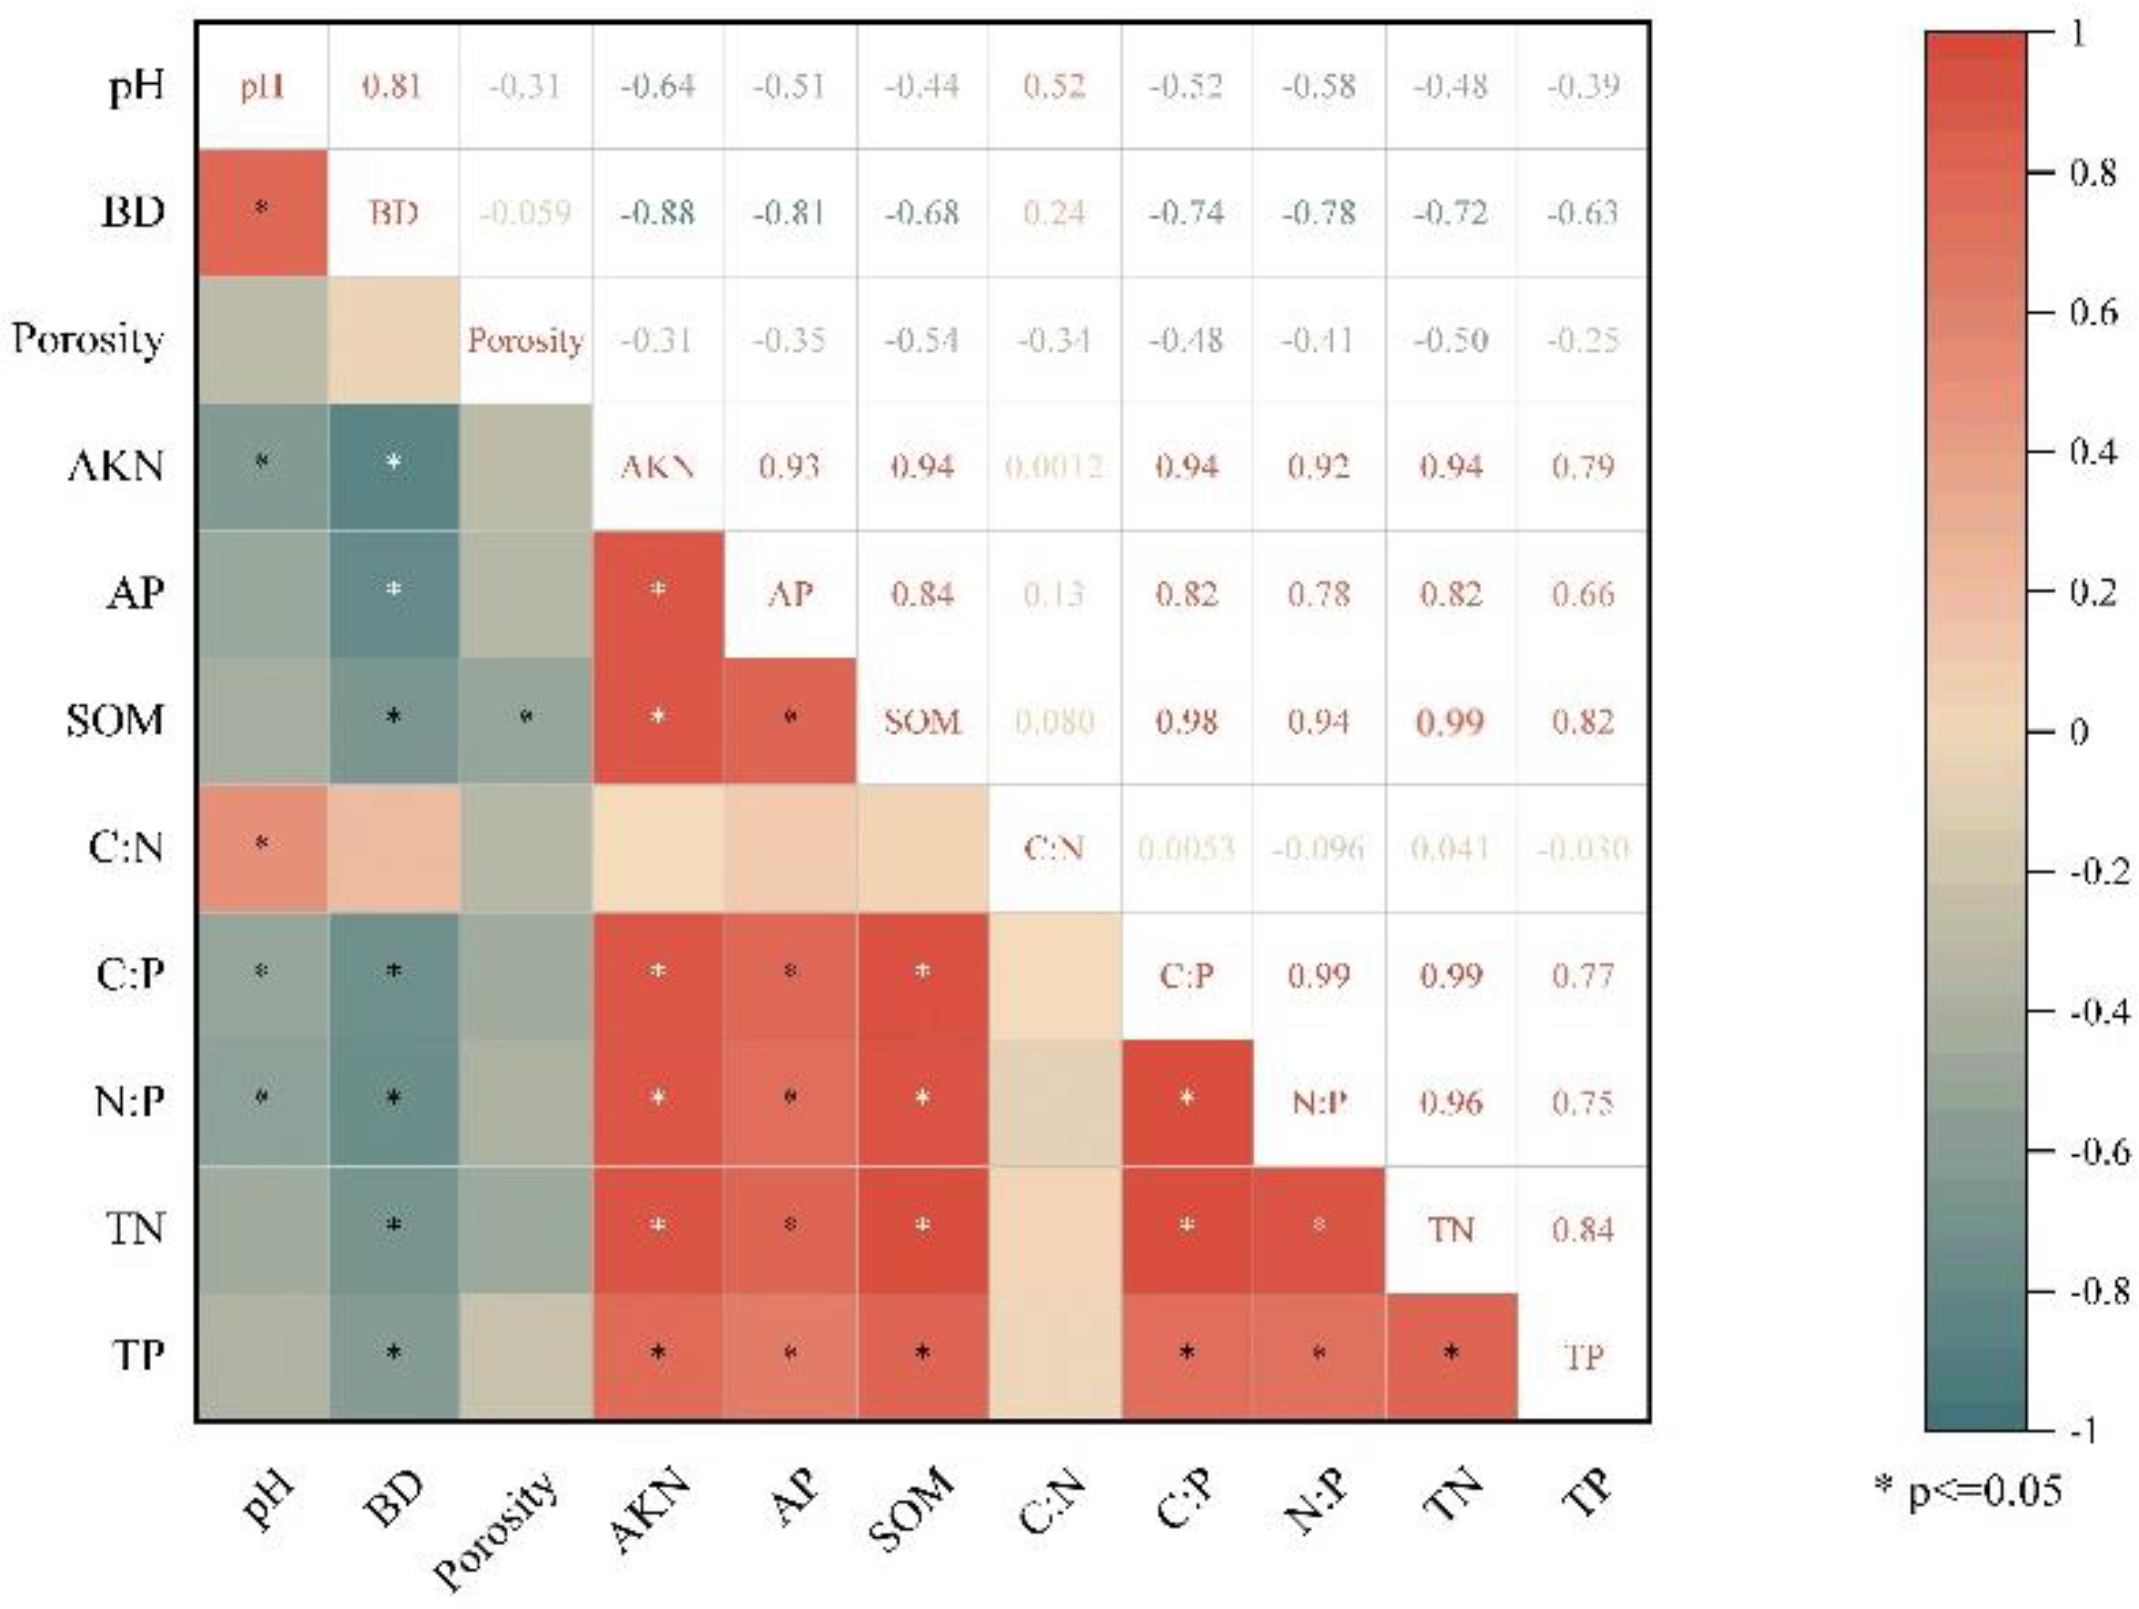
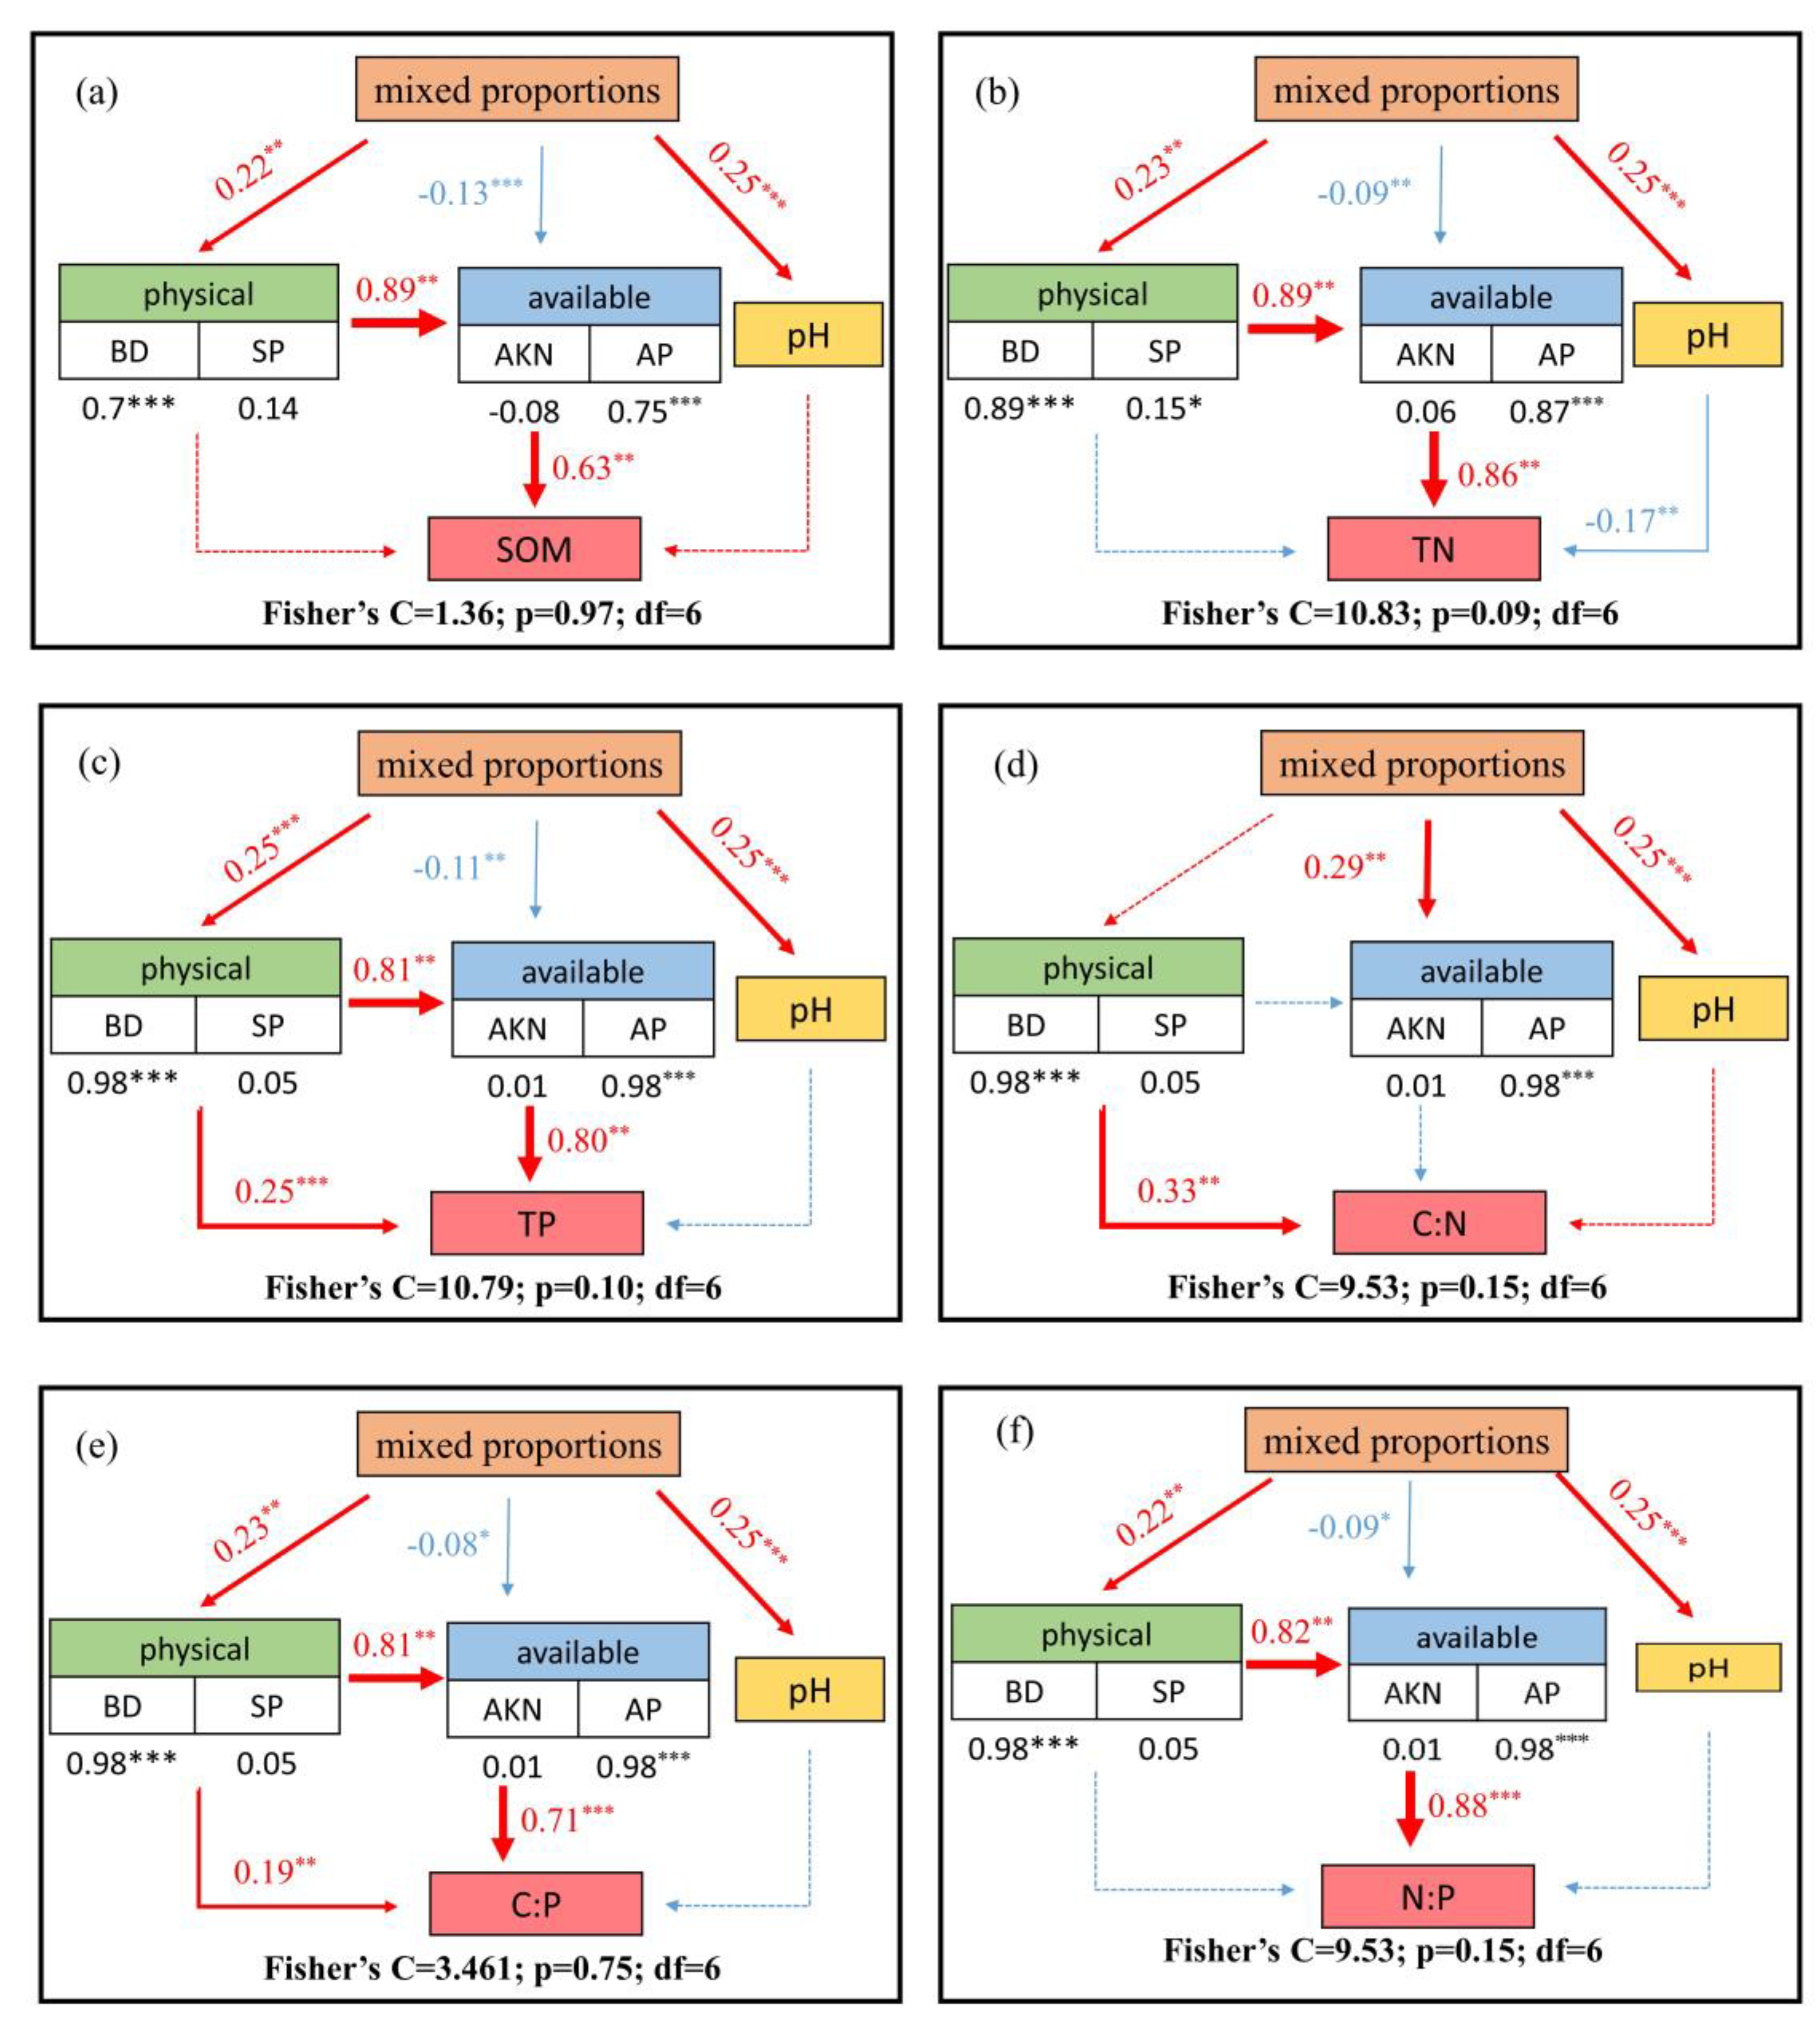
3.3. Relationships between Soil C, N, P Stoichiometry and Related Influential Factors

The explanations of soil pH, bulk density, total porosity, SOM, AHN, AP, TN, and TP for soil C, N, and P stoichiometry were obtained by redundancy analysis (RDA). The explained variation of soil stoichiometry captured by the first two axes were 64.93% and 20.03%, respectively, and the total explained variation of axes III and IV was only 13.68%. The first two axes accounted for 99.83% of soil stoichiometric characteristics, and the cumulative amount explained fitted variations in the relationship between soil stoichiometric characteristics and soil physical and chemical properties, which was 84.96%. It was clear that the first two axes better reflect the relationship between soil stoichiometric characteristics and soil physical and chemical properties, and it is mainly determined by the first axis. Figure 4 shows a bidimensional ordering chart of the RDA of relationships between soil stoichiometry and soil physicochemical properties. It can be seen that the arrow lines of soil pH and AHN are the longest, indicating that soil pH and AHN contents well explain the variation in soil ecological stability characteristics.
Pearson correlation analysis revealed a certain relationship between soil ecological stoichiometry and soil physical and chemical properties (Figure 5). It is obvious that SOM, TN, and TP are positively correlated with AKN and AP. There was a strong positive correlation between soil pH and the C:N ratio, but a significant negative correlation between soil pH and C:P and N:P ratios. Therefore, the soil BD was significantly negatively correlated with the soil C, N, and P concentrations and the soil C:P and N:P ratios.
Total soil porosity was negatively correlated with alkali-hydrolyzable nitrogen concentration, but not with other nutrients. Further, both the soil alkali-hydrolyzable nitrogen and available potassium concentrations were significantly positive correlations with the C, N, and P concentrations and C:P and N:P ratios.
We conducted piecewiseSEM analyses to profile the complex relationship between mixed species proportions, pH, soil physical properties, available nutrients, and SOM, TN, and TP contents and their ratios. The SEM results showed that the mixed species proportions had a significant effect on soil C, N, and P concentrations and their stoichiometry (Figure 6). Nevertheless, the effect of the proportions was mostly indirect, mediated primarily by variations in soil nutrients and, to a lesser extent, physical properties. The mixed species proportions directly and positively affect soil physical properties and pH, and negatively affect available nutrients; available nutrients were directly and positively influenced by soil physical properties. The contents of SOM, TN, and TP and their ratios were directly and positively influenced by available nutrients. In addition, TN was affected significantly and negatively by pH (Figure 6b), and the physical properties of the soil also had a significant positive effect on TP (Figure 6c). In addition, there was a direct positive influence of the soil C:P ratio on soil physical properties (Figure 6e). As a result of spatial variation in mixed species proportions, soil physical properties, available nutrients, and pH were affected, and these three factors together affected SOM, TN, and TP stoichiometry. Our results indicate that soil nutrient limitation increased with increasing mixing ratios.

4. Discussion

4.1. Soil C, N, and P Stoichiometry in Response to Tree Species Proportions

We quantified the spatial and vertical variability of soil carbon, nitrogen, and phosphorus concentrations and their stoichiometric ratios by measuring soil carbon, nitrogen, and phosphorus concentrations in mixed forests with varying proportions of mixed species, as well as in the pure species Larix principis-rupprechtii and Betula Platyphylla. Our results demonstrated significant variations across different forests. Multiple studies have indicated that soil carbon (C), nitrogen (N), and phosphorus (P) contents decrease with depth [35,36,37]. The SOC and TN contents of desert–grassland transition zones decreased with depth according to Lu et al. [31]. Similarly, SOM and TN contents decreased with increasing soil depth, with the greatest influences at the surface. The decreased SOM and TN were attributed to the accumulation of C and N through biological fixation caused by leaf and fine root litter [38,39]. The topsoil layer may have more dissolved organic matter due to the higher amount of litter [40,41], and the SOM and TN released from litter decomposition are mainly concentrated in the topsoil layer, with only a small amount entering the deeper soil layers [42]. In contrast, significant differences in TP content between surface and substratum layers were detected as compared to the variations in SOM and TN. (Table S1). In addition to soil C:P and N:P ratios being significantly different between soil layers, results from a one-way ANOVA confirmed previous findings that C:P and N:P ratios decrease with soil depth. [37,43]. However, there were no significant differences in soil carbon-to-nitrogen ratios across all soil horizons in all forests. There is a possibility that SOM and TN acted synergistically in this study, which could explain this consistency.
Different ecosystems have shown significant differences in soil C, N, and P concentrations and stoichiometric ratios [5,14,31]. The SOM and TN and the C:N ratios of mixed forests (including LB 1, LB 2, LB 3, and LB 4) are generally higher than that of pure Larix principis-rupprechtii forests in this study area. This is due to the fact that soil N, like soil C, depends primarily on the accumulation and decomposition of organic matter [4]. Root exudates and litter decomposition processes have been shown to influence soil organic C and TN contents in previous studies [44,45]. The decomposition of mixed litter is altered by chemical differences in the litter, transfer of nutrients and secondary metabolites between the litter, and changes in the microhabitat of decomposers [46,47]. In this study, the contents of SOM and TN were higher in the LB1 forest with the lowest proportion of Larix principis-rupprechtii. Studies have shown that coniferous forests contain large amounts of keratin, which prevents microorganisms from attaching to and invading keratin-rich leaves, leading to slow decomposition of keratin-rich leaves [48].
However, the proportion of mixed species in the selected forests in this study was below 50%, and there may be a lack of information on the effect of the degree of mixed species proportions on soil nutrient content. Other studies have reported the effects of mixed forests on soil nutrients with other mixed species proportions. In a study of five kinds of Chinese fir coniferous and broad-leaved mixed forests (the proportions of Chinese fir volume were 50%, 60%, 70%, 80%, and 90%), decreasing soil nutrients have been observed with the increasing proportion of Chinese fir [49]. These results strongly suggest that the selection of a lower proportion of coniferous forest mixture species is more conducive to the accumulation of soil nutrients.

4.2. Driving Factors of Soil C, N, and P Contents and Their Ratios

Soil nutrient contents and stoichiometric ratios were controlled by mixed species proportions and soil physicochemical properties [31]. It appeared that soil physical properties, pH, and available nutrients influenced soil C, N, and P stoichiometry jointly based on RDA (redundancy analysis). In light of significant negative correlations that existed between SOM, TN, and TP concentrations, the soil BD appeared to play a crucial role in determining soil C:P and N:P ratios. This may have been due to the BD having a close relationship with soil moisture, vegetation community, soil texture, and organic matter [50,51]. Increased bulk weight results in poorer permeability and soil moisture content, and less oxygen and water in the soil, which limits soil microbial activity and results in lower SOM and TP concentrations which may be detrimental to biological processes, such as litter decomposition [6,16]. Our results supported the fact that the pH was significantly correlated with the soil C:N, C:P, and N:P ratios. Correspondingly, the correlation analysis suggests that the variation in nutrient availability contributed to the change in soil stoichiometry. Our findings were consistent with several previous research studies [52,53]. Soil ecological stoichiometry is typically linked to physical and chemical properties; therefore, strong connections between these properties can be observed in various ecosystems [24,54,55].
In this study, structural equation modeling shows that the contents and ratios of soil C, N, and P in response to mixed species proportions are different and coordinated by various factors. Specifically, mixed species proportions can indirectly affect soil C, N, and P stoichiometry by altering soil-available nutrients, soil pH, and soil physical properties. Previous studies have shown that soil nutrient availability is controlled by both geochemical and biological processes at different levels during ecosystem succession [44]. Our study also illustrated these results. Mixed species proportions had a significantly negative effect on soil-available nutrients, which may be detrimental to biological processes, such as litter decomposition and nutrient accumulation decrease [15]. The concentrations of soil AHN were affected by the quality of leaf litter and rhizome deposition, as well as from interactions with soil microorganisms [56,57,58]. The litter of Larix principis-rupprechtii, which is high in keratin, was resistant to decomposition, and as the proportion of coniferous forest in mixed forests increased, the proportion of litter that was resistant to microbial decomposition increased. Meanwhile, an increase in bulk weight can limit soil microbial activity, resulting in lower AHN concentrations. We can also observe that mixed species proportions had a significantly positive effect on soil physical proportions. The contents of SOM, TN, and TP and their ratios were directly and positively influenced by available nutrients [31,44]. Accordingly, we can predict that as the mixing ratio increases, soil nutrient accumulation decreases and intensifies soil nutrient limitation. This is also consistent with our study in which SOM and TN contents were higher in stands with the smallest mixed proportion of Larix principis-rupprechtii (Figure 3). In addition, TN was affected significantly and negatively by pH; the pH ranged from 5.54 to 6.96 in this study and was overall weakly acidic towards neutrality. It has been demonstrated that microbial network complexity and stability are lower near neutral pH [59] and that more complex networks enhance the efficiency and rate of ecosystem functioning compared to simpler networks [60]. The content of TP and C:P ratios was significantly and positively influenced by soil physical properties, which is correlated with the primary source of P in terrestrial ecosystems being primarily related to mechanical rock weathering [61,62].
According to SEM results, mixed species proportions significantly influence soil C, N, and P contents, and their ratios, in addition to soil pH and soil physical properties. In spite of some conclusions that can be drawn from our data, those selected soil environmental factors only explained a limited amount of variation for SOM, TN, and TP stoichiometry. A species-specific significant impact on soil nutrient availability through feedback from plants on nutrient cycling is considered [12]. There is a need for further research to investigate how stoichiometric ratios between plants and soil respond to climate change scenarios, as well as the effects of litter and soil microbes on soil nutrients. [31].

5. Conclusions

This study clearly demonstrated that soil carbon, nitrogen, and phosphorus stoichiometry and physical and chemical properties differed primarily in mixed tree species proportions. Our study indicated that mixed plantations may increase the concentrations of SOM and TN. The concentrations of SOM, TN, and the C:P and N:P ratios decreased with increasing soil depth. In our results, we observed higher soil nutrient accumulation when the proportion of Larix principis-rupprechtii was relatively low. This study showed that the mixed species proportions had a significant effect on soil C, N, and P concentrations and their stoichiometry. This proportion effect is mostly indirect, mediated predominantly by the variation in soil-available nutrients and, to a lesser extent, by physical properties and pH. The mixed species proportions negatively and directly affected soil-available nutrients, and those available nutrient properties positively affected the contents of SOM, TN, and TP and their ratios. We can predict that soil nutrient limitation intensified with increasing Larix principis-rupprechtii mixing ratios. Our results highlighted the importance of mixed species proportions change on SOM, TN, and TP contents and C:N:P stoichiometry; this could help improve the understanding of nutrient accumulation and balance in mixed forest soils of different proportions and provide some references for the sustainable development of forests.

Supplementary Materials

The following supporting information can be downloaded at https://www.mdpi.com/article/10.3390/su16198646/s1: Table S1: Variance analysis of soil carbon, nitrogen, and phosphorus stoichiometry between different forests and soil layers; Table S2: Variance analysis of soil chemical and physical properties between different forests and soil layers; Table S3: The interactive effects and proposed interpretation of vegetation and soil physicochemical properties on soil nutrient stoichiometry; Table S4: Characteristics of the study plots. Refs [63,64] are cited in the Supplementary Materials.

Author Contributions

H.Z.: designed experiments, determined the article framework and research methods, and wrote the paper; X.W.: completed experiment sampling, performed data analysis, and wrote the paper; Z.W., W.T. and Z.L.: contributed to the research and writing of the paper. All authors have read and agreed to the published version of the manuscript.

Funding

his research received no external funding or This research was funded by [National Major Science and Technology Program for Water Pollution Control and Treatment] grant number [2017ZX07101-002]. And The APC was funded by [North China Electric Power University].

Data Availability Statement

The original contributions presented in this study are included in the article/Supplementary Material; further inquiries can be directed to the corresponding author/s.

Acknowledgments

The authors would like to acknowledge with great gratitude the support of the National Major Science and Technology Program for Water Pollution Control and Treatment (No. 2017ZX07101-002) and the Discipline Construction Program of Huayong Zhang, Distinguished Professor of Shandong University, School of Life Sciences (61200082363001).

Conflicts of Interest

The authors declare that they have no known competing financial interests or personal relationships that could have appeared to influence the work reported in this paper.

References

  1. Elser, J.J.; Fagan, W.F.; Kerkhoff, A.J.; Swenson, N.G.; Enquist, B.J. Biological stoichiometry of plant production: Metabolism, scaling and ecological response to global change. New Phytol. 2010, 186, 593–608. [Google Scholar] [CrossRef] [PubMed]
  2. Deng, Q.; Hui, D.; Elser, J.; Wang, Y.; Loladze, I.; Zhang, Q.; Dennis, S. Downregulation of tissue N:P ratios in terrestrial plants by elevated CO2. Ecology 2015, 96, 3354–3362. [Google Scholar] [CrossRef] [PubMed]
  3. Xu, X.; Hui, D.; King, A.; Song, X.; Thornton, P.; Zhang, L. Convergence of microbial assimilations of soil carbon, nitrogen, phosphorus, and sulfur in terrestrial ecosystems. Sci. Rep. 2015, 5, 17445. [Google Scholar] [CrossRef] [PubMed]
  4. Yang, S.; Feng, C.; Ma, Y.; Wang, W.; Huang, C.; Qi, C.; Fu, S.; Chen, H.Y.H. Transition from N to P limited soil nutrients over time since restoration in degraded subtropical broadleaved mixed forests. For. Ecol. Manag. 2021, 494, 119298. [Google Scholar] [CrossRef]
  5. Cleveland, C.; Liptzin, D. C:N:P stoichiometry in soil: Is there a “Redfield ratio” for the microbial biomass? Biogeochemistry 2007, 85, 235–252. [Google Scholar] [CrossRef]
  6. Bui, E.; Henderson, B. C:N:P stoichiometry in Australian soils with respect to vegetation and environmental factors. Plant Soil 2013, 373, 553–568. [Google Scholar] [CrossRef]
  7. Peñuelas, J.; Sardans, J.; Rivas-ubach, A.; Janssens, I.A. The human-induced imbalance between C, N and P in Earth’s life system. Glob. Change Biol. 2011, 18, 3–6. [Google Scholar] [CrossRef]
  8. He, H.; Liu, Y.; Hu, Y.; Zhang, M.; Wang, G.; Shen, W. Soil Microbial Community and Its Interaction with Soil Carbon Dynamics Following a Wetland Drying Process in Mu Us Sandy Land. Int. J. Environ. Res. Public Health 2020, 17, 4199. [Google Scholar] [CrossRef]
  9. Song, Y.; Zou, Y.; Wang, G.; Yu, X. Altered soil carbon and nitrogen cycles due to the freeze-thaw effect: A meta-analysis. Soil Biol. Biochem. 2017, 109, 35–49. [Google Scholar] [CrossRef]
  10. Gao, Y.; He, N.; Yu, G.; Chen, W.; Wang, Q. Long-term effects of different land use types on C, N, and P stoichiometry and storage in subtropical ecosystems: A case study in China. Ecol. Eng. 2014, 67, 171–181. [Google Scholar] [CrossRef]
  11. Hu, L.; Ade, L.; Wu, X.; Zi, H.; Luo, X.; Wang, C. Changes in Soil C:N:P Stoichiometry and Microbial Structure along Soil Depth in Two Forest Soils. Forests 2019, 10, 113. [Google Scholar] [CrossRef]
  12. Ordoñez, J.C.; van Bodegom, P.M.; Witte, J.-P.M.; Wright, I.J.; Reich, P.B.; Aerts, R. A global study of relationships between leaf traits, climate and soil measures of nutrient fertility. Glob. Ecol. Biogeogr. 2009, 18, 137–149. [Google Scholar] [CrossRef]
  13. Aponte, C.; García, L.; Marañón, T. Tree species effects on nutrient cycling and soil biota: A feedback mechanism favoring species coexistence. For. Ecol. Manag. 2013, 2013, 36–46. [Google Scholar] [CrossRef]
  14. Tian, H.; Zhang, C.; Melillo, J.; Hall, C. Pattern and variation of C:N:P ratios in China’s soils: A synthesis of observational data. Biogeochemistry 2010, 98, 139–151. [Google Scholar] [CrossRef]
  15. Fan, H.; Wu, J.; Liu, W.; Yuan, Y.; Hu, L.; Cai, Q. Linkages of plant and soil C:N:P stoichiometry and their relationships to forest growth in subtropical plantations. Plant Soil 2015, 392, 127–138. [Google Scholar] [CrossRef]
  16. Hui, D.; Yang, X.; Deng, Q.; Liu, Q.; Wang, X.; Yang, H.; Ren, H. Soil C:N:P stoichiometry in tropical forests on Hainan Island of China: Spatial and vertical variations. Catena 2021, 201, 105228. [Google Scholar] [CrossRef]
  17. Hua, F.; Bruijnzeel, L.A.; Meli, P.; Martin, P.A.; Zhang, J.; Nakagawa, S.; Miao, X.; Wang, W.; McEvoy, C.; Peña-Arancibia, J.L.; et al. The biodiversity and ecosystem service contributions and trade-offs of forest restoration approaches. Science 2022, 376, 839–844. [Google Scholar] [CrossRef]
  18. Williams, L.J.; Paquette, A.; Cavender-Bares, J.; Messier, C.; Reich, P.B. Spatial complementarity in tree crowns explains overyielding in species mixtures. Nat. Ecol. Evol. 2017, 1, 62. [Google Scholar] [CrossRef]
  19. Grossman, J.J.; Vanhellemont, M.; Barsoum, N.; Bauhus, J.; Bruelheide, H.; Castagneyrol, B.; Cavender-Bares, J.; Eisenhauer, N.; Ferlian, O.; Gravel, D.; et al. Synthesis and future research directions linking tree diversity to growth, survival, and damage in a global network of tree diversity experiments. Environ. Exp. Bot. 2018, 152, 68–89. [Google Scholar] [CrossRef]
  20. Paquette, A.; Messier, C. The effect of biodiversity on tree productivity: From temperate to boreal forests. Glob. Ecol. Biogeogr. 2010, 20, 170–180. [Google Scholar] [CrossRef]
  21. Fichtner, A.; Härdtle, W.; Bruelheide, H.; Kunz, M.; Li, Y.; von Oheimb, G. Neighbourhood interactions drive overyielding in mixed-species tree communities. Nat. Commun. 2018, 9, 1144. [Google Scholar] [CrossRef] [PubMed]
  22. Brassard, B.W.; Chen, H.Y.H.; Cavard, X.; Laganière, J.; Reich, P.B.; Bergeron, Y.; Paré, D.; Yuan, Z. Tree species diversity increases fine root productivity through increased soil volume filling. J. Ecol. 2012, 101, 210–219. [Google Scholar] [CrossRef]
  23. Huuskonen, S.; Domisch, T.; Finér, L.; Hantula, J.; Hynynen, J.; Matala, J.; Miina, J.; Neuvonen, S.; Nevalainen, S.; Niemistö, P.; et al. What is the potential for replacing monocultures with mixed-species stands to enhance ecosystem services in boreal forests in Fennoscandia? For. Ecol. Manag. 2021, 479, 118558. [Google Scholar] [CrossRef]
  24. Wang, W.; Wang, C.; Sardans, J.; Min, Q.; Zeng, C.; Tong, C.; Peñuelas, J. Agricultural land use decouples soil nutrient cycles in a subtropical riparian wetland in China. Catena 2015, 133, 171–178. [Google Scholar] [CrossRef]
  25. Tao, Y.; Zhang, Y.M.; Zhou, X.B. Ecological stoichiometry of surface soil nutrient and its influencing factors in the wild fruit forest in Yili region, Xinjiang, China. Ying Yong Sheng Tai Xue Bao = J. Appl. Ecol. 2016, 27, 2239–2248. [Google Scholar] [CrossRef]
  26. Liu, G.; Wang, H.; Yan, G.; Wang, M.; Jiang, S.; Wang, X.; Xue, J.; Xu, M.; Xing, Y.; Wang, Q. Soil enzyme activities and microbial nutrient limitation during the secondary succession of boreal forests. Catena 2023, 230, 107268. [Google Scholar] [CrossRef]
  27. Yuan, X.Y.; Mao, Z.J.; Gu, H.Y.; Zhao, Y.X.; Zu, Y.G.; Zou, L. Reproductive strategies and seeds behavior of Betula platyphylla Suk. population. J. For. Res. 2000, 11, 241–244. [Google Scholar] [CrossRef]
  28. Bronisz, K.; Mehtätalo, L. Mixed-effects generalized height–diameter model for young silver birch stands on post-agricultural lands. For. Ecol. Manag. 2020, 460, 117901. [Google Scholar] [CrossRef]
  29. Nelson, D.W.; Sommers, L.E. Total Carbon, Organic Carbon, and Organic Matter. In Methods of Soil Analysis: Part 2 Chemical and Microbiological Properties, 2nd ed.; American Society of Agronomy, Inc.: Madison, WI, USA; Soil Science Society of America, Inc.: Madison, WI, USA, 1982; pp. 539–579. [Google Scholar]
  30. Frank, K.; Beegle, D.; Denning, J. Phosphorus. In Recommended Chemical Soil Test Procedures; Brown, J.R., Ed.; North Central Regional Research Publication: Ames, IA, USA, 1998; Volume 221, pp. 21–30. [Google Scholar]
  31. Lu, J.; Feng, S.; Wang, S.; Zhang, B.; Ning, Z.; Wang, R.; Chen, X.; Yu, L.; Zhao, H.; Lan, D.; et al. Patterns and driving mechanism of soil organic carbon, nitrogen, and phosphorus stoichiometry across northern China’s desert-grassland transition zone. Catena 2023, 220, 106695. [Google Scholar] [CrossRef]
  32. Sheng, H.; Yin, Z.; Zhou, P.; Thompson, M.L. Soil C:N:P ratio in subtropical paddy fields: Variation and correlation with environmental controls. J. Soils Sediments 2022, 22, 21–31. [Google Scholar] [CrossRef]
  33. Lefcheck, J.S. PiecewiseSEM: Piecewise structural equation modelling in r for ecology, evolution, and systematics. Methods Ecol. Evol. 2015, 7, 573–579. [Google Scholar] [CrossRef]
  34. Tian, P.; Liu, S.; Zhao, X.; Sun, Z.; Yao, X.; Niu, S.; Crowther, T.W.; Wang, Q. Past climate conditions predict the influence of nitrogen enrichment on the temperature sensitivity of soil respiration. Commun. Earth Environ. 2021, 2, 251. [Google Scholar] [CrossRef]
  35. Stone, M.M.; Plante, A.F. Changes in phosphatase kinetics with soil depth across a variable tropical landscape. Soil Biol. Biochem. 2014, 71, 61–67. [Google Scholar] [CrossRef]
  36. Yu, Z.; Wang, M.; Huang, Z.; Lin, T.C.; Vadeboncoeur, M.A.; Searle, E.B.; Chen, H.Y.H. Temporal changes in soil C-N-P stoichiometry over the past 60 years across subtropical China. Glob. Change Biol. 2017, 24, 1308–1320. [Google Scholar] [CrossRef] [PubMed]
  37. Zhang, K.; Su, Y.; Yang, R. Variation of soil organic carbon, nitrogen, and phosphorus stoichiometry and biogeographic factors across the desert ecosystem of Hexi Corridor, northwestern China. J. Soils Sediments 2019, 19, 49–57. [Google Scholar] [CrossRef]
  38. Feng, C.; Wang, Z.; Zhu, Q.; Fu, S.; Chen, H.Y.H. Rapid increases in fine root biomass and production following cessation of anthropogenic disturbances in degraded forests. Land Degrad. Dev. 2018, 29, 461–470. [Google Scholar] [CrossRef]
  39. Feng, C.; Wang, Z.; Ma, Y.; Fu, S.; Chen, H.Y.H. Increased litterfall contributes to carbon and nitrogen accumulation following cessation of anthropogenic disturbances in degraded forests. For. Ecol. Manag. 2019, 432, 832–839. [Google Scholar] [CrossRef]
  40. Fontaine, S.; Barot, S.; Barré, P.; Bdioui, N.; Mary, B.; Rumpel, C. Stability of organic carbon in deep soil layers controlled by fresh carbon supply. Nature 2007, 450, 277–280. [Google Scholar] [CrossRef] [PubMed]
  41. Kou, D.; Ma, W.; Ding, J.; Zhang, B.; Fang, K.; Hu, H.; Yu, J.; Wang, T.; Qin, S.; Zhao, X.; et al. Dryland soils in northern China sequester carbon during the early 2000s warming hiatus period. Funct. Ecol. 2018, 32, 1620–1630. [Google Scholar] [CrossRef]
  42. Chun, H.; Liu, Y.; Zhang, C.; Li, Y.; Zhou, T.; Khan, S.; Chen, N.; Zhao, C. Effects of three coniferous plantation species on plant-soil feedbacks and soil physical and chemical properties in semi-arid mountain ecosystems. For. Ecosyst. 2021, 8, 3. [Google Scholar] [CrossRef]
  43. Wang, L.; Zhang, G.; Zhu, P.; Xing, S.; Wang, C. Soil C, N and P contents and their stoichiometry as affected by typical plant communities on steep gully slopes of the Loess Plateau, China. Catena 2022, 208, 105740. [Google Scholar] [CrossRef]
  44. Luo, W.; Dijkstra, F.; Bai, E.; Feng, J.; Lü, X.-T.; Wang, C.; Wu, H.; Li, M.-H.; Han, X.-G. A threshold reveals decoupled relationship of sulfur with carbon and nitrogen in soils across arid and semi-arid grasslands in northern China. Biogeochemistry 2016, 127, 141–153. [Google Scholar] [CrossRef]
  45. Tao, Y.; Zhou, X.-B.; Zhang, S.-H.; Lu, H.-Y.; Shao, H. Soil nutrient stoichiometry on linear sand dunes from a temperate desert in Central Asia. Catena 2020, 195, 104847. [Google Scholar] [CrossRef]
  46. Gartner, T.; Cardon, Z. Decomposition dynamics in mixed-species leaf litter. Oikos 2004, 104, 230–246. [Google Scholar] [CrossRef]
  47. Song, F.; Fan, X.; Ruiqing, S. Review of mixed forest litter decomposition researches. Acta Ecol. Sin. 2010, 30, 221–225. [Google Scholar] [CrossRef]
  48. Garnier, E.; Laurent, G. Leaf anatomy, specific mass and water content in congeneric annual and perennial grass species. New Phytol. 1994, 128, 725–736. [Google Scholar] [CrossRef]
  49. Haonan, S.; Weipo, L.; Zhihua, L.; Yigui, W.; Xiaozhou, Y. Effects of fir and broad-leaved mixed forest with different mixing proportions on the species diversity and soil nutrients under the forest. J. Cent. South Univ. For. Technol. 2022, 42, 8. [Google Scholar] [CrossRef]
  50. Wu, X.; Fang, H.; Zhao, Y.; Smoak, J.M.; Li, W.; Shi, W.; Sheng, Y.; Zhao, L.; Ding, Y. A conceptual model of the controlling factors of soil organic carbon and nitrogen densities in a permafrost-affected region on the eastern Qinghai-Tibetan Plateau. J. Geophys. Res. Biogeosciences 2017, 122, 1705–1717. [Google Scholar] [CrossRef]
  51. Wu, X.; Zhao, L.; Fang, H.; Zhao, Y.; Smoak, J.M.; Pang, Q.; Ding, Y. Environmental controls on soil organic carbon and nitrogen stocks in the high-altitude arid western Qinghai-Tibetan Plateau permafrost region. J. Geophys. Res. Biogeosciences 2016, 121, 176–187. [Google Scholar] [CrossRef]
  52. Karak, T.; Paul, R.; Boruah, R.; Sonar, I.; Bordoloi, B.; Dutta, A.; Borkotoky, B. Major Soil Chemical Properties of the Major Tea-Growing Areas in India. Pedosphere 2015, 25, 316–328. [Google Scholar] [CrossRef]
  53. Wang, R.; Zhang, Y.; He, P.; Yin, J.; Yang, J.; Liu, H.; Cai, J.; Shi, Z.; Feng, X.; Dijkstra, F.A.; et al. Intensity and frequency of nitrogen addition alter soil chemical properties depending on mowing management in a temperate steppe. J. Environ. Manag. 2018, 224, 77–86. [Google Scholar] [CrossRef]
  54. Wang, W.; Sardans, J.; Zeng, C.; Zhong, C.; Li, Y.; Peñuelas, J. Responses of soil nutrient concentrations and stoichiometry to different human land uses in a subtropical tidal wetland. Geoderma 2014, 232–234, 459–470. [Google Scholar] [CrossRef] [PubMed]
  55. Li, T.; Wang, C.; He, B.; Liang, C.; Zhang, Y.; Zhang, Y. Soil nutrient concentrations and stoichiometry under different tree-cropping systems in a purple hillslope in southwestern China. Arch. Agron. Soil Sci. 2018, 65, 741–754. [Google Scholar] [CrossRef]
  56. Chapman, S.K.; Langley, J.A.; Hart, S.C.; Koch, G.W. Plants actively control nitrogen cycling: Uncorking the microbial bottleneck. New Phytol. 2005, 169, 27–34. [Google Scholar] [CrossRef]
  57. Henneron, L.; Kardol, P.; Wardle, D.A.; Cros, C.; Fontaine, S. Rhizosphere control of soil nitrogen cycling: A key component of plant economic strategies. New Phytol. 2020, 228, 1269–1282. [Google Scholar] [CrossRef] [PubMed]
  58. Prescott, C.E.; Grayston, S.J. Tree species influence on microbial communities in litter and soil: Current knowledge and research needs. For. Ecol. Manag. 2013, 309, 19–27. [Google Scholar] [CrossRef]
  59. Kerfahi, D.; Guo, Y.; Dong, K.; Wang, Q.; Adams, J.M. pH is the major predictor of soil microbial network complexity in Chinese forests along a latitudinal gradient. Catena 2024, 234, 107595. [Google Scholar] [CrossRef]
  60. Wagg, C.; Schlaeppi, K.; Banerjee, S.; Kuramae, E.E.; van der Heijden, M.G.A. Fungal-bacterial diversity and microbiome complexity predict ecosystem functioning. Nat. Commun. 2019, 10, 4841. [Google Scholar] [CrossRef] [PubMed]
  61. Augusto, L.; Achat, D.L.; Jonard, M.; Vidal, D.; Ringeval, B. Soil parent material—A major driver of plant nutrient limitations in terrestrial ecosystems. Glob. Change Biol. 2017, 23, 3808–3824. [Google Scholar] [CrossRef]
  62. Porder, S.; Ramachandran, S. The Phosphorus Concentration of Common Rocks—A Potential Driver of Ecosystem Status. Plant Soil 2012, 367, 41–55. [Google Scholar] [CrossRef]
  63. Cools, N.; Vesterdal, L.; De Vos, B.; Vanguelova, E.; Hansen, K. Tree species is the major factor explaining C:N ratios in European forest soils. For. Ecol. Manag. 2014, 311, 3–16. [Google Scholar] [CrossRef]
  64. Dan, Z.; Talkner, U.; Spohn, M.; Joergensen, R. Microbial biomass phosphorus and C/N/P stoichiometry in forest floor and a horizons as affected by tree species. Soil Biol. Biochem. 2017, 111, 166–175. [Google Scholar] [CrossRef]
Figure 1. Study area and soil sampling plots.
Sustainability 16 08646 g001
Figure 2. Distribution of SOM, TN, and TP stoichiometry across soil depth.
Sustainability 16 08646 g002
Figure 3. SOM, TN, and TP stoichiometry among different types of forests. (a) SOM, (b) TN, (c) TP, (d) C:N, (e) C:P, (f) N:P. Different lowercase letters indicate significant differences among forest types (p < 0.05).
Sustainability 16 08646 g003
Figure 4. Bidimensional ordering chart of the RDA of relationships between soil stoichiometry and soil physicochemical properties. Note: BD, bulk density; AHN: alkali − hydrolyzable nitrogen; AP: available potassium; SOM: soil organic matter; TP, total phosphorus; TN, total nitrogen.
Sustainability 16 08646 g004
Figure 5. Pearson correlation analysis showing the coefficients between selected soil chemical and physical properties and soil stoichiometry. Note: +, positive correlation; −, negative correlation; *, correlation is significant at the 0.05 level.
Sustainability 16 08646 g005
Figure 6. The direct and indirect effects of environmental factors on SOC, TN, and TP stoichiometry using structural equation modeling (SEM). (a) SOM, (b) TN, (c) TP, (d) C:N, (e) C:P, (f) N:P. Positive effects are represented by solid-red arrows, negative effects by solid-blue arrows, and non-significant paths by dashed lines. *, correlation is significant at the 0.05 level, **, correlation is significant at the 0.01 level, ***, correlation is significant at the 0.001 level.
Sustainability 16 08646 g006
Disclaimer/Publisher’s Note: The statements, opinions and data contained in all publications are solely those of the individual author(s) and contributor(s) and not of MDPI and/or the editor(s). MDPI and/or the editor(s) disclaim responsibility for any injury to people or property resulting from any ideas, methods, instructions or products referred to in the content.

