Abstract
This paper aims to clarify the intricate relationships between technological innovation, transportation industry development, and CO2 emissions to facilitate a positive synergy among technology, the economy, and climate, advancing the fulfillment of the ‘double carbon’ goal. Utilizing panel data from 30 provinces in China from 2005 to 2020, we employ the panel vector autoregressive model using a generalized method of moments to empirically examine the dynamic interactive effects between these participants. The findings reveal that the transportation industry significantly promoted the inhibitory impact of technological innovation on CO2 emissions. However, such reductions cannot counterbalance the rise in emissions from the transportation industry. Moreover, its effects varied significantly across regions. Specifically, transportation industry development within eastern China contributed to a shift in the local carbon emission effects from positive to negative under the positive influence of technological innovation. In the northeast, the transportation industry enhanced the inhibitory effect of technological innovation on CO2 emissions. In contrast, across the western region, industrial development in transportation intensified the role of technological innovation in promoting CO2 emissions. Furthermore, this work found that CO2 emissions notably diminished the CO2 reduction performance of technological innovation in the eastern part and enhanced this performance in the northeastern region. These findings further revealed the complex interplay between technological innovation, the transportation industry, and CO2 emissions. They offer insights for policymakers to tailor region-specific technologies to bolster the ‘dual carbon’ goal and sustainable transportation development strategies, thereby achieving CO2 reduction.
1. Introduction
In the 21st century, climate change and resource scarcity have emerged as dual challenges worldwide. China, as a responsible member of the international community, bears significant responsibility for spearheading the global ‘green economic recovery’ [1]. The International Energy Agency reports that China’s transportation industry ranks as the third largest contributor to national greenhouse gas emissions, following the industrial and construction sectors. Reforming transportation infrastructure, network design, and service quality can impact 80% of direct and indirect CO2 emissions, playing a pivotal role in achieving China’s ‘dual carbon’ goal [2,3]. Furthermore, technological innovation-driven progress is vital in addressing environmental pollution and mitigating CO2 emissions [4]. Prioritizing technological innovation has become a key strategy for China to foster a low-carbon economy, establish a resource-efficient and eco-friendly society, and enhance national competitiveness [5]. In sum, transportation industry development and technological innovation are integral to CO2 reduction. In this sense, exploring their incorporation into the same framework and dynamic interactive effects with CO2 emissions is necessary, thereby guiding the endeavors targeting addressing the climate challenge of high CO2 emissions in China.
For the above purpose, we reviewed the existing literature on this topic. Regarding research on technological innovation and CO2 emissions, much attention is placed on decarbonization technologies, such as renewable energy development [6], negative emission technology [7], and CO2 capture and storage [8]. In addition, an increasing number of researchers are exhibiting interest in the impact of technological innovation on the first-level management efficiency and energy consumption of sectors, i.e., the construction industry [9] and the transportation industry [10]. In studies on the transportation industry and CO2 emissions, CO2 emission measurement, influencing factors, and reduction strategies within one sector are classic directions. These studies typically focus on individual development elements, including the transport infrastructure scale [11], transport capacity [12], and transport service quality [13]. Furthermore, a limited number of studies have also explored the effect of these individual development elements within the transportation industry on urban CO2 emissions [14]. In the realm of innovation and transportation industry development, factors such as transportation infrastructure [15] and transportation capacity [16] are essential for attracting innovation resources (i.e., urban technological talents and R&D institutions). Technological innovation and management innovation are viewed as fundamental pillars for the research, development, and implementation of intelligent transportation systems, contributing to efficient traffic management and the transformation of transportation energy [17].
Although previous research has extensively examined the relationships between technological innovation, transportation industry development, and CO2 emissions, several areas remain underexplored. Firstly, the published works do not consider the interactive effects of technological innovation and transportation industry development on CO2 emissions. Accordingly, the potential synergy between the two factors on CO2 emissions is understudied, leading to deviations in policy formulation and implementation effects [18]. Secondly, due to neglecting the potential boomerang effect of CO2 emissions on technological innovation and the transportation industry, discovering more effective solutions to CO2 emission reductions is hindered [19]. Furthermore, a research gap exists between the development of the overall transportation industry and urban CO2 emissions. Analyzing this relationship solely relying on a single development factor may fall short of unveiling the transportation industry’s effect on CO2 emissions since this method may underestimate the positive externalities of transportation in reducing urban CO2 emissions [20]. Moreover, previous research predominantly focuses on global, national, or urban single samples, neglecting regional heterogeneity. Given China’s vast territory and diverse natural resources, geographical features, and social and economic statuses across regions, overlooking these differences can impede the effective application of macro policies at a national level [21].
Based on the above analysis, three open questions remain unaddressed in the existing literature. First, what are the dynamic relationships between technological innovation, transportation industry development, and CO2 emissions across China and its regions? Does any regional heterogeneity exist? Second, how does the interaction of technological innovation and transportation industry development affect CO2 emissions—synergistically or antagonistically? Third, how can the Chinese government implement scientifically based subsidy policies for technological innovation and strategies for high-quality development of the transportation industry in light of regional realities to achieve the ‘dual-carbon’ goal effectively? These issues present urgent challenges for China and are key innovations of this research.
Our study utilized panel data from 30 provinces from 2005 to 2020 to advance relevant research and address the aforementioned questions. Briefly, by applying the panel vector autoregressive (PVAR) model estimated by the generalized method of moments (GMM), we analyzed the dynamic impacts and regional variations among technological innovation, transportation industry development, and CO2 emissions. The objectives are to uncover the interaction mechanism between technological innovation, transportation industry development, and CO2 emissions across China and its regions; to examine whether the two sectors have a synergistic effect on CO2 reduction; to provide valuable insights for interdisciplinary research on the ‘dual carbon’ goal; to offer a theoretical framework for understanding the interactions between technology, the economy, and climate; and to present empirical evidence to guide national policymakers and regional governments in developing effective strategies for CO2 reduction through coordinated efforts in technological innovation and transportation industry development.
This study presents three primary contributions. To our knowledge, it is the first investigation into the dynamic relationship between technological innovation, transportation industry development, and CO2 emissions in the Chinese context. Additionally, this work comprehensively evaluates the overall development of the transportation industry from multiple dimensions, more accurately reflecting the relationship between the transportation industry, technological innovation, and CO2 emissions. Furthermore, it systematically explores and quantifies the regional heterogeneity of the triadic relationships among technological innovation, transportation industry development, and CO2 emissions, laying a foundation for policy formulation.
This manuscript is structured into five sections. Section 2 presents the literature review and hypothesis development. Section 3 details the data and methodology employed. Section 4 summarizes and discusses the results. Lastly, Section 5 encapsulates the main conclusions, illustrates policy implications, and offers insights into limitations and future research directions.
2. Literature Review and Hypothesis Development
2.1. Nexus between Technological Innovation and CO2 Emissions
According to Schumpeter’s theory of ‘creative destruction’, the impact of technological innovation on environmental quality, particularly in terms of CO2 reduction, is uncertain [22]. Numerous studies have reported that technological innovation favorably reduced CO2 emissions [23,24]. According to Ostadzad et al. [25], technological innovation promoted CO2 reduction by increasing production efficiency and developing renewable energy sources. Conversely, some conflicting views doubt whether technological advancements always decrease CO2 emissions [26,27]. Khan et al. [28] argued that despite the upgrade of energy efficiency, technological innovation might be insufficient to significantly reduce CO2 emissions without additional cost-effective measures such as new advancements, technologies, and equipment. Su et al. [29] found in their research using Brazilian quarterly data from 1990 to 2018 that technological innovation could potentially elevate CO2 emissions. Furthermore, Dauda et al. [30] examined the panel data from 18 developed and developing economies from 1990 to 2016, revealing that technological innovation reduced CO2 emissions in BRICS countries while increasing releases in the Middle East and North African countries. It is worth noting that stringent environmental regulations targeting high CO2 emissions could impact technological innovation through mechanisms such as the ‘conduction effect’ and ‘crowding-out effect’ [31,32]. Zhao et al. [33] found that such regulations had a ‘conduction effect’, which could drive regional technological innovation through industrial restructuring and encouraging industrial agglomeration. In contrast, Herman et al. [34] identified the ‘crowding-out effect’, suggesting that strict regulations might hinder regional innovation due to the reduced availability of human resources and capital investment. Furthermore, increased costs for pollution control under these regulations could scale down capital input in technology and production, impeding technological progress and innovation. Similarly, Li et al. [35] discovered that between 2003 and 2017, environmental regulations on pollution-intensive enterprises in eastern and central China notably facilitated technological innovation, and such a promotion effect was insignificant in the western region. The diversity of research findings indicates that a single perspective cannot accurately explain the relationship between technological innovation and CO2 emissions in China.
We propose the following hypothesis based on the above analysis:
H1:
Technological innovation significantly influences CO2 emissions, and vice versa, in a regionally heterogeneous manner.
2.2. Nexus between Transportation Industry Development and CO2 Emissions
Existing research primarily examines the one-way influence exerted by individual indicators of transportation industry development on CO2 emissions [11,36]. Awaworyi Churchill et al. [37] analyzed approximately 150 years of Economic Cooperation and Development (OECD) data, revealing that a 1% rise in transportation infrastructure stock resulted in a roughly 0.4% increase in CO2 emissions. Umar et al. [38] confirmed that transportation passenger volume played a crucial role in CO2 emission growth based on the panel data in China from 2000 to 2015. Li and Zhang [39] suggested that intervening in transportation mode selection through operation management could reduce CO2 emissions. Notably, spatial variations were found in the mentioned impact. Xie et al. [40] examined data from 283 Chinese cities between 2003 and 2013, demonstrating that transportation infrastructure construction elevated CO2 emissions in large and medium-sized cities rather than in small cities. Dzator et al. [41] observed that air transport infrastructure increased CO2 emissions in 26 OECD countries from 1960 to 2018, and railway infrastructure delivered no significant effects. A limited volume of studies has explored the impact of CO2 emissions on transportation development. Han et al. [42] illustrated that China’s CO2 trading pilot policy encouraged pilot areas to improve their road transportation infrastructure. Similarly, Raux et al. [43] discovered that the French CO2 trading policy could temporarily influence residents’ travel behaviors. These findings complicate the interplay between the transportation industry and CO2 emissions in China.
On this basis, we derive a second hypothesis:
H2:
Transportation industry development significantly influences CO2 emissions, and vice versa, and this two-way influence displays regional heterogeneity.
2.3. Nexus between Technological Innovation and Transportation Industry Development
The transportation industry serves as an important engine driving technological innovation, as evidenced by prior studies [44,45]. Agrawal et al. [46] analyzed historical data on interstate transportation infrastructure in the United States and found that a 10% increase in highway stock contributed to a 1.7% rise in patent applications within five years. Similarly, Yang et al. [47] utilized an endogenous growth model that focused on high-speed rail fares and speeds and demonstrated that high-speed rail largely fostered innovation growth and convergence in China, with impact values of 14.73% and 5.91%, respectively. This impact also varies across cities and distances [48]. The impact of technological innovation on the transportation industry has also attracted scholarly attention [49,50]. Koukaki and Tei [51] suggested that adopting advanced information technology and new equipment played a crucial role in enhancing the efficiency of air transport. Mouratidis et al. [52] studied the different impacts of remote activities and sharing technologies on residents’ travel patterns. The results showed that teleconferencing reduced public transportation passenger volumes; in contrast, emerging models, such as car-sharing and air traffic, were expected to increase passenger traffic. Additionally, some literature focuses on the effects of the synergy between technological innovation and transportation industry development on CO2 emissions [53,54]. Using the dynamic system-generalized method of moments estimation, Zhu et al. [55] revealed that the interaction between technological innovation and freight and railway infrastructure effectively reduced energy consumption and CO2 emissions by improving energy efficiency and transport patterns. By employing spatial Durbin models and mediation effect models, Li et al. [56] revealed the indirect impact of different transportation infrastructures on CO2 emissions in Chinese cities through technological progress; however, this effect varied across regions. Bieser et al. [54] found that telecommuting activities reduced long-distance commuting demand and thus lowered CO2 emissions in the transportation sector. However, these activities also increased household energy use, highlighting a necessity to further explore the net CO2 reduction benefits.
There is a scarcity of direct evidence supporting the CO2 emissions’ reverse influence on the synergy between technological innovation and the development of the transportation industry. However, it can be speculated that CO2 emissions promote such synergy based on practices in carbon trading markets and low-carbon tax policies. Notably, whether this promotion effect suppresses or stimulates the reduction in CO2 emissions still warrants further verification. To sum up, a two-way interaction exists between technological innovation and transportation industry development, characterized by regional heterogeneity in effects. For this reason, further investigation incorporating specific regions is needed to clarify their relationship and influence mechanism on CO2 emissions.
Based on these findings, this work develops the following hypotheses:
H3a:
Technological innovation interacts with transportation industry development in a regionally heterogeneous pattern.
H3b:
This interaction affects CO2 emissions, and such an influence also has regional variations.
The theoretical framework of this study is illustrated in Figure 1.
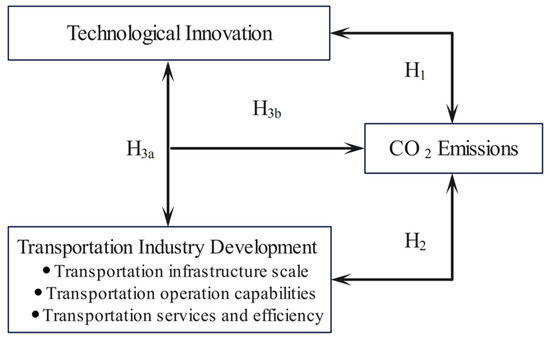
Figure 1.
Relationship among technological innovation, transportation industry development, and CO2 emissions.
3. Data and Methods
3.1. Data Sources and Variables
The provinces and analysis period were chosen based on data availability and integrity. Given the insufficient data for Tibet, Hong Kong, Macao, and Taiwan, this study relies on panel data from 30 Chinese provinces between 2005 and 2020. Furthermore, according to the National Bureau of Statistics of the People’s Republic of China, these provinces are divided into eastern, central, western, and northeastern regions. The data are mainly from the ‘China City Statistical Yearbook’, ‘China Science and Technology Statistical Yearbook’, and ‘China Energy Statistical Yearbook’. The variables are as follows.
CO2 emissions (CO2). To mitigate the impact of sparse population, this study calculates the average CO2 emission weighted by urban population density, referring to Wu et al. [57]. Population density is defined as the ratio of permanent population to built-up area [58]. The quantification of the total CO2 emissions follows the guidelines provided by the Intergovernmental Panel on Climate Change (2006) for national greenhouse gas inventories. The calculation formula is as follows:
where CE2 is the total CO2 emissions, Q is the annual consumption of energy, i is the energy (i.e., coal, coke, crude oil, gasoline, kerosene, diesel, fuel oil, and natural gas); H is the average low calorific value; C is the CO2 emissions coefficient; and F is the carbon oxidation factor.
Technological Innovation (Uric). The number of patents is typically applied to measure technological advancement, encompassing both patent grants and filings [59]. Invention patents are more technically advanced and innovative than utility models and designs, making them a popular indicator for assessing technological innovation capacity [60]. In line with Ruiz-Ortega et al. [61], the proportion of invention patent applications to total patent applications is measured as a key metric for evaluating technological innovation.
Transportation Industry Development (Eotd). The evaluation of transportation industry development involves three dimensions: transportation infrastructure scale, transportation capacity, and service efficiency index. This category aligns with the studies by Galkin et al. [13]. The weight of each index item within these dimensions is obtained using Shannon’s (1948) entropy method. Considering the widespread use of this approach, this article omits the measurement process [62]. The specific results are detailed in Table 1.

Table 1.
Measuring index system and weight of transportation industry development.
In order to address the endogeneity issue, instrumental variables are introduced to mitigate the bias in estimation, including the following:
Economic growth (GDP). GDP is a key indicator of economic activity and greatly impacts the factors closely related to CO2 emissions, including the total energy consumption and its structure. Kirikkaleli et al. [63] found that the per capita GDP in Denmark remarkably increased CO2 emissions. For this consideration, per capita GDP is selected to measure economic growth.
Urbanization rate (Urra). The urbanization rate is an important indicator of the urbanization process and nonlinearly influences CO2 emissions [64]. Referring to the research of Vo et al. [65], we compute the proportion of the urban population to the total population to measure the urbanization rate.
Environmental regulation (REGU). As a critical tool for government intervention in CO2 reduction, environmental regulation controls the emissions through adjusting industrial structure and technological progress [66]. This article refers to Zhao et al. [33] and selects the weighted value of pollutant emissions to assess the intensity of environmental regulations.
Energy consumption structure (Ecs). The energy consumption structure represents the volume of energy consumed from each energy source and its relative proportion in the total energy consumption. The noticeable role of coal consumption in escalating CO2 emissions has been highlighted by Zhang et al. [67]. Based on the work of Liu et al. [68], the current work defines the energy consumption structure as the ratio of coal consumption to total energy consumption.
Table 2 provides descriptive statistics for the entire country and its eastern, central, western, and northeastern regions.
Table 2.
Descriptive statistics of the variables.
3.2. Methods
The GMM-PVAR method is adopted for two primary reasons. First, PVAR addresses the cross-sectional dynamic heterogeneity by formulating equations for endogenous variables and incorporating time effects and fixed effects. It also uses the impulse response function to analyze long- and short-term interactions between variables, visually representing their immediate response to changes [69]. Second, the two-step GMM estimation method enhances robustness by comparing static and dynamic model results, effectively dealing with complex data distributions and potential endogeneity issues, thereby increasing the reliability of model estimation and the credibility of conclusions [70]. Additionally, the GMM-PVAR model has been applied in other multivariate dynamic studies [71,72]. Subsequently, we need to construct a new PVAR:
Here, i = (1, 2,⋯, 30), t = (1, 2,⋯, 15) denotes the provinces and time period, respectively; j represents the lag order of the variables; α0 is the intercept term vector; Aj is the regression coefficient matrix; βi, θt, and εit are the fixed effect, time effect, and random disturbance term, respectively.
The PVAR coefficient has been reported to be unreliable [69]. To address this issue, by taking the logarithm of the variable in Formula (2) and incorporating the control variable and the explanatory variable’s interaction term, we establish the GMM model. The specific model is as follows:
Here, Urici,t−j × Eotdi,t−j represents the interaction effect of technological innovation and transportation industry development; Contri,t−j is a collection of control variables, including Ecgr, Urra, REGU, and Ecs.
4. Results and Discussion
4.1. Unit Root Test
Prior to the empirical analysis of panel data, it is crucial to assess the stability of time series variables, prevent spurious regression, and confirm the outcomes’ predictability. This study employs the Augmented Dickey–Fuller (ADF) to examine the stationary properties of these variables [73]. The first-order backward difference term is introduced in the lag period. This incorporation enables the adopted method to effectively evaluate the autocorrelation and heteroscedasticity in time series data, thereby enhancing the results’ reliability. It has been widely used in economics and social sciences [74,75]. The findings are presented in Table 3. All variables reject the null hypothesis of ‘non-stationarity’ at a significant level after first differencing, indicating the absence of a unit root in each variable.
Table 3.
Results of the unit root test for the variables.
4.2. Impulse Response Function (IRF) and Variance Decomposition
The impulse response diagram visually reflects the short-term, unilateral impact of one variable on the other after applying an initial impact. Variance decomposition breaks down the fluctuations of the endogenous variable into components related to the disturbance term of the equation. By measuring the disturbance term’s contribution to the mean square error of model prediction, the long-term dynamic relationship between variables can be assessed [76]. Ensuring the stability of the model is crucial for the validity of impulse response analysis and variance results. This study, inspired by Dogan et al. [77], utilizes AR characteristic polynomial roots for PVAR stability testing. The findings indicate that all eigenvalues fall within the unit circle, suggesting a range less than ‘1’, thus passing the stability check.
4.2.1. Analysis of Impulse Response Function Results
In this study, we utilize 1000 Monte Carlo simulations to analyze the impulse response functions of the three variables at the national and regional (eastern, central, western, and northeastern) scales over a 0–10 period under standardized shocks from each other. The results are illustrated in Figure 2, Figure 3, Figure 4, Figure 5 and Figure 6.
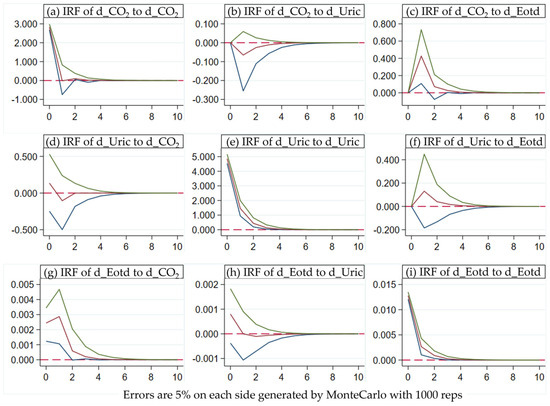
Figure 2.
Impulse responses on the national level.

Figure 3.
Impulse responses in the eastern region.

Figure 4.
Impulse responses in the central region.
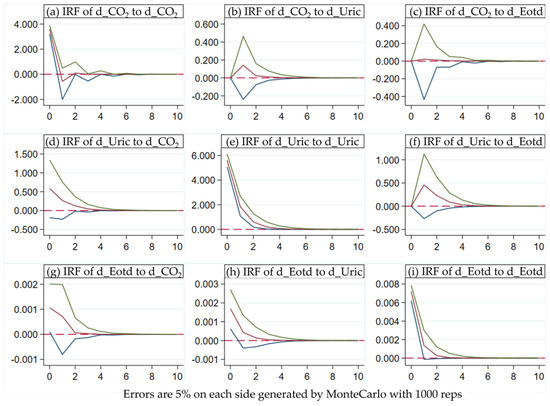
Figure 5.
Impulse responses in the western region.
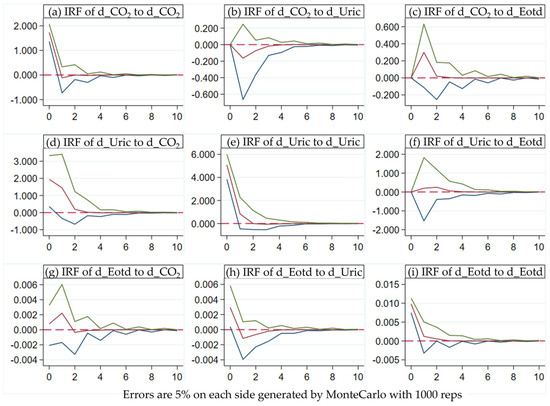
Figure 6.
Impulse responses in the northeastern region.
The simulation results on the national level are illustrated as follows. From Figure 2a,e,i, the positive impact of CO2, Uric, and Eotd on their future trends is mitigated. As shown in Figure 2b,d, Uric undergoes a transition from a positive to a negative response when influenced by CO2; following the impact of Uric, CO2 exhibits a negative response, resulting in decreases to 0 by Phase 6. According to Figure 2c,g, positive influences are observed in Eotd and CO2 due to mutual impact. Figure 2f,h indicate a positive response of Uric following the impact of Eotd, displaying a consistent trend with that of the Uric-impacted CO2. In contrast, Eotd evolves from a positive to a negative response after the impact of Uric, ultimately approaching 0. These findings indicate that Eotd drives Uric and increases CO2. This highlights that despite Eotd’s potential to enhance national Uric, this process still relies heavily on energy, resulting in substantial pressure for CO2 reduction. In this sense, the Chinese government should fully leverage the driving role of green and low-CO2 transport in urban innovation, increasing the output and speed of transforming technological innovations for CO2 reduction to achieve the CO2 peak at the earliest opportunity.
The following discussion unfolds on a regional scale. According to Figure 3a,e,i, Figure 4e,i, Figure 5a,e,i and Figure 6e,i, the impulse responses of regional Uric and Eotd to themselves are consistent with those at the national scale, as well as the impulse responses of CO2 in the eastern and western regions. Notably, the results in the central and northeastern regions are relatively complex (see Figure 4a and Figure 6a). As shown in Figure 3b, Figure 4b, Figure 5b and Figure 6b, the impulse response path of CO2 in the eastern, central, and northeastern regions is consistent with that of the entire country after the impact of Uric. Despite such high consistency, the western area shows an opposite trend, suggesting that the rebound effect of local Uric may increase CO2. As shown in Figure 3d, Figure 4d, Figure 5d and Figure 6d, the impulse response paths of Uric in the four regions impacted by CO2 are significantly heterogeneous. As illustrated in Figure 3c,g, Figure 4c,g, Figure 5c,g and Figure 6c,g, the impact response path between CO2 and Eotd in the four regions is consistent with that of the whole nation. In light of Figure 3f, Figure 4f, Figure 5f and Figure 6f the impact response path of Uric in the western and northeastern areas exhibits good agreement with that of the whole country following the Eotd impact. By comparison, the eastern and central regions experience a transition from a positive to a negative response, displaying a trend approaching 0, which indicates a more complex impact of Eotd on Uric in these regions. According to Figure 3h, Figure 4h, Figure 5h and Figure 6h, the response path of Eotd to the impact of Uric in northeastern region is consistent with that of the entire nation. The central and western regions exhibit a positive response that diminishes gradually; by comparison, a negative response with a similar decreasing trend is found in the east. These findings suggest that Uric in the central and western regions positively influences Eotd, while it delivers an inhibitory effect in the eastern part.
4.2.2. Variance Decomposition
As shown in Table 4, the variance decomposition results of the 10th and 20th prediction periods are basically consistent, indicating that the ability of each shock to explain variable changes remains stable after ten prediction periods.
Table 4.
Variance decomposition result.
On the national level, CO2, Uric, and Eotd contributed significantly to themselves, with each exceeding 90%. Notably, the long-term relationship between Uric and CO2 showed a minimal impact of 0.1%. This negligible impact may be due to the fact that Uric’s potential to reduce CO2 has not been fully tapped. Based on these findings, the government should strengthen policies that leverage Uric to achieve a CO2 peak. Furthermore, Eotd had a 2.2% long-term contribution to CO2, and CO2 contributed 7.8% to Eotd. These results suggested a mutual promotion relationship, typically causing undesirable consequences. In this sense, the government needs to prioritize the adoption of clean energy and facilitate the energy transition within the transportation sector. Eotd delivered a 0.6% long-term contribution rate to Uric; conversely, Uric contributed a negligible 0.0% to Eotd. This implied that Eotd influenced Uric, while the reverse relationship was not significant. In light of the above analysis, the Chinese government needs to address the challenges associated with integrating Uric within the Eotd to foster a positive synergy between the two elements.
At the regional scale, this research revealed that in the eastern, central, western, and northeastern regions of China, the long-term contribution rates of Uric to CO2 varied, representing 0.2%, 6.1%, 0.1%, and 2.1%, respectively. In contrast, the long-term contribution rates of CO2 to Uric accounted for 6.6%, 6.5%, 1.2%, and 18.2%, respectively. These findings indicated that Uric in the central and northeastern regions engage in CO2 reductions. Additionally, environmental regulations targeting CO2 reductions across the whole nation significantly influenced Uric to varying degrees. Eotd in the four regions of interest contributed to CO2 at different rates, representing 4.1%, 4.8%, 2.8%, and 0%, respectively. Furthermore, the long-term contribution rates of CO2 to Eotd were 20.3%, 8.8%, 2.8%, and 4.9%, respectively. These results suggested that the eastern regions were characterized by developed economies, high transportation activity, and great reliance on fossil energy, thus encountering more pressure to reduce transportation CO2. The relatively low contribution in the west reflects the region’s less developed transportation, while the resulting values in the northeast may be linked to industrial restructuring and energy transformation. Local governments should implement measures to decrease CO2 release from the development of the transportation industry in high-emission areas. Across the eastern, central, western, and northeastern regions, the long-term contribution rates of Eotd to Uric occupied 0.2%, 3.1%, 7.1%, and 7.3%, respectively. In addition, the long-term contribution rates of Uric to Eotd comprised 0.2%, 0.6%, 0.0%, and 2.4%, respectively. These figures inferred that fostering high-quality Eotd of the western and northeastern regions could drive Uric, thereby accelerating the research, development, and application of new technologies. Notably, Uric in northeast China is predominant in advancing Eotd; in contrast, the western part may encounter challenges in achieving the synergic integration of Uric and Eotd.
4.3. GMM-PVAR Estimation
The model’s stability was initially assessed using the previous AR characteristic polynomial root. The results demonstrated that all moduli of feature values were less than 1, confirming that the model passed the stability test. Subsequently, overidentification and sequence correlation tests were conducted on the tool variables (Ecgr, Urra, REGU, and Ecs), and the results are presented in Table 5. The p value of the Sargan statistics exceeded 0.1, suggesting the validity of these tool variables and no overidentification issues. Additionally, the AR (1) and AR (2) statistics revealed no sequence-related disturbances. Based on these outcomes, it can be concluded that the developed model is suitable, and the estimates are reliable and consistent. The estimated coefficients of the model are given in Table 5.
Table 5.
Estimation results of the GMM-PVAR model.
On the national level, a 1-unit increase in Uric only resulted in a 0.0727-unit CO2 reduction with a significance level of 1%. For each unit increase in the Eotd, CO2 increased by 1.802 units at a significance level of 1%. Moreover, in the case of every 5-unit increment of Uric × Eotd, a 0.0332-unit increase was seen in CO2. These results indicated that Uric could reduce CO2, and Eotd amplified this positive effect, yet the reductions are inadequate to offset the rise in transportation CO2 fully. The potential reasons for these findings are summarized as follows. First, although technological innovation can reduce CO2 emissions, its potential has not been fully utilized. Second, China’s rapid urbanization has driven the expansion of transport infrastructure and capacity, rendering CO2 a primary negative environmental consequence, which aligns with the findings of Wang et al. [78]. Third, although the expansion of transportation networks has facilitated the flow of innovative resources, the integration and practical application of green innovations remain underdeveloped. This is consistent with the finding by Acheampong et al. [14], which showed that the interplay between transport infrastructure and innovation could decrease CO2 levels in EU countries. However, the investigation into 14 G20 countries by Erdogan et al. [79] presented inconsistent results. This can be attributed to the varying levels of economic development, policy frameworks, technological adoption, and social contexts across regions, highlighting the importance of investigating regional disparities in this paper.
Regionally, an increase of 1 unit in Uric in the eastern and northeastern regions contributed to reductions of 0.727 and 2.670 units of CO2, respectively. In contrast, for the central and western regions, each unit rise of Uric resulted in increases of 6.417 and 3.156 units of CO2, respectively. Possible reasons for this include the following: First, Uric in the central and western regions exerts a threshold effect on reducing environmental pollution. Additionally, innovation in these areas progresses slower than in the other two areas. The potential of Uric in CO2 reduction necessitates further exploration. Upon surpassing the threshold value, the inhibitory effect of Uric on CO2 can be visible. This finding aligns with the research by Wang and Dong [80] on OECD countries. Second, the central and western regions experiencing relatively slow development encounter an urgent need for development. Uric involves uncertainties and risks, and its rebound effect increases productivity and economic growth benefits at the potential cost of inadvertently elevating CO2 pressure levels. This observation is consistent with the findings of Adebayo and Kirikkaleli [24] for Japan and Su et al. [29] for Brazil. In the eastern and northeastern regions, each unit increase in Eotd contributed to respective increases of 1.802 and 13.207 units of CO2. By comparison, the same increase for the central and western regions resulted in declines of 1.586 and 7.619 units of CO2, respectively. Our research innovatively observed an inhibitory effect of Eotd on CO2. This result may be attributed to the pronounced regional disparities in economic conditions, geographical characteristics, and transportation development levels across China. In the northeast, industrial production heavily relies on traditional fuel-powered vehicles, consuming substantial energy. In the east, the advanced economy and high population density drive frequent transportation activities; however, the limited adoption of green transportation technologies cannot effectively mitigate the resulting high energy use. In contrast, the vast territories and low population density of the central and western regions hindered efficient, long-distance transportation. The improved transportation networks have recently addressed these challenges, greatly reducing energy consumption. Despite the lag in the local transportation industry development, more modern energy-efficient technologies have been incorporated into the later-built infrastructure, further decreasing energy usage. In the eastern, central, and northeastern regions, every 1-unit increase in Uric × Eotd reduced CO2 by 0.332, 1.089, and 2.673 units, respectively. By comparison, the western region experienced a 2.528-unit elevation in CO2 with each unit increase in Uric × Eotd. These findings indicated that the Uric × Eotd in eastern, central, and northeastern China synergistically inhibited the regional CO2, while the opposite effect was observed in the western part. Notably, the influence mechanisms of these factors vary. Specifically, in the eastern region, Uric reduced more CO2 by limiting Eotd. The Eotd decreased CO2 through enhancing Uric in Northeast China. In the western region, Eotd increased CO2 despite the enhancement in Uric. The influence mechanism in central China was complex. These differences may be attributed to several factors. In the eastern region, innovations in information and network technology have adjusted travel demand and structure, leading to diminished passenger turnover and energy consumption. In the northeast, the transportation industry has accelerated the advancement and application of low-CO2 technologies, optimizing energy efficiency. In the western part, despite the technological innovation driven by the transportation industry, the resulting scale effect has increased energy consumption due to the lack of green and low-CO2 innovations. In the central region, where the economic level and transportation industry development lie between those of the east and west, both synergistic and contradictory effects are found. The coefficient of the explanatory variables with one period lagged (L1. CO2) in China’s eastern, central, western, and northeastern regions exhibited a positive impact at a 1% significance level. This observation suggested that the historical CO2 delivered a promotional effect on the current period. This relationship was influenced by the interaction of various factors affecting CO2 as well as temporal and spatial dependencies.
5. Conclusions and Policy Recommendations
Based on the comprehensive analysis of 30 inter-provincial panel data in China from 2000 to 2020, this study utilized the GMM-PVAR model to investigate the dynamic interaction effects and regional heterogeneity of Uric, Eotd, and CO2. The following conclusions and policy recommendations are drawn:
On the national level, Uric promotes CO2 mitigation, and mutual enhancement effects exist between Eotd and CO2. The Eotd can reduce CO2 by fostering Uric. However, the increased emissions in this industrial sector exceeded those offset by Uric-driven reductions. Regional heterogeneity was also illustrated as follows. In the eastern region, CO2 and Uric interacted in a mutually suppressive manner, while CO2 and Eotd possessed a mutual promotion relationship. Moreover, the role of Uric in reducing CO2 could be enhanced by inhibiting Eotd. In Northeast China, Uric suppressed CO2, while CO2 drove the progress in Uric. The interaction between Eotd and CO2 was characterized by mutual reinforcement. Eotd decreased CO2 by enhancing Uric. Across the central region, the interplay between the three factors was intricate. In the west of China, except for the negative effect of Eotd on CO2, the remaining relationships positively influenced the factors involved. Additionally, unfavorable interactions were found between Uric and Eotd. The above phenomena can be exemplified by the fact that Uric-fueled Eotd increased CO2.
Based on the above conclusions, this research summarized several policy recommendations. Firstly, the Chinese government should develop and implement technology-supported CO2 peak strategies and transportation industry development plans tailored to regional conditions. Additionally, it is necessary to establish a CO2 reduction sharing mechanism that encompasses green transportation infrastructure, low-CO2 transportation means, and green, efficient operational services. Moreover, shifting the impact of CO2 emission on the entire transportation industry chain from positive to negative should be considered. Additionally, further integration of the low-CO2 transportation industry and green technological innovation should be highlighted. Enhancing the accessibility of the low-CO2 transportation network and improving the quality and efficiency of transportation services are crucial for promoting the diffusion and aggregation of green innovations. Secondly, the eastern region should prioritize the transformation and utilization of technological innovations, such as big data, artificial intelligence, and virtual reality in multiple industrial sectors, to upgrade social operational efficiency and reduce reliance on private vehicles, thereby achieving dual CO2 reductions within the transportation industry and society as a whole. It is also important to remain vigilant about the potential negative effects of environmental regulations on technological innovations to avoid compromises of regional CO2 reduction efforts. Thirdly, in the northeast of China, strict CO2 accounting standards and control systems should be established by prioritizing low-CO2 solutions within enterprises. Enhancing the connectivity of green transportation networks is vital for reducing transportation costs and increasing efficiency, potentially encouraging cross-regional collaboration among researchers and businesses. Fourthly, governments in the western region should focus on a more efficient and accessible transportation network to reduce CO2 emissions associated with inefficient transportation and redundant activities. In addition, efforts should be made to guide the transformation of green technological innovations and manage potential risks, such as uncertainties and ‘CO2 leakage’, to prevent adverse effects on CO2 reduction. Finally, the authorities in the central region should adopt successful practices from other regions in high-quality transportation management and green technology innovations. Tailoring strategies to unique regional conditions should be emphasized to maximize the synergistic effects of transportation and technological innovations, thereby maximizing CO2 reduction.
Although this article holds theoretical and practical significance, it also has limitations that necessitate further improvements. The measurement of the transportation industry’s development is constrained by data source limitations, particularly the lack of detailed sub-items for railway and air transportation systems. Moreover, the study’s temporal and spatial scope, focusing on the provincial scale over fifteen years from 2005 to 2020, are influenced by geographical, economic disparities, and the impact of the COVID-19 pandemic. Future research should consider a prolonged time frame and reduced spatial units for a more comprehensive analysis and comparison. Additionally, the uncertain impact of various factors on regional heterogeneity in CO2 reductions requires ongoing attention from the academic community to provide more insightful findings and effective policy recommendations for achieving the CO2 peak.
Author Contributions
Conceptualization, X.R.; Data curation, X.W., Z.W. and H.Z.; Methodology, Y.Z. and J.S.; Writing—review and editing, K.A. and X.R. All authors have read and agreed to the published version of the manuscript.
Funding
The authors received financial support from the National Social Science Foundation of China (21BJY223), Chongqing Municipal Education Commission (KJQN202001311, KJQN202101342), General project of Chongqing Natural Science Foundation (CSTB2023NSCQ-MSX0046) and Humanities and Social Sciences Project of Chongqing Municipal Education Commission (21SKGH217).
Institutional Review Board Statement
Not applicable.
Informed Consent Statement
Not applicable.
Data Availability Statement
The datasets used and analyzed during the current study are available from the corresponding author on reasonable request.
Acknowledgments
The authors would like to thank the editor and anonymous referees for their helpful comments.
Conflicts of Interest
The authors declare that they have no competing interests.
References
- Yue, H. Prediction of CO2 Emissions in China by Generalized Regression Neural Network Optimized with Fruit Fly Optimization Algorithm. Environ. Sci. Pollut. Res. 2023, 30, 80676–80692. [Google Scholar] [CrossRef] [PubMed]
- Moslem, S.; Stević, Ž.; Tanackov, I.; Pilla, F. Sustainable Development Solutions of Public Transportation:An Integrated IMF SWARA and Fuzzy Bonferroni Operator. Sustain. Cities Soc. 2023, 93, 104530. [Google Scholar] [CrossRef]
- Kwakwa, P.A.; Adjei-Mantey, K.; Adusah-Poku, F. The Effect of Transport Services and ICTs on Carbon Dioxide Emissions in South Africa. Environ. Sci. Pollut. Res. 2022, 30, 10457–10468. [Google Scholar] [CrossRef] [PubMed]
- Gong, Y.; Cao, H.; Yuan, L. Does Patent Pledge Reduce Pollution and Carbon Emissions? Evidence from China. Environ. Res. 2024, 247, 118274. [Google Scholar] [CrossRef] [PubMed]
- Bureau of Statistics of China. New Momentum Is Growing Vigorously and the New Economy Is in the Ascendant—The Ninth in a Series of Reports on the Achievements of Economic and Social Development Since the 18th National Congress of the Communist Party of China. 2022. Available online: http://www.stats.gov.cn/xxgk/jd/sjjd2020/202209/t20220926_1888675.html (accessed on 26 September 2022).
- Jiang, Y.; Khan, H. The Relationship between Renewable Energy Consumption, Technological Innovations, and Carbon Dioxide Emission: Evidence from Two-Step System GMM. Environ. Sci. Pollut. Res. 2023, 30, 4187–4202. [Google Scholar] [CrossRef]
- Labanca, N.; Pereira, Â.G.; Watson, M.; Krieger, K.; Padovan, D.; Watts, L.; Moezzi, M.; Wallenborn, G.; Wright, R.; Laes, E.; et al. Transforming Innovation for Decarbonisation? Insights from Combining Complex Systems and Social Practice Perspectives. Energy Res. Soc. Sci. 2020, 65, 101452. [Google Scholar] [CrossRef]
- Astuti, A.R.A.; Wenten, I.G.; Ariono, D.; Sasongko, D.; Saputera, W.H.; Khoiruddin, K. Advances in Carbon Control Technologies for Flue Gas Cleaning. Sep. Purif. Rev. 2024, 53, 487–516. [Google Scholar] [CrossRef]
- Hazarika, N.; Zhang, X. Factors That Drive and Sustain Eco-Innovation in the Construction Industry: The Case of Hong Kong. J. Clean. Prod. 2019, 238, 117816. [Google Scholar] [CrossRef]
- Antunes, J.; Tan, Y.; Wanke, P.; Jabbour, C.J.C. Impact of R&D and Innovation in Chinese Road Transportation Sustainability Performance: A Novel Trigonometric Envelopment Analysis for Ideal Solutions (TEA-IS). Socio-Econ. Plan. Sci. 2023, 87, 101544. [Google Scholar] [CrossRef]
- Li, H.; Luo, N. Will improvements in transportation infrastructure help reduce urban carbon emissions?—Motor vehicles as transmission channels. Environ. Sci. Pollut. Res. 2022, 29, 38175–38185. [Google Scholar] [CrossRef]
- Atalay, A. Spatial Relationship of Air and Rail Transport to Transportation Carbon Dioxide Emissions. Proc. Inst. Civ. Eng.—Transp. 2019, 175, 150–155. [Google Scholar] [CrossRef]
- Galkin, A.; Sirina, N.; Zubkov, V. Integrated Transport Service Model as a Mechanism for Sustainable Economic Development. Transp. Res. Procedia 2022, 63, 2661–2669. [Google Scholar] [CrossRef]
- Acheampong, A.O.; Dzator, J.; Dzator, M.; Salim, R. Unveiling the Effect of Transport Infrastructure and Technological Innovation on Economic Growth, Energy Consumption and CO2 Emissions. Technol. Forecast. Soc. Chang. 2022, 182, 121843. [Google Scholar] [CrossRef]
- Ling, S.; Jin, S.; Wang, H.; Zhang, Z.; Feng, Y. Transportation Infrastructure Upgrading and Green Development Efficiency: Empirical Analysis with Double Machine Learning Method. J. Environ. Manag. 2024, 358, 120922. [Google Scholar] [CrossRef]
- Wang, X.; Xie, Z.; Zhang, X.; Huang, Y. Roads to Innovation: Firm-Level Evidence from People’s Republic of China (PRC). China Econ. Rev. 2018, 49, 154–170. [Google Scholar] [CrossRef]
- Li, Y.; Lin, H.; Jin, J. Decision-Making for Sustainable Urban Transportation: A Statistical Exploration of Innovative Mobility Solutions and Reduced Emissions. Sustain. Cities Soc. 2024, 102, 105219. [Google Scholar] [CrossRef]
- Awan, A.; Alnour, M.; Jahanger, A.; Onwe, J.C. Do Technological Innovation and Urbanization Mitigate Carbon Dioxide Emissions from the Transport Sector? Technol. Soc. 2022, 71, 102128. [Google Scholar] [CrossRef]
- Liu, X.; Yuan, S.; Yu, H.; Liu, Z. How Ecological Policy Stringency Moderates the Influence of Industrial Innovation on Environmental Sustainability: The Role of Renewable Energy Transition in BRICST Countries. Renew. Energy 2023, 207, 194–204. [Google Scholar] [CrossRef]
- Li, W.; Bao, L.; Li, Y.; Si, H.; Li, Y. Assessing the Transition to Low-Carbon Urban Transport: A Global Comparison. Resour. Conserv. Recycl. 2022, 180, 106179. [Google Scholar] [CrossRef]
- Xu, L.; Fan, M.; Yang, L.; Shao, S. Heterogeneous Green Innovations and Carbon Emission Performance: Evidence at China’s City Level. Energy Econ. 2021, 99, 105269. [Google Scholar] [CrossRef]
- Schumpeter, J.A. The Theory of Economic Development: An Inquiry into Profits, Capital, Credit, Interest, and the Business Cycle; Harvard University Press: Cambridge, MA, USA, 1949. [Google Scholar]
- Shahbaz, M.; Raghutla, C.; Song, M.; Zameer, H.; Jiao, Z. Public-Private Partnerships Investment in Energy as New Determinant of CO2 Emissions: The Role of Technological Innovations in China. Energy Econ. 2020, 86, 104664. [Google Scholar] [CrossRef]
- Adebayo, T.S.; Kirikkaleli, D. Impact of Renewable Energy Consumption, Globalization, and Technological Innovation on Environmental Degradation in Japan: Application of Wavelet Tools. Environ. Dev. Sustain. 2021, 23, 16057–16082. [Google Scholar] [CrossRef]
- Ostadzad, A.H. Innovation and Carbon Emissions: Fixed-Effects Panel Threshold Model Estimation for Renewable Energy. Renew. Energy 2022, 198, 602–617. [Google Scholar] [CrossRef]
- Chen, H.; Yi, J.; Chen, A.; Peng, D.; Yang, J. Green Technology Innovation and CO2 Emission in China: Evidence from a Spatial-Temporal Analysis and a Nonlinear Spatial Durbin Model. Energy Policy 2023, 172, 113338. [Google Scholar] [CrossRef]
- Rahman, M.M.; Alam, K.; Velayutham, E. Reduction of CO2 Emissions: The Role of Renewable Energy, Technological Innovation and Export Quality. Energy Reports 2022, 8, 2793–2805. [Google Scholar] [CrossRef]
- Khan, H.; Khan, I.; BiBi, R. The Role of Innovations and Renewable Energy Consumption in Reducing Environmental Degradation in OECD Countries: An Investigation for Innovation Claudia Curve. Environ. Sci. Pollut. Res. 2022, 29, 43800–43813. [Google Scholar] [CrossRef]
- Su, Z.-W.; Umar, M.; Kirikkaleli, D.; Adebayo, T.S. Role of Political Risk to Achieve Carbon Neutrality: Evidence from Brazil. J. Environ. Manag. 2021, 298, 113463. [Google Scholar] [CrossRef] [PubMed]
- Dauda, L.; Long, X.; Mensah, C.N.; Salman, M.; Boamah, K.B.; Ampon-Wireko, S.; Dogbe, C.S.K. Innovation, Trade Openness and CO2 Emissions in Selected Countries in Africa. J. Clean. Prod. 2021, 281, 125143. [Google Scholar] [CrossRef]
- Zhang, Z.; Chen, H. Dynamic Interaction of Renewable Energy Technological Innovation, Environmental Regulation Intensity and Carbon Pressure: Evidence from China. Renew. Energy 2022, 192, 420–430. [Google Scholar] [CrossRef]
- Raffiee, J.; Coff, R. Micro-Foundations of Firm-Specific Human Capital: When Do Employees Perceive Their Skills to Be Firm-Specific? Acad. Manag. J. 2016, 59, 766–790. [Google Scholar] [CrossRef]
- Zhao, X.; Ding, X.; Li, L. Research on Environmental Regulation, Technological Innovation and Green Transformation of Manufacturing Industry in the Yangtze River Economic Belt. Sustainability 2021, 13, 10005. [Google Scholar] [CrossRef]
- Herman, K.S.; Xiang, J. Environmental Regulatory Spillovers, Institutions, and Clean Technology Innovation: A Panel of 32 Countries over 16 Years. Energy Res. Soc. Sci. 2020, 62, 101363. [Google Scholar] [CrossRef]
- Li, S.; Liu, J.; Wu, J.; Hu, X. Spatial Spillover Effect of Carbon Emission Trading Policy on Carbon Emission Reduction: Empirical Data from Transport Industry in China. J. Clean. Prod. 2022, 371, 133529. [Google Scholar] [CrossRef]
- Park, J.; Jung, S. Exploring Urban Compactness and Greenhouse Gas Emissions in the Road Transport Sector: A Case Study of Big Cities in South Korea. Sustainability 2024, 16, 1911. [Google Scholar] [CrossRef]
- Awaworyi Churchill, S.; Inekwe, J.; Ivanovski, K.; Smyth, R. Transport Infrastructure and CO2 Emissions in the OECD over the Long Run. Transp. Res. Part D Transp. Environ. 2021, 95, 102857. [Google Scholar] [CrossRef]
- Umar, M.; Ji, X.; Kirikkaleli, D.; Xu, Q. COP21 Roadmap: Do Innovation, Financial Development, and Transportation Infrastructure Matter for Environmental Sustainability in China? J. Environ. Manag. 2020, 271, 111026. [Google Scholar] [CrossRef]
- Li, L.; Zhang, X. Integrated Optimization of Railway Freight Operation Planning and Pricing Based on Carbon Emission Reduction Policies. J. Clean. Prod. 2020, 263, 121316. [Google Scholar] [CrossRef]
- Xie, R.; Fang, J.; Liu, C. The effects of transportation infrastructure on urban carbon emissions. Appl. Energy 2017, 196, 199–207. [Google Scholar] [CrossRef]
- Dzator, J.; Acheampong, A.O.; Dzator, M. The Impact of Transport Infrastructure Development on Carbon Emissions in OECD Countries. In Environmental Sustainability and Economy; Elsevier: Amsterdam, The Netherlands, 2021; pp. 3–17. [Google Scholar] [CrossRef]
- Han, R.; Yu, B.Y.; Tang, B.J.; Liao, H.; Wei, Y.M. Carbon Emissions Quotas in the Chinese Road Transport Sector: A Carbon Trading Perspective. Energy Policy 2017, 106, 298–309. [Google Scholar] [CrossRef]
- Raux, C.; Croissant, Y.; Pons, D. Would Personal Carbon Trading Reduce Travel Emissions More Effectively than a Carbon Tax? Transp. Res. Part D Transp. Environ. 2015, 35, 72–83. [Google Scholar] [CrossRef]
- Olowogbon, T.S.; Fakayode, S.B.; Luke, A.O. Transportation and Economic Development: Advancing Technological Innovation and Sustainability in the Transportation Sector of a Developing Nation. In Innovation, Entrepreneurship and the Informal Economy in Sub–Saharan Africa: A Sustainable Development Agenda; Ibidunni, A.S., Ogundana, O.M., Olokundun, M.A., Eds.; Springer Nature Switzerland: Cham, Switzerland, 2024; pp. 197–216. [Google Scholar] [CrossRef]
- Wang, C.A.; Wu, J.; Liu, X. High-Speed Rail and Urban Innovation: Based on the Perspective of Labor Mobility. J. Asia Pac. Econ. 2024, 29, 837–862. [Google Scholar] [CrossRef]
- Agrawal, A.; Galasso, A.; Oettl, A. Roads and Innovation. Rev. Econ. Stat. 2017, 99, 417–434. [Google Scholar] [CrossRef]
- Yang, X.; Zhang, H.; Lin, S.; Zhang, J.; Zeng, J. Does High-Speed Railway Promote Regional Innovation Growth or Innovation Convergence? Technol. Soc. 2021, 64, 101472. [Google Scholar] [CrossRef]
- Dong, X.; Zheng, S.; Kahn, M.E. The Role of Transportation Speed in Facilitating High Skilled Teamwork across Cities. J. Urban Econ. 2020, 115, 103212. [Google Scholar] [CrossRef]
- Kraciuk, J.; Kacperska, E.; Łukasiewicz, K.; Pietrzak, P. Innovative Energy Technologies in Road Transport in Selected EU Countries. Energies 2022, 15, 6030. [Google Scholar] [CrossRef]
- Etukudoh, E.A.; Adefemi, A.; Ilojianya, V.I.; Umoh, A.A.; Ibekwe, K.I.; Nwokediegwu, Z.Q.S. A Review of sustainable transportation solutions: Innovations, challenges, and future directions. World J. Adv. Res. Rev. 2024, 21, 1440–1452. [Google Scholar] [CrossRef]
- Koukaki, T.; Tei, A. Innovation and Maritime Transport: A Systematic Review. Case Stud. Transp. Policy 2020, 8, 700–710. [Google Scholar] [CrossRef]
- Mouratidis, K.; Peters, S.; van Wee, B. Transportation Technologies, Sharing Economy, and Teleactivities: Implications for Built Environment and Travel. Transp. Res. Part D Transp. Environ. 2021, 92, 102716. [Google Scholar] [CrossRef]
- Jahanger, A.; Ozturk, I.; Onwe, J.C.; Ogwu, S.O.; Hossain, M.R.; Abdallah, A.A. Do Pro-Environmental Interventions Matter in Restoring Environmental Sustainability? Unveiling the Role of Environmental Tax, Green Innovation and Air Transport in G-7 Nations. Gondwana Res. 2024, 127, 165–181. [Google Scholar] [CrossRef]
- Bieser, J.C.T.; Vaddadi, B.; Kramers, A.; Höjer, M.; Hilty, L.M. Impacts of Telecommuting on Time Use and Travel: A Case Study of a Neighborhood Telecommuting Center in Stockholm. Travel. Behav. Soc. 2021, 23, 157–165. [Google Scholar] [CrossRef]
- Zhu, Y.; Wang, Z.; Zhu, L. Does Technological Innovation Improve Energy-Environmental Efficiency? New Evidence from China’s Transportation Sector. Environ. Sci. Pollut. Res. 2021, 28, 69042–69058. [Google Scholar] [CrossRef] [PubMed]
- Li, J.; Wang, P.; Ma, S. The Impact of Different Transportation Infrastructures on Urban Carbon Emissions: Evidence from China. Energy 2024, 295, 131041. [Google Scholar] [CrossRef]
- Wu, D.; Lin, J.C.; Oda, T.; Kort, E.A. Space-Based Quantification of per Capita CO2 Emissions from Cities. Environ. Res. Lett. 2020, 15, 035004. [Google Scholar] [CrossRef]
- Mishalani, R.G.; Goel, P.K.; Landgraf, A.J.; Westra, A.M.; Zhou, D. Passenger Travel CO2 Emissions in US Urbanized Areas: Multi-Sourced Data, Impacts of Influencing Factors, and Policy Implications. Transp. Policy 2014, 36, 231–241. [Google Scholar] [CrossRef]
- Wang, J.; Zou, D. Research on Regional Innovation Capability Based on Grey Relation Analysis. J. Phys. Conf. Ser. 2021, 2012, 012081. [Google Scholar] [CrossRef]
- Furman, J.L.; Stern, S. Climbing atop the shoulders of giants: The impact of institutions on cumulative research. Am. Econ. Rev. 2021, 111, 584–630. [Google Scholar]
- Ruiz-Ortega, M.J.; García-Villaverde, P.M.; De La Gala-Velásquez, B.; Hurtado-Palomino, A.; Arredondo-Salas, Á.Y. Innovation Capability and Pioneering Orientation in Peru’s Cultural Heritage Tourism Destinations: Conflicting Environmental Effects. J. Hosp. Tour. Manag. 2021, 48, 441–450. [Google Scholar] [CrossRef]
- Zhang, Y.; Zhang, Y.; Zhang, H.; Zhang, Y. Evaluation on New First-Tier Smart Cities in China Based on Entropy Method and TOPSIS. Ecol. Indic. 2022, 145, 109616. [Google Scholar] [CrossRef]
- Kirikkaleli, D.; Abbasi, K.R.; Oyebanji, M.O. The Asymmetric and Long-Run Effect of Environmental Innovation and CO2 Intensity of GDP on Consumption-Based CO2 Emissions in Denmark. Environ. Sci. Pollut. Res. 2023, 30, 50110–50124. [Google Scholar] [CrossRef]
- Xu, X.; Zeng, L.; Li, S.; Liu, Y.; Zhang, T. Dynamic Nonlinear CO2 Emission Effects of Urbanization Routes in the Eight Most Populous Countries. PLoS ONE 2024, 19, e0296997. [Google Scholar] [CrossRef]
- Vo, D.H.; Vo, A.T.; Ho, C.M. Urbanization and Renewable Energy Consumption in the Emerging ASEAN Markets: A Comparison between Short and Long-Run Effects. Heliyon 2024, 10, e30243. [Google Scholar] [CrossRef] [PubMed]
- Zhang, L.; Wang, Q.; Zhang, M. Environmental Regulation and CO2 Emissions: Based on Strategic Interaction of Environmental Governance. Ecol. Complex. 2021, 45, 100893. [Google Scholar] [CrossRef]
- Zhang, B.; Yin, J.; Jiang, H.; Qiu, Y. Spatial–Temporal Pattern Evolution and Influencing Factors of Coupled Coordination between Carbon Emission and Economic Development along the Pearl River Basin in China. Environ. Sci. Pollut. Res. 2023, 30, 6875–6890. [Google Scholar] [CrossRef]
- Liu, J.; Ma, H.; Wang, Q.; Tian, S.; Xu, Y.; Zhang, Y.; Yuan, X.; Ma, Q.; Xu, Y.; Yang, S. Optimization of Energy Consumption Structure Based on Carbon Emission Reduction Target: A Case Study in Shandong Province, China. Chin. J. Popul. Resour. Environ. 2022, 20, 125–135. [Google Scholar] [CrossRef]
- Usman, O.; Alola, A.A.; Akadiri, S.S. Effects of Domestic Material Consumption, Renewable Energy, and Financial Development on Environmental Sustainability in the EU-28: Evidence from a GMM Panel-VAR. Renew. Energy 2022, 184, 239–251. [Google Scholar] [CrossRef]
- Öztürk, S.; Han, V.; Özsolak, B. How Do Renewable Energy, Gross Capital Formation, and Natural Resource Rent Affect Economic Growth in G7 Countries? Evidence from the Novel GMM-PVAR Approach. Environ. Sci. Pollut. Res. 2023, 30, 78438–78448. [Google Scholar] [CrossRef]
- Wang, Y.; Xu, Y.; Chen, W. Study on the Relationship between Agricultural Credit, Fiscal Support, and Farmers’ Income—Empirical Analysis Based on the PVAR Model. Sustainability 2023, 15, 3173. [Google Scholar] [CrossRef]
- Ganda, F. The Interplay between Technological Innovation, Financial Development, Energy Consumption and Natural Resource Rents in the BRICS Economies: Evidence from GMM Panel VAR. Energy Strategy Rev. 2024, 51, 101267. [Google Scholar] [CrossRef]
- Dickey, D.A.; Fuller, W.A. Distribution of the Estimators for Autoregressive Time Series with a Unit Root. J. Am. Stat. Assoc. 1979, 74, 427–431. [Google Scholar] [CrossRef]
- Kumar, P.; Rani, P. The impact of renewable energy on carbon emissions in BRICS countries: A panel data approach with ADF and PMG methods. Renew. Energy 2022, 191, 1277–1289. [Google Scholar] [CrossRef]
- Santos, R.A.; Marques, A. Analyzing the impact of government spending on economic growth: Evidence from ADF tests and cointegration analysis. Econ. Lett. 2023, 234, 110415. [Google Scholar]
- Dutta, K.D.; Saha, M. Does Financial Development Cause Sustainable Development? A PVAR Approach. Econ. Chang. Restruct. 2022, 56, 879–917. [Google Scholar] [CrossRef]
- Dogan, E.; Chishti, M.Z.; Karimi Alavijeh, N.; Tzeremes, P. The Roles of Technology and Kyoto Protocol in Energy Transition towards COP26 Targets: Evidence from the Novel GMM-PVAR Approach for G-7 Countries. Technol. Forecast. Soc. Chang. 2022, 181, 121756. [Google Scholar] [CrossRef]
- Wang, L.; Zhao, Z.; Xue, X.; Wang, Y. Spillover Effects of Railway and Road on CO2 Emission in China: A Spatiotemporal Analysis. J. Clean. Prod. 2019, 234, 797–809. [Google Scholar] [CrossRef]
- Erdoğan, S.; Yıldırım, S.; Yıldırım, D.Ç.; Gedikli, A. The Effects of Innovation on Sectoral Carbon Emissions: Evidence from G20 Countries. J. Environ. Manag. 2020, 267, 110637. [Google Scholar] [CrossRef]
- Wang, Q.; Dong, Z. Technological Innovation and Renewable Energy Consumption: A Middle Path for Trading off Financial Risk and Carbon Emissions. Environ. Sci. Pollut. Res. 2022, 29, 33046–33062. [Google Scholar] [CrossRef]
Disclaimer/Publisher’s Note: The statements, opinions and data contained in all publications are solely those of the individual author(s) and contributor(s) and not of MDPI and/or the editor(s). MDPI and/or the editor(s) disclaim responsibility for any injury to people or property resulting from any ideas, methods, instructions or products referred to in the content. |
© 2024 by the authors. Licensee MDPI, Basel, Switzerland. This article is an open access article distributed under the terms and conditions of the Creative Commons Attribution (CC BY) license (https://creativecommons.org/licenses/by/4.0/).